Elberta, UT Map & Demographics
Elberta Map
Elberta Overview
$17,996
PER CAPITA INCOME
78.5%
WAGE / INCOME GAP [ % ]
21.5¢/ $1
WAGE / INCOME GAP [ $ ]
0.21
INEQUALITY / GINI INDEX
312
TOTAL POPULATION
99
MALE POPULATION
213
FEMALE POPULATION
46.48
MALES / 100 FEMALES
215.15
FEMALES / 100 MALES
30.0
MEDIAN AGE
4.9
AVG FAMILY SIZE
4.9
AVG HOUSEHOLD SIZE
128
LABOR FORCE [ PEOPLE ]
71.1%
PERCENT IN LABOR FORCE
Elberta Zip Codes
Elberta Area Codes
Income in Elberta
Income Overview in Elberta
| Characteristic | Number | Measure |
| Per Capita Income | 312 | $17,996 |
| Median Family Income | 64 | $0 |
| Mean Family Income | 64 | $105,367 |
| Median Household Income | 64 | $0 |
| Mean Household Income | 64 | $105,367 |
| Income Deficit | 64 | $0 |
| Wage / Income Gap (%) | 312 | 78.47% |
| Wage / Income Gap ($) | 312 | 21.53¢ per $1 |
| Gini / Inequality Index | 312 | 0.21 |
Earnings by Sex in Elberta
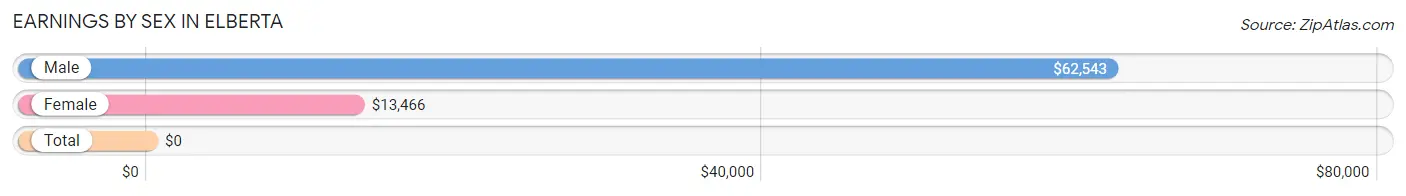
| Sex | Number | Average Earnings |
| Male | 71 (55.5%) | $62,543 |
| Female | 57 (44.5%) | $13,466 |
| Total | 128 (100.0%) | $0 |
Earnings by Sex by Income Bracket in Elberta
The most common earnings brackets in Elberta are $55,000 to $64,999 for men (29 | 40.8%) and $12,500 to $14,999 for women (22 | 38.6%).
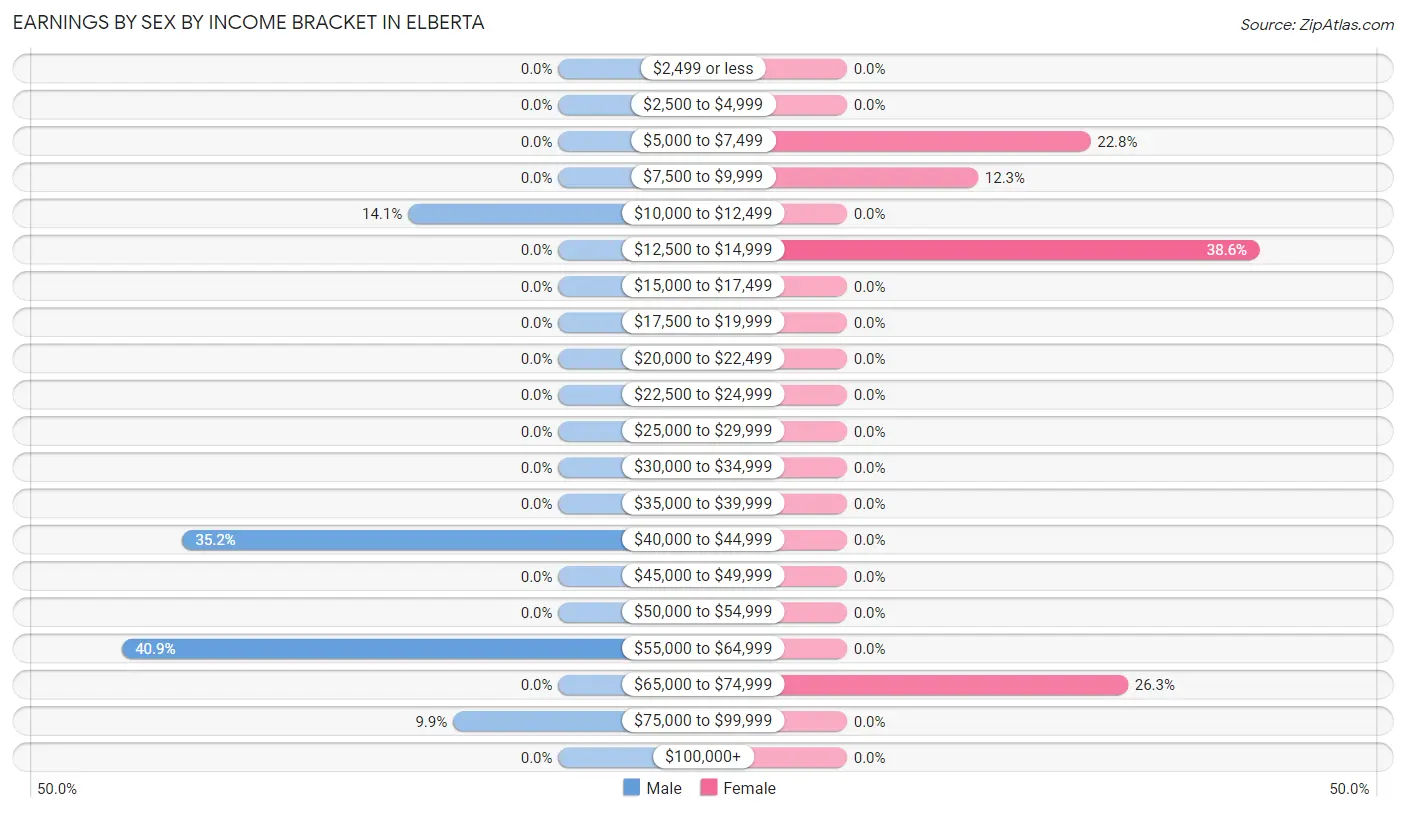
| Income | Male | Female |
| $2,499 or less | 0 (0.0%) | 0 (0.0%) |
| $2,500 to $4,999 | 0 (0.0%) | 0 (0.0%) |
| $5,000 to $7,499 | 0 (0.0%) | 13 (22.8%) |
| $7,500 to $9,999 | 0 (0.0%) | 7 (12.3%) |
| $10,000 to $12,499 | 10 (14.1%) | 0 (0.0%) |
| $12,500 to $14,999 | 0 (0.0%) | 22 (38.6%) |
| $15,000 to $17,499 | 0 (0.0%) | 0 (0.0%) |
| $17,500 to $19,999 | 0 (0.0%) | 0 (0.0%) |
| $20,000 to $22,499 | 0 (0.0%) | 0 (0.0%) |
| $22,500 to $24,999 | 0 (0.0%) | 0 (0.0%) |
| $25,000 to $29,999 | 0 (0.0%) | 0 (0.0%) |
| $30,000 to $34,999 | 0 (0.0%) | 0 (0.0%) |
| $35,000 to $39,999 | 0 (0.0%) | 0 (0.0%) |
| $40,000 to $44,999 | 25 (35.2%) | 0 (0.0%) |
| $45,000 to $49,999 | 0 (0.0%) | 0 (0.0%) |
| $50,000 to $54,999 | 0 (0.0%) | 0 (0.0%) |
| $55,000 to $64,999 | 29 (40.8%) | 0 (0.0%) |
| $65,000 to $74,999 | 0 (0.0%) | 15 (26.3%) |
| $75,000 to $99,999 | 7 (9.9%) | 0 (0.0%) |
| $100,000+ | 0 (0.0%) | 0 (0.0%) |
| Total | 71 (100.0%) | 57 (100.0%) |
Earnings by Sex by Educational Attainment in Elberta
Average earnings in Elberta are $62,543 for men and $14,205 for women, a difference of 77.3%. Men with an educational attainment of college or associate's degree enjoy the highest average annual earnings of $41,100, while those with college or associate's degree education earn the least with $41,100. Women with an educational attainment of college or associate's degree earn the most with the average annual earnings of $14,205, while those with college or associate's degree education have the smallest earnings of $14,205.
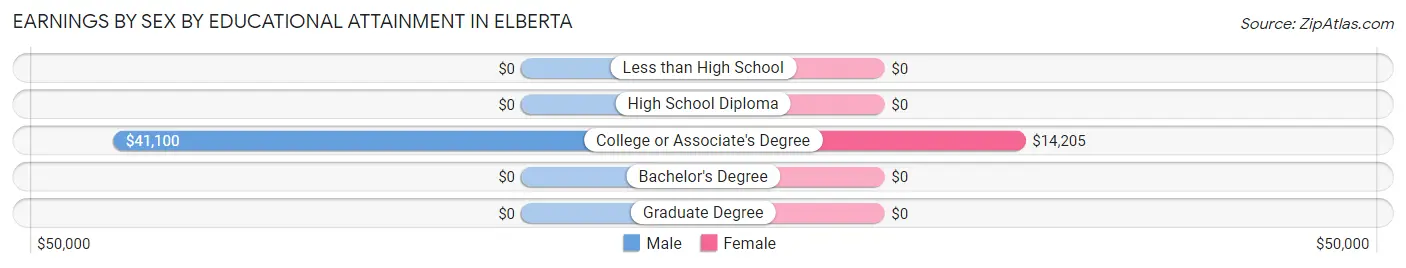
| Educational Attainment | Male Income | Female Income |
| Less than High School | - | - |
| High School Diploma | - | - |
| College or Associate's Degree | $41,100 | $14,205 |
| Bachelor's Degree | - | - |
| Graduate Degree | - | - |
| Total | $62,543 | $14,205 |
Family Income in Elberta
Family Income Brackets in Elberta
According to the Elberta family income data, there are 36 families falling into the $100,000 to $149,999 income range, which is the most common income bracket and makes up 56.2% of all families.
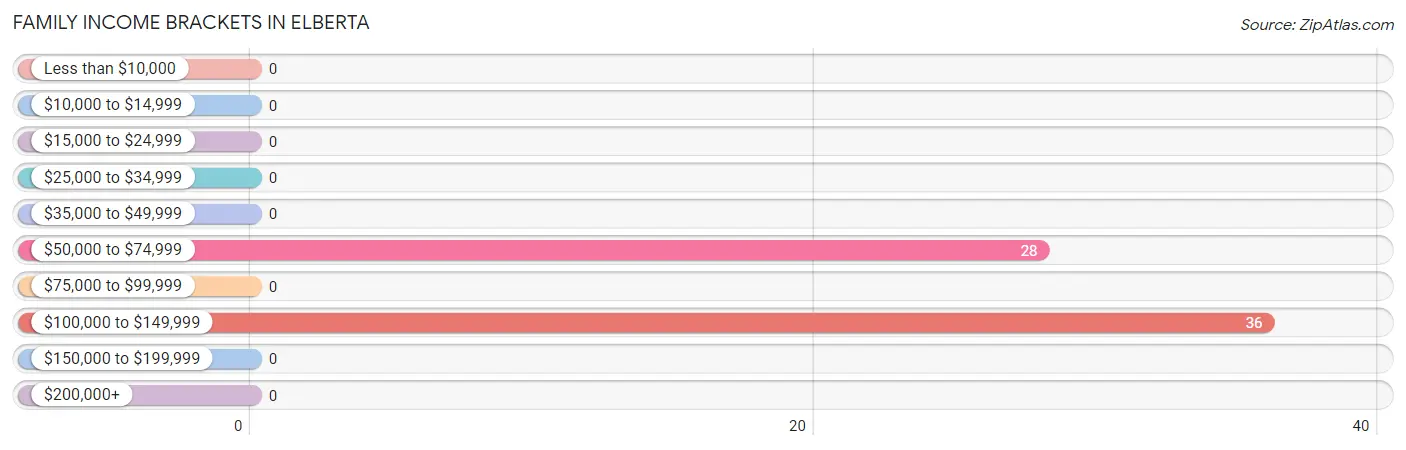
| Income Bracket | # Families | % Families |
| Less than $10,000 | 0 | 0.0% |
| $10,000 to $14,999 | 0 | 0.0% |
| $15,000 to $24,999 | 0 | 0.0% |
| $25,000 to $34,999 | 0 | 0.0% |
| $35,000 to $49,999 | 0 | 0.0% |
| $50,000 to $74,999 | 28 | 43.8% |
| $75,000 to $99,999 | 0 | 0.0% |
| $100,000 to $149,999 | 36 | 56.3% |
| $150,000 to $199,999 | 0 | 0.0% |
| $200,000+ | 0 | 0.0% |
Family Income by Famaliy Size in Elberta
| Income Bracket | # Families | Median Income |
| 2-Person Families | 0 (0.0%) | $0 |
| 3-Person Families | 0 (0.0%) | $0 |
| 4-Person Families | 36 (56.2%) | $0 |
| 5-Person Families | 0 (0.0%) | $0 |
| 6-Person Families | 0 (0.0%) | $0 |
| 7+ Person Families | 28 (43.8%) | $0 |
| Total | 64 (100.0%) | $0 |
Family Income by Number of Earners in Elberta
| Number of Earners | # Families | Median Income |
| No Earners | 0 (0.0%) | $0 |
| 1 Earner | 28 (43.8%) | $0 |
| 2 Earners | 0 (0.0%) | $0 |
| 3+ Earners | 36 (56.2%) | $0 |
| Total | 64 (100.0%) | $0 |
Household Income in Elberta
Household Income Brackets in Elberta
With 36 households falling in the category, the $100,000 to $149,999 income range is the most frequent in Elberta, accounting for 56.2% of all households.
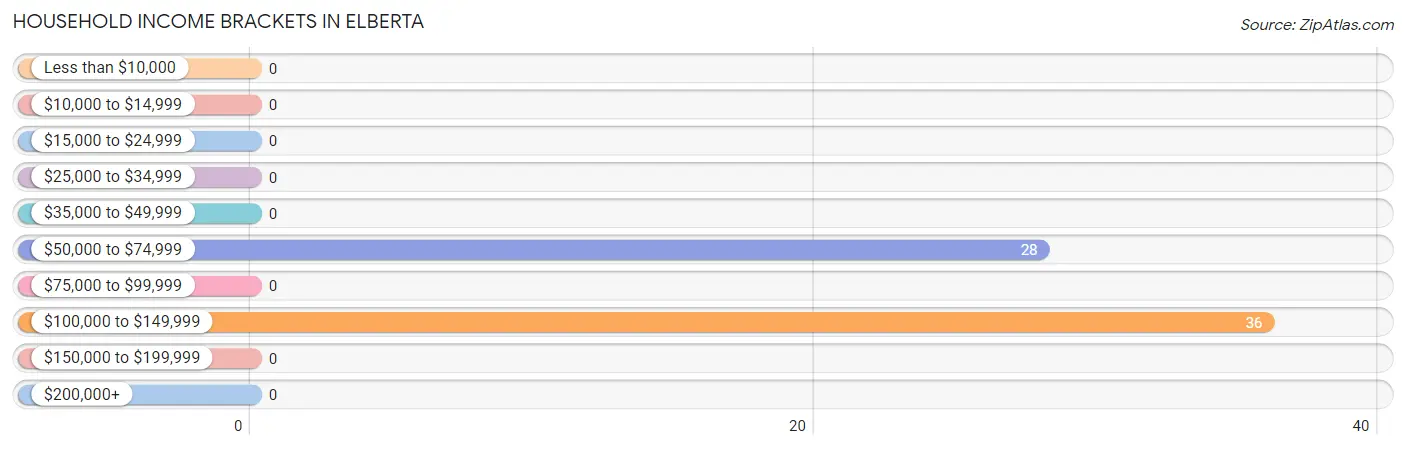
| Income Bracket | # Households | % Households |
| Less than $10,000 | 0 | 0.0% |
| $10,000 to $14,999 | 0 | 0.0% |
| $15,000 to $24,999 | 0 | 0.0% |
| $25,000 to $34,999 | 0 | 0.0% |
| $35,000 to $49,999 | 0 | 0.0% |
| $50,000 to $74,999 | 28 | 43.8% |
| $75,000 to $99,999 | 0 | 0.0% |
| $100,000 to $149,999 | 36 | 56.3% |
| $150,000 to $199,999 | 0 | 0.0% |
| $200,000+ | 0 | 0.0% |
Household Income by Householder Age in Elberta
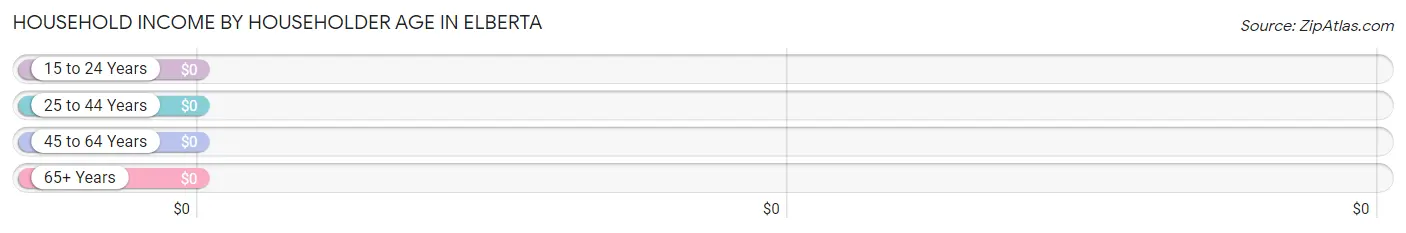
| Income Bracket | # Households | Median Income |
| 15 to 24 Years | 0 (0.0%) | $0 |
| 25 to 44 Years | 29 (45.3%) | $0 |
| 45 to 64 Years | 7 (10.9%) | $0 |
| 65+ Years | 28 (43.8%) | $0 |
| Total | 64 (100.0%) | $0 |
Poverty in Elberta
Income Below Poverty by Sex and Age in Elberta
| Age Bracket | Male | Female |
| Under 5 Years | 0 (0.0%) | 0 (0.0%) |
| 5 Years | 0 (0.0%) | 0 (0.0%) |
| 6 to 11 Years | 0 (0.0%) | 0 (0.0%) |
| 12 to 14 Years | 0 (0.0%) | 0 (0.0%) |
| 15 Years | 0 (0.0%) | 0 (0.0%) |
| 16 and 17 Years | 0 (0.0%) | 0 (0.0%) |
| 18 to 24 Years | 0 (0.0%) | 0 (0.0%) |
| 25 to 34 Years | 0 (0.0%) | 0 (0.0%) |
| 35 to 44 Years | 0 (0.0%) | 0 (0.0%) |
| 45 to 54 Years | 0 (0.0%) | 0 (0.0%) |
| 55 to 64 Years | 0 (0.0%) | 0 (0.0%) |
| 65 to 74 Years | 0 (0.0%) | 0 (0.0%) |
| 75 Years and over | 0 (0.0%) | 0 (0.0%) |
| Total | 0 (0.0%) | 0 (0.0%) |
Income Above Poverty by Sex and Age in Elberta
According to the poverty statistics in Elberta, males aged 6 to 11 years and females aged under 5 years are the age groups that are most secure financially, with 100.0% of males and 100.0% of females in these age groups living above the poverty line.
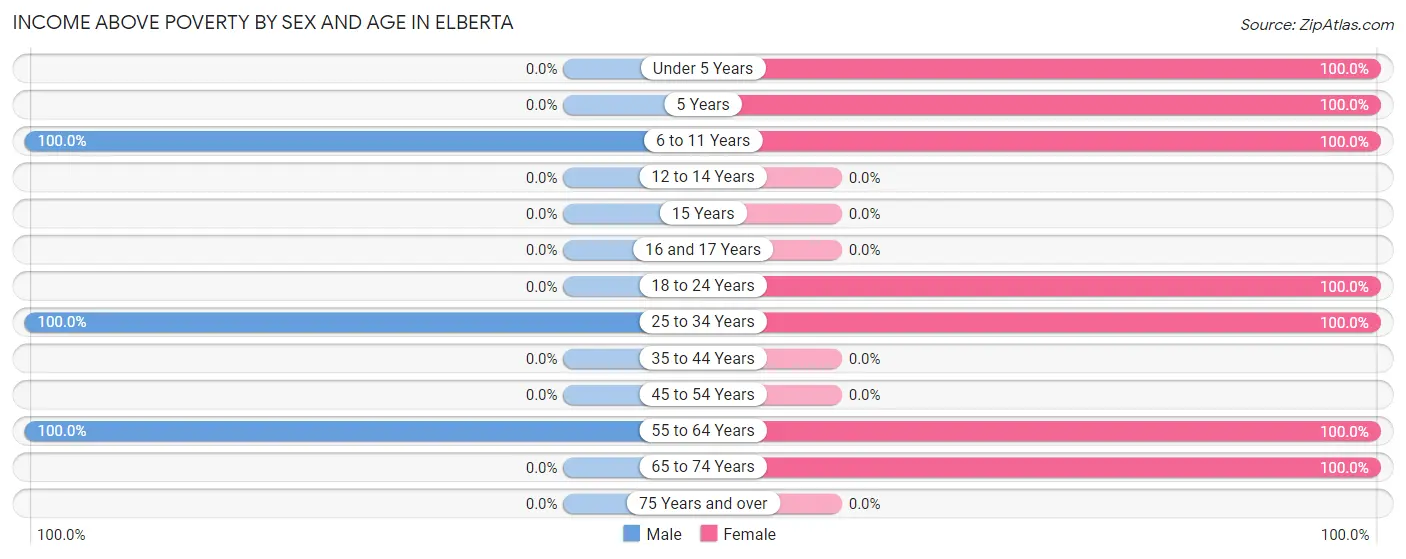
| Age Bracket | Male | Female |
| Under 5 Years | 0 (0.0%) | 54 (100.0%) |
| 5 Years | 0 (0.0%) | 28 (100.0%) |
| 6 to 11 Years | 28 (100.0%) | 22 (100.0%) |
| 12 to 14 Years | 0 (0.0%) | 0 (0.0%) |
| 15 Years | 0 (0.0%) | 0 (0.0%) |
| 16 and 17 Years | 0 (0.0%) | 0 (0.0%) |
| 18 to 24 Years | 0 (0.0%) | 13 (100.0%) |
| 25 to 34 Years | 64 (100.0%) | 46 (100.0%) |
| 35 to 44 Years | 0 (0.0%) | 0 (0.0%) |
| 45 to 54 Years | 0 (0.0%) | 0 (0.0%) |
| 55 to 64 Years | 7 (100.0%) | 22 (100.0%) |
| 65 to 74 Years | 0 (0.0%) | 28 (100.0%) |
| 75 Years and over | 0 (0.0%) | 0 (0.0%) |
| Total | 99 (100.0%) | 213 (100.0%) |
Income Below Poverty Among Married-Couple Families in Elberta
| Children | Above Poverty | Below Poverty |
| No Children | 7 (100.0%) | 0 (0.0%) |
| 1 or 2 Children | 29 (100.0%) | 0 (0.0%) |
| 3 or 4 Children | 0 (0.0%) | 0 (0.0%) |
| 5 or more Children | 0 (0.0%) | 0 (0.0%) |
| Total | 36 (100.0%) | 0 (0.0%) |
Income Below Poverty Among Single-Parent Households in Elberta
| Children | Single Father | Single Mother |
| No Children | 0 (0.0%) | 0 (0.0%) |
| 1 or 2 Children | 0 (0.0%) | 0 (0.0%) |
| 3 or 4 Children | 0 (0.0%) | 0 (0.0%) |
| 5 or more Children | 0 (0.0%) | 0 (0.0%) |
| Total | 0 (0.0%) | 0 (0.0%) |
Income Below Poverty Among Married-Couple vs Single-Parent Households in Elberta
| Children | Married-Couple Families | Single-Parent Households |
| No Children | 0 (0.0%) | 0 (0.0%) |
| 1 or 2 Children | 0 (0.0%) | 0 (0.0%) |
| 3 or 4 Children | 0 (0.0%) | 0 (0.0%) |
| 5 or more Children | 0 (0.0%) | 0 (0.0%) |
| Total | 0 (0.0%) | 0 (0.0%) |
Race in Elberta
The most populous races in Elberta are White / Caucasian (268 | 85.9%), Two or more Races (29 | 9.3%), and Some other Race (15 | 4.8%).
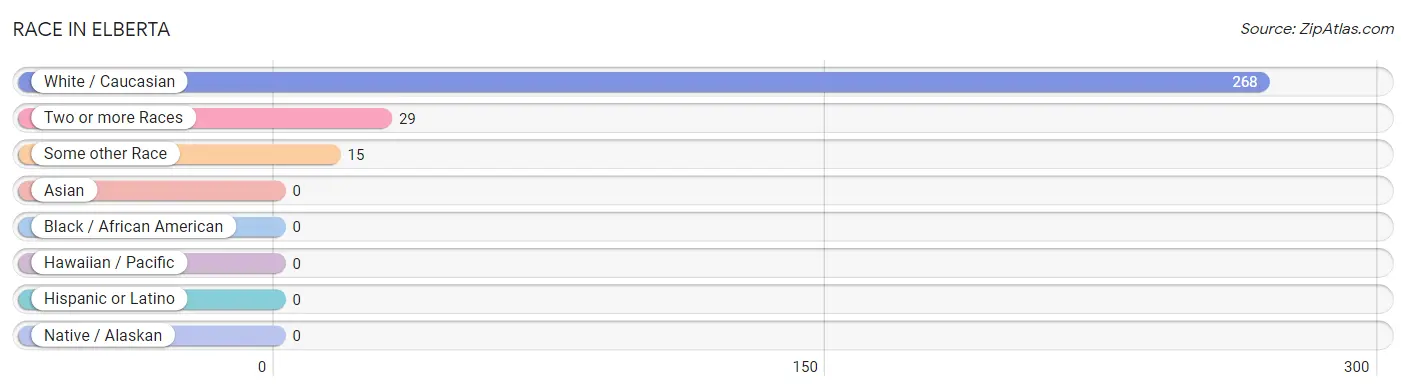
| Race | # Population | % Population |
| Asian | 0 | 0.0% |
| Black / African American | 0 | 0.0% |
| Hawaiian / Pacific | 0 | 0.0% |
| Hispanic or Latino | 0 | 0.0% |
| Native / Alaskan | 0 | 0.0% |
| White / Caucasian | 268 | 85.9% |
| Two or more Races | 29 | 9.3% |
| Some other Race | 15 | 4.8% |
| Total | 312 | 100.0% |
Ancestry in Elberta
The most populous ancestries reported in Elberta are English (224 | 71.8%), Scandinavian (135 | 43.3%), German (59 | 18.9%), European (29 | 9.3%), and Indian (Asian) (29 | 9.3%), together accounting for 152.5% of all Elberta residents.
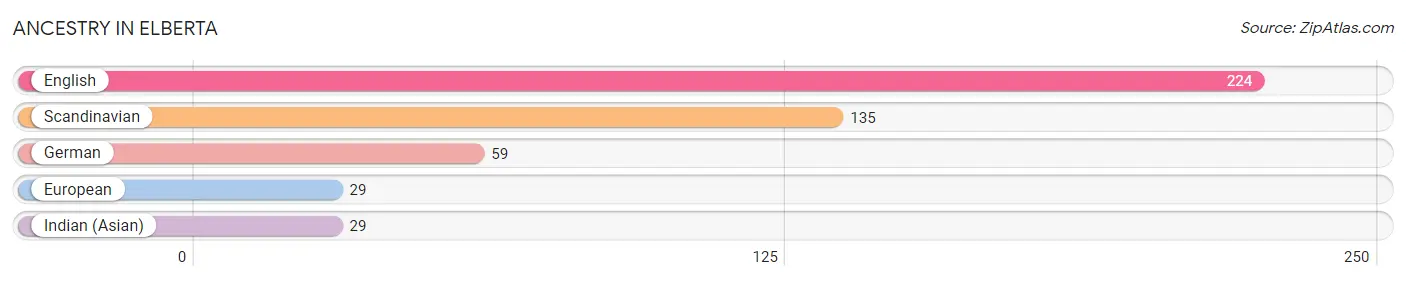
| Ancestry | # Population | % Population |
| English | 224 | 71.8% |
| European | 29 | 9.3% |
| German | 59 | 18.9% |
| Indian (Asian) | 29 | 9.3% |
| Scandinavian | 135 | 43.3% | View All 5 Rows |
Immigrants in Elberta

| Immigration Origin | # Population | % Population | View All 0 Rows |
Sex and Age in Elberta
Sex and Age in Elberta
The most populous age groups in Elberta are 30 to 34 Years (54 | 54.5%) for men and Under 5 Years (54 | 25.4%) for women.
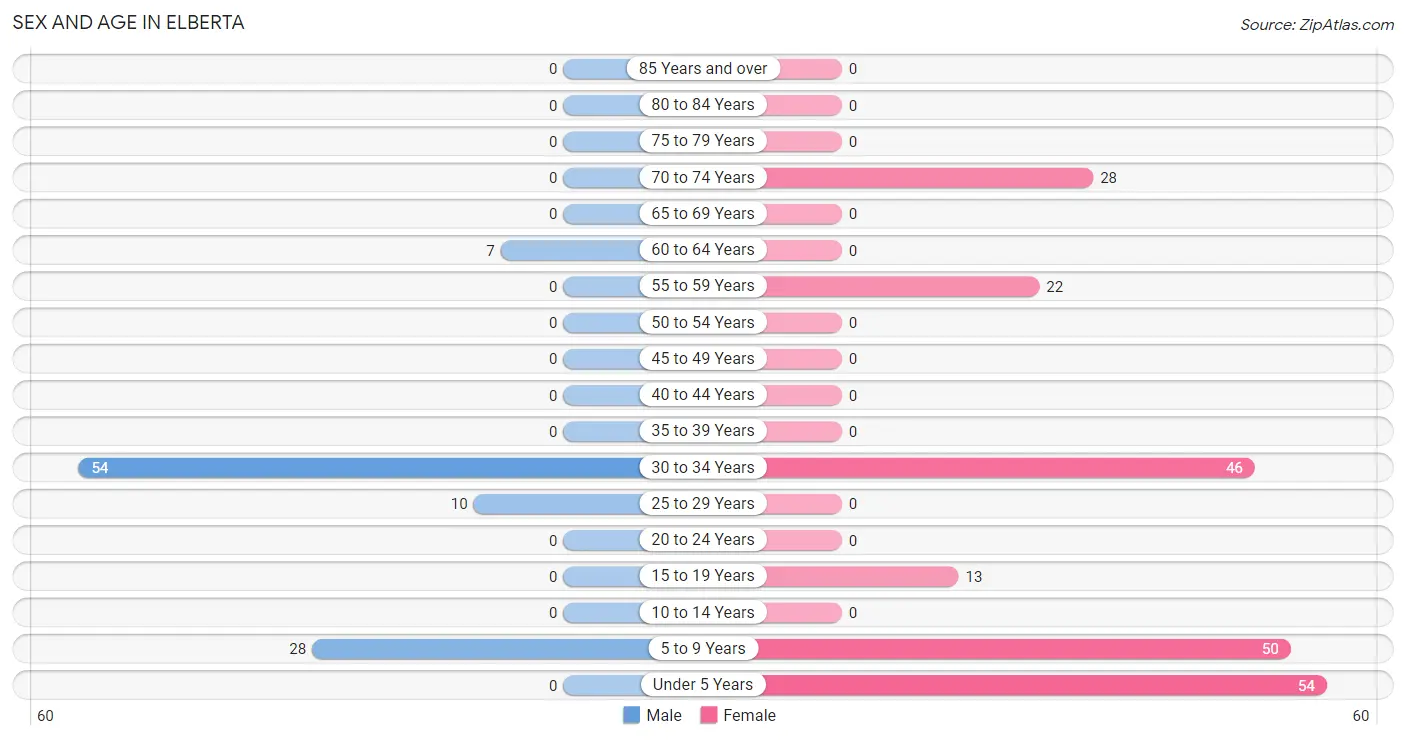
| Age Bracket | Male | Female |
| Under 5 Years | 0 (0.0%) | 54 (25.4%) |
| 5 to 9 Years | 28 (28.3%) | 50 (23.5%) |
| 10 to 14 Years | 0 (0.0%) | 0 (0.0%) |
| 15 to 19 Years | 0 (0.0%) | 13 (6.1%) |
| 20 to 24 Years | 0 (0.0%) | 0 (0.0%) |
| 25 to 29 Years | 10 (10.1%) | 0 (0.0%) |
| 30 to 34 Years | 54 (54.5%) | 46 (21.6%) |
| 35 to 39 Years | 0 (0.0%) | 0 (0.0%) |
| 40 to 44 Years | 0 (0.0%) | 0 (0.0%) |
| 45 to 49 Years | 0 (0.0%) | 0 (0.0%) |
| 50 to 54 Years | 0 (0.0%) | 0 (0.0%) |
| 55 to 59 Years | 0 (0.0%) | 22 (10.3%) |
| 60 to 64 Years | 7 (7.1%) | 0 (0.0%) |
| 65 to 69 Years | 0 (0.0%) | 0 (0.0%) |
| 70 to 74 Years | 0 (0.0%) | 28 (13.2%) |
| 75 to 79 Years | 0 (0.0%) | 0 (0.0%) |
| 80 to 84 Years | 0 (0.0%) | 0 (0.0%) |
| 85 Years and over | 0 (0.0%) | 0 (0.0%) |
| Total | 99 (100.0%) | 213 (100.0%) |
Families and Households in Elberta
Median Family Size in Elberta
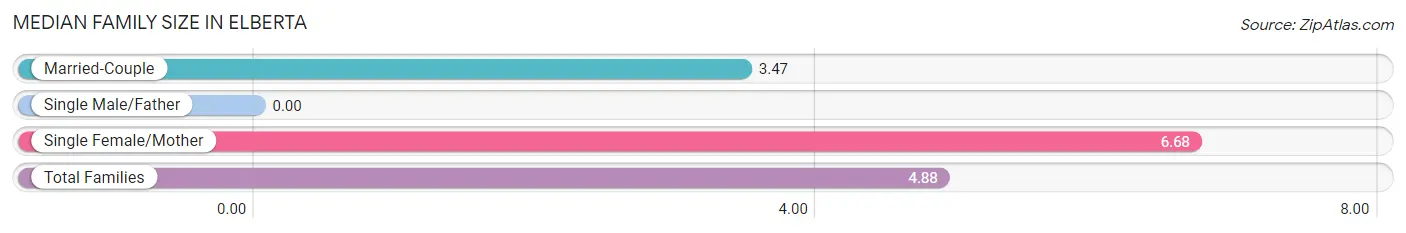
| Family Type | # Families | Family Size |
| Married-Couple | 36 (56.2%) | 3.47 |
| Single Male/Father | 0 (0.0%) | - |
| Single Female/Mother | 28 (43.8%) | 6.68 |
| Total Families | 64 (100.0%) | 4.88 |
Median Household Size in Elberta
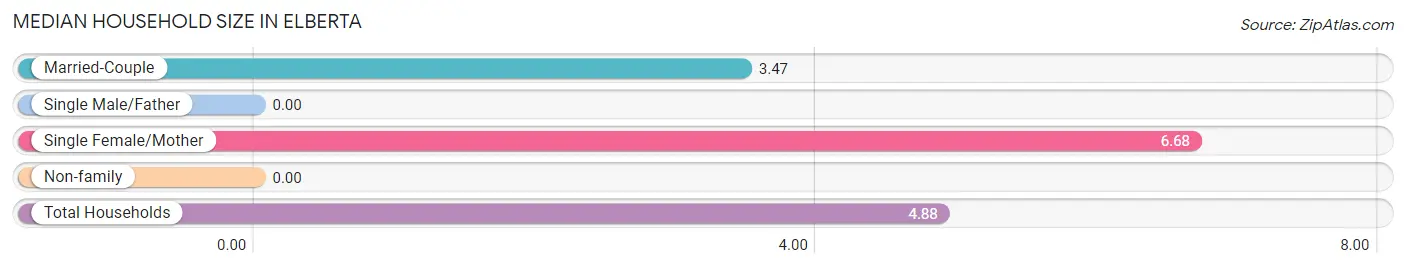
| Household Type | # Households | Household Size |
| Married-Couple | 36 (56.2%) | 3.47 |
| Single Male/Father | 0 (0.0%) | - |
| Single Female/Mother | 28 (43.8%) | 6.68 |
| Non-family | 0 (0.0%) | - |
| Total Households | 64 (100.0%) | 4.88 |
Household Size by Marriage Status in Elberta
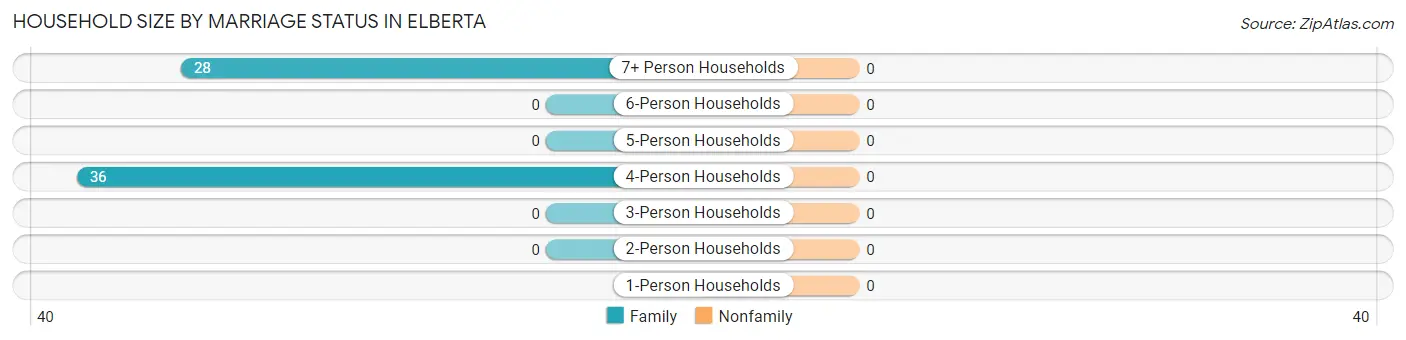
| Household Size | Family Households | Nonfamily Households |
| 1-Person Households | - | 0 (0.0%) |
| 2-Person Households | 0 (0.0%) | 0 (0.0%) |
| 3-Person Households | 0 (0.0%) | 0 (0.0%) |
| 4-Person Households | 36 (56.2%) | 0 (0.0%) |
| 5-Person Households | 0 (0.0%) | 0 (0.0%) |
| 6-Person Households | 0 (0.0%) | 0 (0.0%) |
| 7+ Person Households | 28 (43.8%) | 0 (0.0%) |
| Total | 64 (100.0%) | 0 (0.0%) |
Female Fertility in Elberta
Fertility by Age in Elberta
Average fertility rate in Elberta is 407.0 births per 1,000 women. Women in the age bracket of 20 to 34 years have the highest fertility rate with 522.0 births per 1,000 women. Women in the age bracket of 20 to 34 years acount for 100.0% of all women with births.
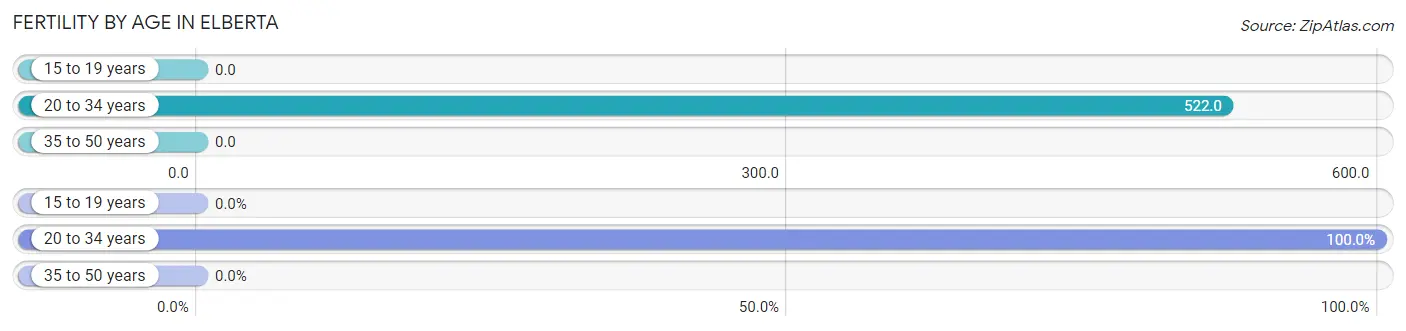
| Age Bracket | Women with Births | Births / 1,000 Women |
| 15 to 19 years | 0 (0.0%) | 0.0 |
| 20 to 34 years | 24 (100.0%) | 522.0 |
| 35 to 50 years | 0 (0.0%) | 0.0 |
| Total | 24 (100.0%) | 407.0 |
Fertility by Age by Marriage Status in Elberta
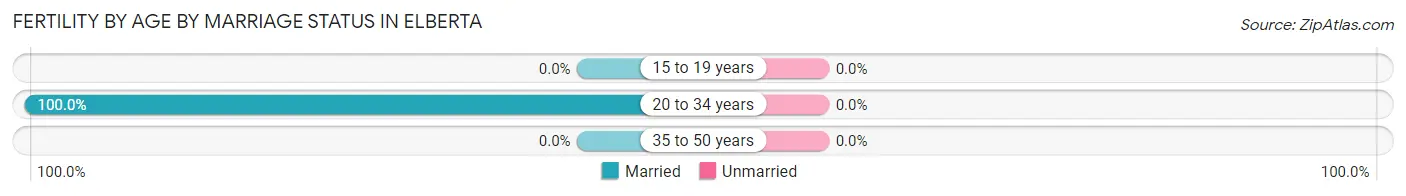
| Age Bracket | Married | Unmarried |
| 15 to 19 years | 0 (0.0%) | 0 (0.0%) |
| 20 to 34 years | 24 (100.0%) | 0 (0.0%) |
| 35 to 50 years | 0 (0.0%) | 0 (0.0%) |
| Total | 24 (100.0%) | 0 (0.0%) |
Fertility by Education in Elberta
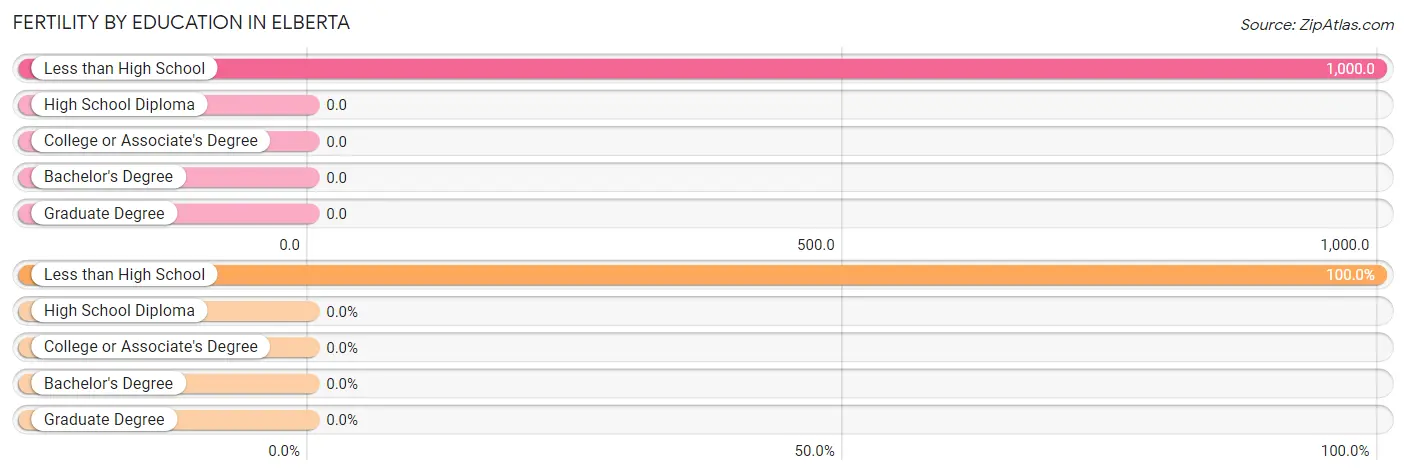
| Educational Attainment | Women with Births | Births / 1,000 Women |
| Less than High School | 24 (100.0%) | 1,000.0 |
| High School Diploma | 0 (0.0%) | 0.0 |
| College or Associate's Degree | 0 (0.0%) | 0.0 |
| Bachelor's Degree | 0 (0.0%) | 0.0 |
| Graduate Degree | 0 (0.0%) | 0.0 |
| Total | 24 (100.0%) | 407.0 |
Fertility by Education by Marriage Status in Elberta
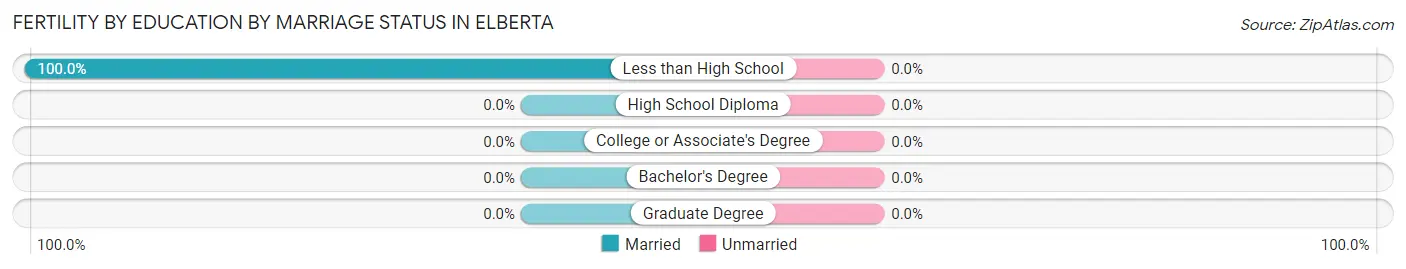
| Educational Attainment | Married | Unmarried |
| Less than High School | 24 (100.0%) | 0 (0.0%) |
| High School Diploma | 0 (0.0%) | 0 (0.0%) |
| College or Associate's Degree | 0 (0.0%) | 0 (0.0%) |
| Bachelor's Degree | 0 (0.0%) | 0 (0.0%) |
| Graduate Degree | 0 (0.0%) | 0 (0.0%) |
| Total | 24 (100.0%) | 0 (0.0%) |
Employment Characteristics in Elberta
Employment by Class of Employer in Elberta
Among the 113 employed individuals in Elberta, private company employees (52 | 46.0%), local government employees (36 | 31.9%), and self-employed (incorporated) (25 | 22.1%) make up the most common classes of employment.
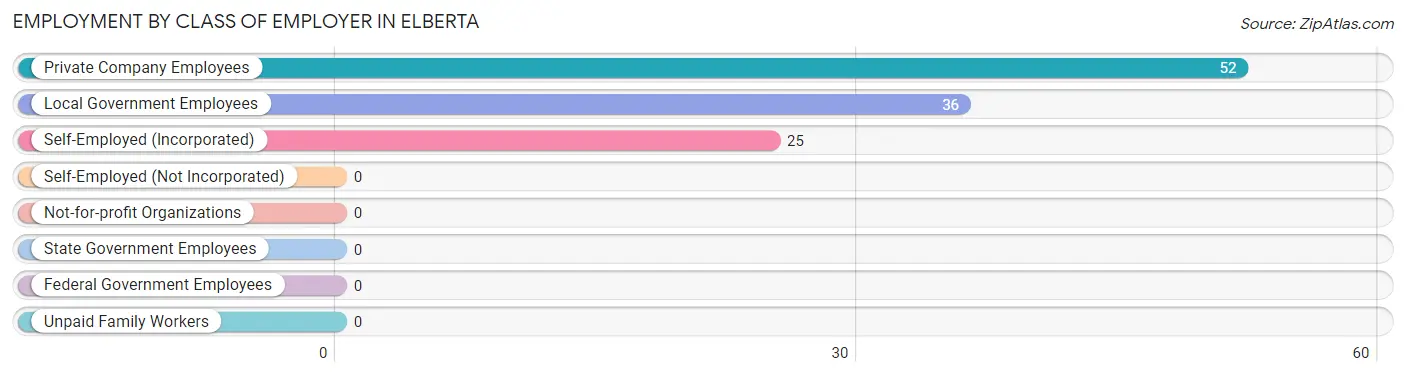
| Employer Class | # Employees | % Employees |
| Private Company Employees | 52 | 46.0% |
| Self-Employed (Incorporated) | 25 | 22.1% |
| Self-Employed (Not Incorporated) | 0 | 0.0% |
| Not-for-profit Organizations | 0 | 0.0% |
| Local Government Employees | 36 | 31.9% |
| State Government Employees | 0 | 0.0% |
| Federal Government Employees | 0 | 0.0% |
| Unpaid Family Workers | 0 | 0.0% |
| Total | 113 | 100.0% |
Employment Status by Age in Elberta
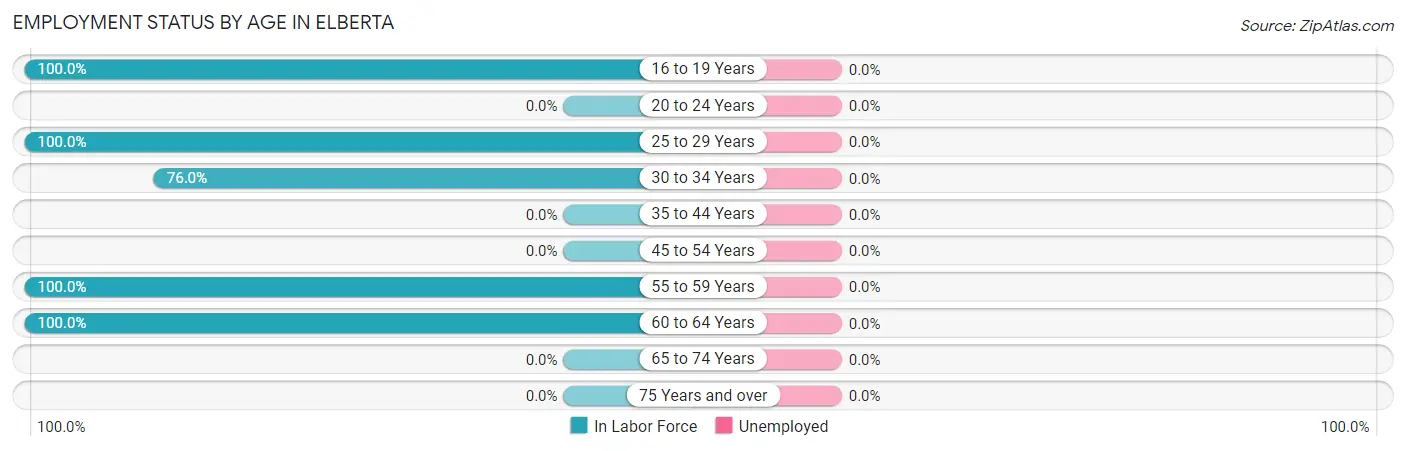
| Age Bracket | In Labor Force | Unemployed |
| 16 to 19 Years | 13 (100.0%) | 0 (0.0%) |
| 20 to 24 Years | 0 (0.0%) | 0 (0.0%) |
| 25 to 29 Years | 10 (100.0%) | 0 (0.0%) |
| 30 to 34 Years | 76 (76.0%) | 0 (0.0%) |
| 35 to 44 Years | 0 (0.0%) | 0 (0.0%) |
| 45 to 54 Years | 0 (0.0%) | 0 (0.0%) |
| 55 to 59 Years | 22 (100.0%) | 0 (0.0%) |
| 60 to 64 Years | 7 (100.0%) | 0 (0.0%) |
| 65 to 74 Years | 0 (0.0%) | 0 (0.0%) |
| 75 Years and over | 0 (0.0%) | 0 (0.0%) |
| Total | 128 (71.1%) | 0 (0.0%) |
Employment Status by Educational Attainment in Elberta
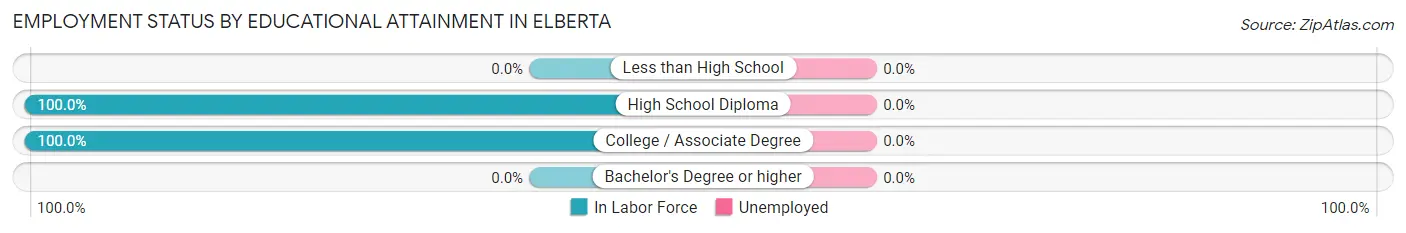
| Educational Attainment | In Labor Force | Unemployed |
| Less than High School | 0 (0.0%) | 0 (0.0%) |
| High School Diploma | 29 (100.0%) | 0 (0.0%) |
| College / Associate Degree | 86 (100.0%) | 0 (0.0%) |
| Bachelor's Degree or higher | 0 (0.0%) | 0 (0.0%) |
| Total | 115 (82.7%) | 0 (0.0%) |
Employment Occupations by Sex in Elberta
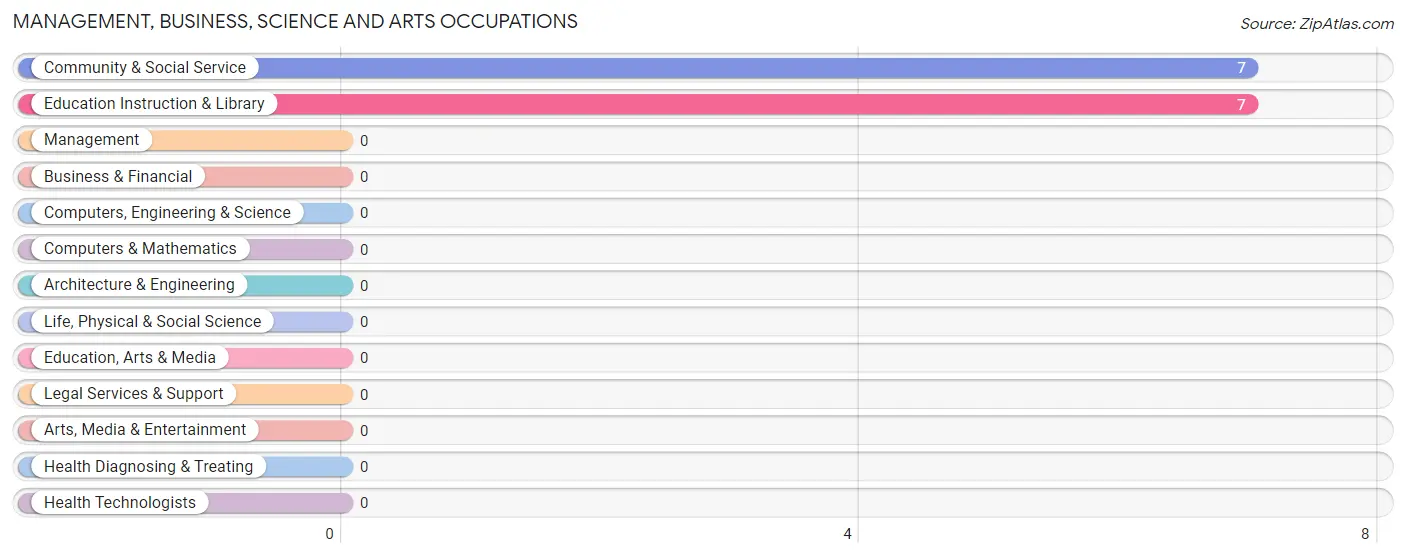
Management, Business, Science and Arts Occupations
The most common Management, Business, Science and Arts occupations in Elberta are Community & Social Service (7 | 5.5%), and Education Instruction & Library (7 | 5.5%).
Management, Business, Science and Arts Occupations by Sex
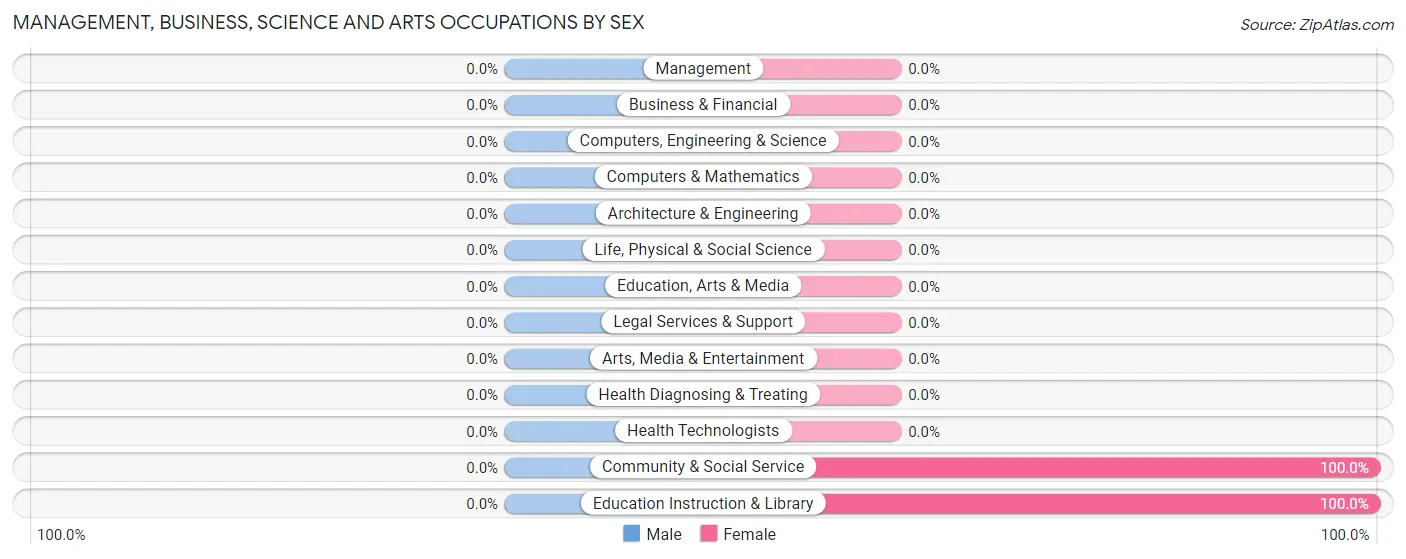
| Occupation | Male | Female |
| Management | 0 (0.0%) | 0 (0.0%) |
| Business & Financial | 0 (0.0%) | 0 (0.0%) |
| Computers, Engineering & Science | 0 (0.0%) | 0 (0.0%) |
| Computers & Mathematics | 0 (0.0%) | 0 (0.0%) |
| Architecture & Engineering | 0 (0.0%) | 0 (0.0%) |
| Life, Physical & Social Science | 0 (0.0%) | 0 (0.0%) |
| Community & Social Service | 0 (0.0%) | 7 (100.0%) |
| Education, Arts & Media | 0 (0.0%) | 0 (0.0%) |
| Legal Services & Support | 0 (0.0%) | 0 (0.0%) |
| Education Instruction & Library | 0 (0.0%) | 7 (100.0%) |
| Arts, Media & Entertainment | 0 (0.0%) | 0 (0.0%) |
| Health Diagnosing & Treating | 0 (0.0%) | 0 (0.0%) |
| Health Technologists | 0 (0.0%) | 0 (0.0%) |
| Total (Category) | 0 (0.0%) | 7 (100.0%) |
| Total (Overall) | 71 (55.5%) | 57 (44.5%) |
Services Occupations
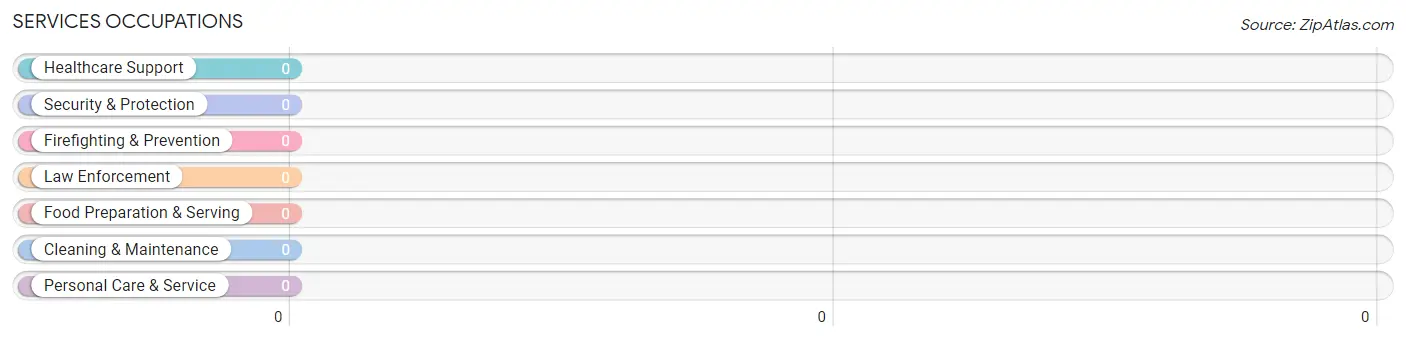
Services Occupations by Sex
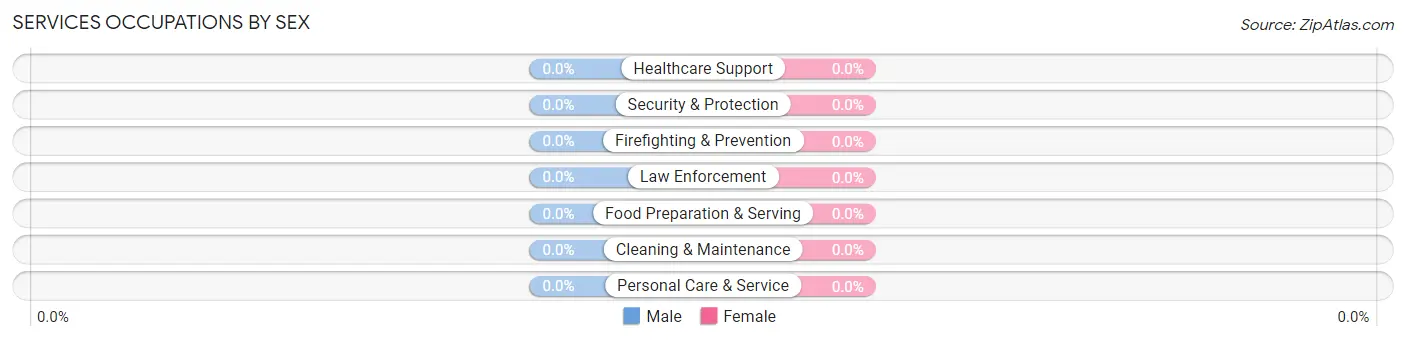
| Occupation | Male | Female |
| Healthcare Support | 0 (0.0%) | 0 (0.0%) |
| Security & Protection | 0 (0.0%) | 0 (0.0%) |
| Firefighting & Prevention | 0 (0.0%) | 0 (0.0%) |
| Law Enforcement | 0 (0.0%) | 0 (0.0%) |
| Food Preparation & Serving | 0 (0.0%) | 0 (0.0%) |
| Cleaning & Maintenance | 0 (0.0%) | 0 (0.0%) |
| Personal Care & Service | 0 (0.0%) | 0 (0.0%) |
| Total (Category) | 0 (0.0%) | 0 (0.0%) |
| Total (Overall) | 71 (55.5%) | 57 (44.5%) |
Sales and Office Occupations
The most common Sales and Office occupations in Elberta are , and Office & Administration (60 | 46.9%).
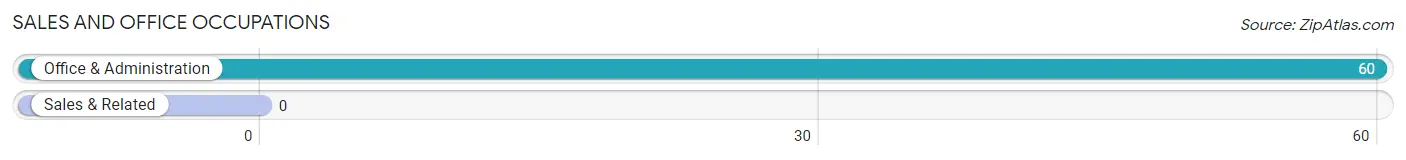
Sales and Office Occupations by Sex
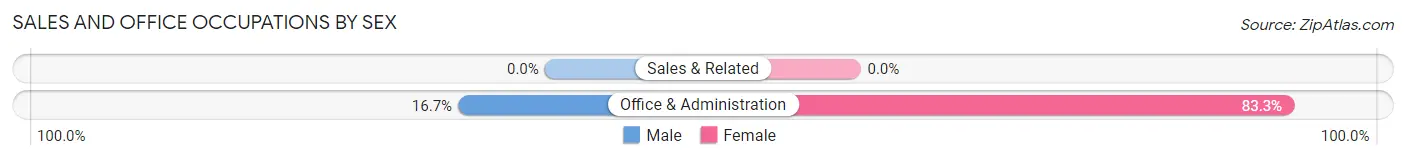
| Occupation | Male | Female |
| Sales & Related | 0 (0.0%) | 0 (0.0%) |
| Office & Administration | 10 (16.7%) | 50 (83.3%) |
| Total (Category) | 10 (16.7%) | 50 (83.3%) |
| Total (Overall) | 71 (55.5%) | 57 (44.5%) |
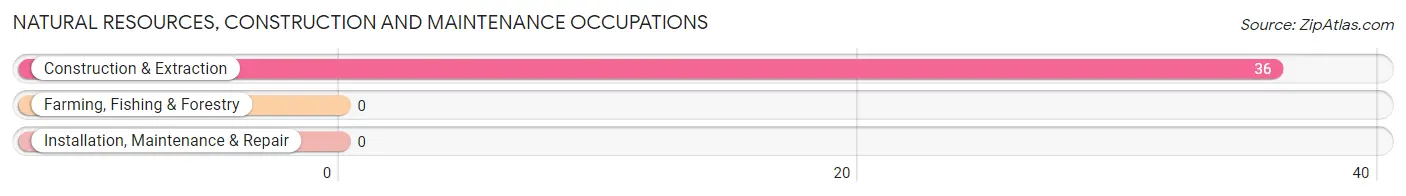
Natural Resources, Construction and Maintenance Occupations
The most common Natural Resources, Construction and Maintenance occupations in Elberta are , and Construction & Extraction (36 | 28.1%).
Natural Resources, Construction and Maintenance Occupations by Sex
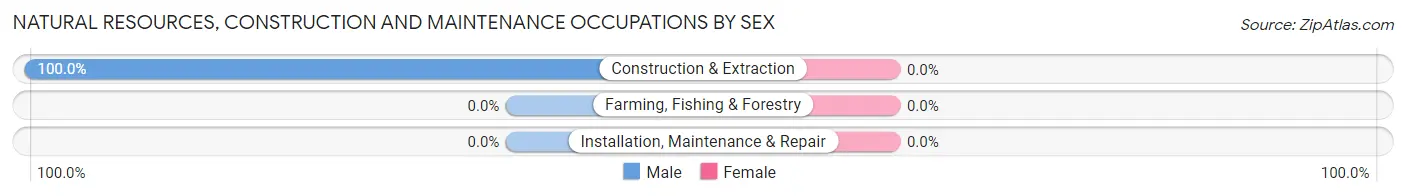
| Occupation | Male | Female |
| Farming, Fishing & Forestry | 0 (0.0%) | 0 (0.0%) |
| Construction & Extraction | 36 (100.0%) | 0 (0.0%) |
| Installation, Maintenance & Repair | 0 (0.0%) | 0 (0.0%) |
| Total (Category) | 36 (100.0%) | 0 (0.0%) |
| Total (Overall) | 71 (55.5%) | 57 (44.5%) |
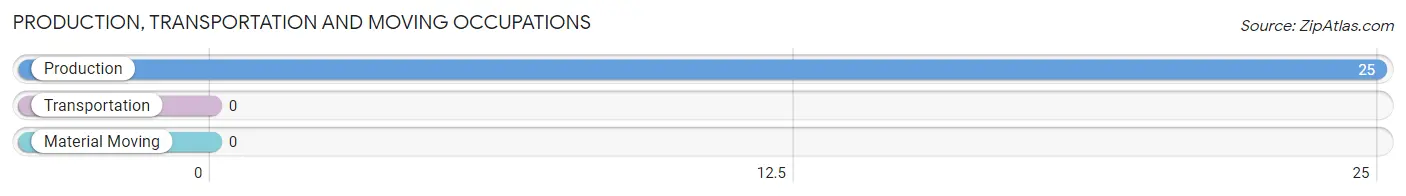
Production, Transportation and Moving Occupations
The most common Production, Transportation and Moving occupations in Elberta are , and Production (25 | 19.5%).
Production, Transportation and Moving Occupations by Sex
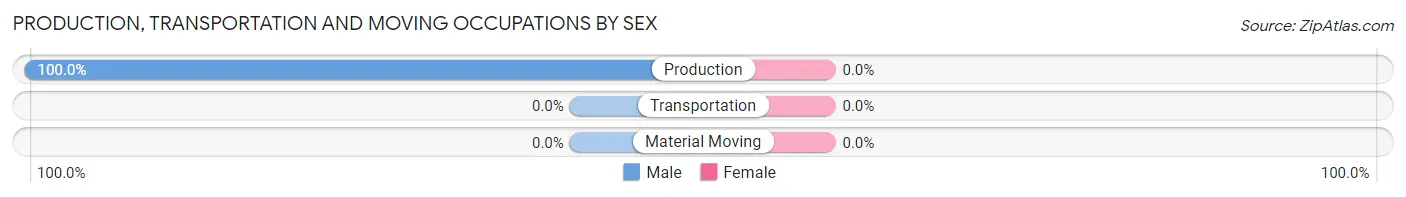
| Occupation | Male | Female |
| Production | 25 (100.0%) | 0 (0.0%) |
| Transportation | 0 (0.0%) | 0 (0.0%) |
| Material Moving | 0 (0.0%) | 0 (0.0%) |
| Total (Category) | 25 (100.0%) | 0 (0.0%) |
| Total (Overall) | 71 (55.5%) | 57 (44.5%) |
Employment Industries by Sex in Elberta
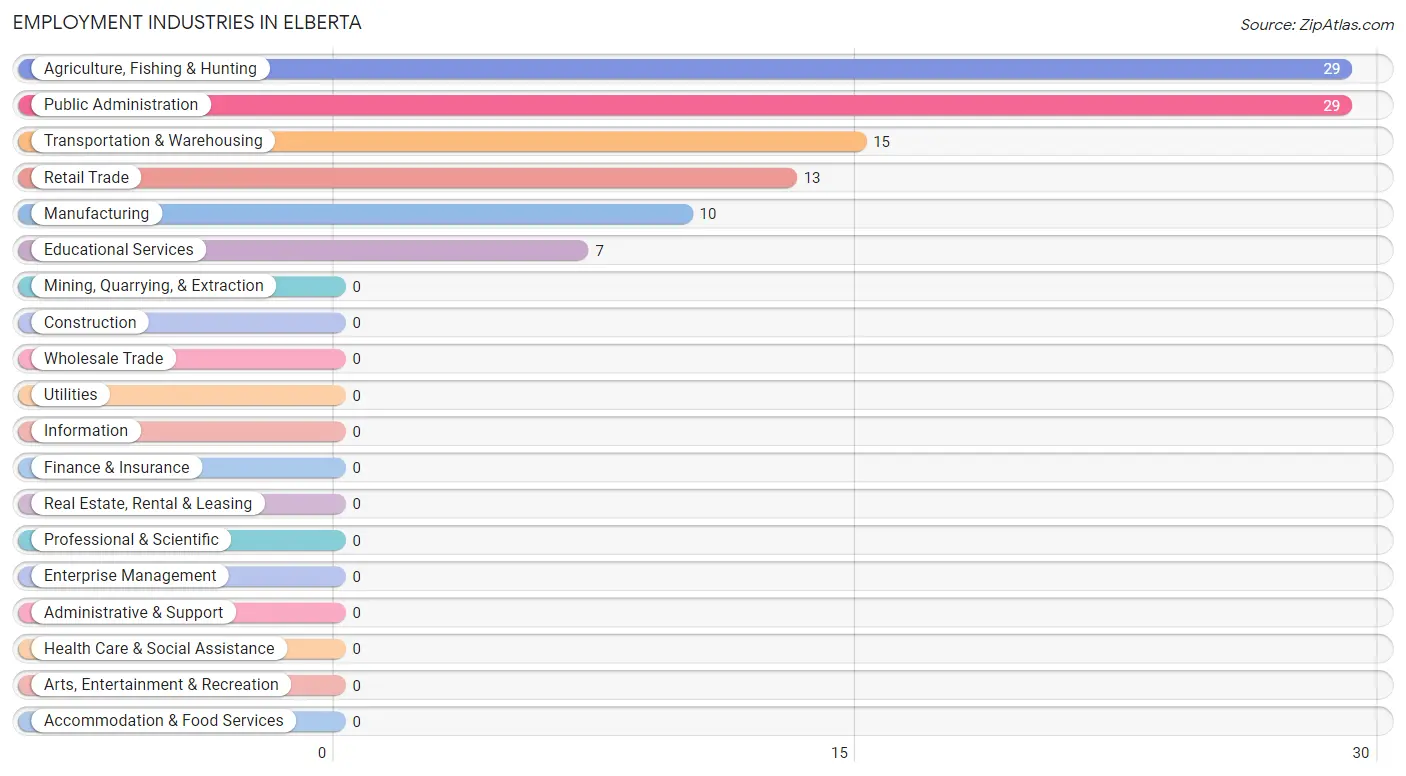
Employment Industries in Elberta
The major employment industries in Elberta include Agriculture, Fishing & Hunting (29 | 22.7%), Public Administration (29 | 22.7%), Transportation & Warehousing (15 | 11.7%), Retail Trade (13 | 10.2%), and Manufacturing (10 | 7.8%).
Employment Industries by Sex in Elberta
The Elberta industries that see more men than women are Manufacturing (100.0%), Public Administration (100.0%), and Agriculture, Fishing & Hunting (24.1%), whereas the industries that tend to have a higher number of women are Retail Trade (100.0%), Transportation & Warehousing (100.0%), and Educational Services (100.0%).
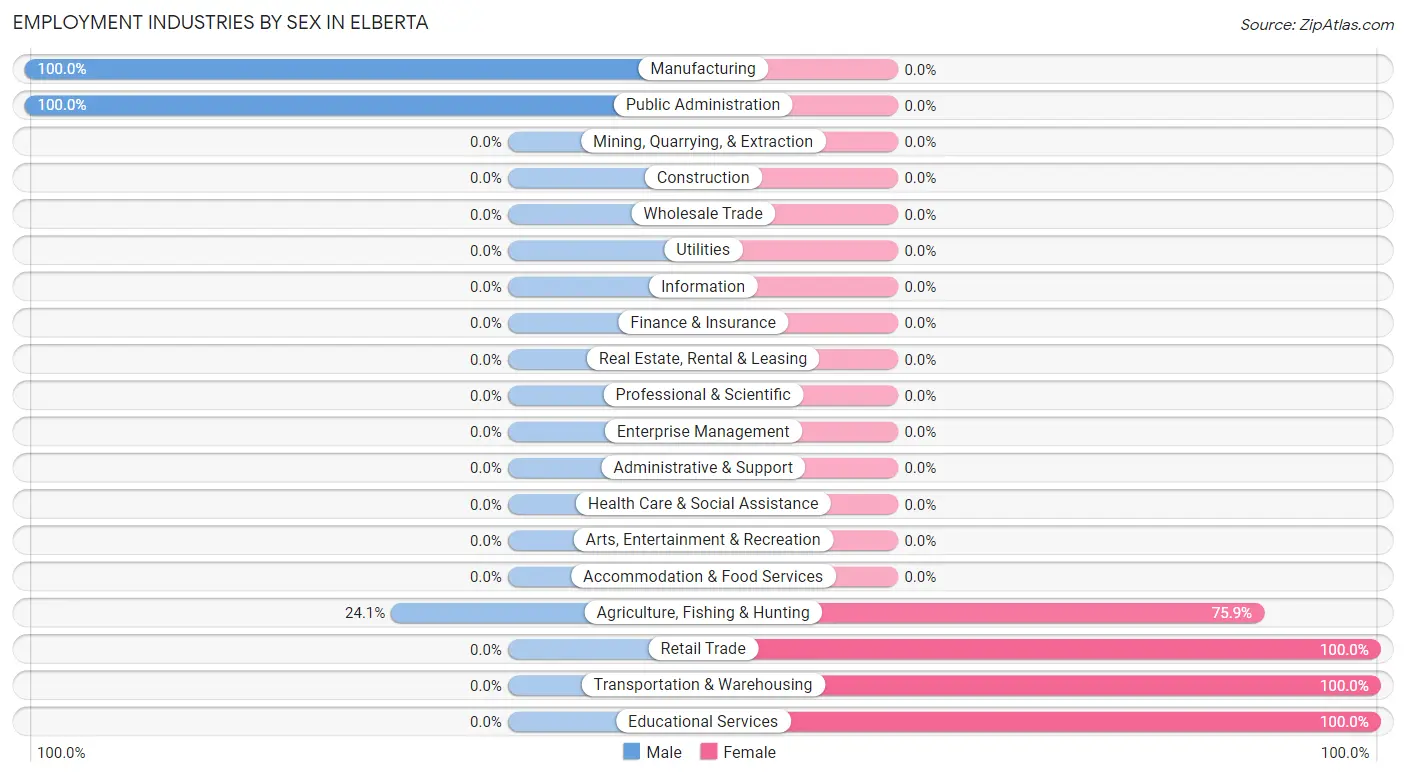
| Industry | Male | Female |
| Agriculture, Fishing & Hunting | 7 (24.1%) | 22 (75.9%) |
| Mining, Quarrying, & Extraction | 0 (0.0%) | 0 (0.0%) |
| Construction | 0 (0.0%) | 0 (0.0%) |
| Manufacturing | 10 (100.0%) | 0 (0.0%) |
| Wholesale Trade | 0 (0.0%) | 0 (0.0%) |
| Retail Trade | 0 (0.0%) | 13 (100.0%) |
| Transportation & Warehousing | 0 (0.0%) | 15 (100.0%) |
| Utilities | 0 (0.0%) | 0 (0.0%) |
| Information | 0 (0.0%) | 0 (0.0%) |
| Finance & Insurance | 0 (0.0%) | 0 (0.0%) |
| Real Estate, Rental & Leasing | 0 (0.0%) | 0 (0.0%) |
| Professional & Scientific | 0 (0.0%) | 0 (0.0%) |
| Enterprise Management | 0 (0.0%) | 0 (0.0%) |
| Administrative & Support | 0 (0.0%) | 0 (0.0%) |
| Educational Services | 0 (0.0%) | 7 (100.0%) |
| Health Care & Social Assistance | 0 (0.0%) | 0 (0.0%) |
| Arts, Entertainment & Recreation | 0 (0.0%) | 0 (0.0%) |
| Accommodation & Food Services | 0 (0.0%) | 0 (0.0%) |
| Public Administration | 29 (100.0%) | 0 (0.0%) |
| Total | 71 (55.5%) | 57 (44.5%) |
Education in Elberta
School Enrollment in Elberta
The most common levels of schooling among the 91 students in Elberta are elementary school (50 | 54.9%), kindergarten (28 | 30.8%), and college / undergraduate (13 | 14.3%).
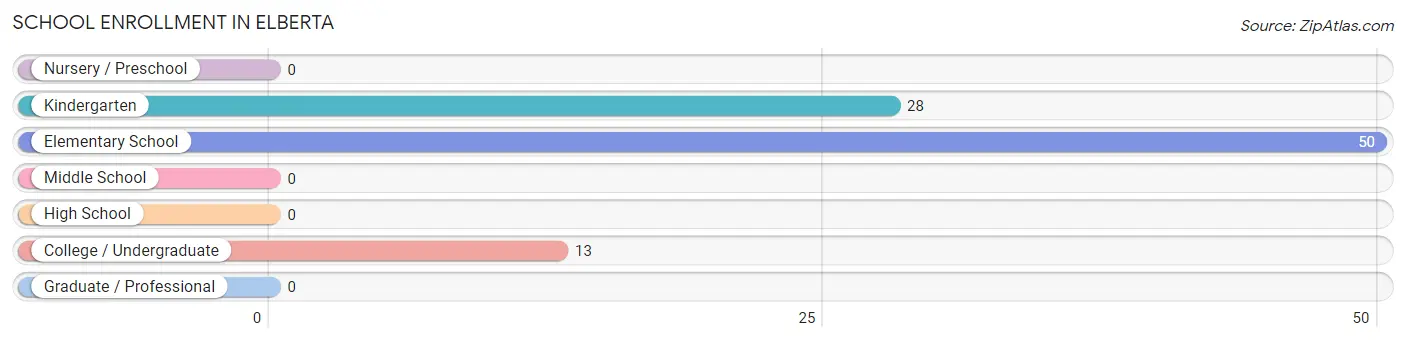
| School Level | # Students | % Students |
| Nursery / Preschool | 0 | 0.0% |
| Kindergarten | 28 | 30.8% |
| Elementary School | 50 | 54.9% |
| Middle School | 0 | 0.0% |
| High School | 0 | 0.0% |
| College / Undergraduate | 13 | 14.3% |
| Graduate / Professional | 0 | 0.0% |
| Total | 91 | 100.0% |
School Enrollment by Age by Funding Source in Elberta
Out of a total of 91 students who are enrolled in schools in Elberta, 56 (61.5%) attend a private institution, while the remaining 35 (38.5%) are enrolled in public schools. The age group of 5 to 9 year old has the highest likelihood of being enrolled in private schools, with 56 (71.8% in the age bracket) enrolled. Conversely, the age group of 18 to 19 year olds has the lowest likelihood of being enrolled in a private school, with 13 (100.0% in the age bracket) attending a public institution.
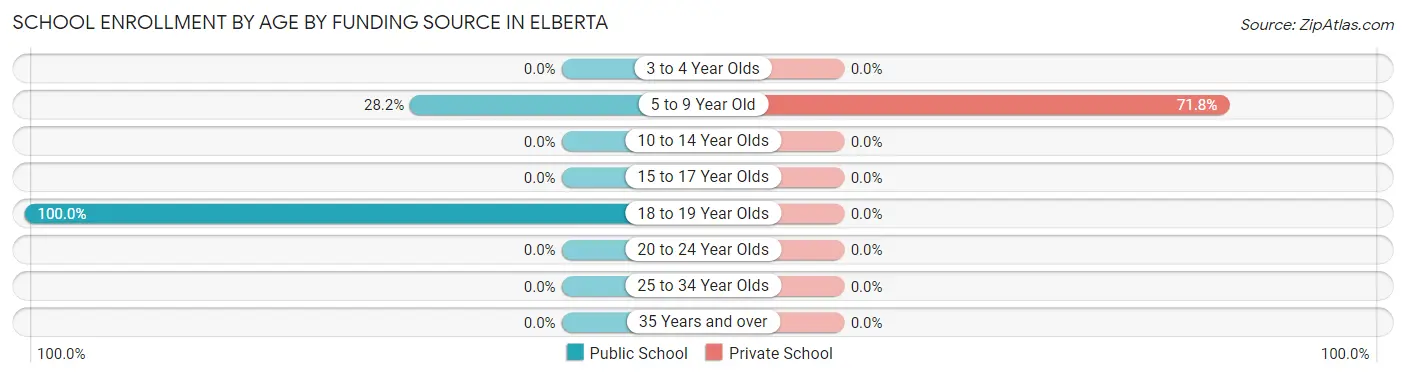
| Age Bracket | Public School | Private School |
| 3 to 4 Year Olds | 0 (0.0%) | 0 (0.0%) |
| 5 to 9 Year Old | 22 (28.2%) | 56 (71.8%) |
| 10 to 14 Year Olds | 0 (0.0%) | 0 (0.0%) |
| 15 to 17 Year Olds | 0 (0.0%) | 0 (0.0%) |
| 18 to 19 Year Olds | 13 (100.0%) | 0 (0.0%) |
| 20 to 24 Year Olds | 0 (0.0%) | 0 (0.0%) |
| 25 to 34 Year Olds | 0 (0.0%) | 0 (0.0%) |
| 35 Years and over | 0 (0.0%) | 0 (0.0%) |
| Total | 35 (38.5%) | 56 (61.5%) |
Educational Attainment by Field of Study in Elberta
| Field of Study | # Graduates | % Graduates |
| Computers & Mathematics | 0 | 0.0% |
| Bio, Nature & Agricultural | 0 | 0.0% |
| Physical & Health Sciences | 0 | 0.0% |
| Psychology | 0 | 0.0% |
| Social Sciences | 0 | 0.0% |
| Engineering | 0 | 0.0% |
| Multidisciplinary Studies | 0 | 0.0% |
| Science & Technology | 0 | 0.0% |
| Business | 0 | 0.0% |
| Education | 0 | 0.0% |
| Literature & Languages | 0 | 0.0% |
| Liberal Arts & History | 0 | 0.0% |
| Visual & Performing Arts | 0 | 0.0% |
| Communications | 0 | 0.0% |
| Arts & Humanities | 0 | 0.0% |
| Total | 0 | 0.0% |
Transportation & Commute in Elberta
Vehicle Availability by Sex in Elberta
The most prevalent vehicle ownership categories in Elberta are males with 4 vehicles (71, accounting for 100.0%) and females with 4 vehicles (42, making up 169.0%).
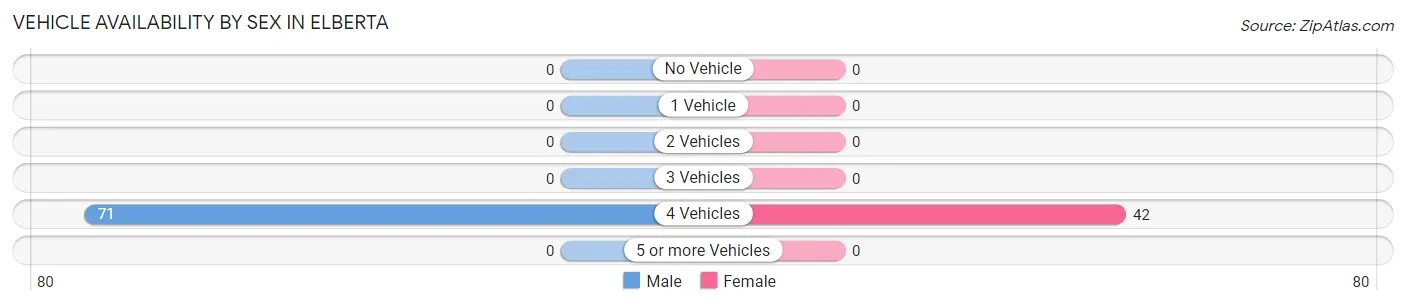
| Vehicles Available | Male | Female |
| No Vehicle | 0 (0.0%) | 0 (0.0%) |
| 1 Vehicle | 0 (0.0%) | 0 (0.0%) |
| 2 Vehicles | 0 (0.0%) | 0 (0.0%) |
| 3 Vehicles | 0 (0.0%) | 0 (0.0%) |
| 4 Vehicles | 71 (100.0%) | 42 (100.0%) |
| 5 or more Vehicles | 0 (0.0%) | 0 (0.0%) |
| Total | 71 (100.0%) | 42 (100.0%) |
Commute Time in Elberta
The most frequently occuring commute durations in Elberta are 5 to 9 minutes (29 commuters, 25.7%), 40 to 44 minutes (29 commuters, 25.7%), and 15 to 19 minutes (25 commuters, 22.1%).
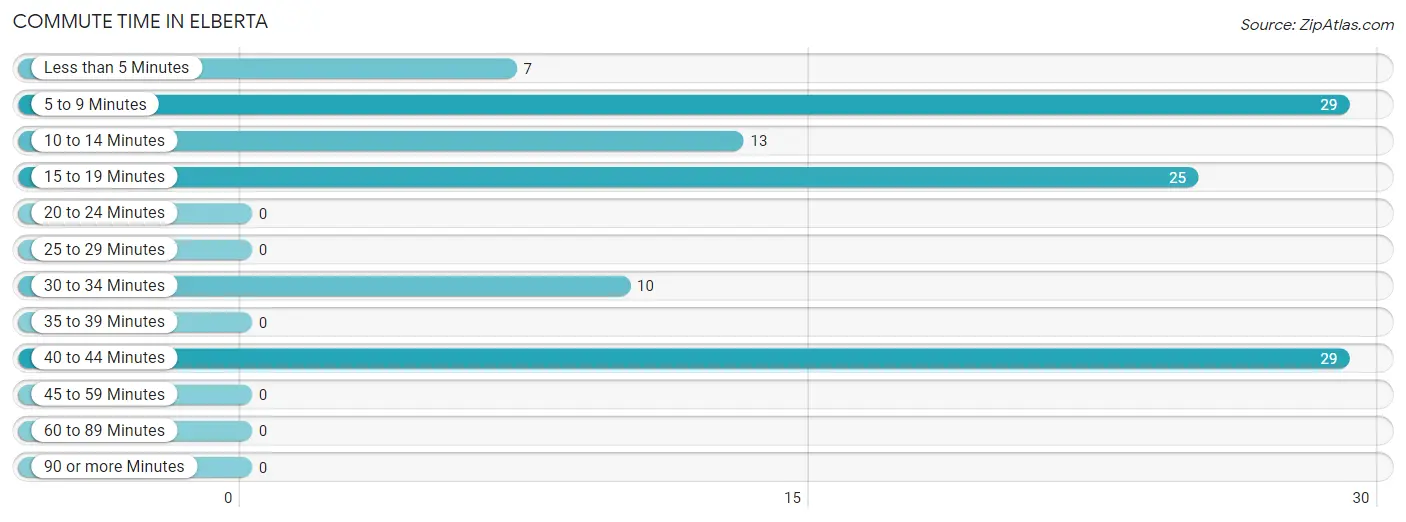
| Commute Time | # Commuters | % Commuters |
| Less than 5 Minutes | 7 | 6.2% |
| 5 to 9 Minutes | 29 | 25.7% |
| 10 to 14 Minutes | 13 | 11.5% |
| 15 to 19 Minutes | 25 | 22.1% |
| 20 to 24 Minutes | 0 | 0.0% |
| 25 to 29 Minutes | 0 | 0.0% |
| 30 to 34 Minutes | 10 | 8.8% |
| 35 to 39 Minutes | 0 | 0.0% |
| 40 to 44 Minutes | 29 | 25.7% |
| 45 to 59 Minutes | 0 | 0.0% |
| 60 to 89 Minutes | 0 | 0.0% |
| 90 or more Minutes | 0 | 0.0% |
Commute Time by Sex in Elberta
The most common commute times in Elberta are 40 to 44 minutes (29 commuters, 40.8%) for males and 5 to 9 minutes (29 commuters, 69.1%) for females.
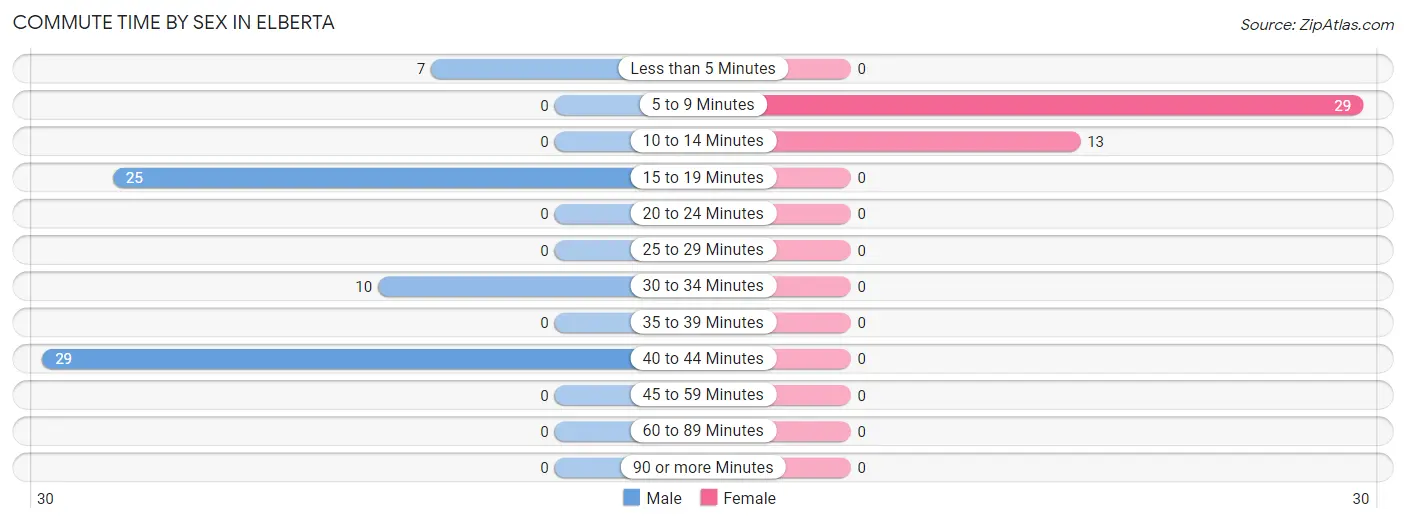
| Commute Time | Male | Female |
| Less than 5 Minutes | 7 (9.9%) | 0 (0.0%) |
| 5 to 9 Minutes | 0 (0.0%) | 29 (69.1%) |
| 10 to 14 Minutes | 0 (0.0%) | 13 (30.9%) |
| 15 to 19 Minutes | 25 (35.2%) | 0 (0.0%) |
| 20 to 24 Minutes | 0 (0.0%) | 0 (0.0%) |
| 25 to 29 Minutes | 0 (0.0%) | 0 (0.0%) |
| 30 to 34 Minutes | 10 (14.1%) | 0 (0.0%) |
| 35 to 39 Minutes | 0 (0.0%) | 0 (0.0%) |
| 40 to 44 Minutes | 29 (40.8%) | 0 (0.0%) |
| 45 to 59 Minutes | 0 (0.0%) | 0 (0.0%) |
| 60 to 89 Minutes | 0 (0.0%) | 0 (0.0%) |
| 90 or more Minutes | 0 (0.0%) | 0 (0.0%) |
Time of Departure to Work by Sex in Elberta
The most frequent times of departure to work in Elberta are 6:00 AM to 6:29 AM (29, 40.8%) for males and 8:30 AM to 8:59 AM (22, 52.4%) for females.
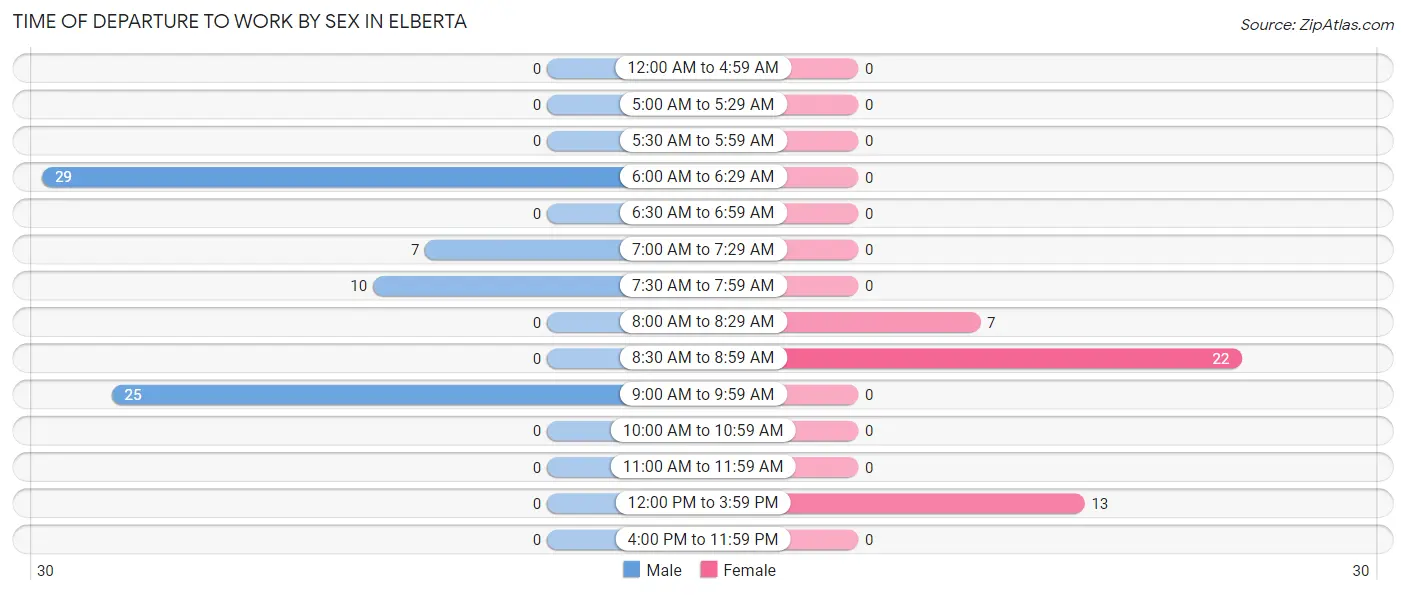
| Time of Departure | Male | Female |
| 12:00 AM to 4:59 AM | 0 (0.0%) | 0 (0.0%) |
| 5:00 AM to 5:29 AM | 0 (0.0%) | 0 (0.0%) |
| 5:30 AM to 5:59 AM | 0 (0.0%) | 0 (0.0%) |
| 6:00 AM to 6:29 AM | 29 (40.8%) | 0 (0.0%) |
| 6:30 AM to 6:59 AM | 0 (0.0%) | 0 (0.0%) |
| 7:00 AM to 7:29 AM | 7 (9.9%) | 0 (0.0%) |
| 7:30 AM to 7:59 AM | 10 (14.1%) | 0 (0.0%) |
| 8:00 AM to 8:29 AM | 0 (0.0%) | 7 (16.7%) |
| 8:30 AM to 8:59 AM | 0 (0.0%) | 22 (52.4%) |
| 9:00 AM to 9:59 AM | 25 (35.2%) | 0 (0.0%) |
| 10:00 AM to 10:59 AM | 0 (0.0%) | 0 (0.0%) |
| 11:00 AM to 11:59 AM | 0 (0.0%) | 0 (0.0%) |
| 12:00 PM to 3:59 PM | 0 (0.0%) | 13 (30.9%) |
| 4:00 PM to 11:59 PM | 0 (0.0%) | 0 (0.0%) |
| Total | 71 (100.0%) | 42 (100.0%) |
Housing Occupancy in Elberta
Occupancy by Ownership in Elberta
Of the total 64 dwellings in Elberta, owner-occupied units account for 64 (100.0%), while renter-occupied units make up 0 (0.0%).
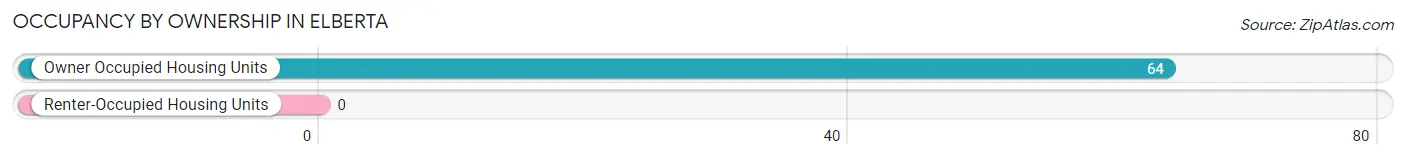
| Occupancy | # Housing Units | % Housing Units |
| Owner Occupied Housing Units | 64 | 100.0% |
| Renter-Occupied Housing Units | 0 | 0.0% |
| Total Occupied Housing Units | 64 | 100.0% |
Occupancy by Household Size in Elberta
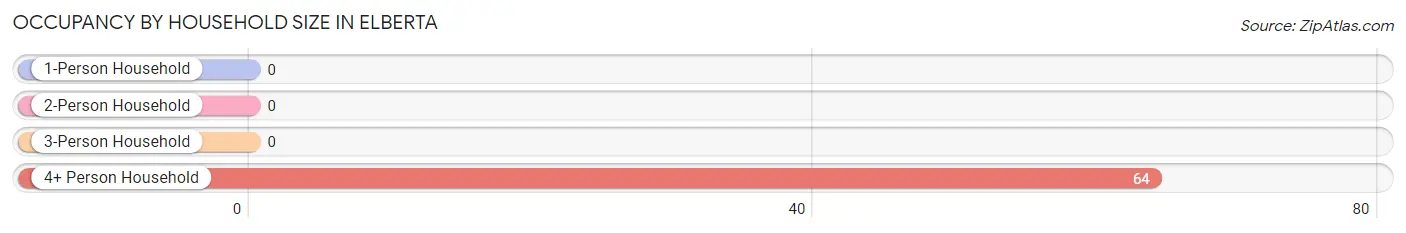
| Household Size | # Housing Units | % Housing Units |
| 1-Person Household | 0 | 0.0% |
| 2-Person Household | 0 | 0.0% |
| 3-Person Household | 0 | 0.0% |
| 4+ Person Household | 64 | 100.0% |
| Total Housing Units | 64 | 100.0% |
Occupancy by Ownership by Household Size in Elberta
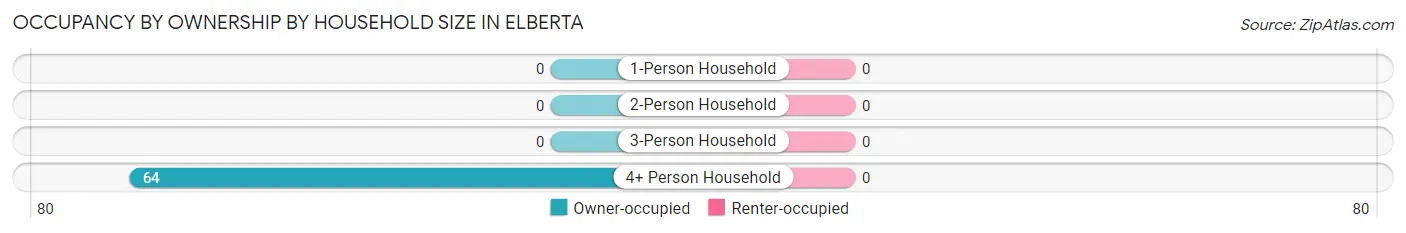
| Household Size | Owner-occupied | Renter-occupied |
| 1-Person Household | 0 (0.0%) | 0 (0.0%) |
| 2-Person Household | 0 (0.0%) | 0 (0.0%) |
| 3-Person Household | 0 (0.0%) | 0 (0.0%) |
| 4+ Person Household | 64 (100.0%) | 0 (0.0%) |
| Total Housing Units | 64 (100.0%) | 0 (0.0%) |
Occupancy by Educational Attainment in Elberta
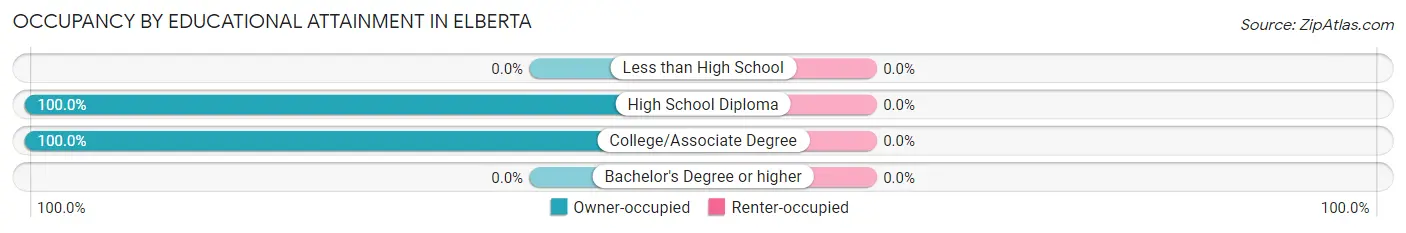
| Household Size | Owner-occupied | Renter-occupied |
| Less than High School | 0 (0.0%) | 0 (0.0%) |
| High School Diploma | 29 (100.0%) | 0 (0.0%) |
| College/Associate Degree | 35 (100.0%) | 0 (0.0%) |
| Bachelor's Degree or higher | 0 (0.0%) | 0 (0.0%) |
Occupancy by Age of Householder in Elberta
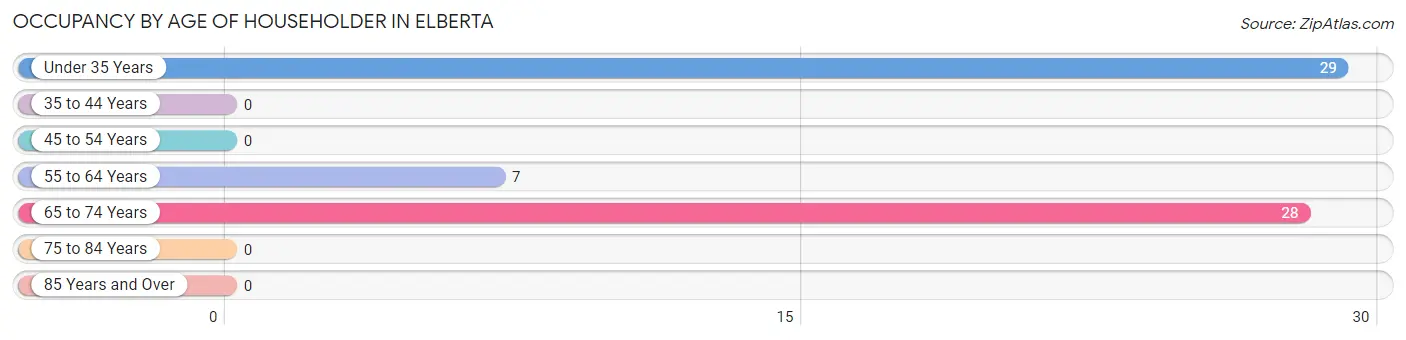
| Age Bracket | # Households | % Households |
| Under 35 Years | 29 | 45.3% |
| 35 to 44 Years | 0 | 0.0% |
| 45 to 54 Years | 0 | 0.0% |
| 55 to 64 Years | 7 | 10.9% |
| 65 to 74 Years | 28 | 43.8% |
| 75 to 84 Years | 0 | 0.0% |
| 85 Years and Over | 0 | 0.0% |
| Total | 64 | 100.0% |
Housing Finances in Elberta
Median Income by Occupancy in Elberta
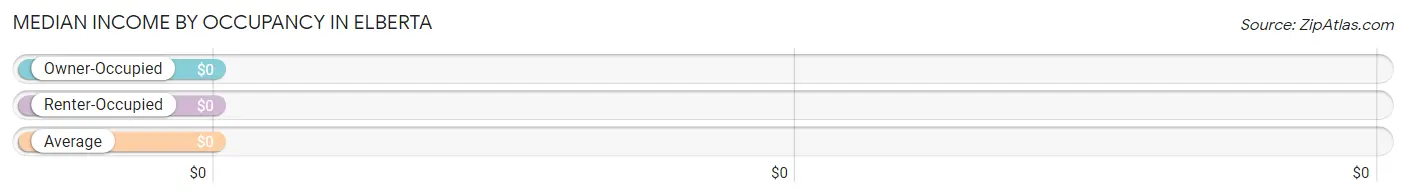
| Occupancy Type | # Households | Median Income |
| Owner-Occupied | 64 (100.0%) | $0 |
| Renter-Occupied | 0 (0.0%) | $0 |
| Average | 64 (100.0%) | $0 |
Occupancy by Householder Income Bracket in Elberta
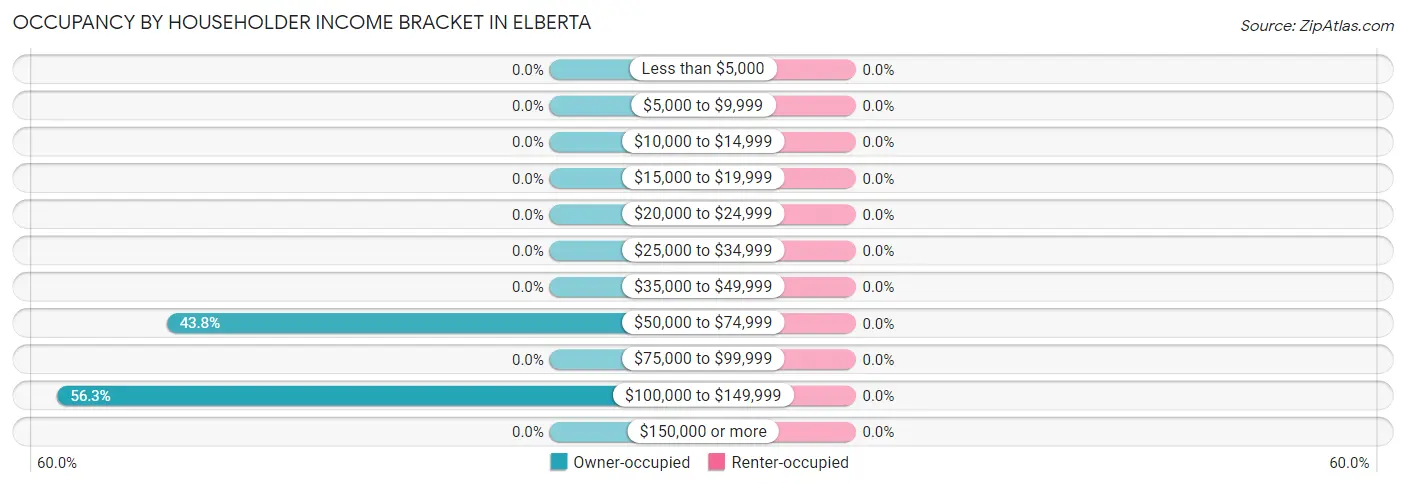
| Income Bracket | Owner-occupied | Renter-occupied |
| Less than $5,000 | 0 (0.0%) | 0 (0.0%) |
| $5,000 to $9,999 | 0 (0.0%) | 0 (0.0%) |
| $10,000 to $14,999 | 0 (0.0%) | 0 (0.0%) |
| $15,000 to $19,999 | 0 (0.0%) | 0 (0.0%) |
| $20,000 to $24,999 | 0 (0.0%) | 0 (0.0%) |
| $25,000 to $34,999 | 0 (0.0%) | 0 (0.0%) |
| $35,000 to $49,999 | 0 (0.0%) | 0 (0.0%) |
| $50,000 to $74,999 | 28 (43.8%) | 0 (0.0%) |
| $75,000 to $99,999 | 0 (0.0%) | 0 (0.0%) |
| $100,000 to $149,999 | 36 (56.2%) | 0 (0.0%) |
| $150,000 or more | 0 (0.0%) | 0 (0.0%) |
| Total | 64 (100.0%) | 0 (0.0%) |
Monthly Housing Cost Tiers in Elberta
| Monthly Cost | Owner-occupied | Renter-occupied |
| Less than $300 | 0 (0.0%) | 0 (0.0%) |
| $300 to $499 | 0 (0.0%) | 0 (0.0%) |
| $500 to $799 | 7 (10.9%) | 0 (0.0%) |
| $800 to $999 | 0 (0.0%) | 0 (0.0%) |
| $1,000 to $1,499 | 29 (45.3%) | 0 (0.0%) |
| $1,500 to $1,999 | 0 (0.0%) | 0 (0.0%) |
| $2,000 to $2,499 | 0 (0.0%) | 0 (0.0%) |
| $2,500 to $2,999 | 28 (43.8%) | 0 (0.0%) |
| $3,000 or more | 0 (0.0%) | 0 (0.0%) |
| Total | 64 (100.0%) | 0 (0.0%) |
Physical Housing Characteristics in Elberta
Housing Structures in Elberta
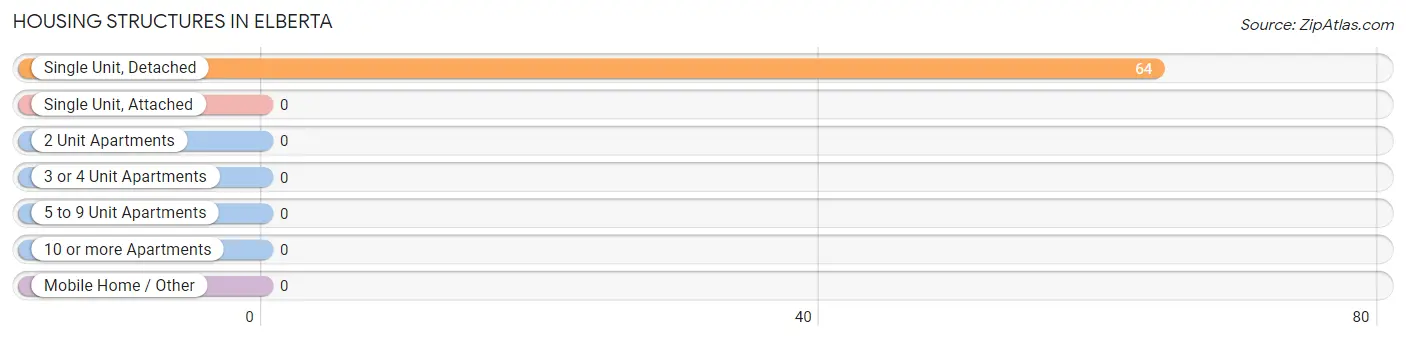
| Structure Type | # Housing Units | % Housing Units |
| Single Unit, Detached | 64 | 100.0% |
| Single Unit, Attached | 0 | 0.0% |
| 2 Unit Apartments | 0 | 0.0% |
| 3 or 4 Unit Apartments | 0 | 0.0% |
| 5 to 9 Unit Apartments | 0 | 0.0% |
| 10 or more Apartments | 0 | 0.0% |
| Mobile Home / Other | 0 | 0.0% |
| Total | 64 | 100.0% |
Housing Structures by Occupancy in Elberta
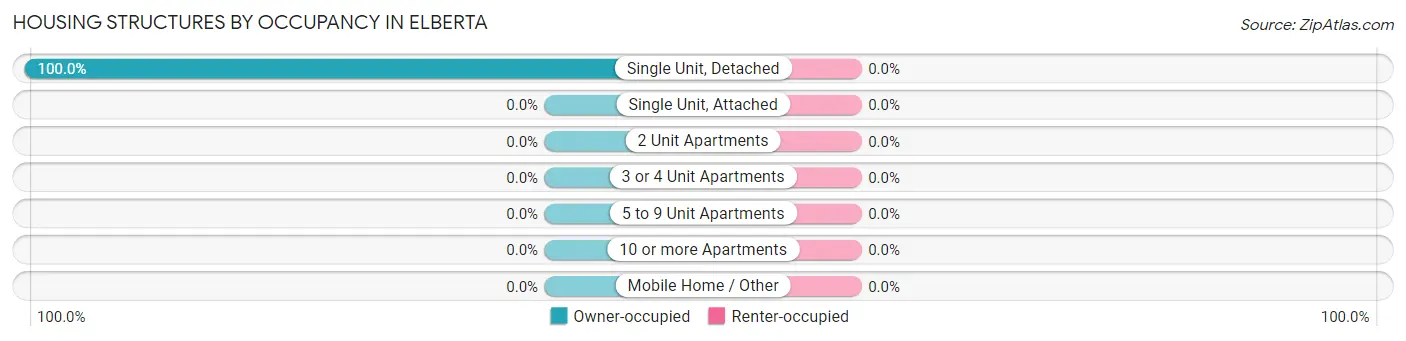
| Structure Type | Owner-occupied | Renter-occupied |
| Single Unit, Detached | 64 (100.0%) | 0 (0.0%) |
| Single Unit, Attached | 0 (0.0%) | 0 (0.0%) |
| 2 Unit Apartments | 0 (0.0%) | 0 (0.0%) |
| 3 or 4 Unit Apartments | 0 (0.0%) | 0 (0.0%) |
| 5 to 9 Unit Apartments | 0 (0.0%) | 0 (0.0%) |
| 10 or more Apartments | 0 (0.0%) | 0 (0.0%) |
| Mobile Home / Other | 0 (0.0%) | 0 (0.0%) |
| Total | 64 (100.0%) | 0 (0.0%) |
Housing Structures by Number of Rooms in Elberta
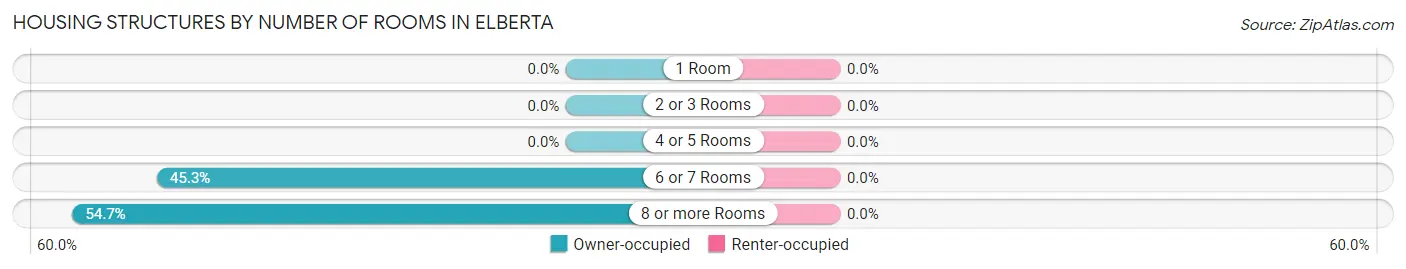
| Number of Rooms | Owner-occupied | Renter-occupied |
| 1 Room | 0 (0.0%) | 0 (0.0%) |
| 2 or 3 Rooms | 0 (0.0%) | 0 (0.0%) |
| 4 or 5 Rooms | 0 (0.0%) | 0 (0.0%) |
| 6 or 7 Rooms | 29 (45.3%) | 0 (0.0%) |
| 8 or more Rooms | 35 (54.7%) | 0 (0.0%) |
| Total | 64 (100.0%) | 0 (0.0%) |
Housing Structure by Heating Type in Elberta
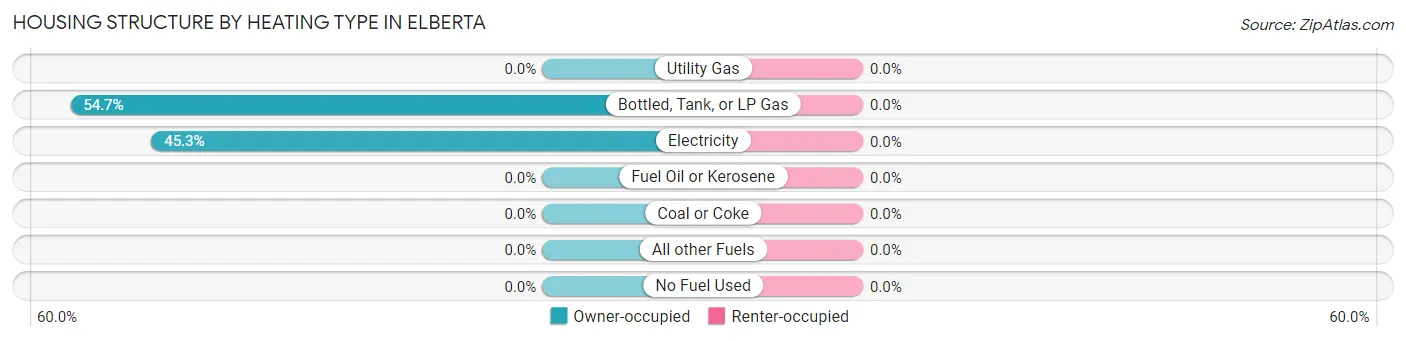
| Heating Type | Owner-occupied | Renter-occupied |
| Utility Gas | 0 (0.0%) | 0 (0.0%) |
| Bottled, Tank, or LP Gas | 35 (54.7%) | 0 (0.0%) |
| Electricity | 29 (45.3%) | 0 (0.0%) |
| Fuel Oil or Kerosene | 0 (0.0%) | 0 (0.0%) |
| Coal or Coke | 0 (0.0%) | 0 (0.0%) |
| All other Fuels | 0 (0.0%) | 0 (0.0%) |
| No Fuel Used | 0 (0.0%) | 0 (0.0%) |
| Total | 64 (100.0%) | 0 (0.0%) |
Household Vehicle Usage in Elberta
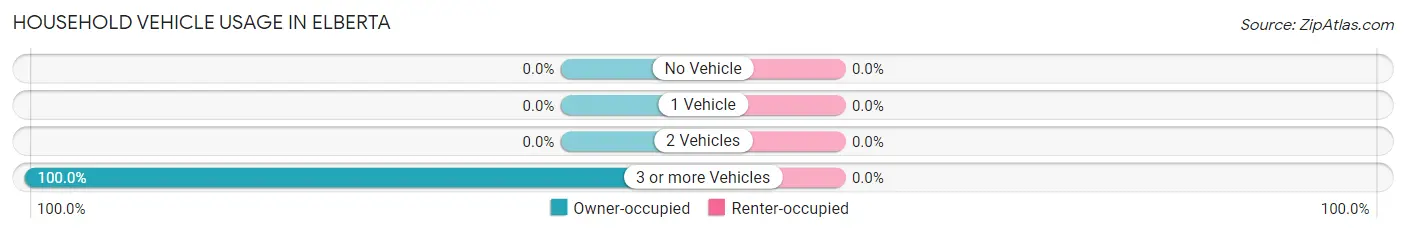
| Vehicles per Household | Owner-occupied | Renter-occupied |
| No Vehicle | 0 (0.0%) | 0 (0.0%) |
| 1 Vehicle | 0 (0.0%) | 0 (0.0%) |
| 2 Vehicles | 0 (0.0%) | 0 (0.0%) |
| 3 or more Vehicles | 64 (100.0%) | 0 (0.0%) |
| Total | 64 (100.0%) | 0 (0.0%) |
Real Estate & Mortgages in Elberta
Real Estate and Mortgage Overview in Elberta
| Characteristic | Without Mortgage | With Mortgage |
| Housing Units | 7 | 57 |
| Median Property Value | - | - |
| Median Household Income | - | - |
| Monthly Housing Costs | - | - |
| Real Estate Taxes | - | - |
Property Value by Mortgage Status in Elberta
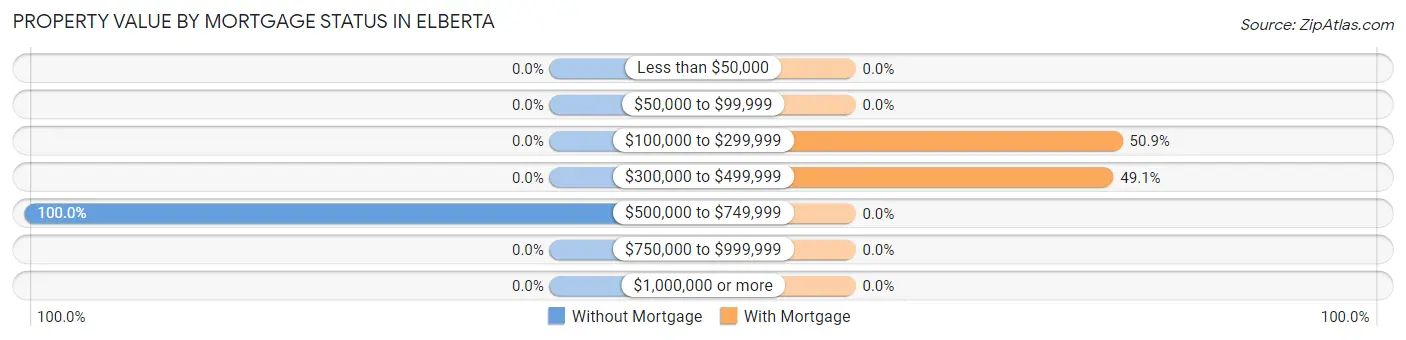
| Property Value | Without Mortgage | With Mortgage |
| Less than $50,000 | 0 (0.0%) | 0 (0.0%) |
| $50,000 to $99,999 | 0 (0.0%) | 0 (0.0%) |
| $100,000 to $299,999 | 0 (0.0%) | 29 (50.9%) |
| $300,000 to $499,999 | 0 (0.0%) | 28 (49.1%) |
| $500,000 to $749,999 | 7 (100.0%) | 0 (0.0%) |
| $750,000 to $999,999 | 0 (0.0%) | 0 (0.0%) |
| $1,000,000 or more | 0 (0.0%) | 0 (0.0%) |
| Total | 7 (100.0%) | 57 (100.0%) |
Household Income by Mortgage Status in Elberta
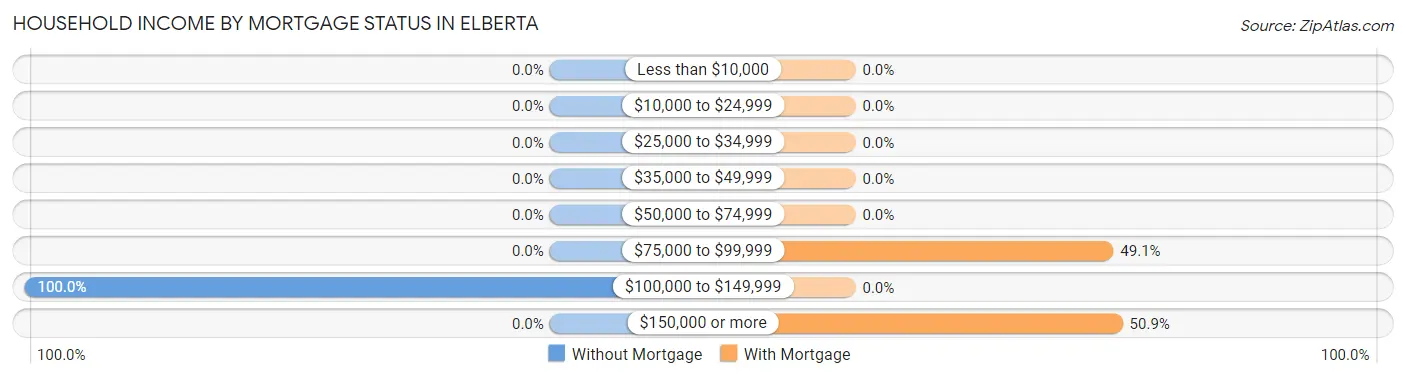
| Household Income | Without Mortgage | With Mortgage |
| Less than $10,000 | 0 (0.0%) | 0 (0.0%) |
| $10,000 to $24,999 | 0 (0.0%) | 0 (0.0%) |
| $25,000 to $34,999 | 0 (0.0%) | 0 (0.0%) |
| $35,000 to $49,999 | 0 (0.0%) | 0 (0.0%) |
| $50,000 to $74,999 | 0 (0.0%) | 0 (0.0%) |
| $75,000 to $99,999 | 0 (0.0%) | 28 (49.1%) |
| $100,000 to $149,999 | 7 (100.0%) | 0 (0.0%) |
| $150,000 or more | 0 (0.0%) | 29 (50.9%) |
| Total | 7 (100.0%) | 57 (100.0%) |
Property Value to Household Income Ratio in Elberta
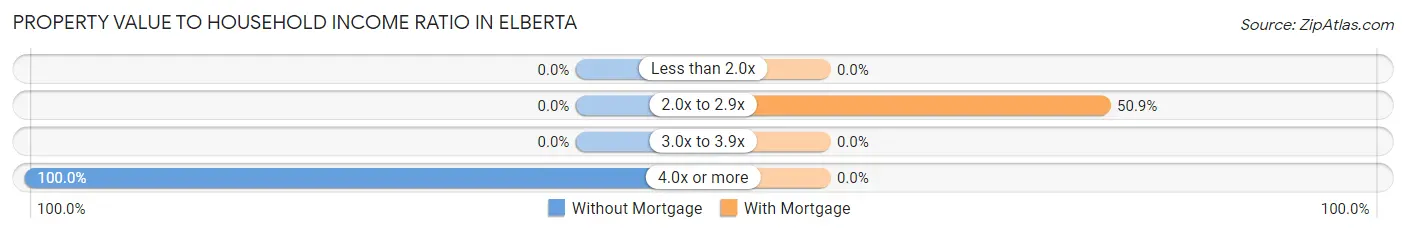
| Value-to-Income Ratio | Without Mortgage | With Mortgage |
| Less than 2.0x | 0 (0.0%) | 0 (0.0%) |
| 2.0x to 2.9x | 0 (0.0%) | 29 (50.9%) |
| 3.0x to 3.9x | 0 (0.0%) | 0 (0.0%) |
| 4.0x or more | 7 (100.0%) | 0 (0.0%) |
| Total | 7 (100.0%) | 57 (100.0%) |
Real Estate Taxes by Mortgage Status in Elberta
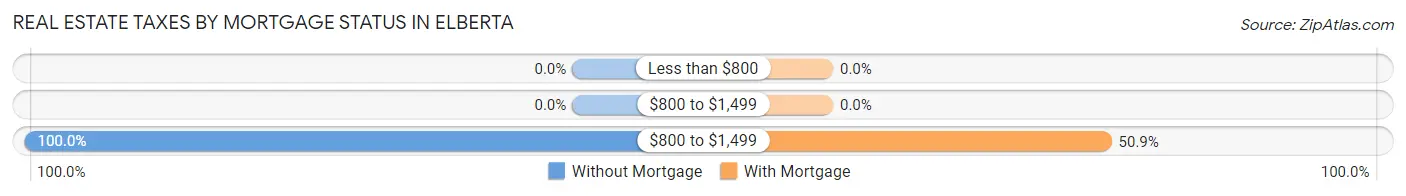
| Property Taxes | Without Mortgage | With Mortgage |
| Less than $800 | 0 (0.0%) | 0 (0.0%) |
| $800 to $1,499 | 0 (0.0%) | 0 (0.0%) |
| $800 to $1,499 | 7 (100.0%) | 29 (50.9%) |
| Total | 7 (100.0%) | 57 (100.0%) |
Health & Disability in Elberta
Health Insurance Coverage by Age in Elberta
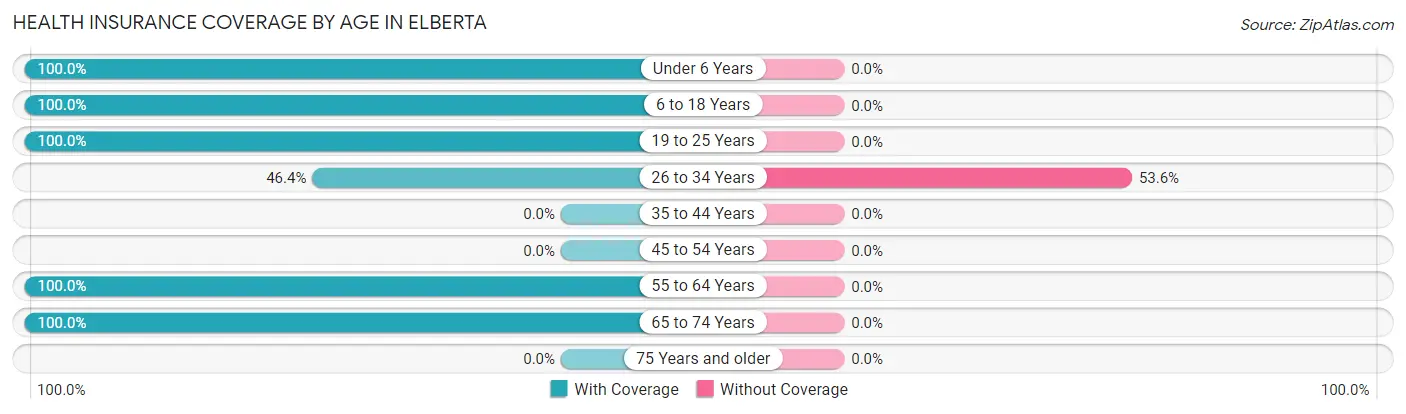
| Age Bracket | With Coverage | Without Coverage |
| Under 6 Years | 82 (100.0%) | 0 (0.0%) |
| 6 to 18 Years | 50 (100.0%) | 0 (0.0%) |
| 19 to 25 Years | 13 (100.0%) | 0 (0.0%) |
| 26 to 34 Years | 51 (46.4%) | 59 (53.6%) |
| 35 to 44 Years | 0 (0.0%) | 0 (0.0%) |
| 45 to 54 Years | 0 (0.0%) | 0 (0.0%) |
| 55 to 64 Years | 29 (100.0%) | 0 (0.0%) |
| 65 to 74 Years | 28 (100.0%) | 0 (0.0%) |
| 75 Years and older | 0 (0.0%) | 0 (0.0%) |
| Total | 253 (81.1%) | 59 (18.9%) |
Health Insurance Coverage by Citizenship Status in Elberta

| Citizenship Status | With Coverage | Without Coverage |
| Native Born | 82 (100.0%) | 0 (0.0%) |
| Foreign Born, Citizen | 50 (100.0%) | 0 (0.0%) |
| Foreign Born, not a Citizen | 13 (100.0%) | 0 (0.0%) |
Health Insurance Coverage by Household Income in Elberta
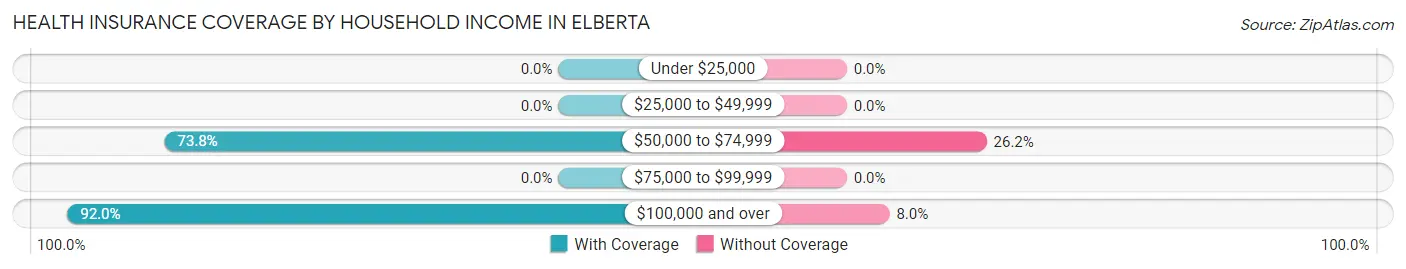
| Household Income | With Coverage | Without Coverage |
| Under $25,000 | 0 (0.0%) | 0 (0.0%) |
| $25,000 to $49,999 | 0 (0.0%) | 0 (0.0%) |
| $50,000 to $74,999 | 138 (73.8%) | 49 (26.2%) |
| $75,000 to $99,999 | 0 (0.0%) | 0 (0.0%) |
| $100,000 and over | 115 (92.0%) | 10 (8.0%) |
Public vs Private Health Insurance Coverage by Age in Elberta
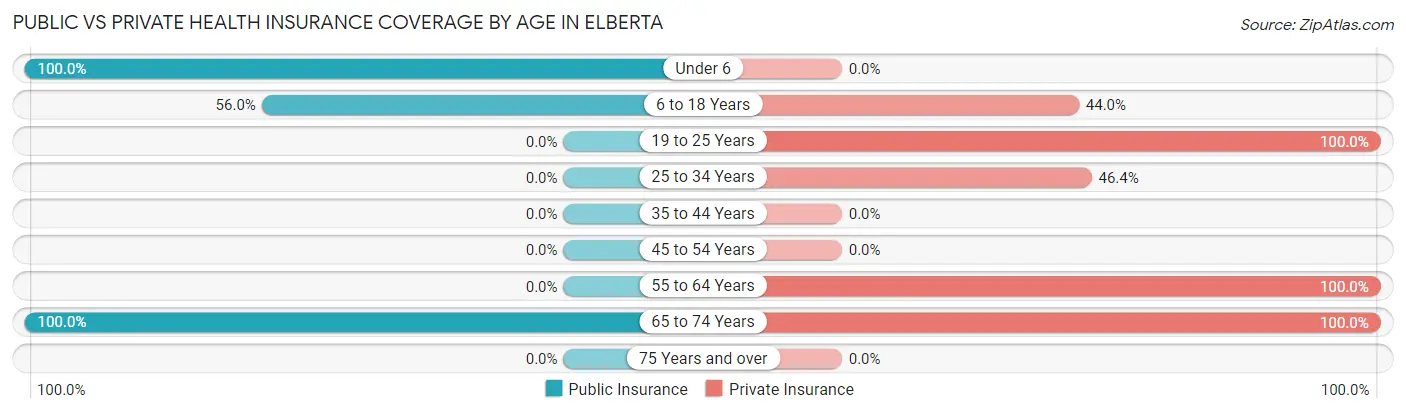
| Age Bracket | Public Insurance | Private Insurance |
| Under 6 | 82 (100.0%) | 0 (0.0%) |
| 6 to 18 Years | 28 (56.0%) | 22 (44.0%) |
| 19 to 25 Years | 0 (0.0%) | 13 (100.0%) |
| 25 to 34 Years | 0 (0.0%) | 51 (46.4%) |
| 35 to 44 Years | 0 (0.0%) | 0 (0.0%) |
| 45 to 54 Years | 0 (0.0%) | 0 (0.0%) |
| 55 to 64 Years | 0 (0.0%) | 29 (100.0%) |
| 65 to 74 Years | 28 (100.0%) | 28 (100.0%) |
| 75 Years and over | 0 (0.0%) | 0 (0.0%) |
| Total | 138 (44.2%) | 143 (45.8%) |
Disability Status by Sex by Age in Elberta
| Age Bracket | Male | Female |
| Under 5 Years | 0 (0.0%) | 0 (0.0%) |
| 5 to 17 Years | 0 (0.0%) | 0 (0.0%) |
| 18 to 34 Years | 0 (0.0%) | 0 (0.0%) |
| 35 to 64 Years | 0 (0.0%) | 0 (0.0%) |
| 65 to 74 Years | 0 (0.0%) | 0 (0.0%) |
| 75 Years and over | 0 (0.0%) | 0 (0.0%) |
Disability Class by Sex by Age in Elberta
Disability Class: Hearing Difficulty
| Age Bracket | Male | Female |
| Under 5 Years | 0 (0.0%) | 0 (0.0%) |
| 5 to 17 Years | 0 (0.0%) | 0 (0.0%) |
| 18 to 34 Years | 0 (0.0%) | 0 (0.0%) |
| 35 to 64 Years | 0 (0.0%) | 0 (0.0%) |
| 65 to 74 Years | 0 (0.0%) | 0 (0.0%) |
| 75 Years and over | 0 (0.0%) | 0 (0.0%) |
Disability Class: Vision Difficulty
| Age Bracket | Male | Female |
| Under 5 Years | 0 (0.0%) | 0 (0.0%) |
| 5 to 17 Years | 0 (0.0%) | 0 (0.0%) |
| 18 to 34 Years | 0 (0.0%) | 0 (0.0%) |
| 35 to 64 Years | 0 (0.0%) | 0 (0.0%) |
| 65 to 74 Years | 0 (0.0%) | 0 (0.0%) |
| 75 Years and over | 0 (0.0%) | 0 (0.0%) |
Disability Class: Cognitive Difficulty
| Age Bracket | Male | Female |
| 5 to 17 Years | 0 (0.0%) | 0 (0.0%) |
| 18 to 34 Years | 0 (0.0%) | 0 (0.0%) |
| 35 to 64 Years | 0 (0.0%) | 0 (0.0%) |
| 65 to 74 Years | 0 (0.0%) | 0 (0.0%) |
| 75 Years and over | 0 (0.0%) | 0 (0.0%) |
Disability Class: Ambulatory Difficulty
| Age Bracket | Male | Female |
| 5 to 17 Years | 0 (0.0%) | 0 (0.0%) |
| 18 to 34 Years | 0 (0.0%) | 0 (0.0%) |
| 35 to 64 Years | 0 (0.0%) | 0 (0.0%) |
| 65 to 74 Years | 0 (0.0%) | 0 (0.0%) |
| 75 Years and over | 0 (0.0%) | 0 (0.0%) |
Disability Class: Self-Care Difficulty
| Age Bracket | Male | Female |
| 5 to 17 Years | 0 (0.0%) | 0 (0.0%) |
| 18 to 34 Years | 0 (0.0%) | 0 (0.0%) |
| 35 to 64 Years | 0 (0.0%) | 0 (0.0%) |
| 65 to 74 Years | 0 (0.0%) | 0 (0.0%) |
| 75 Years and over | 0 (0.0%) | 0 (0.0%) |
Technology Access in Elberta
Computing Device Access in Elberta
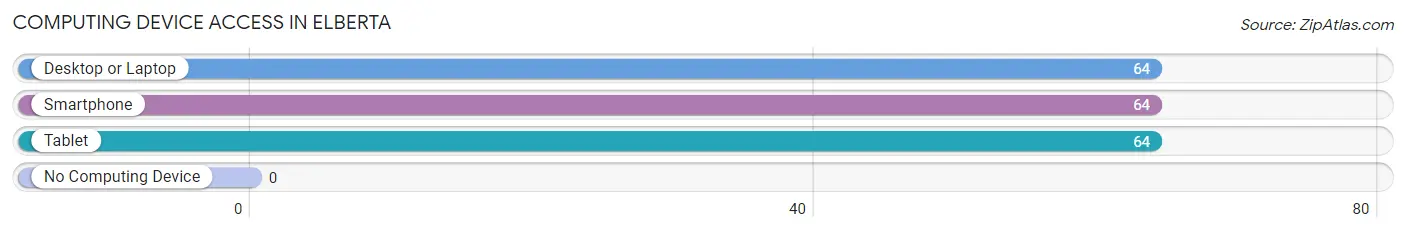
| Device Type | # Households | % Households |
| Desktop or Laptop | 64 | 100.0% |
| Smartphone | 64 | 100.0% |
| Tablet | 64 | 100.0% |
| No Computing Device | 0 | 0.0% |
| Total | 64 | 100.0% |
Internet Access in Elberta
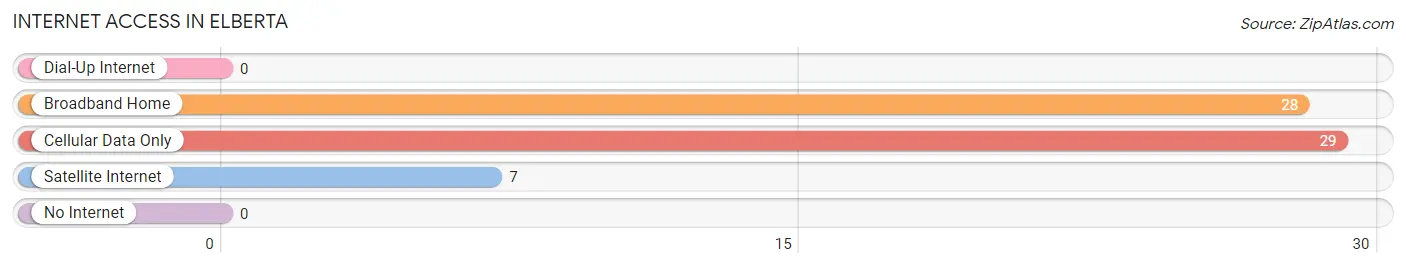
| Internet Type | # Households | % Households |
| Dial-Up Internet | 0 | 0.0% |
| Broadband Home | 28 | 43.8% |
| Cellular Data Only | 29 | 45.3% |
| Satellite Internet | 7 | 10.9% |
| No Internet | 0 | 0.0% |
| Total | 64 | 100.0% |
Elberta Summary
Elberta, Utah is a small town located in the southwestern corner of the state, near the Arizona border. It is situated in the heart of the Grand Staircase-Escalante National Monument, a protected area of stunning natural beauty. The town is home to just over 200 people, and is known for its rural charm and stunning views of the surrounding landscape.
History
Elberta was founded in 1883 by a group of Mormon settlers who were looking for a place to settle and raise their families. The town was named after Elberta, a daughter of one of the settlers. The town was originally a farming community, and the settlers grew a variety of crops, including wheat, corn, and hay. The town also had a small sawmill, which provided lumber for the construction of homes and other buildings.
In the early 1900s, Elberta began to experience a period of growth and prosperity. The town was connected to the outside world by the railroad, and the population began to grow. The town also became a popular tourist destination, as visitors came to enjoy the stunning views of the surrounding landscape.
Geography
Elberta is located in the southwestern corner of Utah, near the Arizona border. It is situated in the heart of the Grand Staircase-Escalante National Monument, a protected area of stunning natural beauty. The town is surrounded by red rock canyons, sandstone cliffs, and desert landscapes. The town is located at an elevation of 4,500 feet, and the climate is semi-arid, with hot summers and mild winters.
Economy
The economy of Elberta is largely based on tourism. The town is a popular destination for visitors who come to enjoy the stunning views of the surrounding landscape. The town also has a few small businesses, including a general store, a gas station, and a few restaurants.
Demographics
As of the 2010 census, Elberta had a population of just over 200 people. The racial makeup of the town was 97.5% White, 0.5% Native American, 0.5% Asian, and 1.5% from other races. The median household income was $37,500, and the median age was 44.5 years. The town is served by the Kane County School District.
Common Questions
What is Per Capita Income in Elberta?
Per Capita income in Elberta is $17,996.
What is Income or Wage Gap in Elberta?
Income or Wage Gap in Elberta is 78.5%.
Women in Elberta earn 21.5 cents for every dollar earned by a man.
What is Inequality or Gini Index in Elberta?
Inequality or Gini Index in Elberta is 0.21.
What is the Total Population of Elberta?
Total Population of Elberta is 312.
What is the Total Male Population of Elberta?
Total Male Population of Elberta is 99.
What is the Total Female Population of Elberta?
Total Female Population of Elberta is 213.
What is the Ratio of Males per 100 Females in Elberta?
There are 46.48 Males per 100 Females in Elberta.
What is the Ratio of Females per 100 Males in Elberta?
There are 215.15 Females per 100 Males in Elberta.
What is the Median Population Age in Elberta?
Median Population Age in Elberta is 30.0 Years.
What is the Average Family Size in Elberta
Average Family Size in Elberta is 4.9 People.
What is the Average Household Size in Elberta
Average Household Size in Elberta is 4.9 People.
How Large is the Labor Force in Elberta?
There are 128 People in the Labor Forcein in Elberta.
What is the Percentage of People in the Labor Force in Elberta?
71.1% of People are in the Labor Force in Elberta.