Leland, MI Map & Demographics
Leland Map
Leland Overview
$44,291
PER CAPITA INCOME
$99,167
AVG FAMILY INCOME
$96,719
AVG HOUSEHOLD INCOME
0.29
INEQUALITY / GINI INDEX
352
TOTAL POPULATION
174
MALE POPULATION
178
FEMALE POPULATION
97.75
MALES / 100 FEMALES
102.30
FEMALES / 100 MALES
49.5
MEDIAN AGE
2.8
AVG FAMILY SIZE
2.1
AVG HOUSEHOLD SIZE
121
LABOR FORCE [ PEOPLE ]
35.9%
PERCENT IN LABOR FORCE
Leland Zip Codes
Leland Area Codes
Income in Leland
Income Overview in Leland
Per Capita Income in Leland is $44,291, while median incomes of families and households are $99,167 and $96,719 respectively.
| Characteristic | Number | Measure |
| Per Capita Income | 352 | $44,291 |
| Median Family Income | 92 | $99,167 |
| Mean Family Income | 92 | $119,051 |
| Median Household Income | 165 | $96,719 |
| Mean Household Income | 165 | $91,490 |
| Income Deficit | 92 | $0 |
| Wage / Income Gap (%) | 352 | 0.00% |
| Wage / Income Gap ($) | 352 | 100.00¢ per $1 |
| Gini / Inequality Index | 352 | 0.29 |
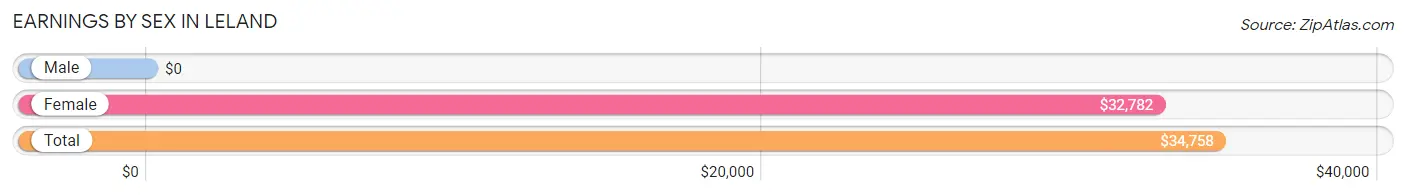
Earnings by Sex in Leland
| Sex | Number | Average Earnings |
| Male | 81 (48.8%) | $0 |
| Female | 85 (51.2%) | $32,782 |
| Total | 166 (100.0%) | $34,758 |
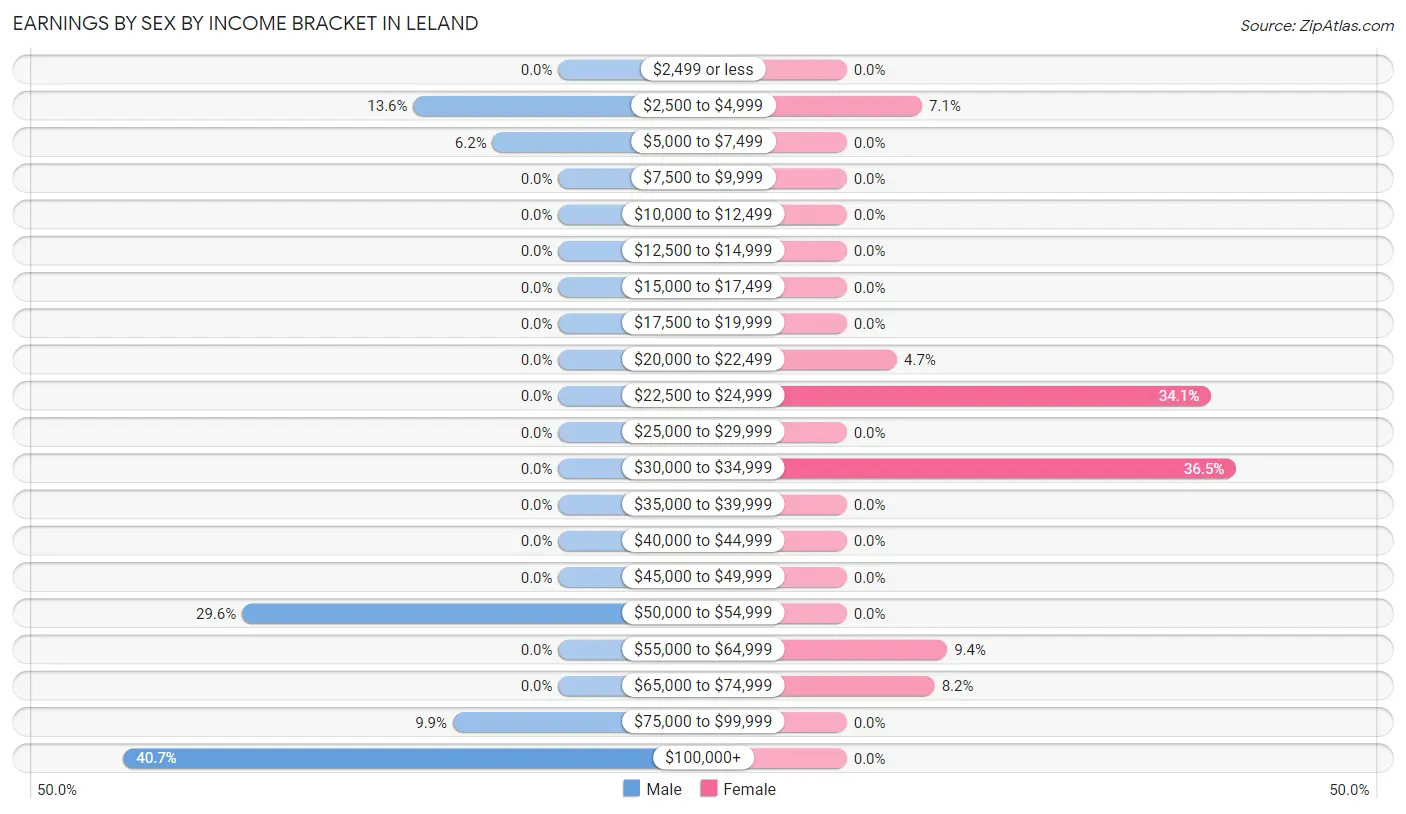
Earnings by Sex by Income Bracket in Leland
The most common earnings brackets in Leland are $100,000+ for men (33 | 40.7%) and $30,000 to $34,999 for women (31 | 36.5%).
| Income | Male | Female |
| $2,499 or less | 0 (0.0%) | 0 (0.0%) |
| $2,500 to $4,999 | 11 (13.6%) | 6 (7.1%) |
| $5,000 to $7,499 | 5 (6.2%) | 0 (0.0%) |
| $7,500 to $9,999 | 0 (0.0%) | 0 (0.0%) |
| $10,000 to $12,499 | 0 (0.0%) | 0 (0.0%) |
| $12,500 to $14,999 | 0 (0.0%) | 0 (0.0%) |
| $15,000 to $17,499 | 0 (0.0%) | 0 (0.0%) |
| $17,500 to $19,999 | 0 (0.0%) | 0 (0.0%) |
| $20,000 to $22,499 | 0 (0.0%) | 4 (4.7%) |
| $22,500 to $24,999 | 0 (0.0%) | 29 (34.1%) |
| $25,000 to $29,999 | 0 (0.0%) | 0 (0.0%) |
| $30,000 to $34,999 | 0 (0.0%) | 31 (36.5%) |
| $35,000 to $39,999 | 0 (0.0%) | 0 (0.0%) |
| $40,000 to $44,999 | 0 (0.0%) | 0 (0.0%) |
| $45,000 to $49,999 | 0 (0.0%) | 0 (0.0%) |
| $50,000 to $54,999 | 24 (29.6%) | 0 (0.0%) |
| $55,000 to $64,999 | 0 (0.0%) | 8 (9.4%) |
| $65,000 to $74,999 | 0 (0.0%) | 7 (8.2%) |
| $75,000 to $99,999 | 8 (9.9%) | 0 (0.0%) |
| $100,000+ | 33 (40.7%) | 0 (0.0%) |
| Total | 81 (100.0%) | 85 (100.0%) |
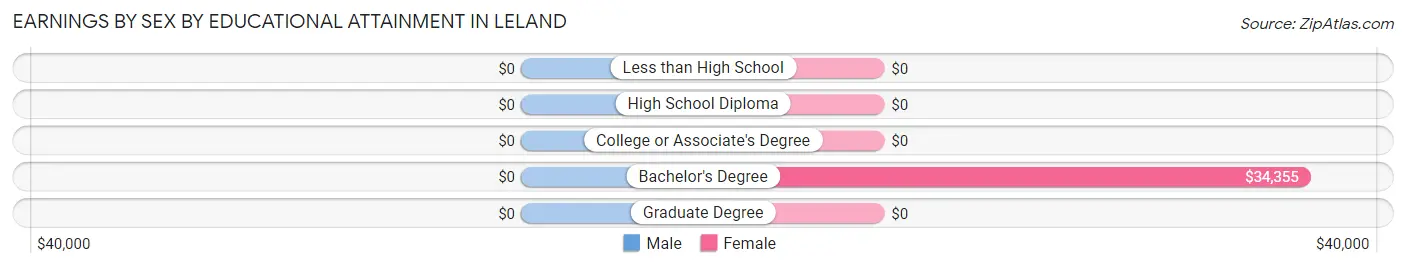
Earnings by Sex by Educational Attainment in Leland
| Educational Attainment | Male Income | Female Income |
| Less than High School | - | - |
| High School Diploma | - | - |
| College or Associate's Degree | - | - |
| Bachelor's Degree | - | - |
| Graduate Degree | - | - |
| Total | $105,313 | $33,952 |
Family Income in Leland
Family Income Brackets in Leland
According to the Leland family income data, there are 45 families falling into the $75,000 to $99,999 income range, which is the most common income bracket and makes up 48.9% of all families.
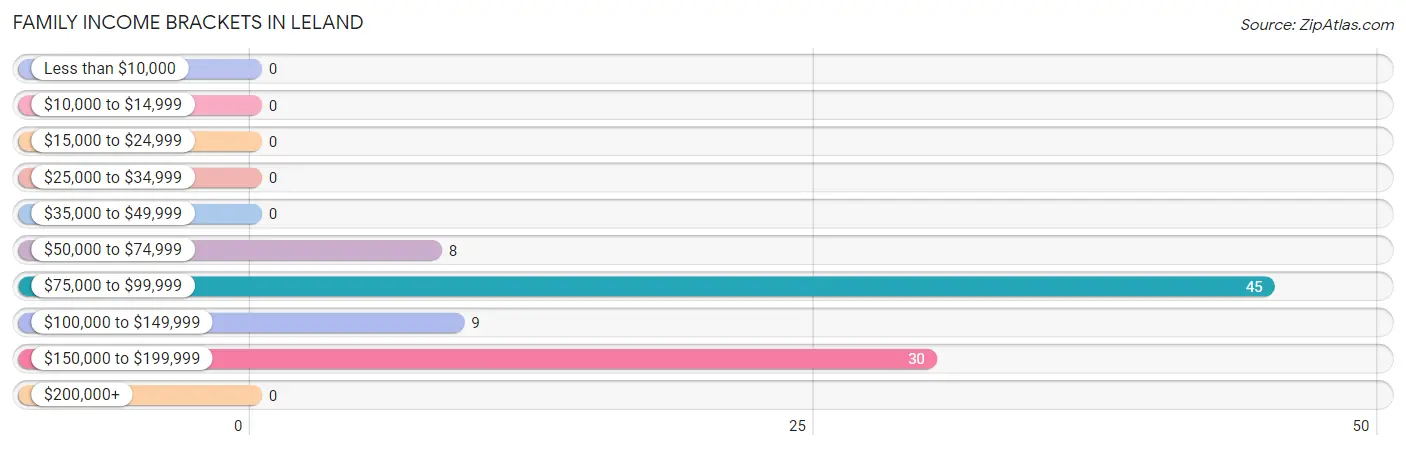
| Income Bracket | # Families | % Families |
| Less than $10,000 | 0 | 0.0% |
| $10,000 to $14,999 | 0 | 0.0% |
| $15,000 to $24,999 | 0 | 0.0% |
| $25,000 to $34,999 | 0 | 0.0% |
| $35,000 to $49,999 | 0 | 0.0% |
| $50,000 to $74,999 | 8 | 8.7% |
| $75,000 to $99,999 | 45 | 48.9% |
| $100,000 to $149,999 | 9 | 9.8% |
| $150,000 to $199,999 | 30 | 32.6% |
| $200,000+ | 0 | 0.0% |
Family Income by Famaliy Size in Leland
3-person families (51 | 55.4%) account for the highest median family income in Leland with $158,162 per family, while 3-person families (51 | 55.4%) have the highest median income of $52,721 per family member.
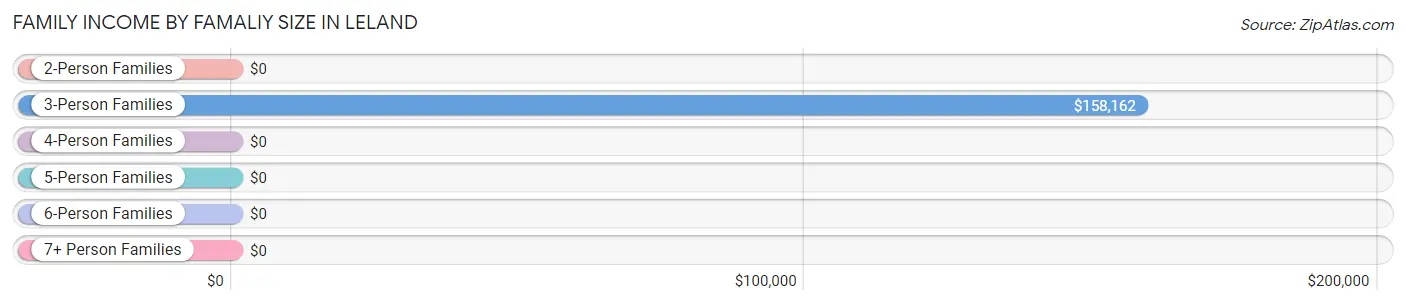
| Income Bracket | # Families | Median Income |
| 2-Person Families | 13 (14.1%) | $0 |
| 3-Person Families | 51 (55.4%) | $158,162 |
| 4-Person Families | 28 (30.4%) | $0 |
| 5-Person Families | 0 (0.0%) | $0 |
| 6-Person Families | 0 (0.0%) | $0 |
| 7+ Person Families | 0 (0.0%) | $0 |
| Total | 92 (100.0%) | $99,167 |
Family Income by Number of Earners in Leland
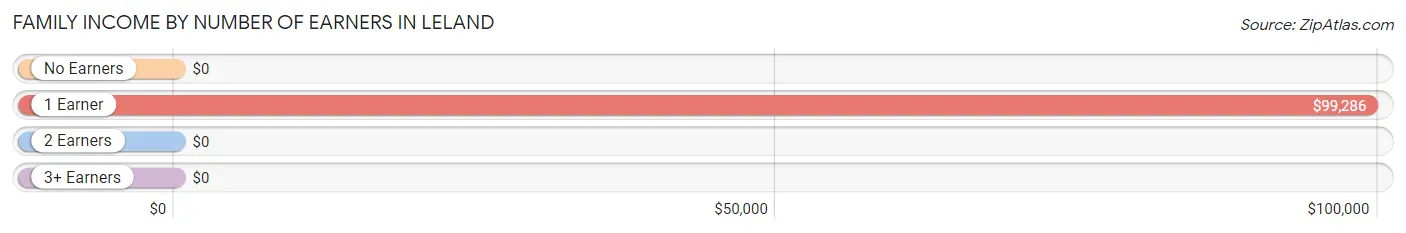
| Number of Earners | # Families | Median Income |
| No Earners | 5 (5.4%) | $0 |
| 1 Earner | 46 (50.0%) | $99,286 |
| 2 Earners | 12 (13.0%) | $0 |
| 3+ Earners | 29 (31.5%) | $0 |
| Total | 92 (100.0%) | $99,167 |
Household Income in Leland
Household Income Brackets in Leland
With 45 households falling in the category, the $75,000 to $99,999 income range is the most frequent in Leland, accounting for 27.3% of all households.
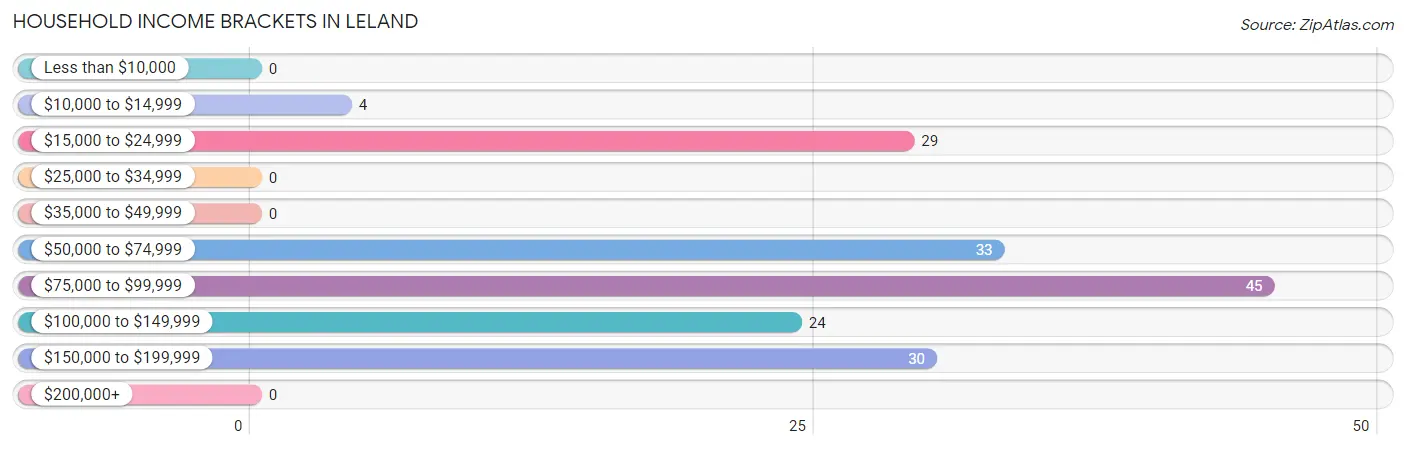
| Income Bracket | # Households | % Households |
| Less than $10,000 | 0 | 0.0% |
| $10,000 to $14,999 | 4 | 2.4% |
| $15,000 to $24,999 | 29 | 17.6% |
| $25,000 to $34,999 | 0 | 0.0% |
| $35,000 to $49,999 | 0 | 0.0% |
| $50,000 to $74,999 | 33 | 20.0% |
| $75,000 to $99,999 | 45 | 27.3% |
| $100,000 to $149,999 | 24 | 14.5% |
| $150,000 to $199,999 | 30 | 18.2% |
| $200,000+ | 0 | 0.0% |
Household Income by Householder Age in Leland
The median household income in Leland is $96,719, with the highest median household income of $117,667 found in the 65+ years age bracket for the primary householder. A total of 62 households (37.6%) fall into this category. Meanwhile, the 15 to 24 years age bracket for the primary householder has the lowest median household income of $0, with 29 households (17.6%) in this group.
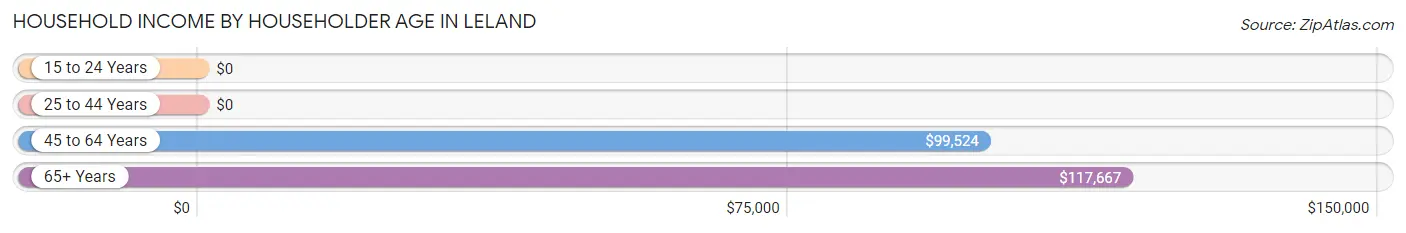
| Income Bracket | # Households | Median Income |
| 15 to 24 Years | 29 (17.6%) | $0 |
| 25 to 44 Years | 32 (19.4%) | $0 |
| 45 to 64 Years | 42 (25.5%) | $99,524 |
| 65+ Years | 62 (37.6%) | $117,667 |
| Total | 165 (100.0%) | $96,719 |
Poverty in Leland
Income Below Poverty by Sex and Age in Leland
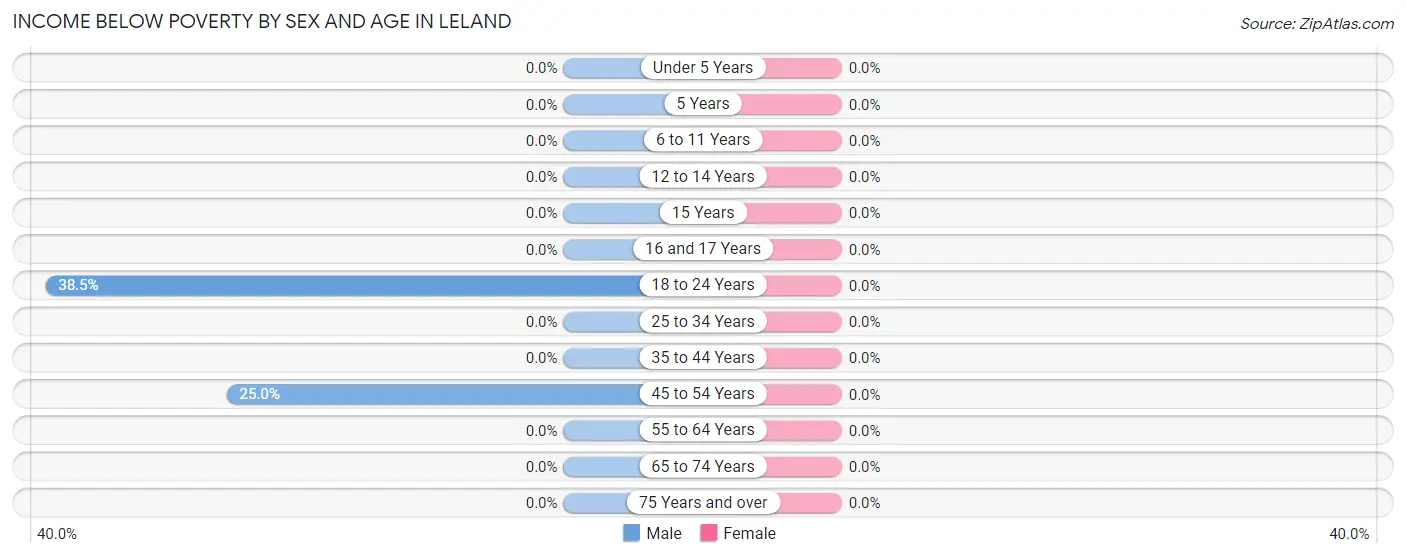
| Age Bracket | Male | Female |
| Under 5 Years | 0 (0.0%) | 0 (0.0%) |
| 5 Years | 0 (0.0%) | 0 (0.0%) |
| 6 to 11 Years | 0 (0.0%) | 0 (0.0%) |
| 12 to 14 Years | 0 (0.0%) | 0 (0.0%) |
| 15 Years | 0 (0.0%) | 0 (0.0%) |
| 16 and 17 Years | 0 (0.0%) | 0 (0.0%) |
| 18 to 24 Years | 10 (38.5%) | 0 (0.0%) |
| 25 to 34 Years | 0 (0.0%) | 0 (0.0%) |
| 35 to 44 Years | 0 (0.0%) | 0 (0.0%) |
| 45 to 54 Years | 4 (25.0%) | 0 (0.0%) |
| 55 to 64 Years | 0 (0.0%) | 0 (0.0%) |
| 65 to 74 Years | 0 (0.0%) | 0 (0.0%) |
| 75 Years and over | 0 (0.0%) | 0 (0.0%) |
| Total | 14 (8.2%) | 0 (0.0%) |
Income Above Poverty by Sex and Age in Leland
According to the poverty statistics in Leland, males aged 6 to 11 years and females aged 6 to 11 years are the age groups that are most secure financially, with 100.0% of males and 100.0% of females in these age groups living above the poverty line.
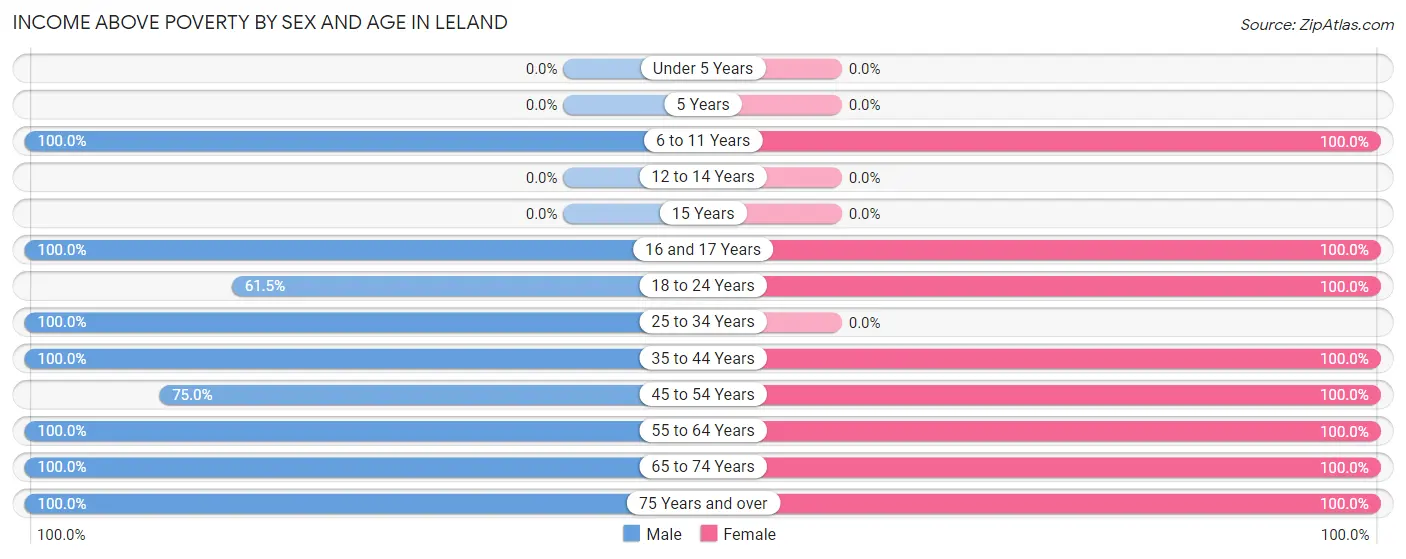
| Age Bracket | Male | Female |
| Under 5 Years | 0 (0.0%) | 0 (0.0%) |
| 5 Years | 0 (0.0%) | 0 (0.0%) |
| 6 to 11 Years | 5 (100.0%) | 8 (100.0%) |
| 12 to 14 Years | 0 (0.0%) | 0 (0.0%) |
| 15 Years | 0 (0.0%) | 0 (0.0%) |
| 16 and 17 Years | 12 (100.0%) | 9 (100.0%) |
| 18 to 24 Years | 16 (61.5%) | 29 (100.0%) |
| 25 to 34 Years | 24 (100.0%) | 0 (0.0%) |
| 35 to 44 Years | 24 (100.0%) | 18 (100.0%) |
| 45 to 54 Years | 12 (75.0%) | 11 (100.0%) |
| 55 to 64 Years | 24 (100.0%) | 27 (100.0%) |
| 65 to 74 Years | 34 (100.0%) | 17 (100.0%) |
| 75 Years and over | 5 (100.0%) | 53 (100.0%) |
| Total | 156 (91.8%) | 172 (100.0%) |
Income Below Poverty Among Married-Couple Families in Leland
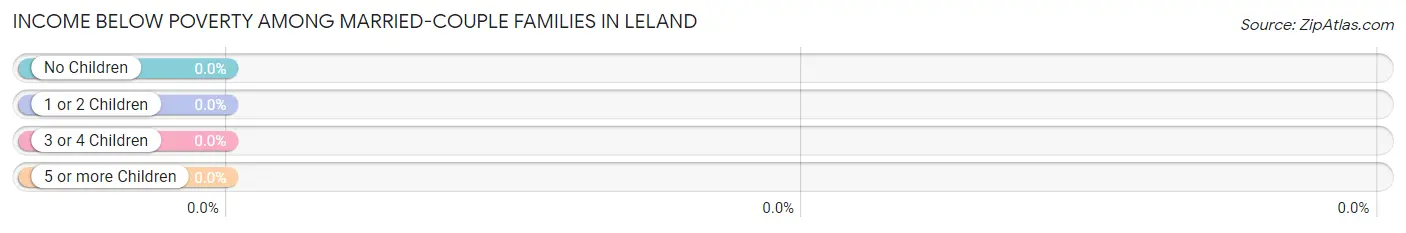
| Children | Above Poverty | Below Poverty |
| No Children | 48 (100.0%) | 0 (0.0%) |
| 1 or 2 Children | 36 (100.0%) | 0 (0.0%) |
| 3 or 4 Children | 0 (0.0%) | 0 (0.0%) |
| 5 or more Children | 0 (0.0%) | 0 (0.0%) |
| Total | 84 (100.0%) | 0 (0.0%) |
Income Below Poverty Among Single-Parent Households in Leland
| Children | Single Father | Single Mother |
| No Children | 0 (0.0%) | 0 (0.0%) |
| 1 or 2 Children | 0 (0.0%) | 0 (0.0%) |
| 3 or 4 Children | 0 (0.0%) | 0 (0.0%) |
| 5 or more Children | 0 (0.0%) | 0 (0.0%) |
| Total | 0 (0.0%) | 0 (0.0%) |
Income Below Poverty Among Married-Couple vs Single-Parent Households in Leland
| Children | Married-Couple Families | Single-Parent Households |
| No Children | 0 (0.0%) | 0 (0.0%) |
| 1 or 2 Children | 0 (0.0%) | 0 (0.0%) |
| 3 or 4 Children | 0 (0.0%) | 0 (0.0%) |
| 5 or more Children | 0 (0.0%) | 0 (0.0%) |
| Total | 0 (0.0%) | 0 (0.0%) |
Race in Leland
The most populous races in Leland are White / Caucasian (294 | 83.5%), Hispanic or Latino (86 | 24.4%), and Two or more Races (48 | 13.6%).
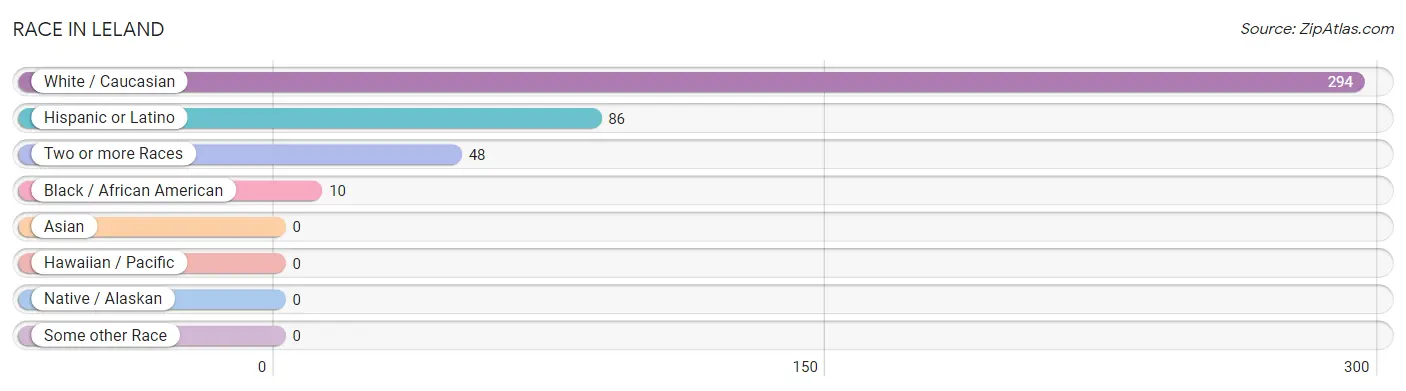
| Race | # Population | % Population |
| Asian | 0 | 0.0% |
| Black / African American | 10 | 2.8% |
| Hawaiian / Pacific | 0 | 0.0% |
| Hispanic or Latino | 86 | 24.4% |
| Native / Alaskan | 0 | 0.0% |
| White / Caucasian | 294 | 83.5% |
| Two or more Races | 48 | 13.6% |
| Some other Race | 0 | 0.0% |
| Total | 352 | 100.0% |
Ancestry in Leland
The most populous ancestries reported in Leland are German (51 | 14.5%), Spaniard (47 | 13.4%), Scandinavian (44 | 12.5%), Mexican (39 | 11.1%), and English (35 | 9.9%), together accounting for 61.4% of all Leland residents.
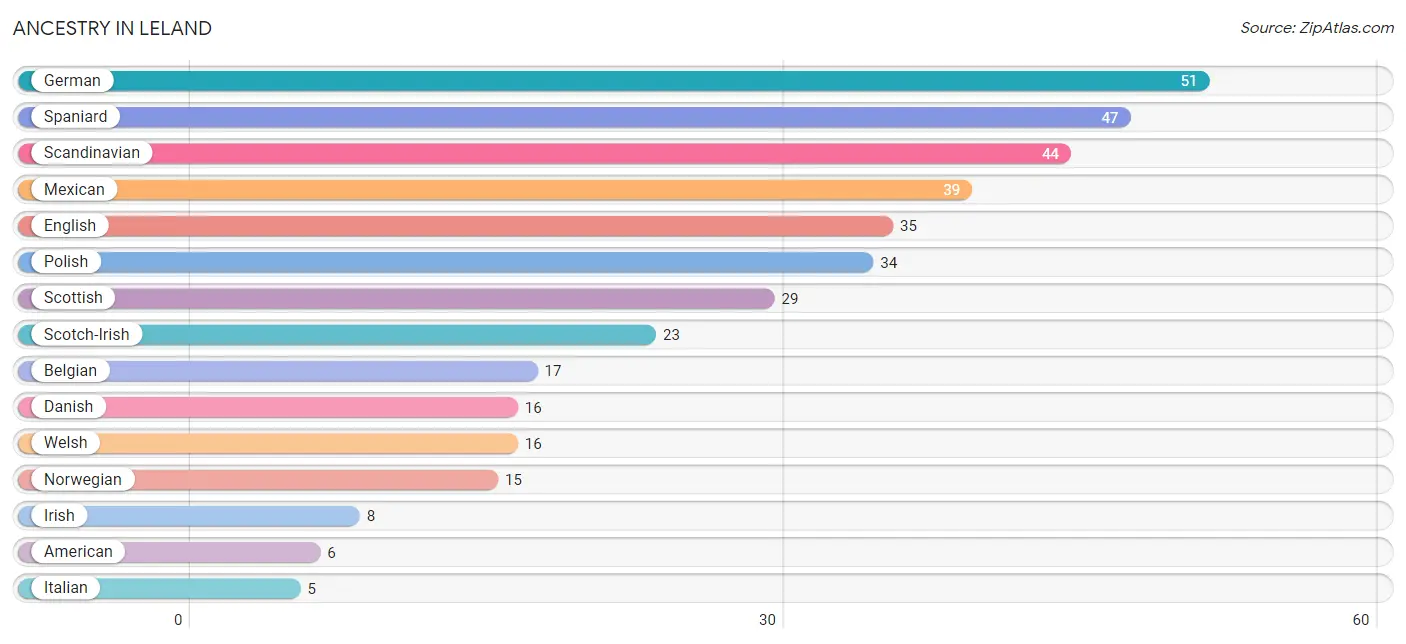
| Ancestry | # Population | % Population |
| American | 6 | 1.7% |
| Belgian | 17 | 4.8% |
| Bulgarian | 4 | 1.1% |
| Cherokee | 1 | 0.3% |
| Danish | 16 | 4.5% |
| English | 35 | 9.9% |
| German | 51 | 14.5% |
| Irish | 8 | 2.3% |
| Italian | 5 | 1.4% |
| Mexican | 39 | 11.1% |
| Norwegian | 15 | 4.3% |
| Polish | 34 | 9.7% |
| Russian | 5 | 1.4% |
| Scandinavian | 44 | 12.5% |
| Scotch-Irish | 23 | 6.5% |
| Scottish | 29 | 8.2% |
| Spaniard | 47 | 13.4% |
| Swedish | 5 | 1.4% |
| Welsh | 16 | 4.5% | View All 19 Rows |
Immigrants in Leland
The most numerous immigrant groups reported in Leland came from Eastern Europe (5 | 1.4%), Europe (5 | 1.4%), and Russia (5 | 1.4%), together accounting for 4.3% of all Leland residents.
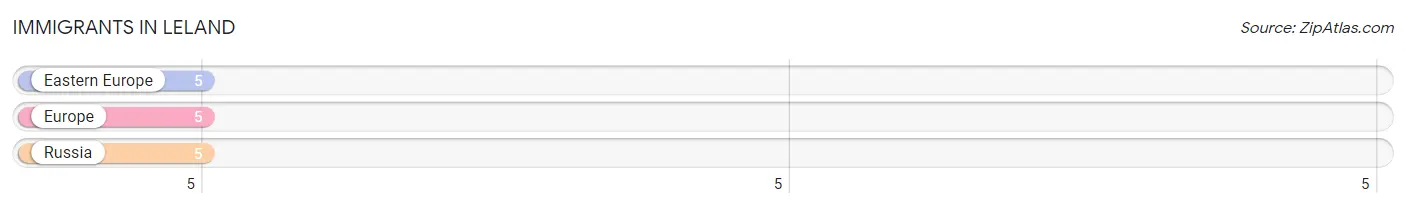
| Immigration Origin | # Population | % Population |
| Eastern Europe | 5 | 1.4% |
| Europe | 5 | 1.4% |
| Russia | 5 | 1.4% | View All 3 Rows |
Sex and Age in Leland
Sex and Age in Leland
The most populous age groups in Leland are 70 to 74 Years (35 | 20.1%) for men and 85 Years and over (35 | 19.7%) for women.
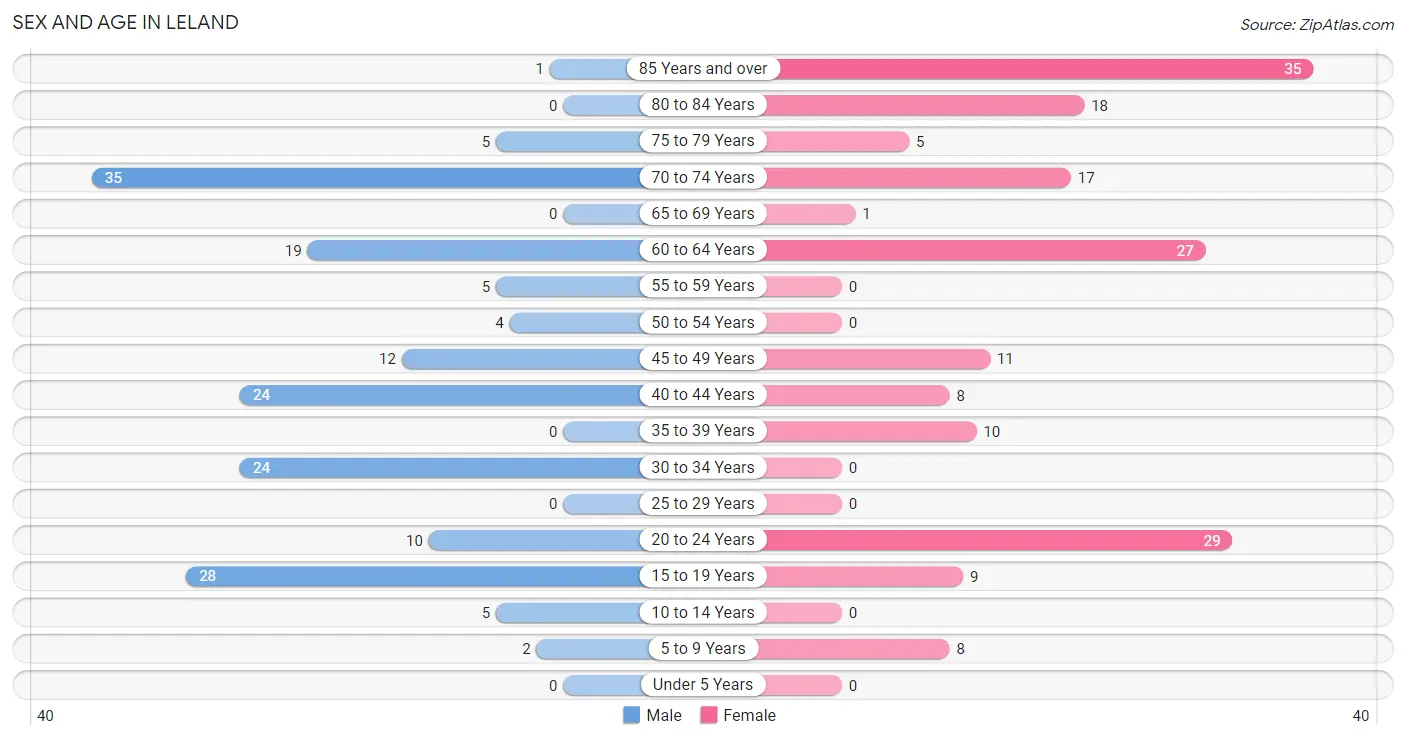
| Age Bracket | Male | Female |
| Under 5 Years | 0 (0.0%) | 0 (0.0%) |
| 5 to 9 Years | 2 (1.1%) | 8 (4.5%) |
| 10 to 14 Years | 5 (2.9%) | 0 (0.0%) |
| 15 to 19 Years | 28 (16.1%) | 9 (5.1%) |
| 20 to 24 Years | 10 (5.8%) | 29 (16.3%) |
| 25 to 29 Years | 0 (0.0%) | 0 (0.0%) |
| 30 to 34 Years | 24 (13.8%) | 0 (0.0%) |
| 35 to 39 Years | 0 (0.0%) | 10 (5.6%) |
| 40 to 44 Years | 24 (13.8%) | 8 (4.5%) |
| 45 to 49 Years | 12 (6.9%) | 11 (6.2%) |
| 50 to 54 Years | 4 (2.3%) | 0 (0.0%) |
| 55 to 59 Years | 5 (2.9%) | 0 (0.0%) |
| 60 to 64 Years | 19 (10.9%) | 27 (15.2%) |
| 65 to 69 Years | 0 (0.0%) | 1 (0.6%) |
| 70 to 74 Years | 35 (20.1%) | 17 (9.6%) |
| 75 to 79 Years | 5 (2.9%) | 5 (2.8%) |
| 80 to 84 Years | 0 (0.0%) | 18 (10.1%) |
| 85 Years and over | 1 (0.6%) | 35 (19.7%) |
| Total | 174 (100.0%) | 178 (100.0%) |
Families and Households in Leland
Median Family Size in Leland
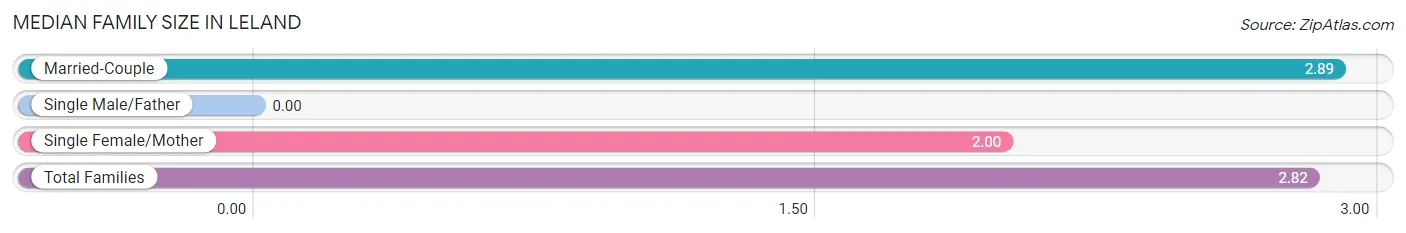
| Family Type | # Families | Family Size |
| Married-Couple | 84 (91.3%) | 2.89 |
| Single Male/Father | 0 (0.0%) | - |
| Single Female/Mother | 8 (8.7%) | 2.00 |
| Total Families | 92 (100.0%) | 2.82 |
Median Household Size in Leland
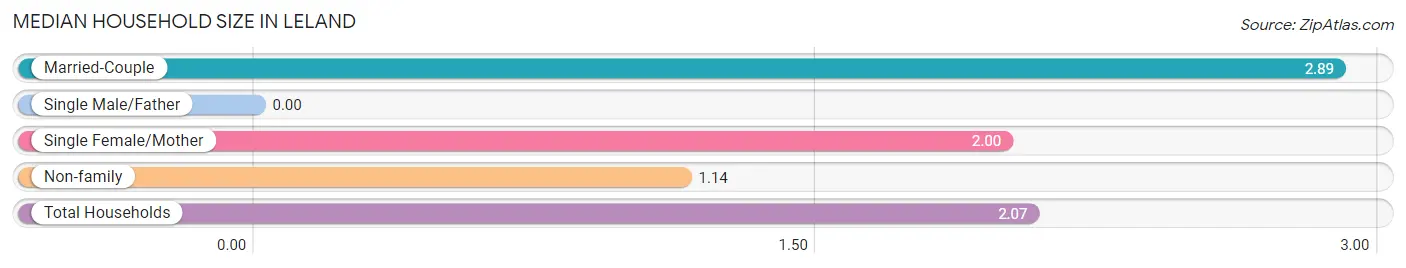
| Household Type | # Households | Household Size |
| Married-Couple | 84 (50.9%) | 2.89 |
| Single Male/Father | 0 (0.0%) | - |
| Single Female/Mother | 8 (4.9%) | 2.00 |
| Non-family | 73 (44.2%) | 1.14 |
| Total Households | 165 (100.0%) | 2.07 |
Household Size by Marriage Status in Leland
Out of a total of 165 households in Leland, 92 (55.8%) are family households, while 73 (44.2%) are nonfamily households. The most numerous type of family households are 3-person households, comprising 51, and the most common type of nonfamily households are 1-person households, comprising 44.
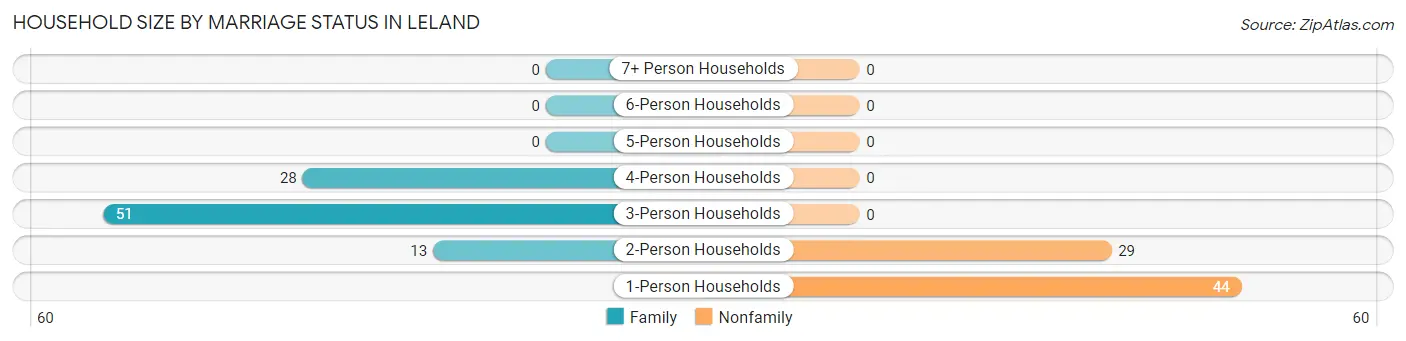
| Household Size | Family Households | Nonfamily Households |
| 1-Person Households | - | 44 (26.7%) |
| 2-Person Households | 13 (7.9%) | 29 (17.6%) |
| 3-Person Households | 51 (30.9%) | 0 (0.0%) |
| 4-Person Households | 28 (17.0%) | 0 (0.0%) |
| 5-Person Households | 0 (0.0%) | 0 (0.0%) |
| 6-Person Households | 0 (0.0%) | 0 (0.0%) |
| 7+ Person Households | 0 (0.0%) | 0 (0.0%) |
| Total | 92 (55.8%) | 73 (44.2%) |
Female Fertility in Leland
Fertility by Age in Leland
| Age Bracket | Women with Births | Births / 1,000 Women |
| 15 to 19 years | 0 (0.0%) | 0.0 |
| 20 to 34 years | 0 (0.0%) | 0.0 |
| 35 to 50 years | 0 (0.0%) | 0.0 |
| Total | 0 (0.0%) | 0.0 |
Fertility by Age by Marriage Status in Leland
| Age Bracket | Married | Unmarried |
| 15 to 19 years | 0 (0.0%) | 0 (0.0%) |
| 20 to 34 years | 0 (0.0%) | 0 (0.0%) |
| 35 to 50 years | 0 (0.0%) | 0 (0.0%) |
| Total | 0 (0.0%) | 0 (0.0%) |
Fertility by Education in Leland
| Educational Attainment | Women with Births | Births / 1,000 Women |
| Less than High School | 0 (0.0%) | 0.0 |
| High School Diploma | 0 (0.0%) | 0.0 |
| College or Associate's Degree | 0 (0.0%) | 0.0 |
| Bachelor's Degree | 0 (0.0%) | 0.0 |
| Graduate Degree | 0 (0.0%) | 0.0 |
| Total | 0 (0.0%) | 0.0 |
Fertility by Education by Marriage Status in Leland
| Educational Attainment | Married | Unmarried |
| Less than High School | 0 (0.0%) | 0 (0.0%) |
| High School Diploma | 0 (0.0%) | 0 (0.0%) |
| College or Associate's Degree | 0 (0.0%) | 0 (0.0%) |
| Bachelor's Degree | 0 (0.0%) | 0 (0.0%) |
| Graduate Degree | 0 (0.0%) | 0 (0.0%) |
| Total | 0 (0.0%) | 0 (0.0%) |
Employment Characteristics in Leland
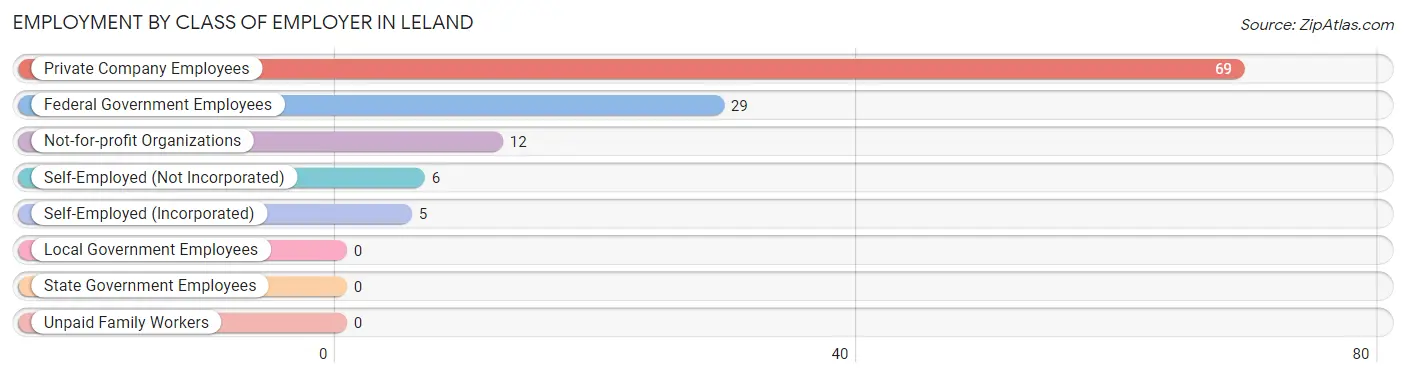
Employment by Class of Employer in Leland
Among the 121 employed individuals in Leland, private company employees (69 | 57.0%), federal government employees (29 | 24.0%), and not-for-profit organizations (12 | 9.9%) make up the most common classes of employment.
| Employer Class | # Employees | % Employees |
| Private Company Employees | 69 | 57.0% |
| Self-Employed (Incorporated) | 5 | 4.1% |
| Self-Employed (Not Incorporated) | 6 | 5.0% |
| Not-for-profit Organizations | 12 | 9.9% |
| Local Government Employees | 0 | 0.0% |
| State Government Employees | 0 | 0.0% |
| Federal Government Employees | 29 | 24.0% |
| Unpaid Family Workers | 0 | 0.0% |
| Total | 121 | 100.0% |
Employment Status by Age in Leland
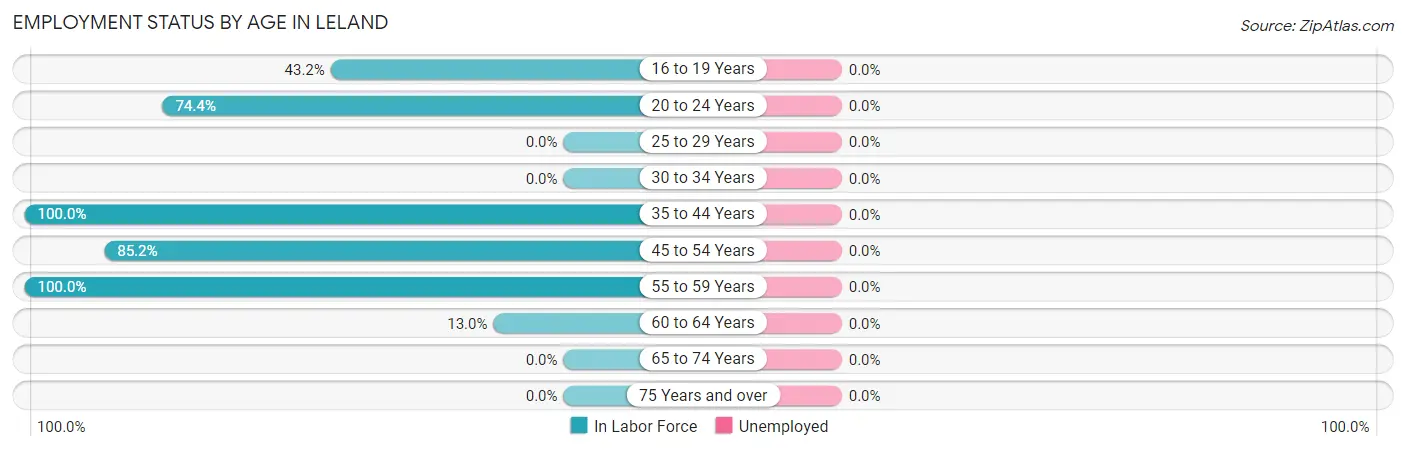
| Age Bracket | In Labor Force | Unemployed |
| 16 to 19 Years | 16 (43.2%) | 0 (0.0%) |
| 20 to 24 Years | 29 (74.4%) | 0 (0.0%) |
| 25 to 29 Years | 0 (0.0%) | 0 (0.0%) |
| 30 to 34 Years | 0 (0.0%) | 0 (0.0%) |
| 35 to 44 Years | 42 (100.0%) | 0 (0.0%) |
| 45 to 54 Years | 23 (85.2%) | 0 (0.0%) |
| 55 to 59 Years | 5 (100.0%) | 0 (0.0%) |
| 60 to 64 Years | 6 (13.0%) | 0 (0.0%) |
| 65 to 74 Years | 0 (0.0%) | 0 (0.0%) |
| 75 Years and over | 0 (0.0%) | 0 (0.0%) |
| Total | 121 (35.9%) | 0 (0.0%) |
Employment Status by Educational Attainment in Leland
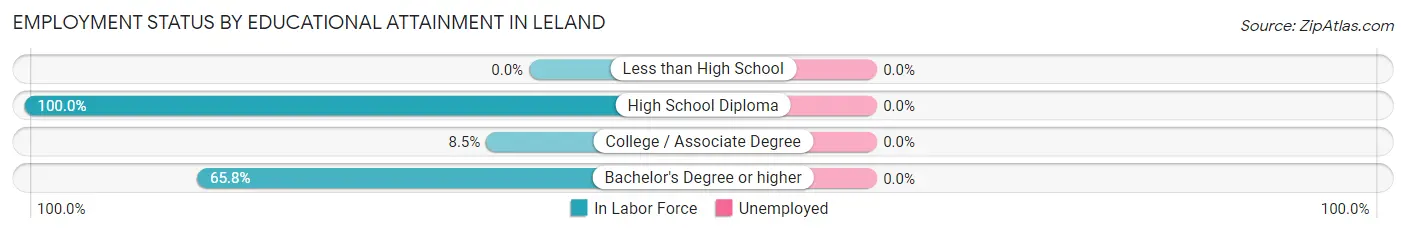
| Educational Attainment | In Labor Force | Unemployed |
| Less than High School | 0 (0.0%) | 0 (0.0%) |
| High School Diploma | 24 (100.0%) | 0 (0.0%) |
| College / Associate Degree | 4 (8.5%) | 0 (0.0%) |
| Bachelor's Degree or higher | 48 (65.8%) | 0 (0.0%) |
| Total | 76 (52.8%) | 0 (0.0%) |
Employment Occupations by Sex in Leland
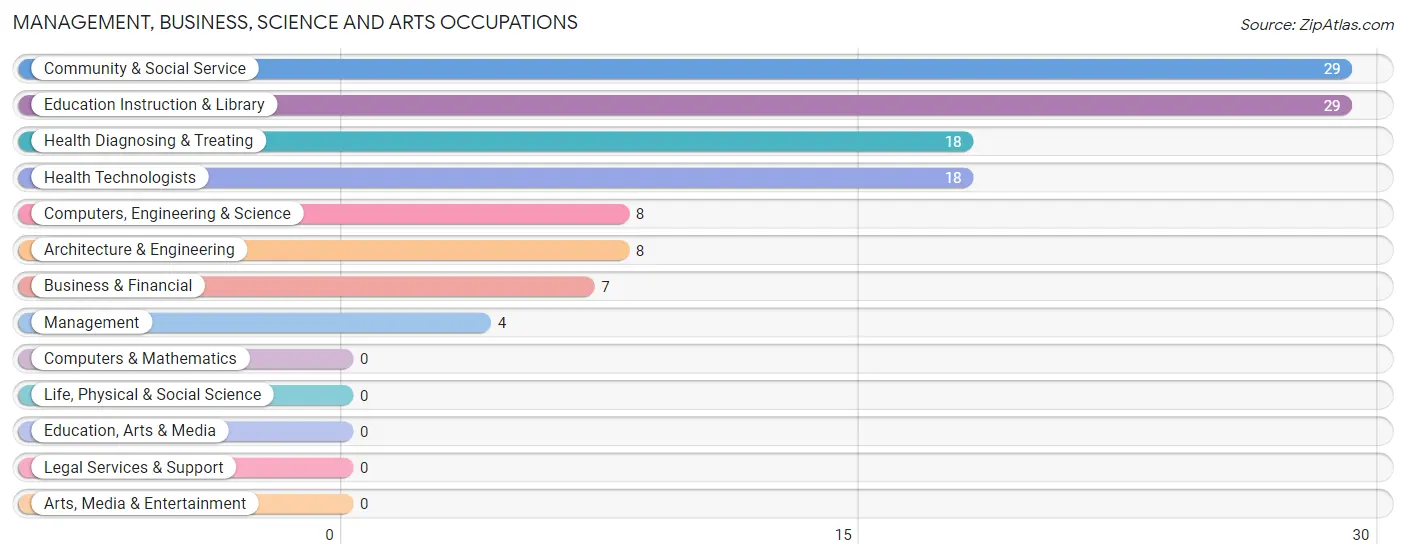
Management, Business, Science and Arts Occupations
The most common Management, Business, Science and Arts occupations in Leland are Community & Social Service (29 | 24.0%), Education Instruction & Library (29 | 24.0%), Health Diagnosing & Treating (18 | 14.9%), Health Technologists (18 | 14.9%), and Computers, Engineering & Science (8 | 6.6%).
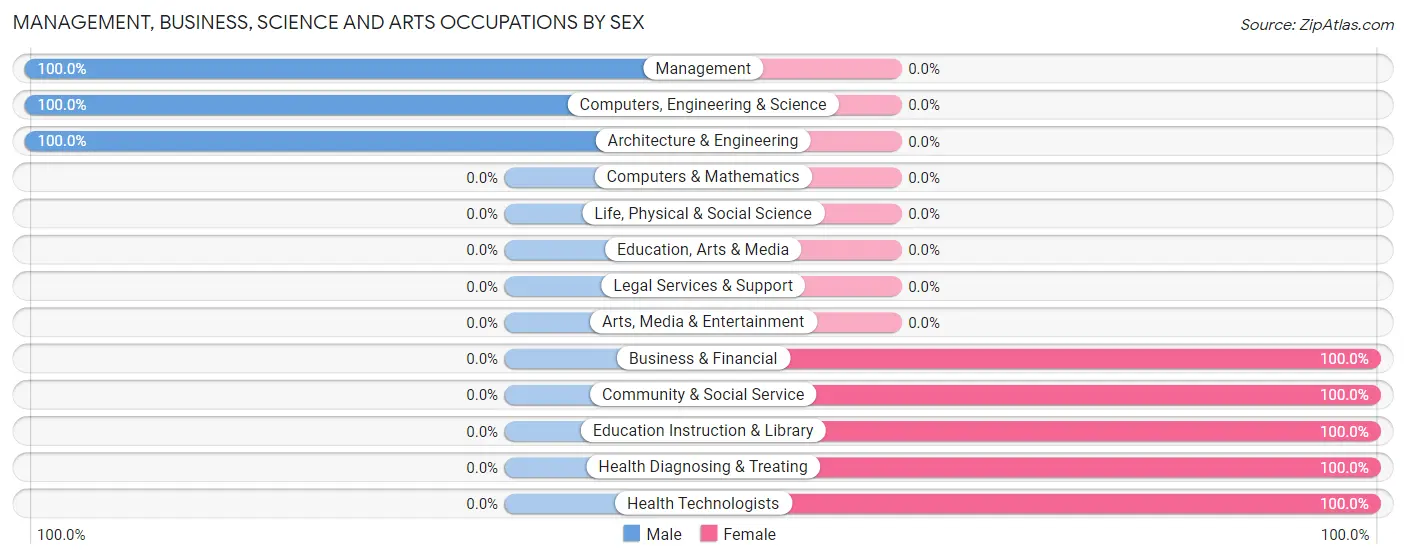
Management, Business, Science and Arts Occupations by Sex
Within the Management, Business, Science and Arts occupations in Leland, the most male-oriented occupations are Management (100.0%), Computers, Engineering & Science (100.0%), and Architecture & Engineering (100.0%), while the most female-oriented occupations are Business & Financial (100.0%), Community & Social Service (100.0%), and Education Instruction & Library (100.0%).
| Occupation | Male | Female |
| Management | 4 (100.0%) | 0 (0.0%) |
| Business & Financial | 0 (0.0%) | 7 (100.0%) |
| Computers, Engineering & Science | 8 (100.0%) | 0 (0.0%) |
| Computers & Mathematics | 0 (0.0%) | 0 (0.0%) |
| Architecture & Engineering | 8 (100.0%) | 0 (0.0%) |
| Life, Physical & Social Science | 0 (0.0%) | 0 (0.0%) |
| Community & Social Service | 0 (0.0%) | 29 (100.0%) |
| Education, Arts & Media | 0 (0.0%) | 0 (0.0%) |
| Legal Services & Support | 0 (0.0%) | 0 (0.0%) |
| Education Instruction & Library | 0 (0.0%) | 29 (100.0%) |
| Arts, Media & Entertainment | 0 (0.0%) | 0 (0.0%) |
| Health Diagnosing & Treating | 0 (0.0%) | 18 (100.0%) |
| Health Technologists | 0 (0.0%) | 18 (100.0%) |
| Total (Category) | 12 (18.2%) | 54 (81.8%) |
| Total (Overall) | 57 (47.1%) | 64 (52.9%) |
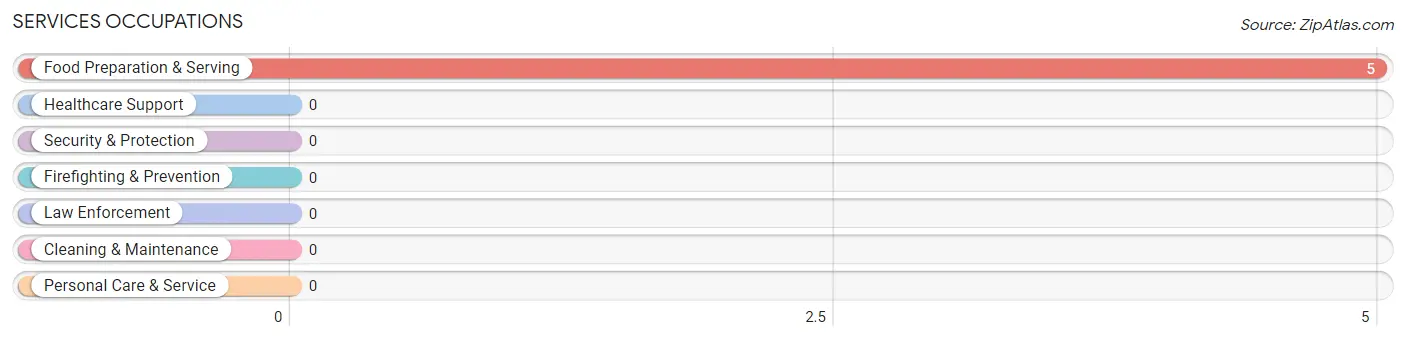
Services Occupations
The most common Services occupations in Leland are , and Food Preparation & Serving (5 | 4.1%).
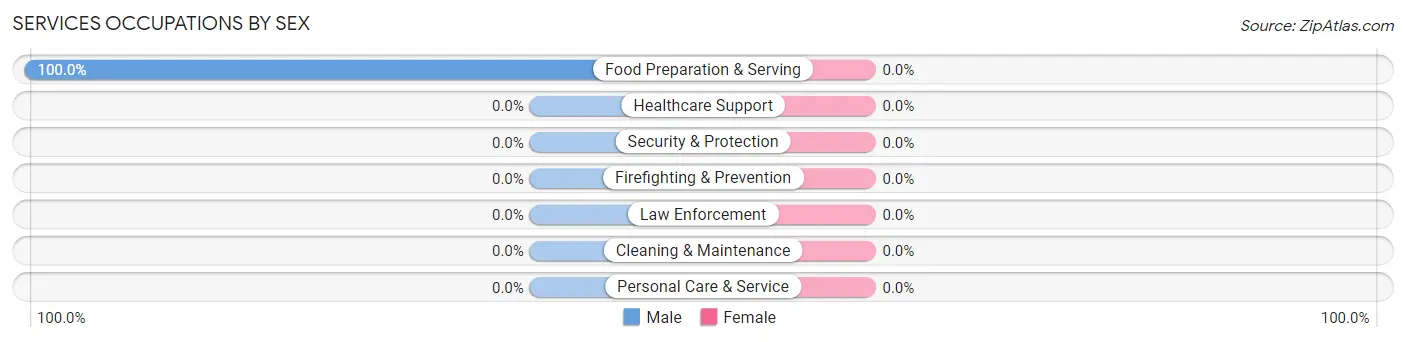
Services Occupations by Sex
| Occupation | Male | Female |
| Healthcare Support | 0 (0.0%) | 0 (0.0%) |
| Security & Protection | 0 (0.0%) | 0 (0.0%) |
| Firefighting & Prevention | 0 (0.0%) | 0 (0.0%) |
| Law Enforcement | 0 (0.0%) | 0 (0.0%) |
| Food Preparation & Serving | 5 (100.0%) | 0 (0.0%) |
| Cleaning & Maintenance | 0 (0.0%) | 0 (0.0%) |
| Personal Care & Service | 0 (0.0%) | 0 (0.0%) |
| Total (Category) | 5 (100.0%) | 0 (0.0%) |
| Total (Overall) | 57 (47.1%) | 64 (52.9%) |
Sales and Office Occupations
The most common Sales and Office occupations in Leland are Sales & Related (22 | 18.2%), and Office & Administration (4 | 3.3%).
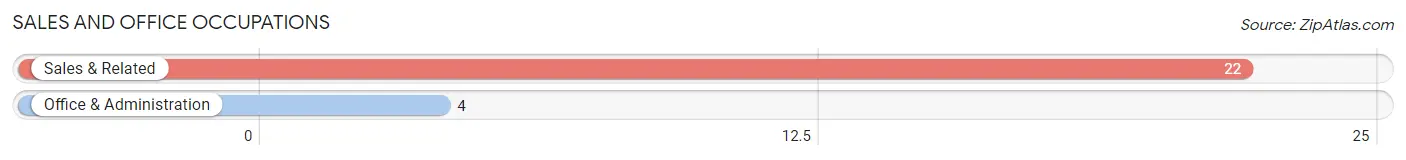
Sales and Office Occupations by Sex
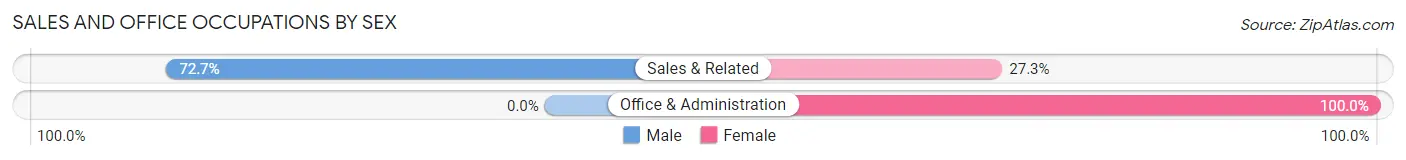
| Occupation | Male | Female |
| Sales & Related | 16 (72.7%) | 6 (27.3%) |
| Office & Administration | 0 (0.0%) | 4 (100.0%) |
| Total (Category) | 16 (61.5%) | 10 (38.5%) |
| Total (Overall) | 57 (47.1%) | 64 (52.9%) |
Natural Resources, Construction and Maintenance Occupations
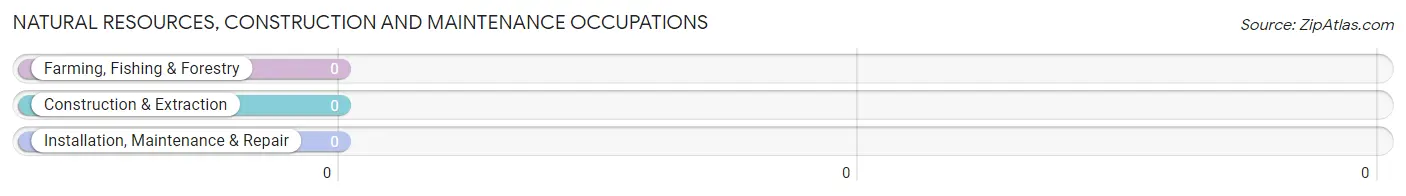
Natural Resources, Construction and Maintenance Occupations by Sex
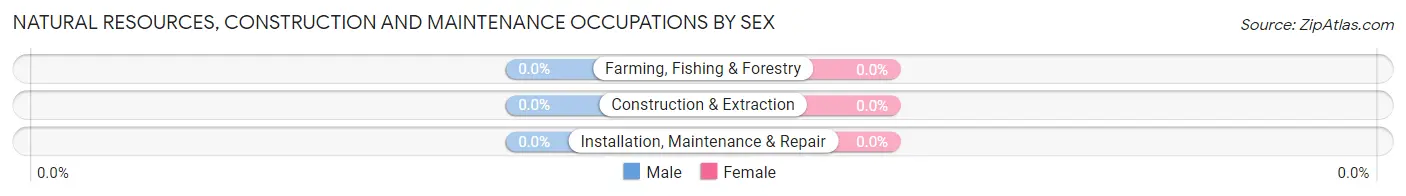
| Occupation | Male | Female |
| Farming, Fishing & Forestry | 0 (0.0%) | 0 (0.0%) |
| Construction & Extraction | 0 (0.0%) | 0 (0.0%) |
| Installation, Maintenance & Repair | 0 (0.0%) | 0 (0.0%) |
| Total (Category) | 0 (0.0%) | 0 (0.0%) |
| Total (Overall) | 57 (47.1%) | 64 (52.9%) |
Production, Transportation and Moving Occupations
The most common Production, Transportation and Moving occupations in Leland are , and Production (24 | 19.8%).
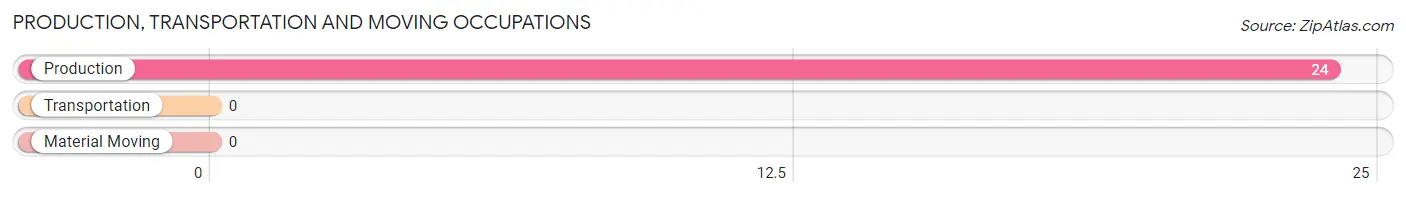
Production, Transportation and Moving Occupations by Sex
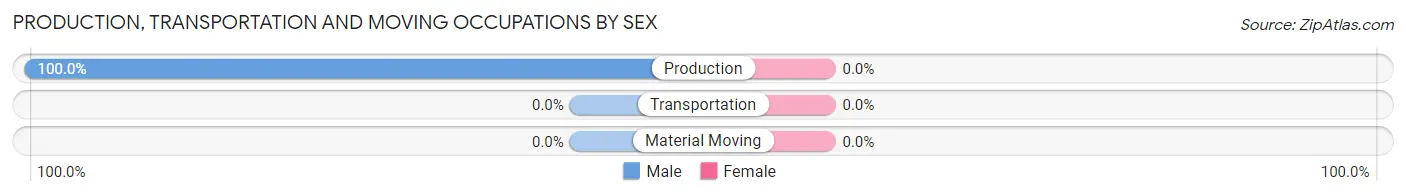
| Occupation | Male | Female |
| Production | 24 (100.0%) | 0 (0.0%) |
| Transportation | 0 (0.0%) | 0 (0.0%) |
| Material Moving | 0 (0.0%) | 0 (0.0%) |
| Total (Category) | 24 (100.0%) | 0 (0.0%) |
| Total (Overall) | 57 (47.1%) | 64 (52.9%) |
Employment Industries by Sex in Leland
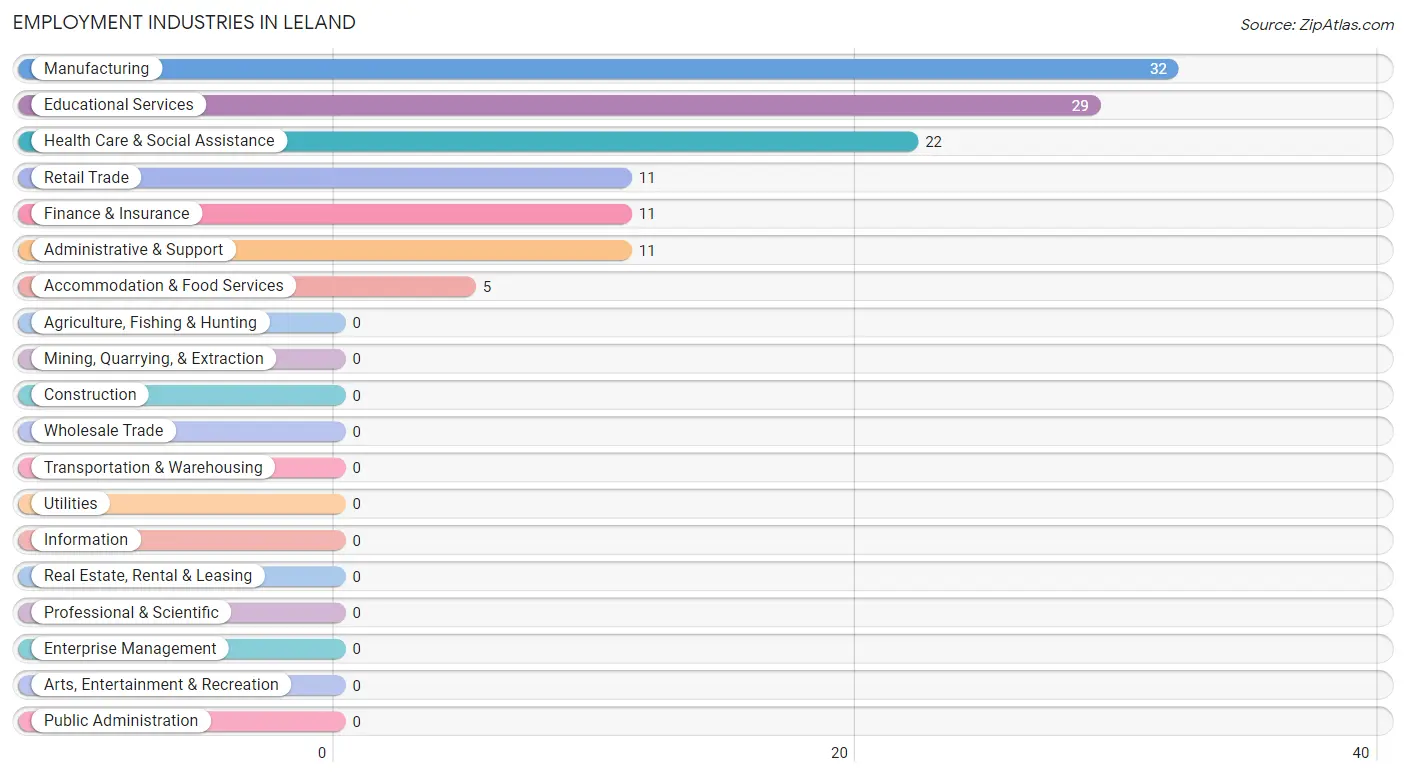
Employment Industries in Leland
The major employment industries in Leland include Manufacturing (32 | 26.5%), Educational Services (29 | 24.0%), Health Care & Social Assistance (22 | 18.2%), Retail Trade (11 | 9.1%), and Finance & Insurance (11 | 9.1%).
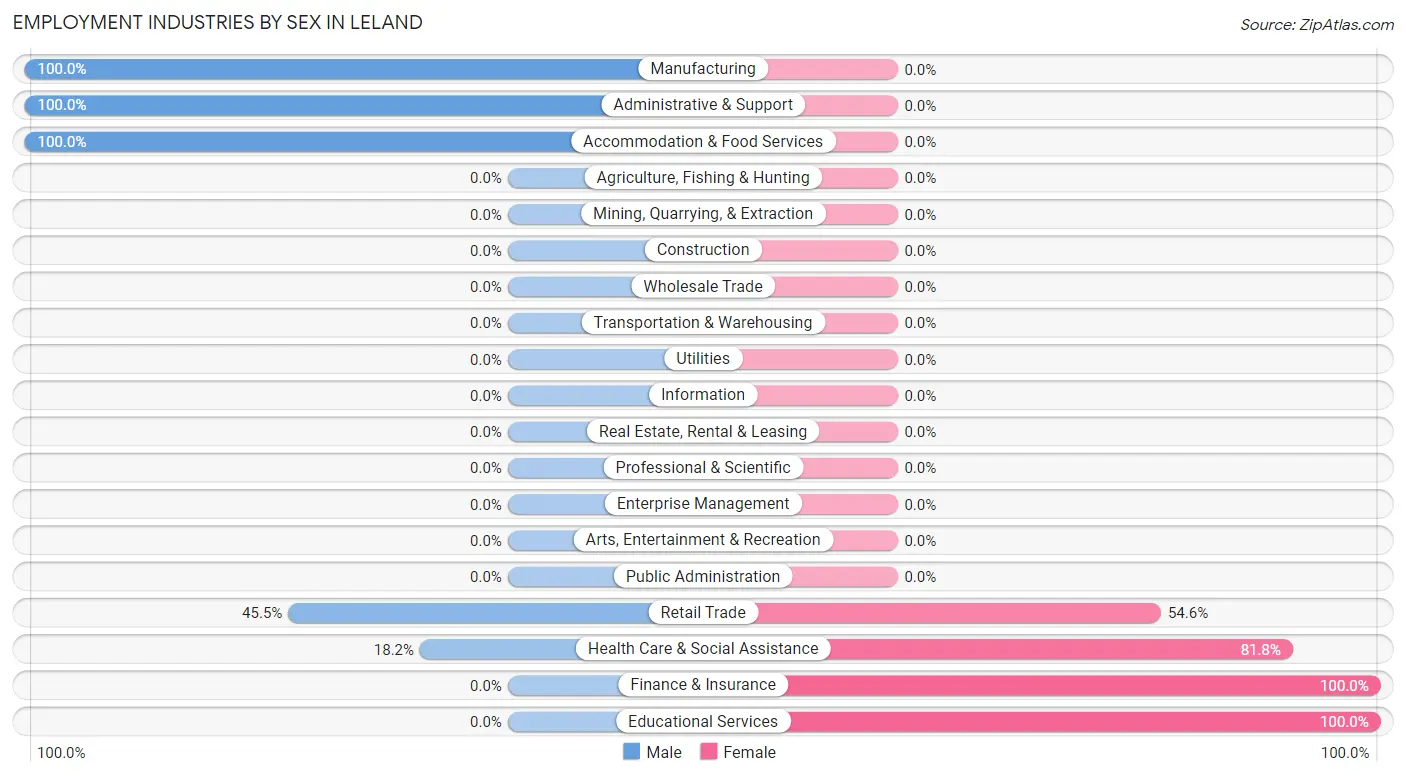
Employment Industries by Sex in Leland
The Leland industries that see more men than women are Manufacturing (100.0%), Administrative & Support (100.0%), and Accommodation & Food Services (100.0%), whereas the industries that tend to have a higher number of women are Finance & Insurance (100.0%), Educational Services (100.0%), and Health Care & Social Assistance (81.8%).
| Industry | Male | Female |
| Agriculture, Fishing & Hunting | 0 (0.0%) | 0 (0.0%) |
| Mining, Quarrying, & Extraction | 0 (0.0%) | 0 (0.0%) |
| Construction | 0 (0.0%) | 0 (0.0%) |
| Manufacturing | 32 (100.0%) | 0 (0.0%) |
| Wholesale Trade | 0 (0.0%) | 0 (0.0%) |
| Retail Trade | 5 (45.5%) | 6 (54.5%) |
| Transportation & Warehousing | 0 (0.0%) | 0 (0.0%) |
| Utilities | 0 (0.0%) | 0 (0.0%) |
| Information | 0 (0.0%) | 0 (0.0%) |
| Finance & Insurance | 0 (0.0%) | 11 (100.0%) |
| Real Estate, Rental & Leasing | 0 (0.0%) | 0 (0.0%) |
| Professional & Scientific | 0 (0.0%) | 0 (0.0%) |
| Enterprise Management | 0 (0.0%) | 0 (0.0%) |
| Administrative & Support | 11 (100.0%) | 0 (0.0%) |
| Educational Services | 0 (0.0%) | 29 (100.0%) |
| Health Care & Social Assistance | 4 (18.2%) | 18 (81.8%) |
| Arts, Entertainment & Recreation | 0 (0.0%) | 0 (0.0%) |
| Accommodation & Food Services | 5 (100.0%) | 0 (0.0%) |
| Public Administration | 0 (0.0%) | 0 (0.0%) |
| Total | 57 (47.1%) | 64 (52.9%) |
Education in Leland
School Enrollment in Leland
The most common levels of schooling among the 80 students in Leland are college / undergraduate (39 | 48.7%), high school (26 | 32.5%), and elementary school (10 | 12.5%).
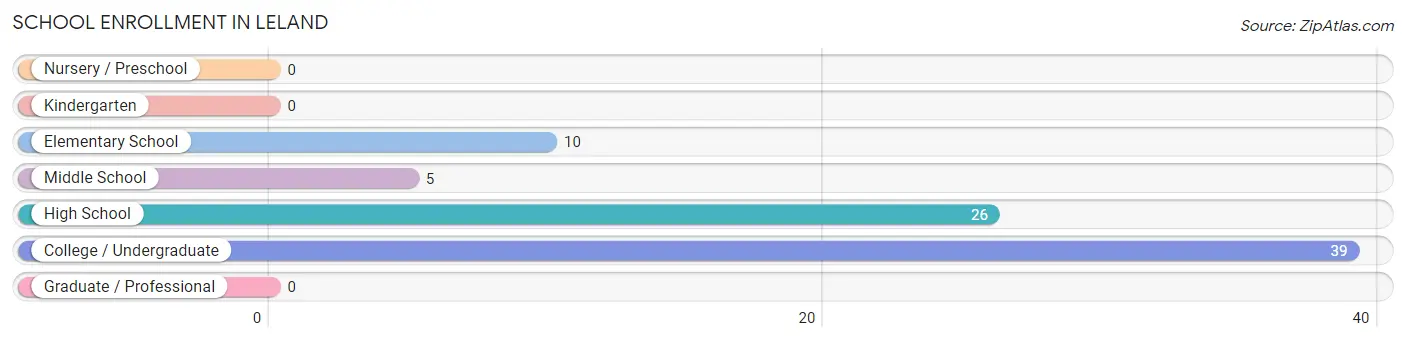
| School Level | # Students | % Students |
| Nursery / Preschool | 0 | 0.0% |
| Kindergarten | 0 | 0.0% |
| Elementary School | 10 | 12.5% |
| Middle School | 5 | 6.2% |
| High School | 26 | 32.5% |
| College / Undergraduate | 39 | 48.7% |
| Graduate / Professional | 0 | 0.0% |
| Total | 80 | 100.0% |
School Enrollment by Age by Funding Source in Leland
Out of a total of 80 students who are enrolled in schools in Leland, 2 (2.5%) attend a private institution, while the remaining 78 (97.5%) are enrolled in public schools. The age group of 5 to 9 year old has the highest likelihood of being enrolled in private schools, with 2 (20.0% in the age bracket) enrolled. Conversely, the age group of 10 to 14 year olds has the lowest likelihood of being enrolled in a private school, with 5 (100.0% in the age bracket) attending a public institution.
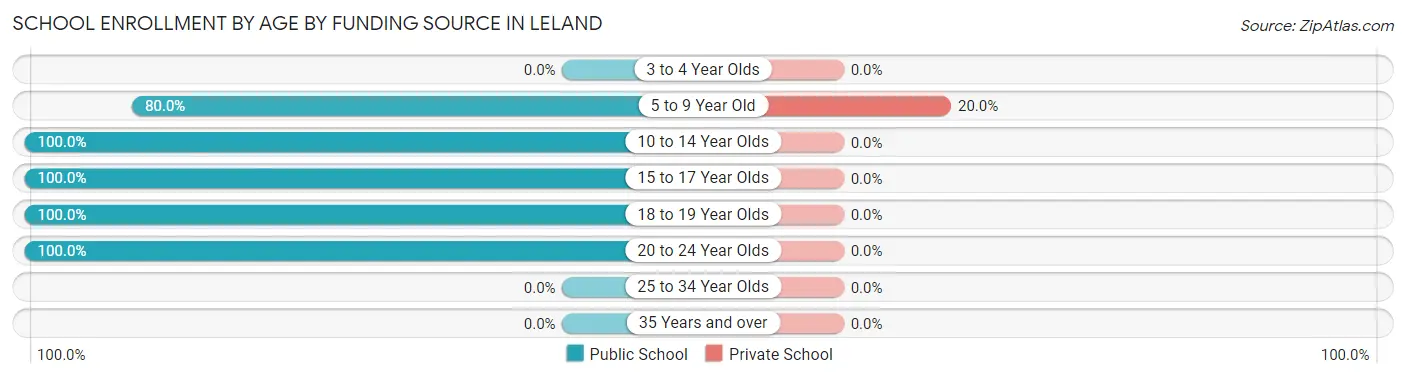
| Age Bracket | Public School | Private School |
| 3 to 4 Year Olds | 0 (0.0%) | 0 (0.0%) |
| 5 to 9 Year Old | 8 (80.0%) | 2 (20.0%) |
| 10 to 14 Year Olds | 5 (100.0%) | 0 (0.0%) |
| 15 to 17 Year Olds | 21 (100.0%) | 0 (0.0%) |
| 18 to 19 Year Olds | 5 (100.0%) | 0 (0.0%) |
| 20 to 24 Year Olds | 39 (100.0%) | 0 (0.0%) |
| 25 to 34 Year Olds | 0 (0.0%) | 0 (0.0%) |
| 35 Years and over | 0 (0.0%) | 0 (0.0%) |
| Total | 78 (97.5%) | 2 (2.5%) |
Educational Attainment by Field of Study in Leland
Education (44 | 29.7%), bio, nature & agricultural (19 | 12.8%), business (17 | 11.5%), social sciences (15 | 10.1%), and communications (10 | 6.8%) are the most common fields of study among 148 individuals in Leland who have obtained a bachelor's degree or higher.
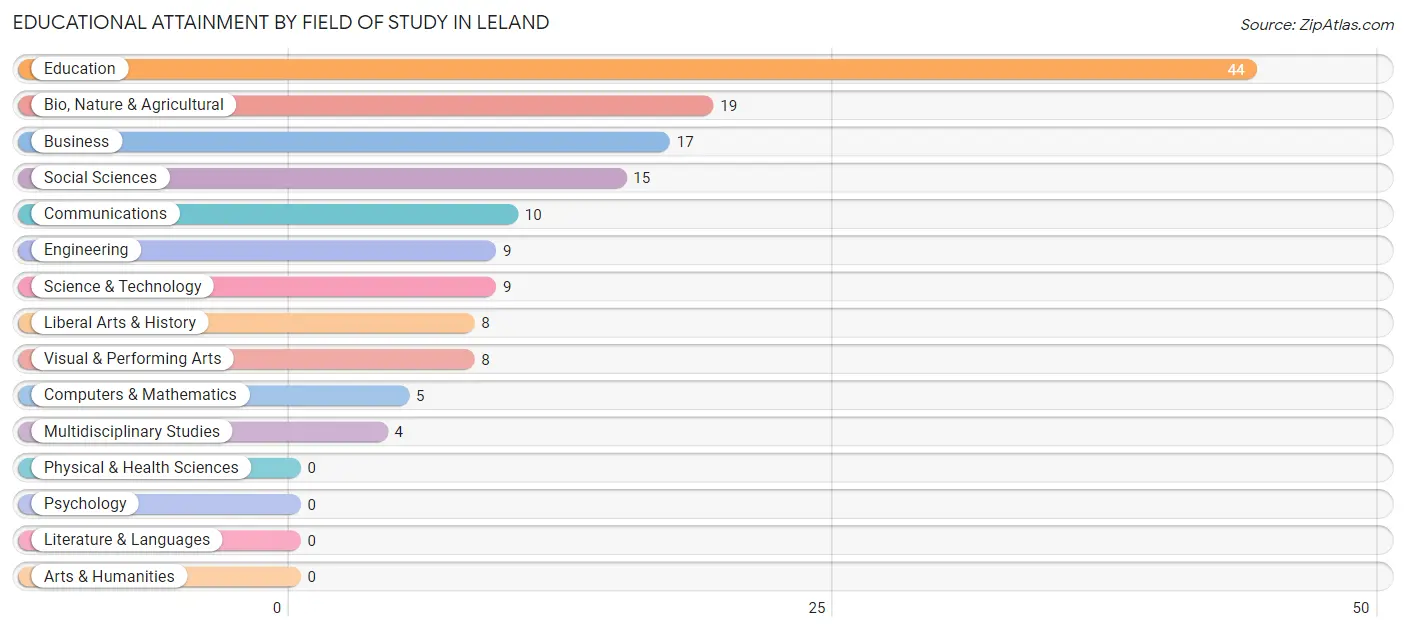
| Field of Study | # Graduates | % Graduates |
| Computers & Mathematics | 5 | 3.4% |
| Bio, Nature & Agricultural | 19 | 12.8% |
| Physical & Health Sciences | 0 | 0.0% |
| Psychology | 0 | 0.0% |
| Social Sciences | 15 | 10.1% |
| Engineering | 9 | 6.1% |
| Multidisciplinary Studies | 4 | 2.7% |
| Science & Technology | 9 | 6.1% |
| Business | 17 | 11.5% |
| Education | 44 | 29.7% |
| Literature & Languages | 0 | 0.0% |
| Liberal Arts & History | 8 | 5.4% |
| Visual & Performing Arts | 8 | 5.4% |
| Communications | 10 | 6.8% |
| Arts & Humanities | 0 | 0.0% |
| Total | 148 | 100.0% |
Transportation & Commute in Leland
Vehicle Availability by Sex in Leland
The most prevalent vehicle ownership categories in Leland are males with 3 vehicles (57, accounting for 100.0%) and females with 3 vehicles (27, making up 89.1%).
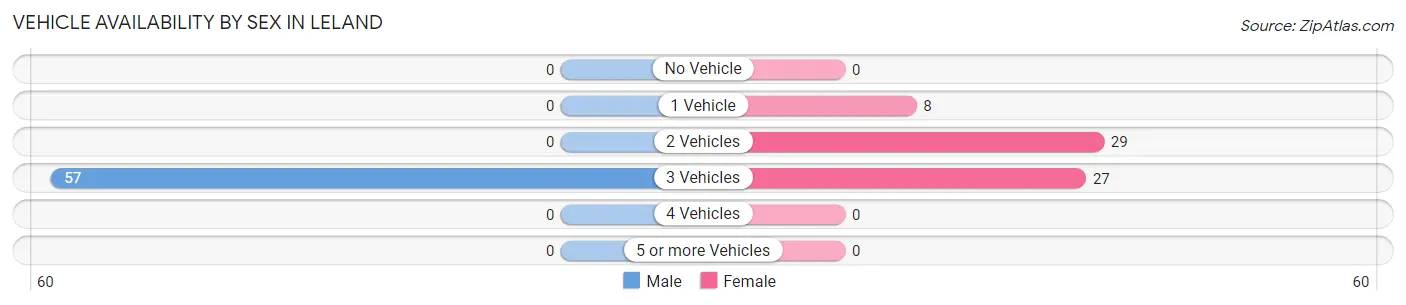
| Vehicles Available | Male | Female |
| No Vehicle | 0 (0.0%) | 0 (0.0%) |
| 1 Vehicle | 0 (0.0%) | 8 (12.5%) |
| 2 Vehicles | 0 (0.0%) | 29 (45.3%) |
| 3 Vehicles | 57 (100.0%) | 27 (42.2%) |
| 4 Vehicles | 0 (0.0%) | 0 (0.0%) |
| 5 or more Vehicles | 0 (0.0%) | 0 (0.0%) |
| Total | 57 (100.0%) | 64 (100.0%) |
Commute Time in Leland
The most frequently occuring commute durations in Leland are 35 to 39 minutes (40 commuters, 44.0%), 5 to 9 minutes (22 commuters, 24.2%), and 45 to 59 minutes (12 commuters, 13.2%).
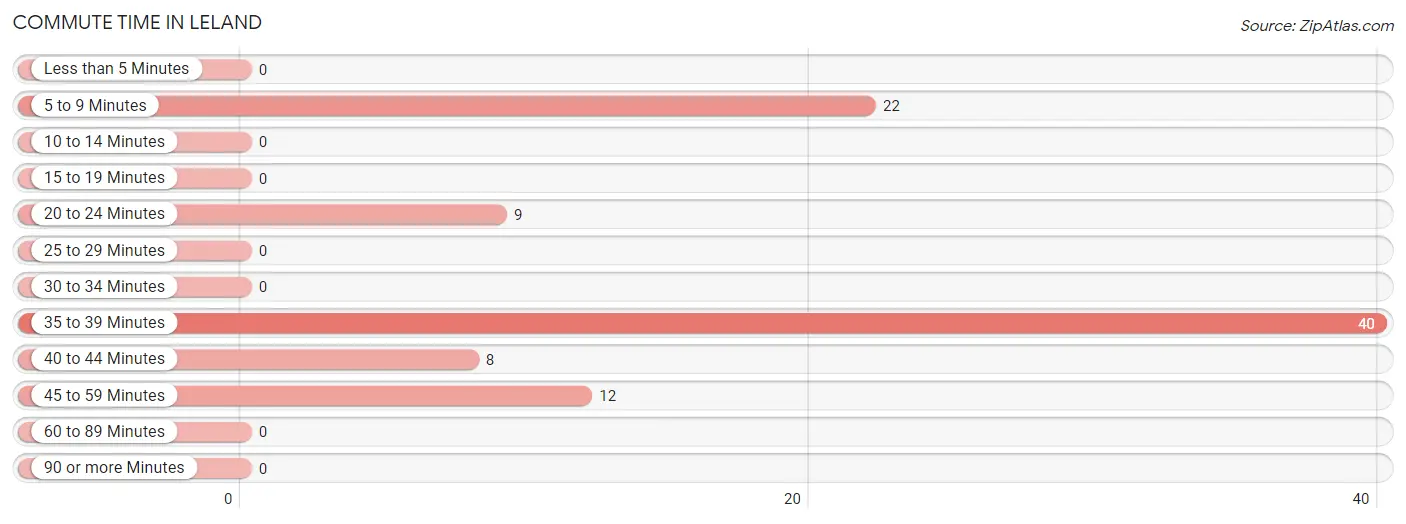
| Commute Time | # Commuters | % Commuters |
| Less than 5 Minutes | 0 | 0.0% |
| 5 to 9 Minutes | 22 | 24.2% |
| 10 to 14 Minutes | 0 | 0.0% |
| 15 to 19 Minutes | 0 | 0.0% |
| 20 to 24 Minutes | 9 | 9.9% |
| 25 to 29 Minutes | 0 | 0.0% |
| 30 to 34 Minutes | 0 | 0.0% |
| 35 to 39 Minutes | 40 | 44.0% |
| 40 to 44 Minutes | 8 | 8.8% |
| 45 to 59 Minutes | 12 | 13.2% |
| 60 to 89 Minutes | 0 | 0.0% |
| 90 or more Minutes | 0 | 0.0% |
Commute Time by Sex in Leland
The most common commute times in Leland are 45 to 59 minutes (12 commuters, 36.4%) for males and 35 to 39 minutes (29 commuters, 50.0%) for females.
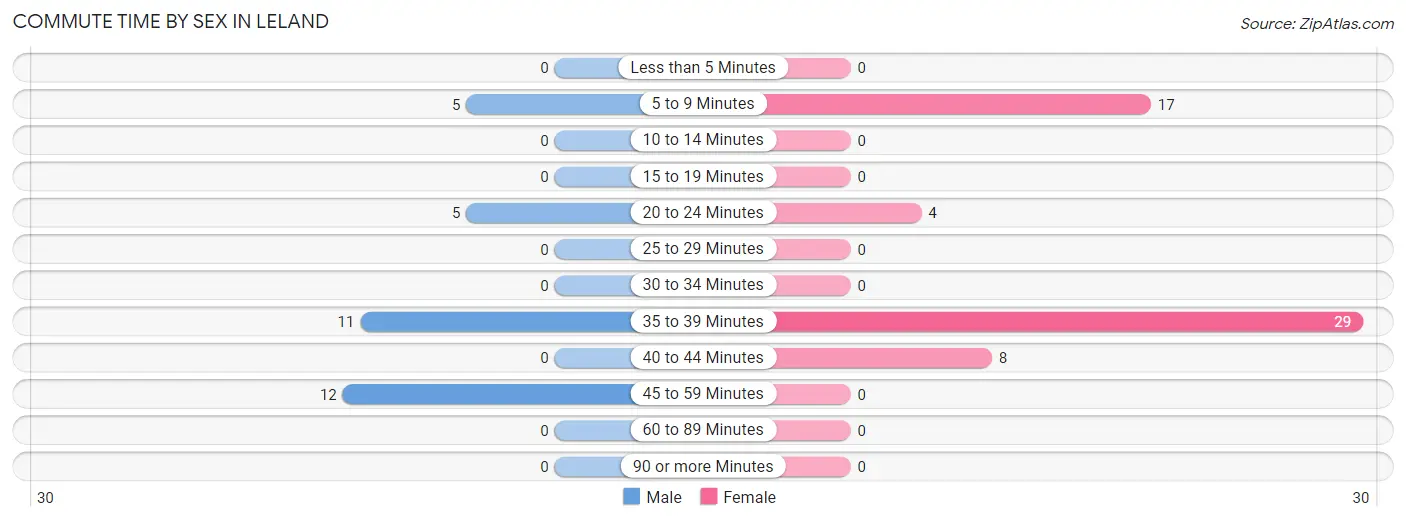
| Commute Time | Male | Female |
| Less than 5 Minutes | 0 (0.0%) | 0 (0.0%) |
| 5 to 9 Minutes | 5 (15.1%) | 17 (29.3%) |
| 10 to 14 Minutes | 0 (0.0%) | 0 (0.0%) |
| 15 to 19 Minutes | 0 (0.0%) | 0 (0.0%) |
| 20 to 24 Minutes | 5 (15.1%) | 4 (6.9%) |
| 25 to 29 Minutes | 0 (0.0%) | 0 (0.0%) |
| 30 to 34 Minutes | 0 (0.0%) | 0 (0.0%) |
| 35 to 39 Minutes | 11 (33.3%) | 29 (50.0%) |
| 40 to 44 Minutes | 0 (0.0%) | 8 (13.8%) |
| 45 to 59 Minutes | 12 (36.4%) | 0 (0.0%) |
| 60 to 89 Minutes | 0 (0.0%) | 0 (0.0%) |
| 90 or more Minutes | 0 (0.0%) | 0 (0.0%) |
Time of Departure to Work by Sex in Leland
The most frequent times of departure to work in Leland are 7:30 AM to 7:59 AM (11, 33.3%) for males and 6:00 AM to 6:29 AM (29, 50.0%) for females.
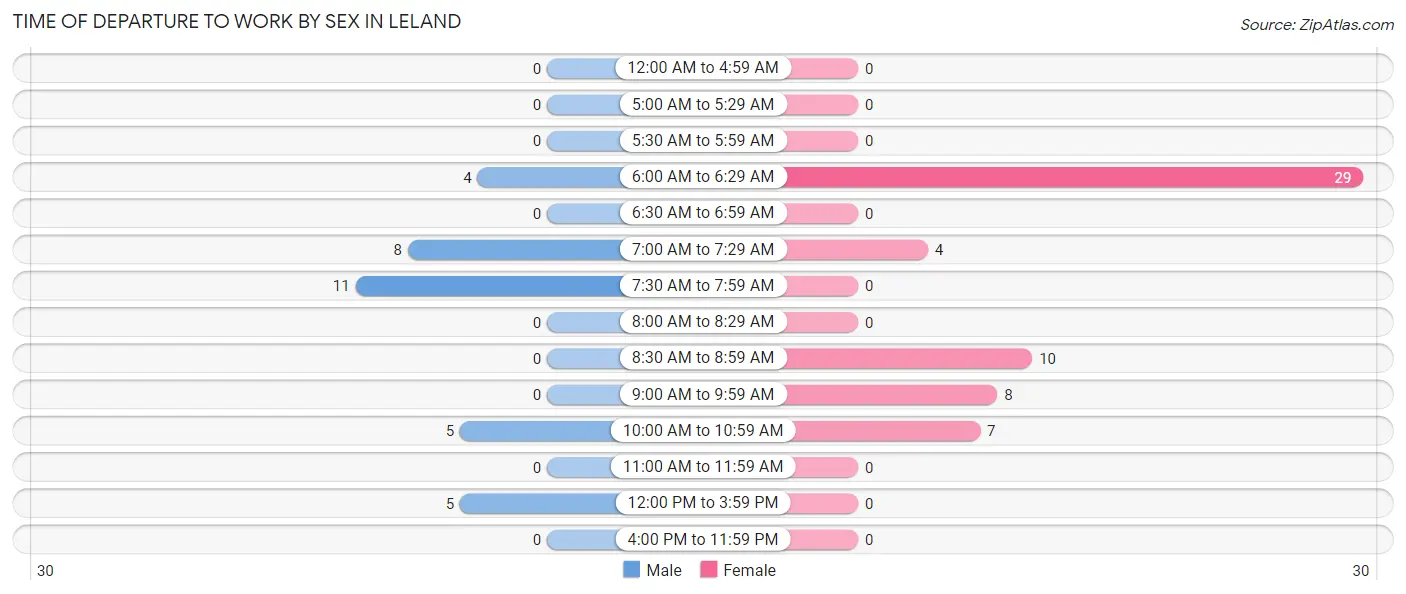
| Time of Departure | Male | Female |
| 12:00 AM to 4:59 AM | 0 (0.0%) | 0 (0.0%) |
| 5:00 AM to 5:29 AM | 0 (0.0%) | 0 (0.0%) |
| 5:30 AM to 5:59 AM | 0 (0.0%) | 0 (0.0%) |
| 6:00 AM to 6:29 AM | 4 (12.1%) | 29 (50.0%) |
| 6:30 AM to 6:59 AM | 0 (0.0%) | 0 (0.0%) |
| 7:00 AM to 7:29 AM | 8 (24.2%) | 4 (6.9%) |
| 7:30 AM to 7:59 AM | 11 (33.3%) | 0 (0.0%) |
| 8:00 AM to 8:29 AM | 0 (0.0%) | 0 (0.0%) |
| 8:30 AM to 8:59 AM | 0 (0.0%) | 10 (17.2%) |
| 9:00 AM to 9:59 AM | 0 (0.0%) | 8 (13.8%) |
| 10:00 AM to 10:59 AM | 5 (15.1%) | 7 (12.1%) |
| 11:00 AM to 11:59 AM | 0 (0.0%) | 0 (0.0%) |
| 12:00 PM to 3:59 PM | 5 (15.1%) | 0 (0.0%) |
| 4:00 PM to 11:59 PM | 0 (0.0%) | 0 (0.0%) |
| Total | 33 (100.0%) | 58 (100.0%) |
Housing Occupancy in Leland
Occupancy by Ownership in Leland
Of the total 165 dwellings in Leland, owner-occupied units account for 111 (67.3%), while renter-occupied units make up 54 (32.7%).
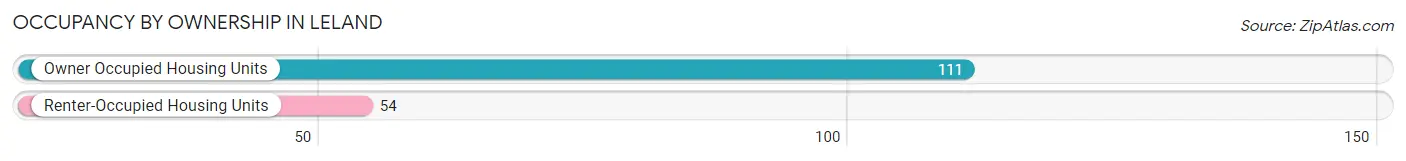
| Occupancy | # Housing Units | % Housing Units |
| Owner Occupied Housing Units | 111 | 67.3% |
| Renter-Occupied Housing Units | 54 | 32.7% |
| Total Occupied Housing Units | 165 | 100.0% |
Occupancy by Household Size in Leland
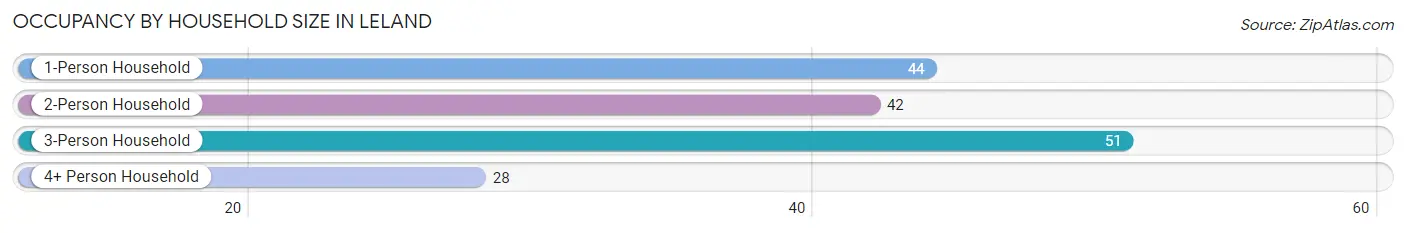
| Household Size | # Housing Units | % Housing Units |
| 1-Person Household | 44 | 26.7% |
| 2-Person Household | 42 | 25.5% |
| 3-Person Household | 51 | 30.9% |
| 4+ Person Household | 28 | 17.0% |
| Total Housing Units | 165 | 100.0% |
Occupancy by Ownership by Household Size in Leland
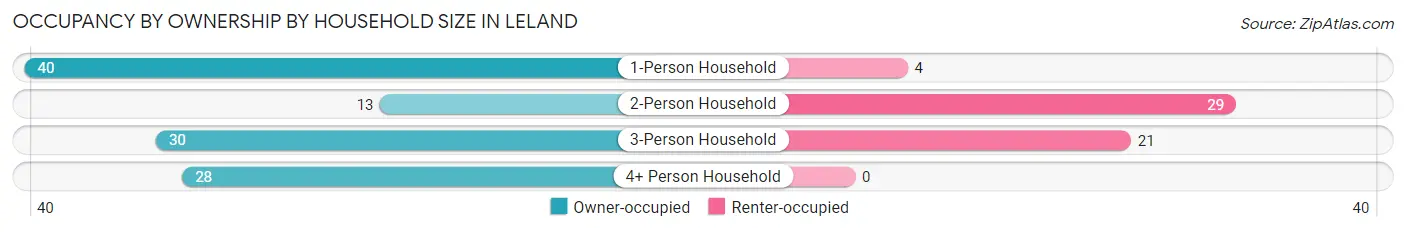
| Household Size | Owner-occupied | Renter-occupied |
| 1-Person Household | 40 (90.9%) | 4 (9.1%) |
| 2-Person Household | 13 (30.9%) | 29 (69.1%) |
| 3-Person Household | 30 (58.8%) | 21 (41.2%) |
| 4+ Person Household | 28 (100.0%) | 0 (0.0%) |
| Total Housing Units | 111 (67.3%) | 54 (32.7%) |
Occupancy by Educational Attainment in Leland
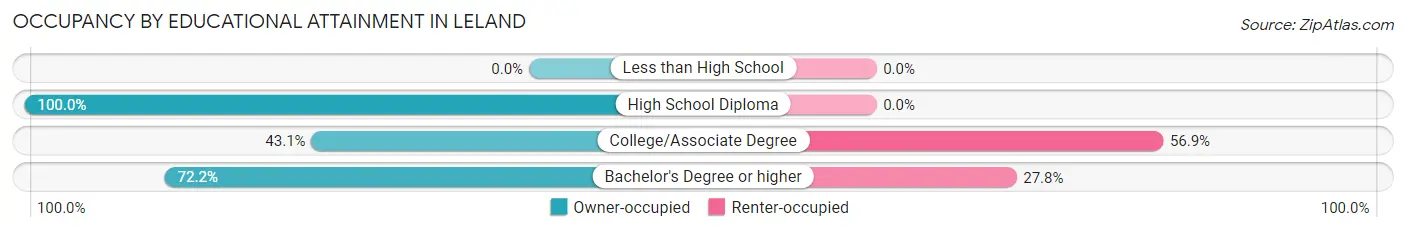
| Household Size | Owner-occupied | Renter-occupied |
| Less than High School | 0 (0.0%) | 0 (0.0%) |
| High School Diploma | 24 (100.0%) | 0 (0.0%) |
| College/Associate Degree | 22 (43.1%) | 29 (56.9%) |
| Bachelor's Degree or higher | 65 (72.2%) | 25 (27.8%) |
Occupancy by Age of Householder in Leland
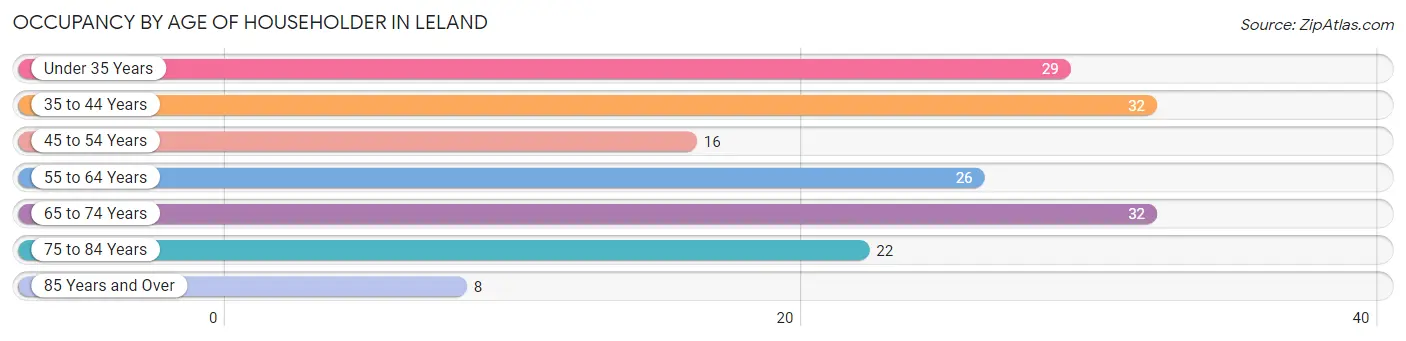
| Age Bracket | # Households | % Households |
| Under 35 Years | 29 | 17.6% |
| 35 to 44 Years | 32 | 19.4% |
| 45 to 54 Years | 16 | 9.7% |
| 55 to 64 Years | 26 | 15.8% |
| 65 to 74 Years | 32 | 19.4% |
| 75 to 84 Years | 22 | 13.3% |
| 85 Years and Over | 8 | 4.9% |
| Total | 165 | 100.0% |
Housing Finances in Leland
Median Income by Occupancy in Leland
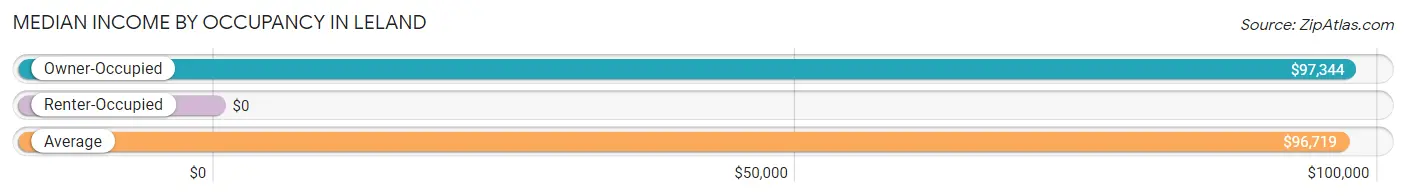
| Occupancy Type | # Households | Median Income |
| Owner-Occupied | 111 (67.3%) | $97,344 |
| Renter-Occupied | 54 (32.7%) | $0 |
| Average | 165 (100.0%) | $96,719 |
Occupancy by Householder Income Bracket in Leland
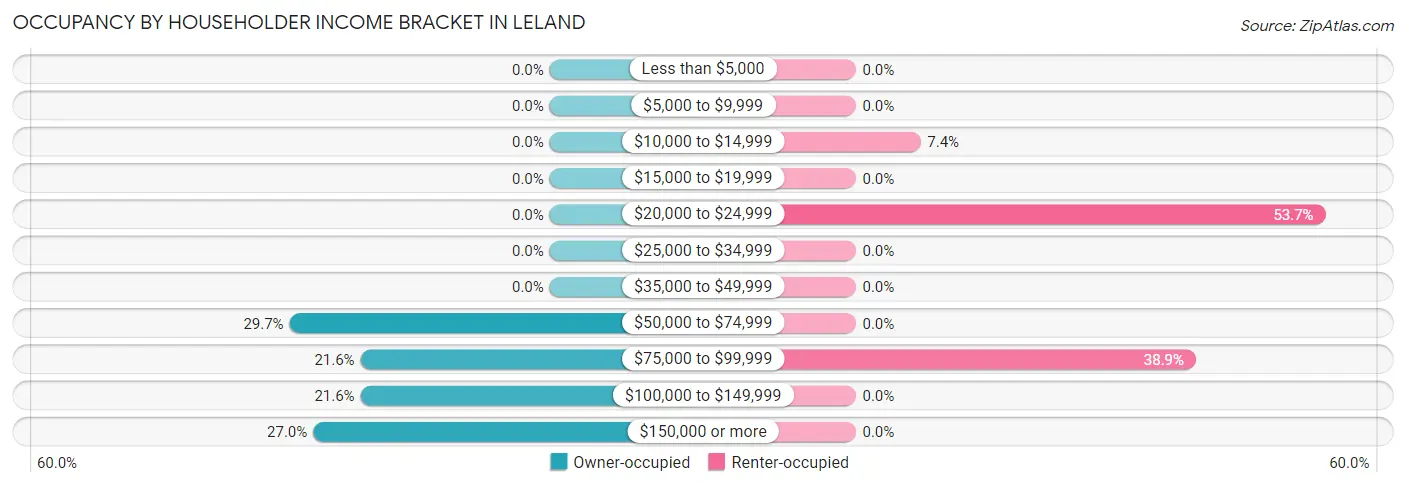
| Income Bracket | Owner-occupied | Renter-occupied |
| Less than $5,000 | 0 (0.0%) | 0 (0.0%) |
| $5,000 to $9,999 | 0 (0.0%) | 0 (0.0%) |
| $10,000 to $14,999 | 0 (0.0%) | 4 (7.4%) |
| $15,000 to $19,999 | 0 (0.0%) | 0 (0.0%) |
| $20,000 to $24,999 | 0 (0.0%) | 29 (53.7%) |
| $25,000 to $34,999 | 0 (0.0%) | 0 (0.0%) |
| $35,000 to $49,999 | 0 (0.0%) | 0 (0.0%) |
| $50,000 to $74,999 | 33 (29.7%) | 0 (0.0%) |
| $75,000 to $99,999 | 24 (21.6%) | 21 (38.9%) |
| $100,000 to $149,999 | 24 (21.6%) | 0 (0.0%) |
| $150,000 or more | 30 (27.0%) | 0 (0.0%) |
| Total | 111 (100.0%) | 54 (100.0%) |
Monthly Housing Cost Tiers in Leland
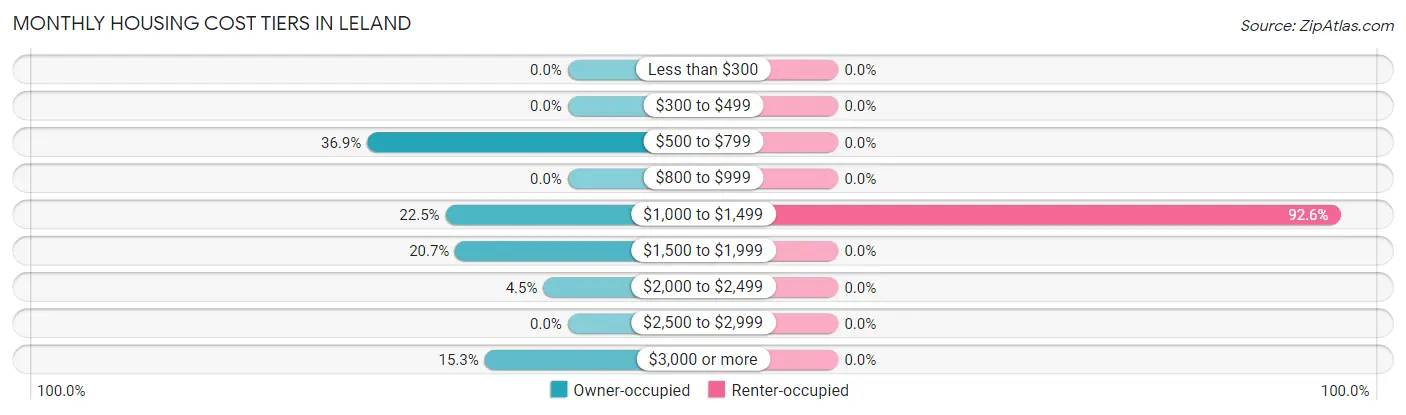
| Monthly Cost | Owner-occupied | Renter-occupied |
| Less than $300 | 0 (0.0%) | 0 (0.0%) |
| $300 to $499 | 0 (0.0%) | 0 (0.0%) |
| $500 to $799 | 41 (36.9%) | 0 (0.0%) |
| $800 to $999 | 0 (0.0%) | 0 (0.0%) |
| $1,000 to $1,499 | 25 (22.5%) | 50 (92.6%) |
| $1,500 to $1,999 | 23 (20.7%) | 0 (0.0%) |
| $2,000 to $2,499 | 5 (4.5%) | 0 (0.0%) |
| $2,500 to $2,999 | 0 (0.0%) | 0 (0.0%) |
| $3,000 or more | 17 (15.3%) | 0 (0.0%) |
| Total | 111 (100.0%) | 54 (100.0%) |
Physical Housing Characteristics in Leland
Housing Structures in Leland
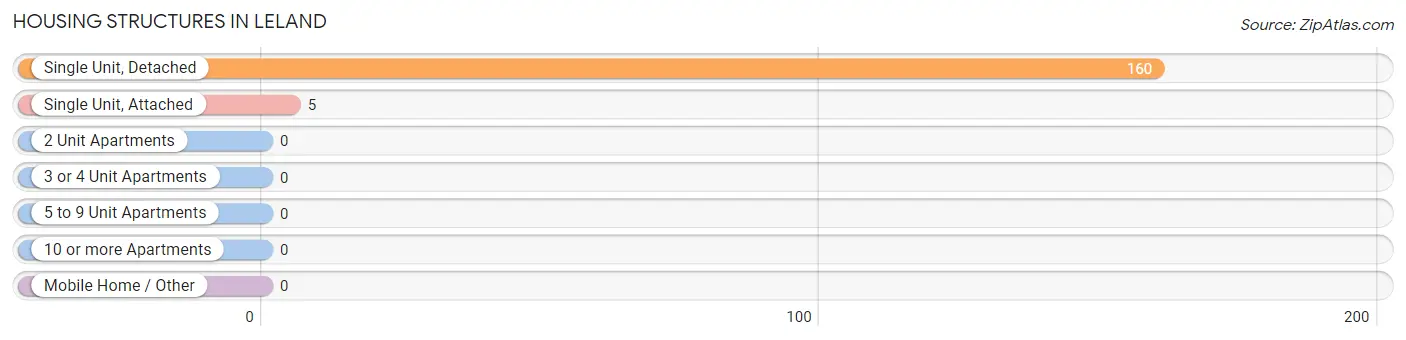
| Structure Type | # Housing Units | % Housing Units |
| Single Unit, Detached | 160 | 97.0% |
| Single Unit, Attached | 5 | 3.0% |
| 2 Unit Apartments | 0 | 0.0% |
| 3 or 4 Unit Apartments | 0 | 0.0% |
| 5 to 9 Unit Apartments | 0 | 0.0% |
| 10 or more Apartments | 0 | 0.0% |
| Mobile Home / Other | 0 | 0.0% |
| Total | 165 | 100.0% |
Housing Structures by Occupancy in Leland
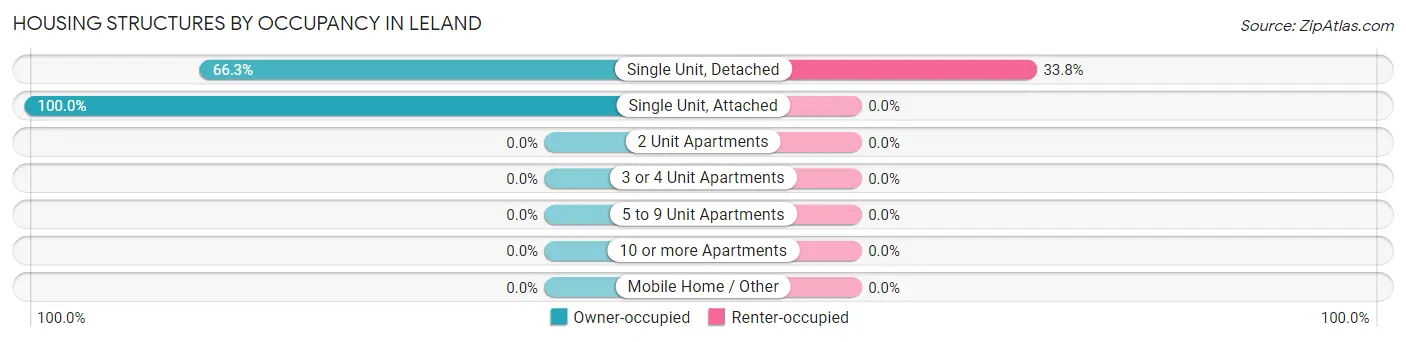
| Structure Type | Owner-occupied | Renter-occupied |
| Single Unit, Detached | 106 (66.2%) | 54 (33.8%) |
| Single Unit, Attached | 5 (100.0%) | 0 (0.0%) |
| 2 Unit Apartments | 0 (0.0%) | 0 (0.0%) |
| 3 or 4 Unit Apartments | 0 (0.0%) | 0 (0.0%) |
| 5 to 9 Unit Apartments | 0 (0.0%) | 0 (0.0%) |
| 10 or more Apartments | 0 (0.0%) | 0 (0.0%) |
| Mobile Home / Other | 0 (0.0%) | 0 (0.0%) |
| Total | 111 (67.3%) | 54 (32.7%) |
Housing Structures by Number of Rooms in Leland
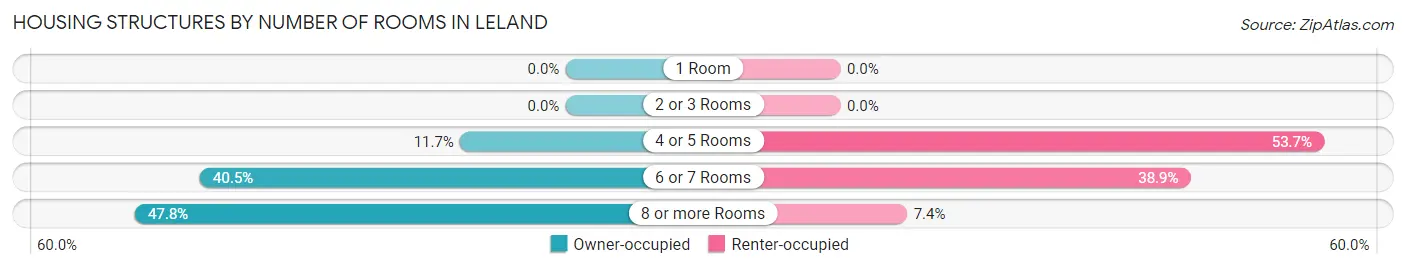
| Number of Rooms | Owner-occupied | Renter-occupied |
| 1 Room | 0 (0.0%) | 0 (0.0%) |
| 2 or 3 Rooms | 0 (0.0%) | 0 (0.0%) |
| 4 or 5 Rooms | 13 (11.7%) | 29 (53.7%) |
| 6 or 7 Rooms | 45 (40.5%) | 21 (38.9%) |
| 8 or more Rooms | 53 (47.7%) | 4 (7.4%) |
| Total | 111 (100.0%) | 54 (100.0%) |
Housing Structure by Heating Type in Leland
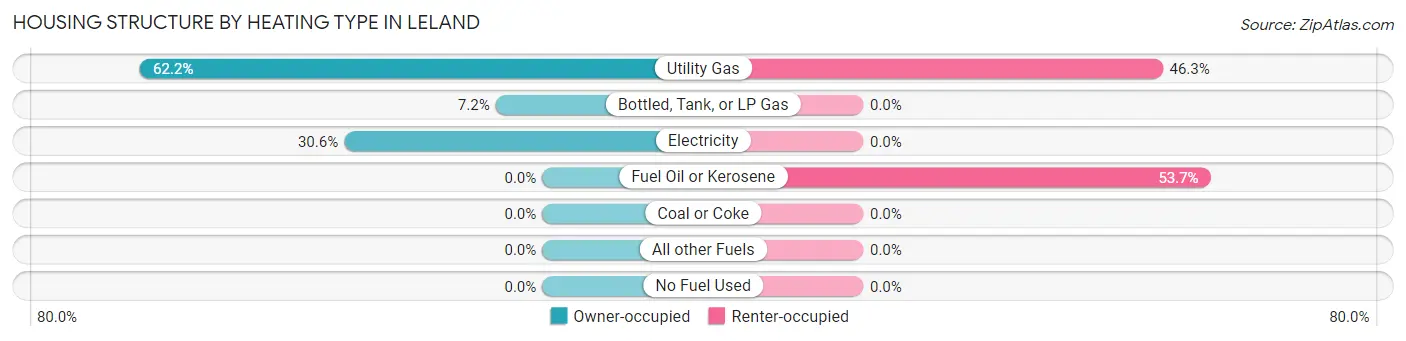
| Heating Type | Owner-occupied | Renter-occupied |
| Utility Gas | 69 (62.2%) | 25 (46.3%) |
| Bottled, Tank, or LP Gas | 8 (7.2%) | 0 (0.0%) |
| Electricity | 34 (30.6%) | 0 (0.0%) |
| Fuel Oil or Kerosene | 0 (0.0%) | 29 (53.7%) |
| Coal or Coke | 0 (0.0%) | 0 (0.0%) |
| All other Fuels | 0 (0.0%) | 0 (0.0%) |
| No Fuel Used | 0 (0.0%) | 0 (0.0%) |
| Total | 111 (100.0%) | 54 (100.0%) |
Household Vehicle Usage in Leland
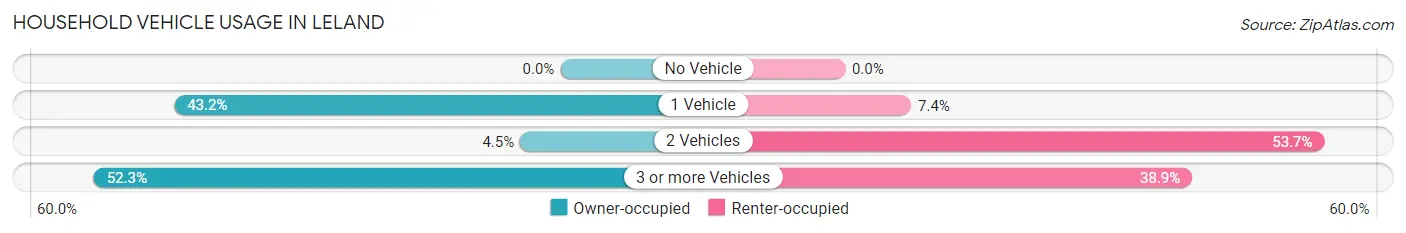
| Vehicles per Household | Owner-occupied | Renter-occupied |
| No Vehicle | 0 (0.0%) | 0 (0.0%) |
| 1 Vehicle | 48 (43.2%) | 4 (7.4%) |
| 2 Vehicles | 5 (4.5%) | 29 (53.7%) |
| 3 or more Vehicles | 58 (52.2%) | 21 (38.9%) |
| Total | 111 (100.0%) | 54 (100.0%) |
Real Estate & Mortgages in Leland
Real Estate and Mortgage Overview in Leland
| Characteristic | Without Mortgage | With Mortgage |
| Housing Units | 41 | 70 |
| Median Property Value | - | - |
| Median Household Income | - | - |
| Monthly Housing Costs | - | - |
| Real Estate Taxes | - | - |
Property Value by Mortgage Status in Leland
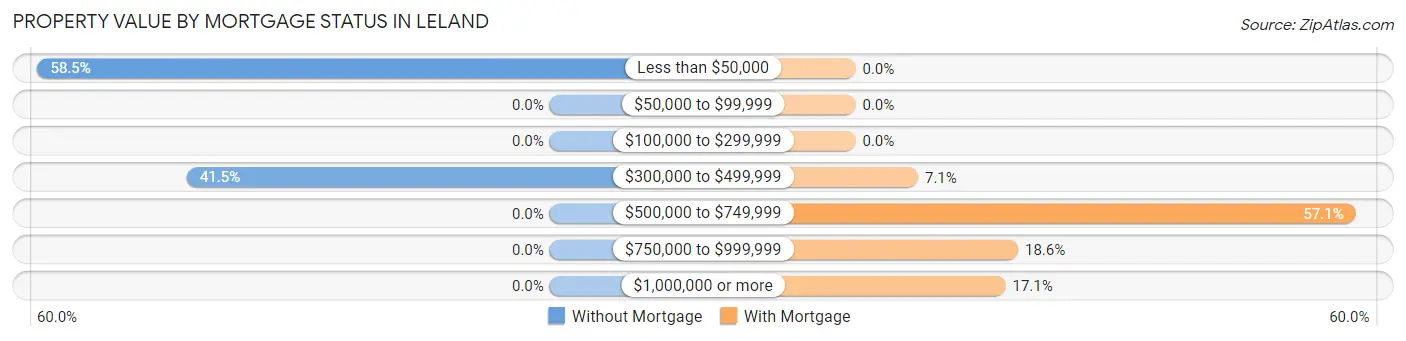
| Property Value | Without Mortgage | With Mortgage |
| Less than $50,000 | 24 (58.5%) | 0 (0.0%) |
| $50,000 to $99,999 | 0 (0.0%) | 0 (0.0%) |
| $100,000 to $299,999 | 0 (0.0%) | 0 (0.0%) |
| $300,000 to $499,999 | 17 (41.5%) | 5 (7.1%) |
| $500,000 to $749,999 | 0 (0.0%) | 40 (57.1%) |
| $750,000 to $999,999 | 0 (0.0%) | 13 (18.6%) |
| $1,000,000 or more | 0 (0.0%) | 12 (17.1%) |
| Total | 41 (100.0%) | 70 (100.0%) |
Household Income by Mortgage Status in Leland
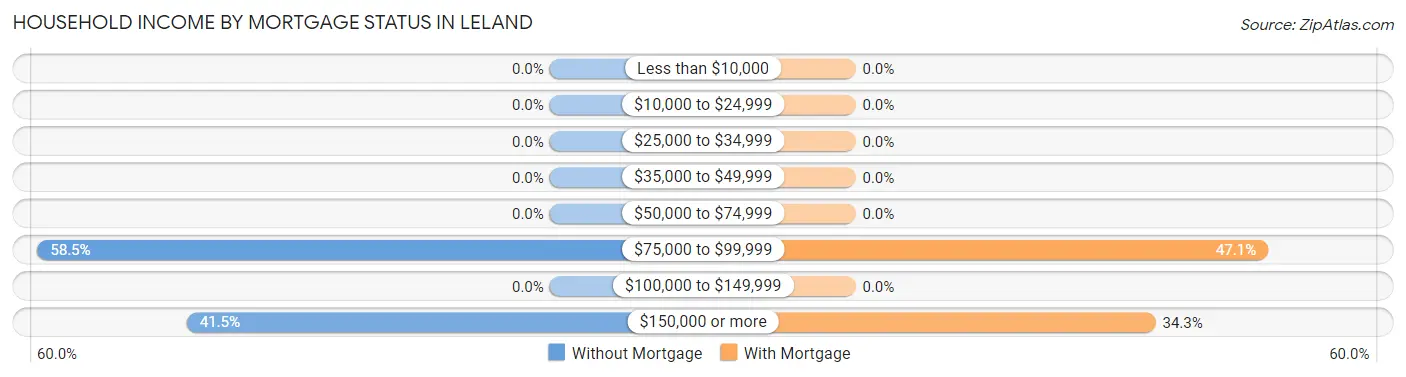
| Household Income | Without Mortgage | With Mortgage |
| Less than $10,000 | 0 (0.0%) | 0 (0.0%) |
| $10,000 to $24,999 | 0 (0.0%) | 0 (0.0%) |
| $25,000 to $34,999 | 0 (0.0%) | 0 (0.0%) |
| $35,000 to $49,999 | 0 (0.0%) | 0 (0.0%) |
| $50,000 to $74,999 | 0 (0.0%) | 0 (0.0%) |
| $75,000 to $99,999 | 24 (58.5%) | 33 (47.1%) |
| $100,000 to $149,999 | 0 (0.0%) | 0 (0.0%) |
| $150,000 or more | 17 (41.5%) | 24 (34.3%) |
| Total | 41 (100.0%) | 70 (100.0%) |
Property Value to Household Income Ratio in Leland
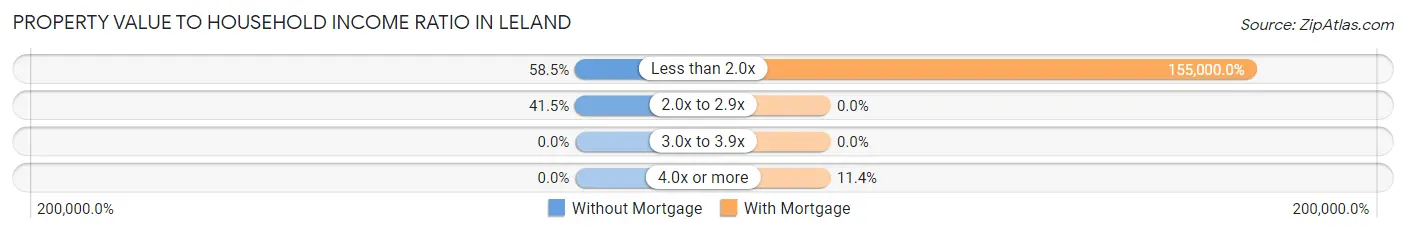
| Value-to-Income Ratio | Without Mortgage | With Mortgage |
| Less than 2.0x | 24 (58.5%) | 108,500 (155,000.0%) |
| 2.0x to 2.9x | 17 (41.5%) | 0 (0.0%) |
| 3.0x to 3.9x | 0 (0.0%) | 0 (0.0%) |
| 4.0x or more | 0 (0.0%) | 8 (11.4%) |
| Total | 41 (100.0%) | 70 (100.0%) |
Real Estate Taxes by Mortgage Status in Leland
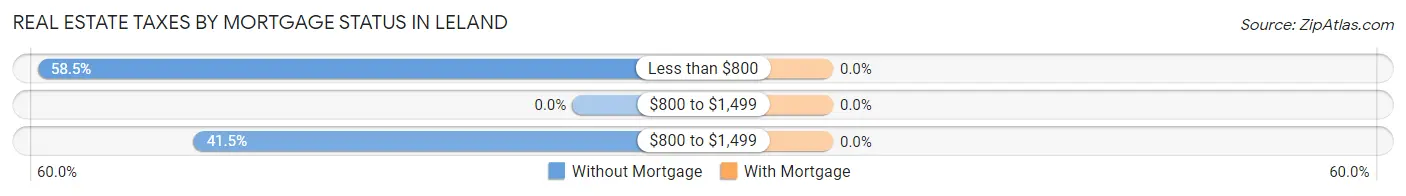
| Property Taxes | Without Mortgage | With Mortgage |
| Less than $800 | 24 (58.5%) | 0 (0.0%) |
| $800 to $1,499 | 0 (0.0%) | 0 (0.0%) |
| $800 to $1,499 | 17 (41.5%) | 0 (0.0%) |
| Total | 41 (100.0%) | 70 (100.0%) |
Health & Disability in Leland
Health Insurance Coverage by Age in Leland
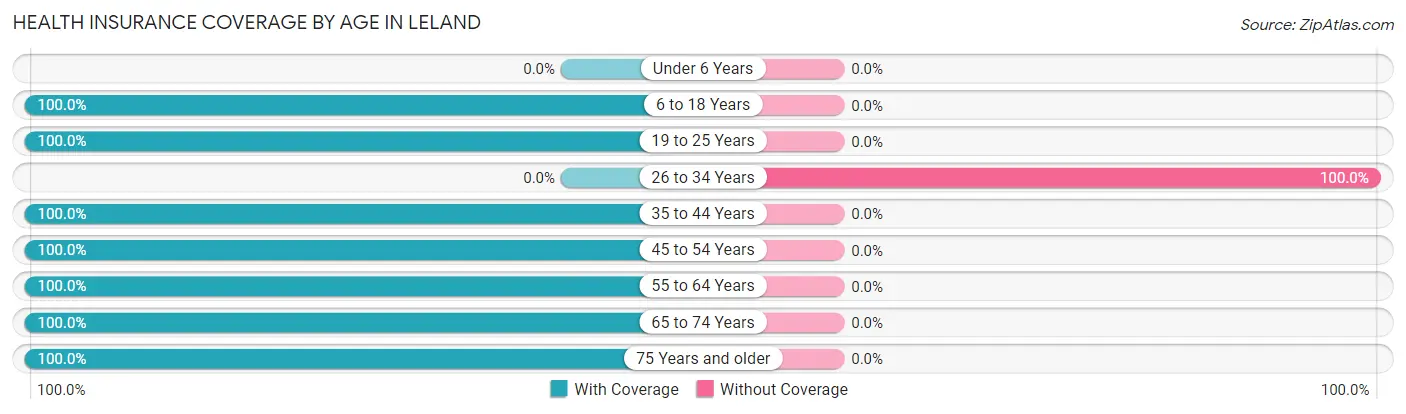
| Age Bracket | With Coverage | Without Coverage |
| Under 6 Years | 0 (0.0%) | 0 (0.0%) |
| 6 to 18 Years | 41 (100.0%) | 0 (0.0%) |
| 19 to 25 Years | 50 (100.0%) | 0 (0.0%) |
| 26 to 34 Years | 0 (0.0%) | 24 (100.0%) |
| 35 to 44 Years | 42 (100.0%) | 0 (0.0%) |
| 45 to 54 Years | 27 (100.0%) | 0 (0.0%) |
| 55 to 64 Years | 51 (100.0%) | 0 (0.0%) |
| 65 to 74 Years | 51 (100.0%) | 0 (0.0%) |
| 75 Years and older | 58 (100.0%) | 0 (0.0%) |
| Total | 320 (93.0%) | 24 (7.0%) |
Health Insurance Coverage by Citizenship Status in Leland
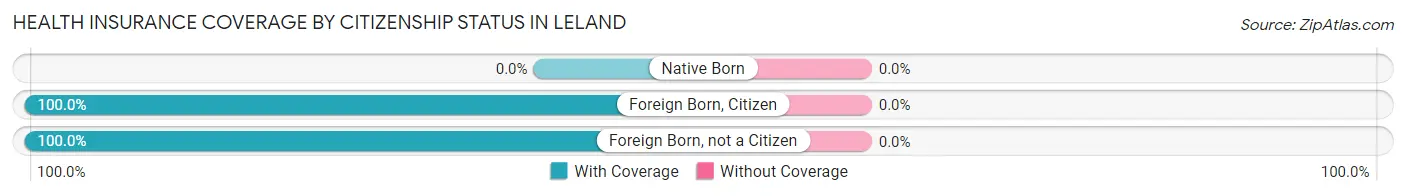
| Citizenship Status | With Coverage | Without Coverage |
| Native Born | 0 (0.0%) | 0 (0.0%) |
| Foreign Born, Citizen | 41 (100.0%) | 0 (0.0%) |
| Foreign Born, not a Citizen | 50 (100.0%) | 0 (0.0%) |
Health Insurance Coverage by Household Income in Leland
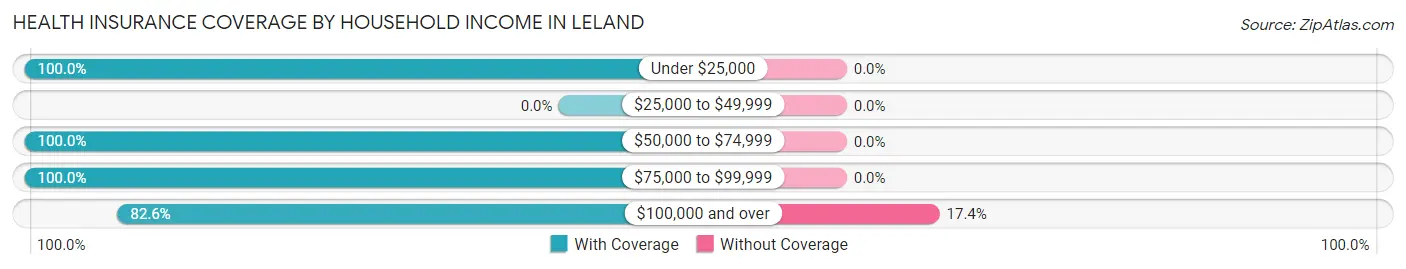
| Household Income | With Coverage | Without Coverage |
| Under $25,000 | 43 (100.0%) | 0 (0.0%) |
| $25,000 to $49,999 | 0 (0.0%) | 0 (0.0%) |
| $50,000 to $74,999 | 41 (100.0%) | 0 (0.0%) |
| $75,000 to $99,999 | 120 (100.0%) | 0 (0.0%) |
| $100,000 and over | 114 (82.6%) | 24 (17.4%) |
Public vs Private Health Insurance Coverage by Age in Leland
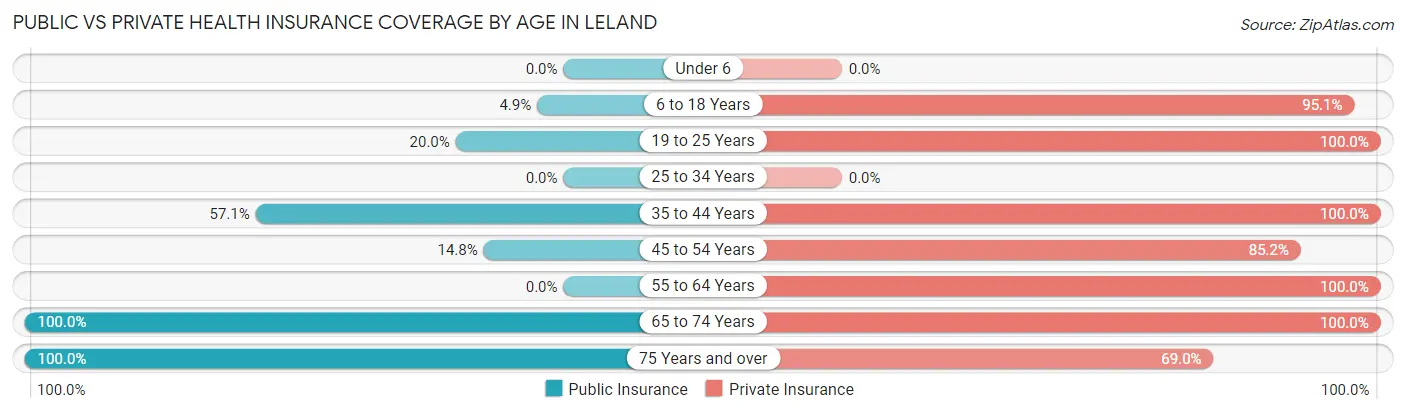
| Age Bracket | Public Insurance | Private Insurance |
| Under 6 | 0 (0.0%) | 0 (0.0%) |
| 6 to 18 Years | 2 (4.9%) | 39 (95.1%) |
| 19 to 25 Years | 10 (20.0%) | 50 (100.0%) |
| 25 to 34 Years | 0 (0.0%) | 0 (0.0%) |
| 35 to 44 Years | 24 (57.1%) | 42 (100.0%) |
| 45 to 54 Years | 4 (14.8%) | 23 (85.2%) |
| 55 to 64 Years | 0 (0.0%) | 51 (100.0%) |
| 65 to 74 Years | 51 (100.0%) | 51 (100.0%) |
| 75 Years and over | 58 (100.0%) | 40 (69.0%) |
| Total | 149 (43.3%) | 296 (86.1%) |
Disability Status by Sex by Age in Leland
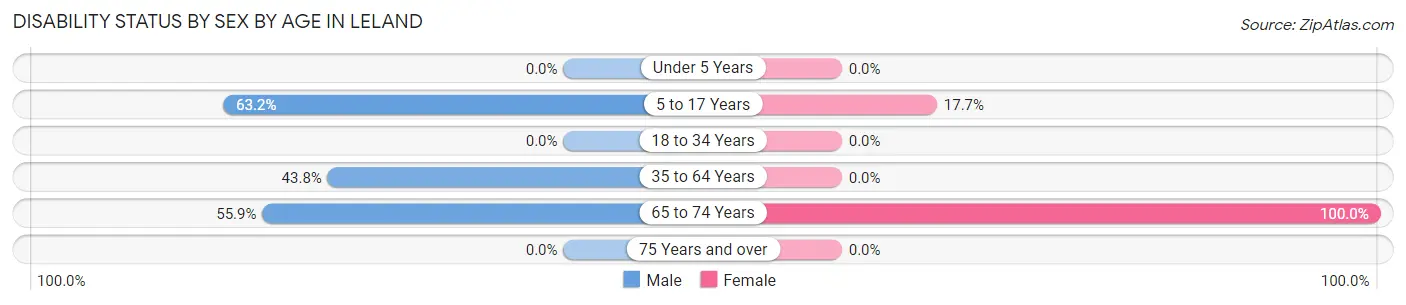
| Age Bracket | Male | Female |
| Under 5 Years | 0 (0.0%) | 0 (0.0%) |
| 5 to 17 Years | 12 (63.2%) | 3 (17.6%) |
| 18 to 34 Years | 0 (0.0%) | 0 (0.0%) |
| 35 to 64 Years | 28 (43.8%) | 0 (0.0%) |
| 65 to 74 Years | 19 (55.9%) | 17 (100.0%) |
| 75 Years and over | 0 (0.0%) | 0 (0.0%) |
Disability Class by Sex by Age in Leland
Disability Class: Hearing Difficulty
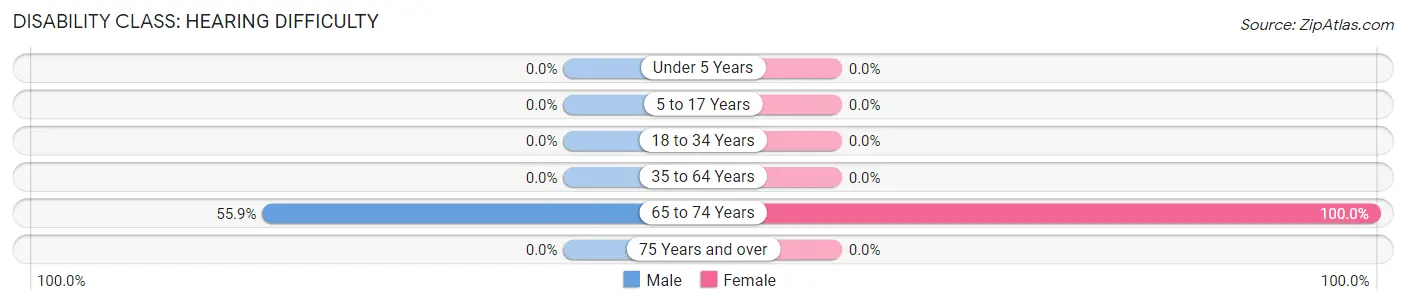
| Age Bracket | Male | Female |
| Under 5 Years | 0 (0.0%) | 0 (0.0%) |
| 5 to 17 Years | 0 (0.0%) | 0 (0.0%) |
| 18 to 34 Years | 0 (0.0%) | 0 (0.0%) |
| 35 to 64 Years | 0 (0.0%) | 0 (0.0%) |
| 65 to 74 Years | 19 (55.9%) | 17 (100.0%) |
| 75 Years and over | 0 (0.0%) | 0 (0.0%) |
Disability Class: Vision Difficulty
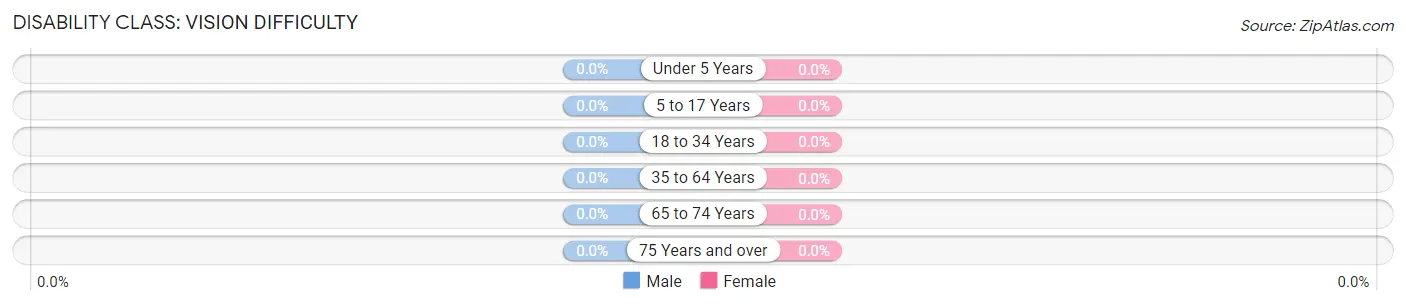
| Age Bracket | Male | Female |
| Under 5 Years | 0 (0.0%) | 0 (0.0%) |
| 5 to 17 Years | 0 (0.0%) | 0 (0.0%) |
| 18 to 34 Years | 0 (0.0%) | 0 (0.0%) |
| 35 to 64 Years | 0 (0.0%) | 0 (0.0%) |
| 65 to 74 Years | 0 (0.0%) | 0 (0.0%) |
| 75 Years and over | 0 (0.0%) | 0 (0.0%) |
Disability Class: Cognitive Difficulty
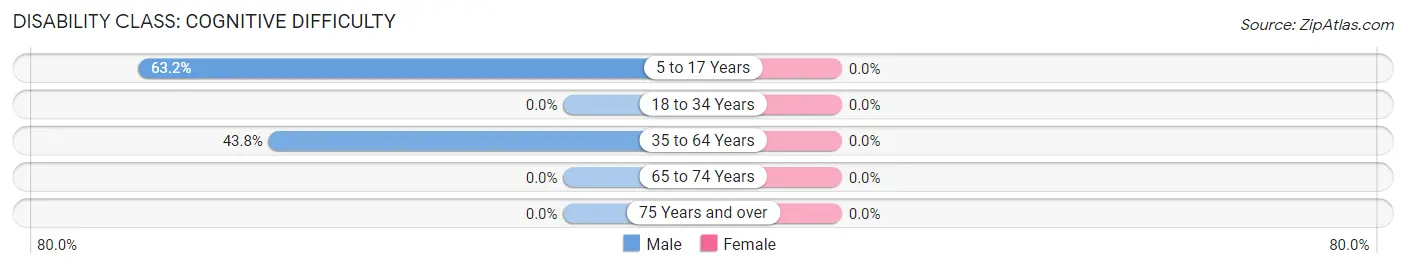
| Age Bracket | Male | Female |
| 5 to 17 Years | 12 (63.2%) | 0 (0.0%) |
| 18 to 34 Years | 0 (0.0%) | 0 (0.0%) |
| 35 to 64 Years | 28 (43.8%) | 0 (0.0%) |
| 65 to 74 Years | 0 (0.0%) | 0 (0.0%) |
| 75 Years and over | 0 (0.0%) | 0 (0.0%) |
Disability Class: Ambulatory Difficulty
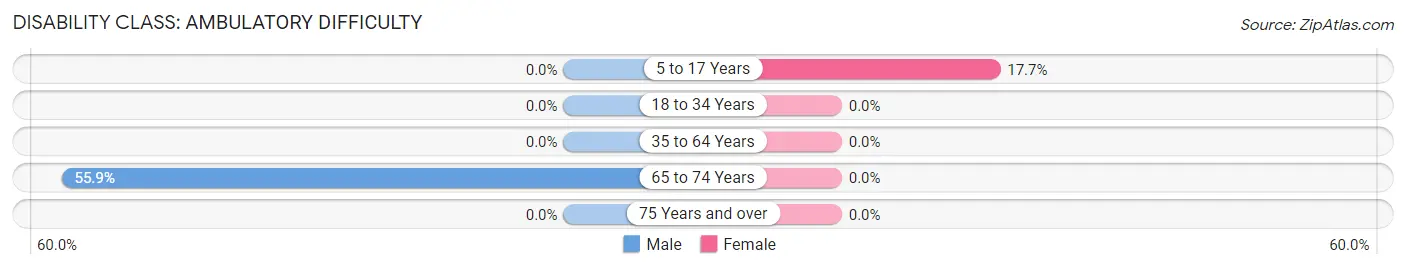
| Age Bracket | Male | Female |
| 5 to 17 Years | 0 (0.0%) | 3 (17.6%) |
| 18 to 34 Years | 0 (0.0%) | 0 (0.0%) |
| 35 to 64 Years | 0 (0.0%) | 0 (0.0%) |
| 65 to 74 Years | 19 (55.9%) | 0 (0.0%) |
| 75 Years and over | 0 (0.0%) | 0 (0.0%) |
Disability Class: Self-Care Difficulty
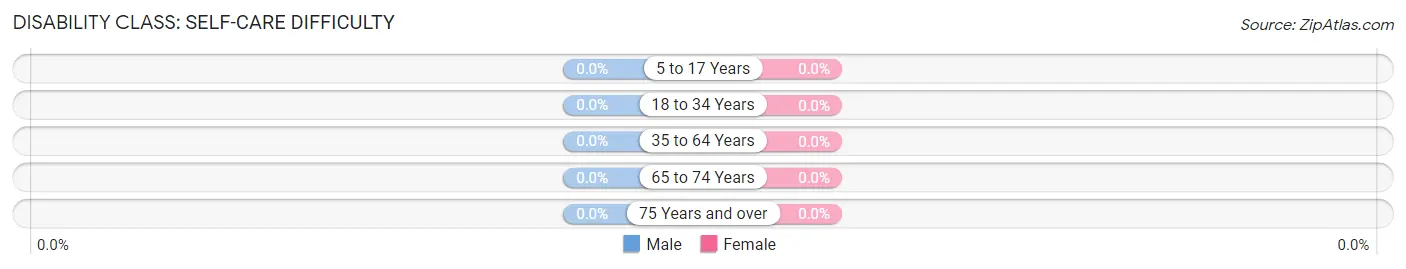
| Age Bracket | Male | Female |
| 5 to 17 Years | 0 (0.0%) | 0 (0.0%) |
| 18 to 34 Years | 0 (0.0%) | 0 (0.0%) |
| 35 to 64 Years | 0 (0.0%) | 0 (0.0%) |
| 65 to 74 Years | 0 (0.0%) | 0 (0.0%) |
| 75 Years and over | 0 (0.0%) | 0 (0.0%) |
Technology Access in Leland
Computing Device Access in Leland
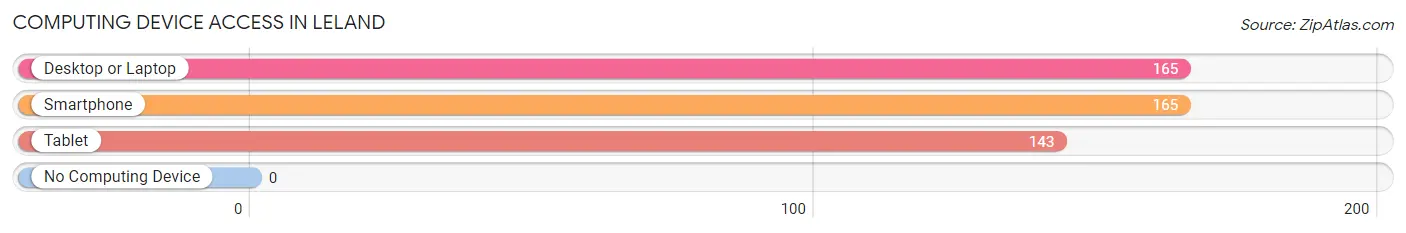
| Device Type | # Households | % Households |
| Desktop or Laptop | 165 | 100.0% |
| Smartphone | 165 | 100.0% |
| Tablet | 143 | 86.7% |
| No Computing Device | 0 | 0.0% |
| Total | 165 | 100.0% |
Internet Access in Leland
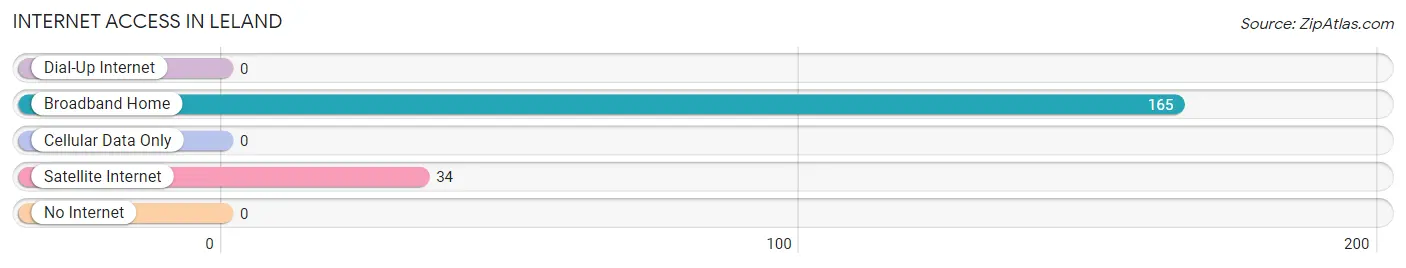
| Internet Type | # Households | % Households |
| Dial-Up Internet | 0 | 0.0% |
| Broadband Home | 165 | 100.0% |
| Cellular Data Only | 0 | 0.0% |
| Satellite Internet | 34 | 20.6% |
| No Internet | 0 | 0.0% |
| Total | 165 | 100.0% |
Leland Summary
Leland, Michigan is a small village located in the Leelanau County of the Lower Peninsula of Michigan. It is situated on the shores of Lake Michigan and is a popular tourist destination. The village has a population of 1,845 people as of the 2010 census.
History
Leland was founded in 1853 by William Austin Burt, a surveyor and inventor. Burt was the first to survey the area and he named it Leland after his son, Leland Burt. The village was incorporated in 1891 and was originally a lumber town. The lumber industry was the main source of income for the village until the early 1900s when the industry began to decline.
In the early 1900s, the village began to transition to a tourist destination. The village was home to several resorts and hotels, which attracted visitors from all over the country. The village also became a popular destination for fishing and boating.
Geography
Leland is located in the Leelanau County of the Lower Peninsula of Michigan. It is situated on the shores of Lake Michigan and is a popular tourist destination. The village has a population of 1,845 people as of the 2010 census.
The village is located on the Leelanau Peninsula, which is a popular tourist destination. The peninsula is known for its picturesque views of Lake Michigan and its many wineries and vineyards. The village is also located near the Sleeping Bear Dunes National Lakeshore, which is a popular destination for outdoor activities such as hiking, camping, and swimming.
Economy
The economy of Leland is largely based on tourism. The village is home to several resorts and hotels, which attract visitors from all over the country. The village is also a popular destination for fishing and boating.
The village is also home to several wineries and vineyards, which attract visitors from all over the country. The village is also home to several art galleries and shops, which attract visitors from all over the country.
Demographics
As of the 2010 census, the population of Leland was 1,845 people. The median age of the population was 44.7 years old. The median household income was $45,938 and the median family income was $54,844.
The racial makeup of the village was 97.3% White, 0.3% African American, 0.2% Native American, 0.7% Asian, 0.1% Pacific Islander, 0.3% from other races, and 1.2% from two or more races. Hispanic or Latino of any race were 1.2% of the population.
Conclusion
Leland, Michigan is a small village located in the Leelanau County of the Lower Peninsula of Michigan. It is situated on the shores of Lake Michigan and is a popular tourist destination. The village has a population of 1,845 people as of the 2010 census. The economy of Leland is largely based on tourism and the village is home to several resorts and hotels, wineries and vineyards, art galleries and shops. The racial makeup of the village was 97.3% White, 0.3% African American, 0.2% Native American, 0.7% Asian, 0.1% Pacific Islander, 0.3% from other races, and 1.2% from two or more races. Hispanic or Latino of any race were 1.2% of the population.
Common Questions
What is Per Capita Income in Leland?
Per Capita income in Leland is $44,291.
What is the Median Family Income in Leland?
Median Family Income in Leland is $99,167.
What is the Median Household income in Leland?
Median Household Income in Leland is $96,719.
What is Inequality or Gini Index in Leland?
Inequality or Gini Index in Leland is 0.29.
What is the Total Population of Leland?
Total Population of Leland is 352.
What is the Total Male Population of Leland?
Total Male Population of Leland is 174.
What is the Total Female Population of Leland?
Total Female Population of Leland is 178.
What is the Ratio of Males per 100 Females in Leland?
There are 97.75 Males per 100 Females in Leland.
What is the Ratio of Females per 100 Males in Leland?
There are 102.30 Females per 100 Males in Leland.
What is the Median Population Age in Leland?
Median Population Age in Leland is 49.5 Years.
What is the Average Family Size in Leland
Average Family Size in Leland is 2.8 People.
What is the Average Household Size in Leland
Average Household Size in Leland is 2.1 People.
How Large is the Labor Force in Leland?
There are 121 People in the Labor Forcein in Leland.
What is the Percentage of People in the Labor Force in Leland?
35.9% of People are in the Labor Force in Leland.