Rudy, AR Map & Demographics
Rudy Map
Rudy Overview
$17,308
PER CAPITA INCOME
$48,750
AVG HOUSEHOLD INCOME
0.32
INEQUALITY / GINI INDEX
119
TOTAL POPULATION
46
MALE POPULATION
73
FEMALE POPULATION
63.01
MALES / 100 FEMALES
158.70
FEMALES / 100 MALES
32.8
MEDIAN AGE
3.6
AVG FAMILY SIZE
2.4
AVG HOUSEHOLD SIZE
28
LABOR FORCE [ PEOPLE ]
31.1%
PERCENT IN LABOR FORCE
Rudy Zip Codes
Rudy Area Codes
Income in Rudy
Income Overview in Rudy
| Characteristic | Number | Measure |
| Per Capita Income | 119 | $17,308 |
| Median Family Income | 24 | $0 |
| Mean Family Income | 24 | $35,663 |
| Median Household Income | 50 | $48,750 |
| Mean Household Income | 50 | $40,628 |
| Income Deficit | 24 | $0 |
| Wage / Income Gap (%) | 119 | 0.00% |
| Wage / Income Gap ($) | 119 | 100.00¢ per $1 |
| Gini / Inequality Index | 119 | 0.32 |
Earnings by Sex in Rudy
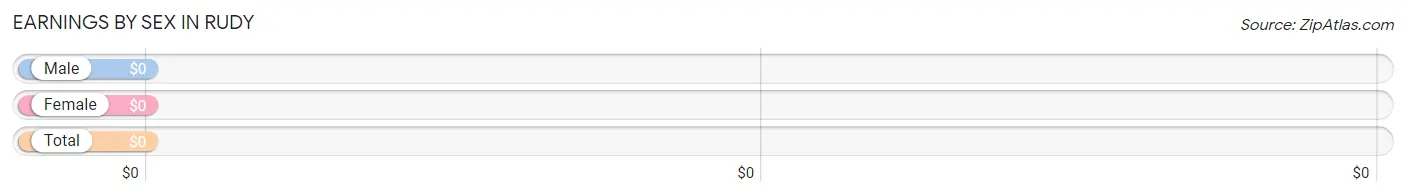
| Sex | Number | Average Earnings |
| Male | 19 (65.5%) | $0 |
| Female | 10 (34.5%) | $0 |
| Total | 29 (100.0%) | $0 |
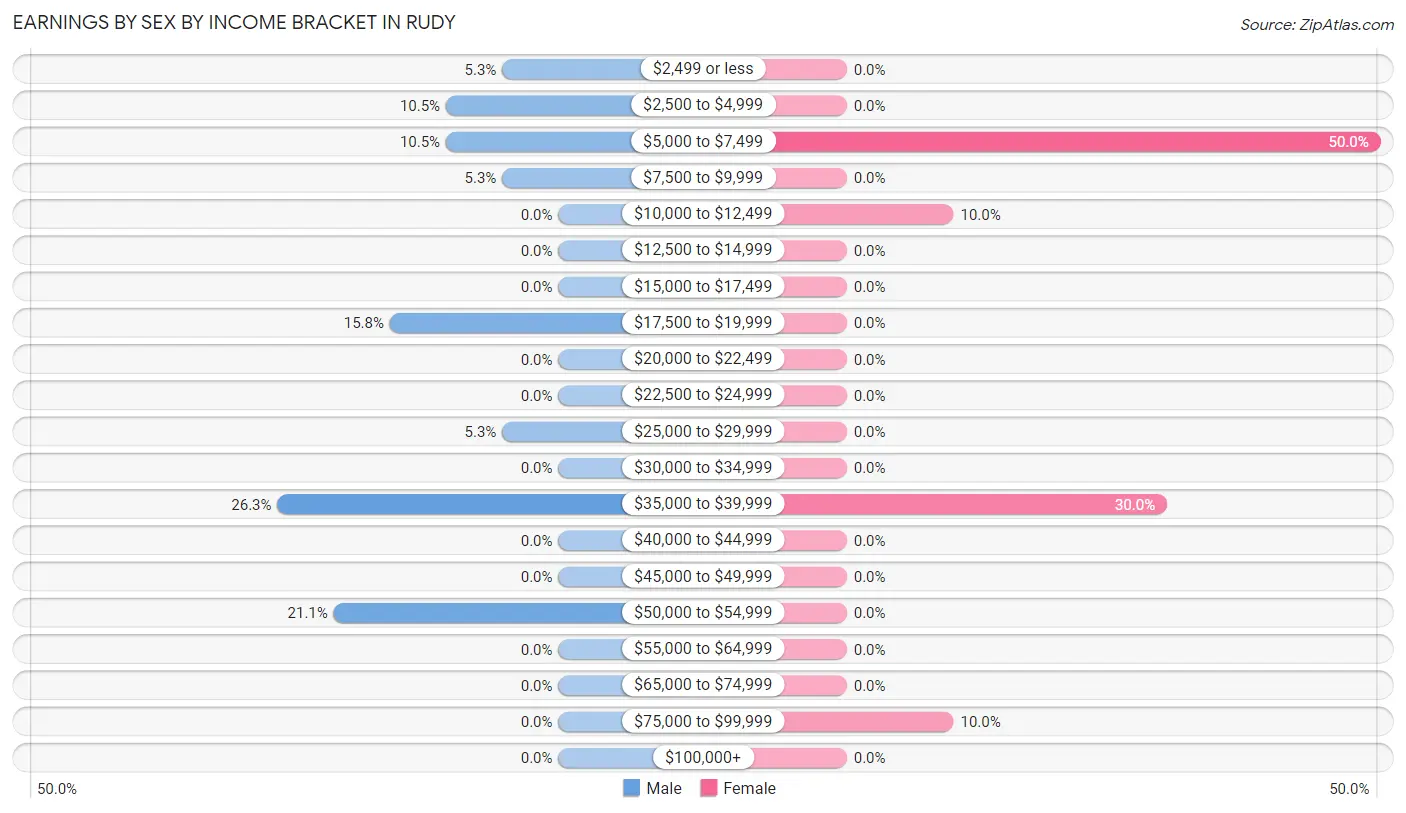
Earnings by Sex by Income Bracket in Rudy
The most common earnings brackets in Rudy are $35,000 to $39,999 for men (5 | 26.3%) and $5,000 to $7,499 for women (5 | 50.0%).
| Income | Male | Female |
| $2,499 or less | 1 (5.3%) | 0 (0.0%) |
| $2,500 to $4,999 | 2 (10.5%) | 0 (0.0%) |
| $5,000 to $7,499 | 2 (10.5%) | 5 (50.0%) |
| $7,500 to $9,999 | 1 (5.3%) | 0 (0.0%) |
| $10,000 to $12,499 | 0 (0.0%) | 1 (10.0%) |
| $12,500 to $14,999 | 0 (0.0%) | 0 (0.0%) |
| $15,000 to $17,499 | 0 (0.0%) | 0 (0.0%) |
| $17,500 to $19,999 | 3 (15.8%) | 0 (0.0%) |
| $20,000 to $22,499 | 0 (0.0%) | 0 (0.0%) |
| $22,500 to $24,999 | 0 (0.0%) | 0 (0.0%) |
| $25,000 to $29,999 | 1 (5.3%) | 0 (0.0%) |
| $30,000 to $34,999 | 0 (0.0%) | 0 (0.0%) |
| $35,000 to $39,999 | 5 (26.3%) | 3 (30.0%) |
| $40,000 to $44,999 | 0 (0.0%) | 0 (0.0%) |
| $45,000 to $49,999 | 0 (0.0%) | 0 (0.0%) |
| $50,000 to $54,999 | 4 (21.0%) | 0 (0.0%) |
| $55,000 to $64,999 | 0 (0.0%) | 0 (0.0%) |
| $65,000 to $74,999 | 0 (0.0%) | 0 (0.0%) |
| $75,000 to $99,999 | 0 (0.0%) | 1 (10.0%) |
| $100,000+ | 0 (0.0%) | 0 (0.0%) |
| Total | 19 (100.0%) | 10 (100.0%) |
Earnings by Sex by Educational Attainment in Rudy
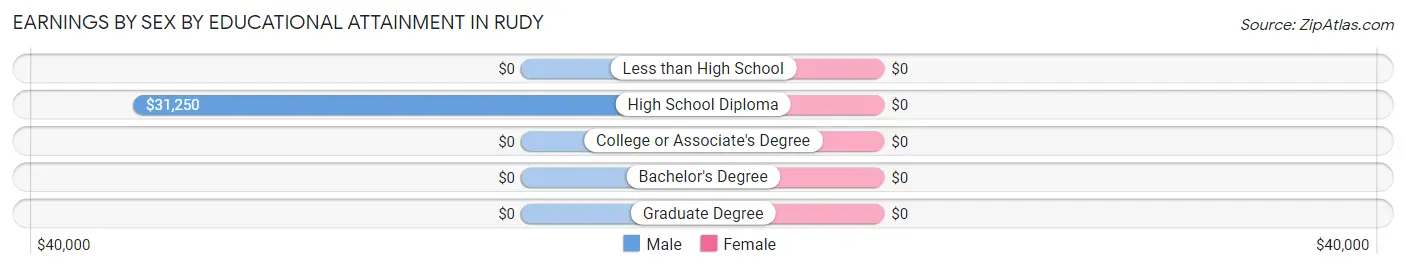
| Educational Attainment | Male Income | Female Income |
| Less than High School | - | - |
| High School Diploma | $31,250 | $0 |
| College or Associate's Degree | - | - |
| Bachelor's Degree | - | - |
| Graduate Degree | - | - |
| Total | - | - |
Family Income in Rudy
Family Income Brackets in Rudy
According to the Rudy family income data, there are 11 families falling into the $10,000 to $14,999 income range, which is the most common income bracket and makes up 45.8% of all families.
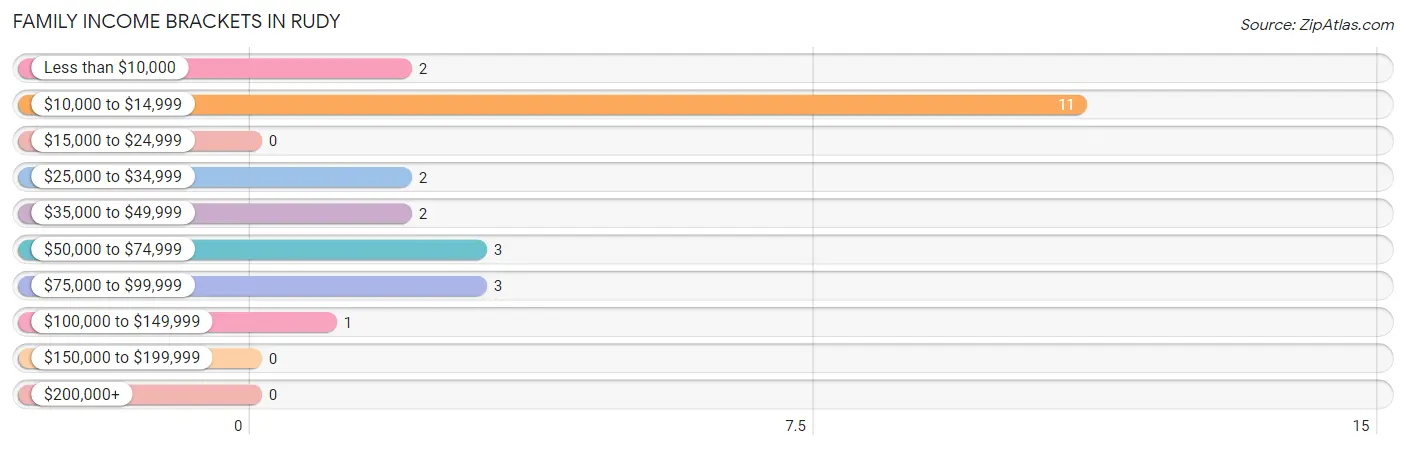
| Income Bracket | # Families | % Families |
| Less than $10,000 | 2 | 8.3% |
| $10,000 to $14,999 | 11 | 45.8% |
| $15,000 to $24,999 | 0 | 0.0% |
| $25,000 to $34,999 | 2 | 8.3% |
| $35,000 to $49,999 | 2 | 8.3% |
| $50,000 to $74,999 | 3 | 12.5% |
| $75,000 to $99,999 | 3 | 12.5% |
| $100,000 to $149,999 | 1 | 4.2% |
| $150,000 to $199,999 | 0 | 0.0% |
| $200,000+ | 0 | 0.0% |
Family Income by Famaliy Size in Rudy
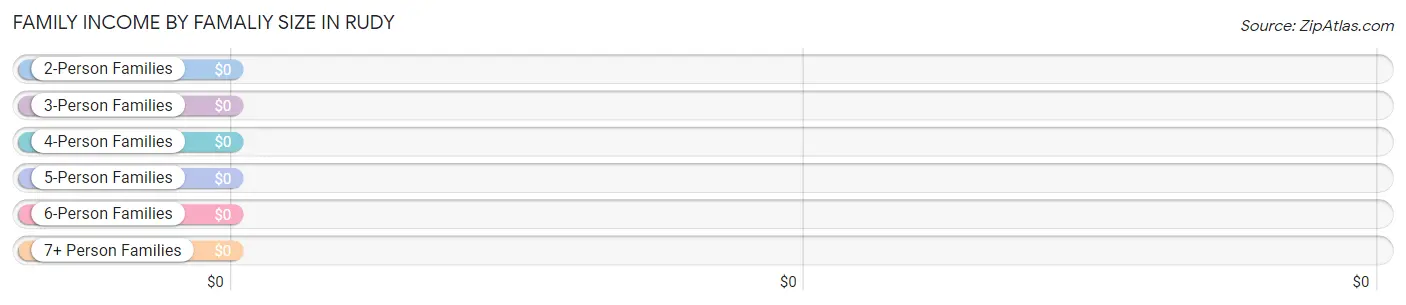
| Income Bracket | # Families | Median Income |
| 2-Person Families | 9 (37.5%) | $0 |
| 3-Person Families | 11 (45.8%) | $0 |
| 4-Person Families | 0 (0.0%) | $0 |
| 5-Person Families | 1 (4.2%) | $0 |
| 6-Person Families | 2 (8.3%) | $0 |
| 7+ Person Families | 1 (4.2%) | $0 |
| Total | 24 (100.0%) | $0 |
Family Income by Number of Earners in Rudy
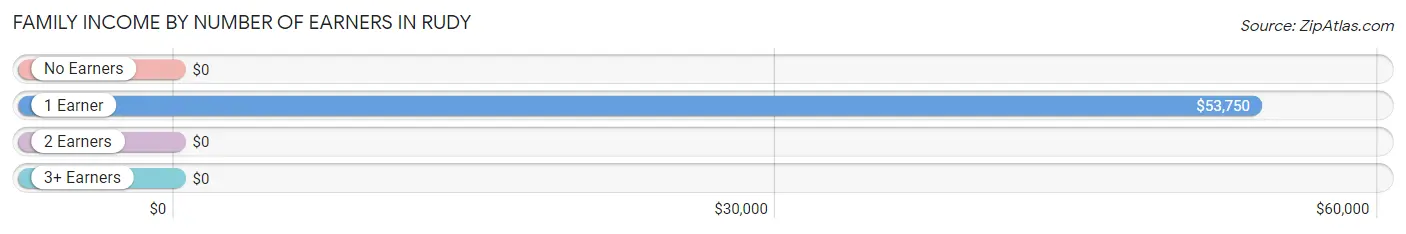
| Number of Earners | # Families | Median Income |
| No Earners | 10 (41.7%) | $0 |
| 1 Earner | 5 (20.8%) | $53,750 |
| 2 Earners | 9 (37.5%) | $0 |
| 3+ Earners | 0 (0.0%) | $0 |
| Total | 24 (100.0%) | $0 |
Household Income in Rudy
Household Income Brackets in Rudy
With 21 households falling in the category, the $50,000 to $74,999 income range is the most frequent in Rudy, accounting for 42.0% of all households.
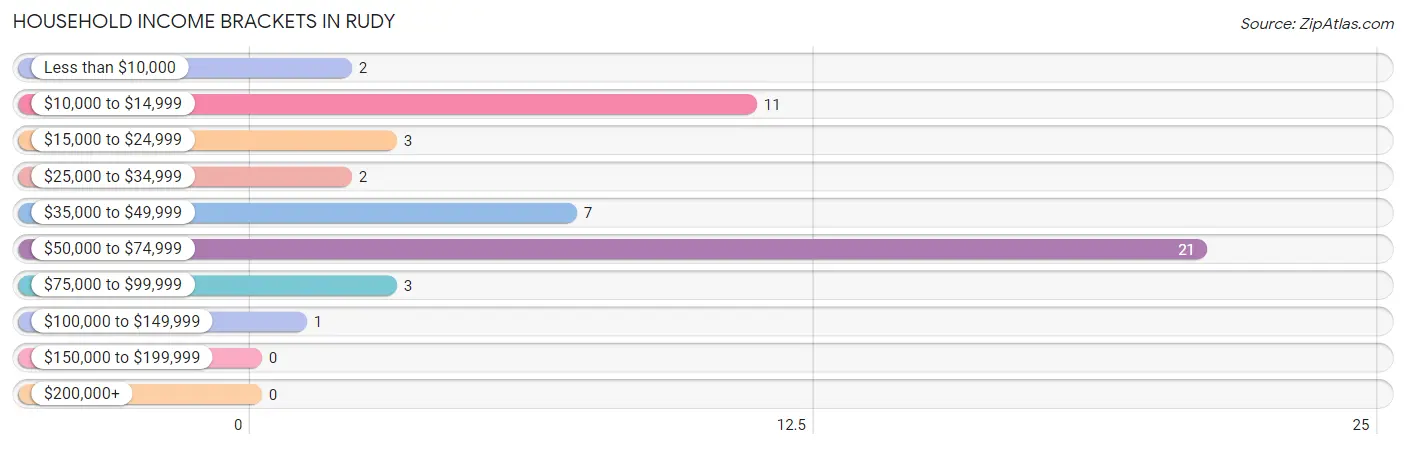
| Income Bracket | # Households | % Households |
| Less than $10,000 | 2 | 4.0% |
| $10,000 to $14,999 | 11 | 22.0% |
| $15,000 to $24,999 | 3 | 6.0% |
| $25,000 to $34,999 | 2 | 4.0% |
| $35,000 to $49,999 | 7 | 14.0% |
| $50,000 to $74,999 | 21 | 42.0% |
| $75,000 to $99,999 | 3 | 6.0% |
| $100,000 to $149,999 | 1 | 2.0% |
| $150,000 to $199,999 | 0 | 0.0% |
| $200,000+ | 0 | 0.0% |
Household Income by Householder Age in Rudy
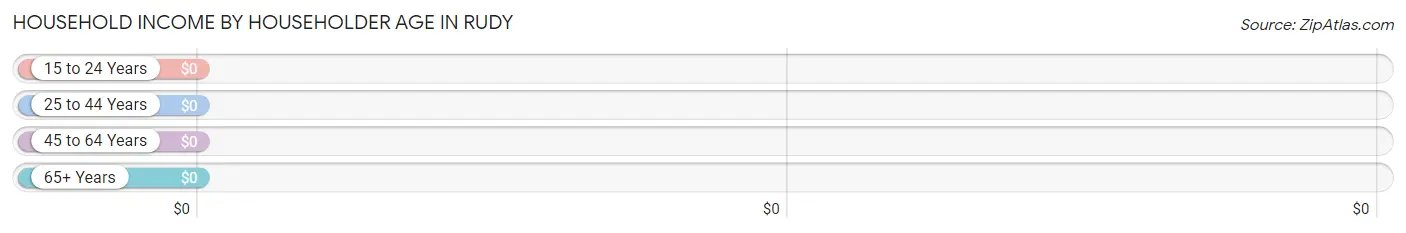
| Income Bracket | # Households | Median Income |
| 15 to 24 Years | 5 (10.0%) | $0 |
| 25 to 44 Years | 2 (4.0%) | $0 |
| 45 to 64 Years | 34 (68.0%) | $0 |
| 65+ Years | 9 (18.0%) | $0 |
| Total | 50 (100.0%) | $48,750 |
Poverty in Rudy
Income Below Poverty by Sex and Age in Rudy
With 50.0% poverty level for males and 28.8% for females among the residents of Rudy, 6 to 11 year old males and 12 to 14 year old females are the most vulnerable to poverty, with 4 males (100.0%) and 6 females (100.0%) in their respective age groups living below the poverty level.
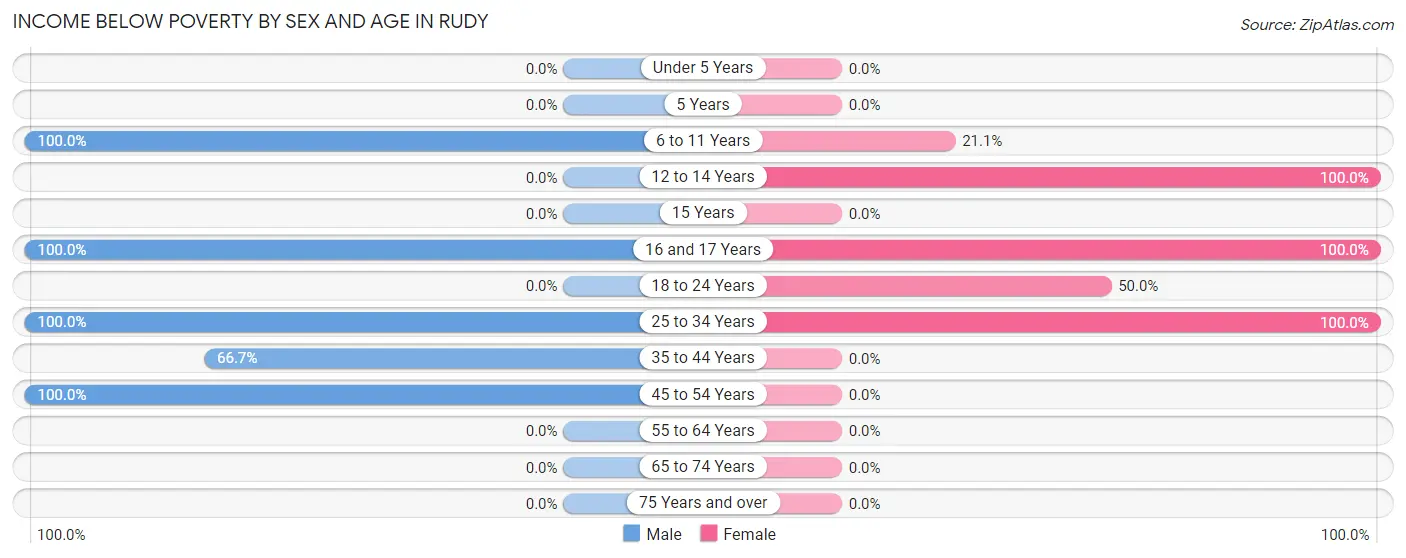
| Age Bracket | Male | Female |
| Under 5 Years | 0 (0.0%) | 0 (0.0%) |
| 5 Years | 0 (0.0%) | 0 (0.0%) |
| 6 to 11 Years | 4 (100.0%) | 4 (21.0%) |
| 12 to 14 Years | 0 (0.0%) | 6 (100.0%) |
| 15 Years | 0 (0.0%) | 0 (0.0%) |
| 16 and 17 Years | 7 (100.0%) | 2 (100.0%) |
| 18 to 24 Years | 0 (0.0%) | 6 (50.0%) |
| 25 to 34 Years | 1 (100.0%) | 3 (100.0%) |
| 35 to 44 Years | 2 (66.7%) | 0 (0.0%) |
| 45 to 54 Years | 9 (100.0%) | 0 (0.0%) |
| 55 to 64 Years | 0 (0.0%) | 0 (0.0%) |
| 65 to 74 Years | 0 (0.0%) | 0 (0.0%) |
| 75 Years and over | 0 (0.0%) | 0 (0.0%) |
| Total | 23 (50.0%) | 21 (28.8%) |
Income Above Poverty by Sex and Age in Rudy
According to the poverty statistics in Rudy, males aged 18 to 24 years and females aged 45 to 54 years are the age groups that are most secure financially, with 100.0% of males and 100.0% of females in these age groups living above the poverty line.
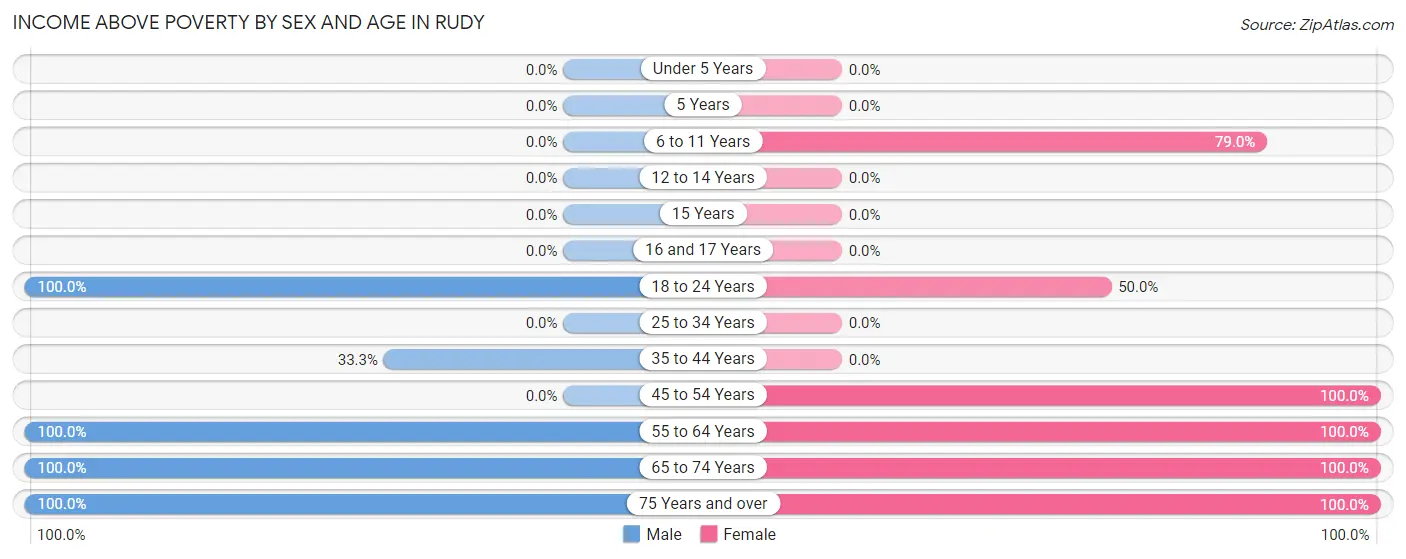
| Age Bracket | Male | Female |
| Under 5 Years | 0 (0.0%) | 0 (0.0%) |
| 5 Years | 0 (0.0%) | 0 (0.0%) |
| 6 to 11 Years | 0 (0.0%) | 15 (78.9%) |
| 12 to 14 Years | 0 (0.0%) | 0 (0.0%) |
| 15 Years | 0 (0.0%) | 0 (0.0%) |
| 16 and 17 Years | 0 (0.0%) | 0 (0.0%) |
| 18 to 24 Years | 6 (100.0%) | 6 (50.0%) |
| 25 to 34 Years | 0 (0.0%) | 0 (0.0%) |
| 35 to 44 Years | 1 (33.3%) | 0 (0.0%) |
| 45 to 54 Years | 0 (0.0%) | 1 (100.0%) |
| 55 to 64 Years | 7 (100.0%) | 21 (100.0%) |
| 65 to 74 Years | 6 (100.0%) | 6 (100.0%) |
| 75 Years and over | 3 (100.0%) | 3 (100.0%) |
| Total | 23 (50.0%) | 52 (71.2%) |
Income Below Poverty Among Married-Couple Families in Rudy
The poverty statistics for married-couple families in Rudy show that 26.7% or 4 of the total 15 families live below the poverty line. Families with 3 or 4 children have the highest poverty rate of 100.0%, comprising of 2 families. On the other hand, families with 1 or 2 children have the lowest poverty rate of 0.0%, which includes 0 families.
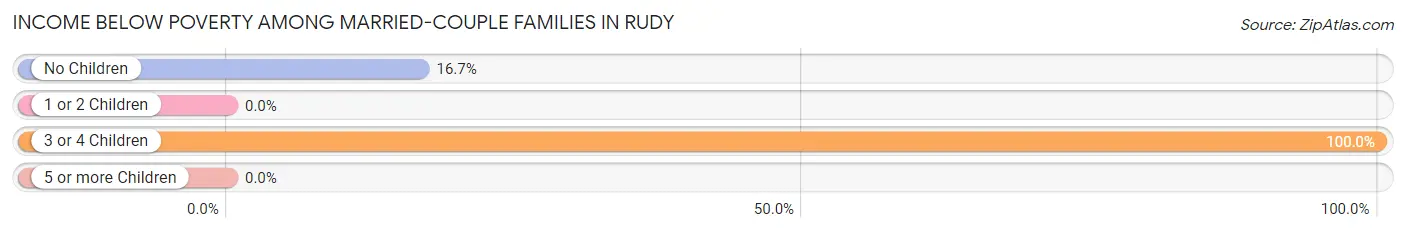
| Children | Above Poverty | Below Poverty |
| No Children | 10 (83.3%) | 2 (16.7%) |
| 1 or 2 Children | 1 (100.0%) | 0 (0.0%) |
| 3 or 4 Children | 0 (0.0%) | 2 (100.0%) |
| 5 or more Children | 0 (0.0%) | 0 (0.0%) |
| Total | 11 (73.3%) | 4 (26.7%) |
Income Below Poverty Among Single-Parent Households in Rudy
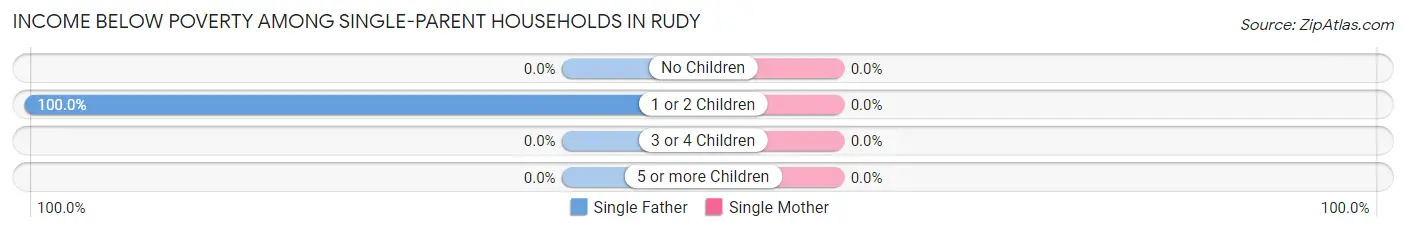
| Children | Single Father | Single Mother |
| No Children | 0 (0.0%) | 0 (0.0%) |
| 1 or 2 Children | 9 (100.0%) | 0 (0.0%) |
| 3 or 4 Children | 0 (0.0%) | 0 (0.0%) |
| 5 or more Children | 0 (0.0%) | 0 (0.0%) |
| Total | 9 (100.0%) | 0 (0.0%) |
Income Below Poverty Among Married-Couple vs Single-Parent Households in Rudy
The poverty data for Rudy shows that 4 of the married-couple family households (26.7%) and 9 of the single-parent households (100.0%) are living below the poverty level. Within the married-couple family households, those with 3 or 4 children have the highest poverty rate, with 2 households (100.0%) falling below the poverty line. Among the single-parent households, those with 1 or 2 children have the highest poverty rate, with 9 household (100.0%) living below poverty.
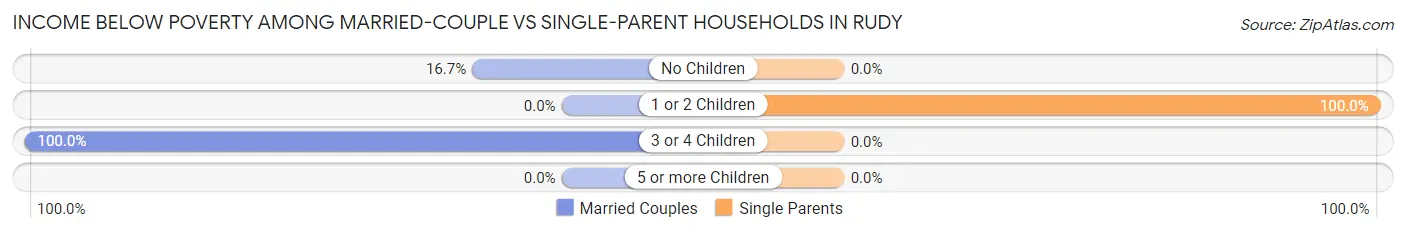
| Children | Married-Couple Families | Single-Parent Households |
| No Children | 2 (16.7%) | 0 (0.0%) |
| 1 or 2 Children | 0 (0.0%) | 9 (100.0%) |
| 3 or 4 Children | 2 (100.0%) | 0 (0.0%) |
| 5 or more Children | 0 (0.0%) | 0 (0.0%) |
| Total | 4 (26.7%) | 9 (100.0%) |
Race in Rudy
The most populous races in Rudy are White / Caucasian (94 | 79.0%), Black / African American (15 | 12.6%), and Two or more Races (8 | 6.7%).
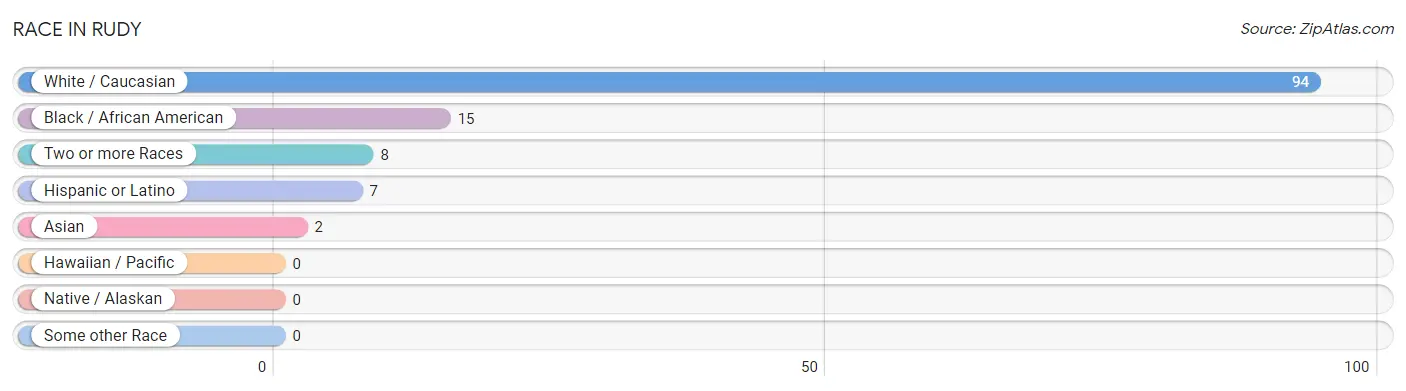
| Race | # Population | % Population |
| Asian | 2 | 1.7% |
| Black / African American | 15 | 12.6% |
| Hawaiian / Pacific | 0 | 0.0% |
| Hispanic or Latino | 7 | 5.9% |
| Native / Alaskan | 0 | 0.0% |
| White / Caucasian | 94 | 79.0% |
| Two or more Races | 8 | 6.7% |
| Some other Race | 0 | 0.0% |
| Total | 119 | 100.0% |
Ancestry in Rudy
The most populous ancestries reported in Rudy are Scandinavian (18 | 15.1%), Irish (15 | 12.6%), German (8 | 6.7%), American (7 | 5.9%), and Central American (5 | 4.2%), together accounting for 44.5% of all Rudy residents.
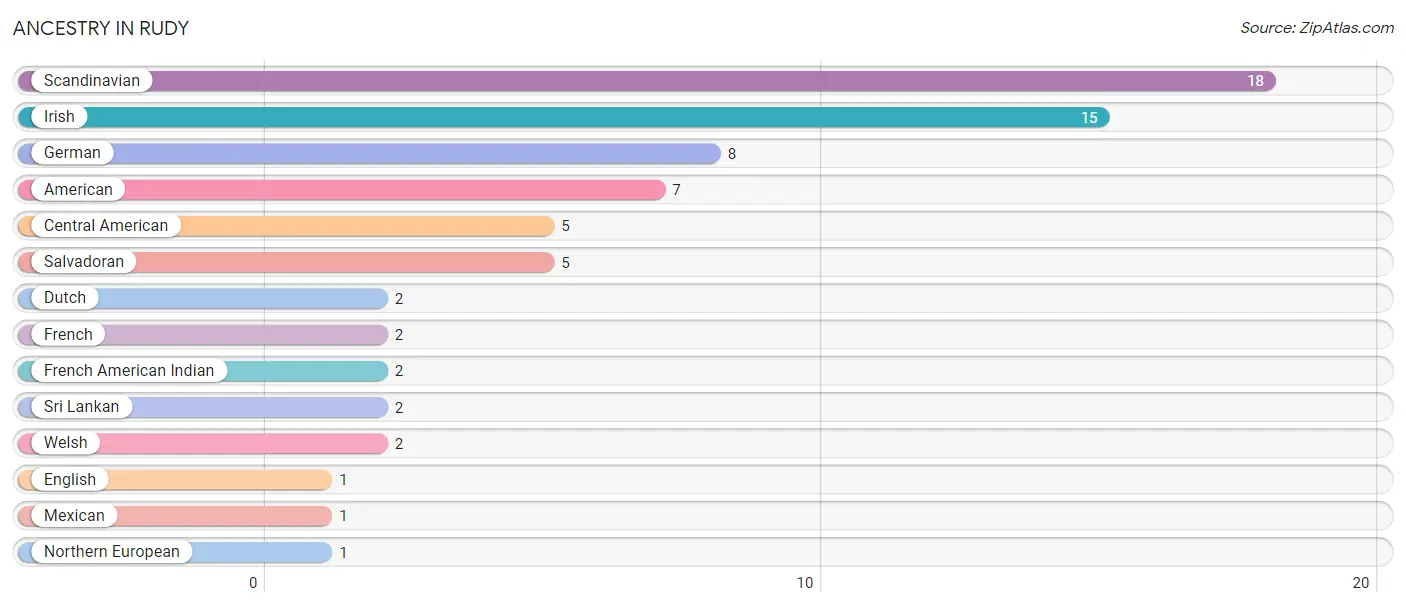
| Ancestry | # Population | % Population |
| American | 7 | 5.9% |
| Central American | 5 | 4.2% |
| Dutch | 2 | 1.7% |
| English | 1 | 0.8% |
| French | 2 | 1.7% |
| French American Indian | 2 | 1.7% |
| German | 8 | 6.7% |
| Irish | 15 | 12.6% |
| Mexican | 1 | 0.8% |
| Northern European | 1 | 0.8% |
| Salvadoran | 5 | 4.2% |
| Scandinavian | 18 | 15.1% |
| Sri Lankan | 2 | 1.7% |
| Welsh | 2 | 1.7% | View All 14 Rows |
Immigrants in Rudy
The most numerous immigrant groups reported in Rudy came from Europe (4 | 3.4%), Germany (4 | 3.4%), Western Europe (4 | 3.4%), Asia (2 | 1.7%), and South Eastern Asia (2 | 1.7%), together accounting for 13.4% of all Rudy residents.
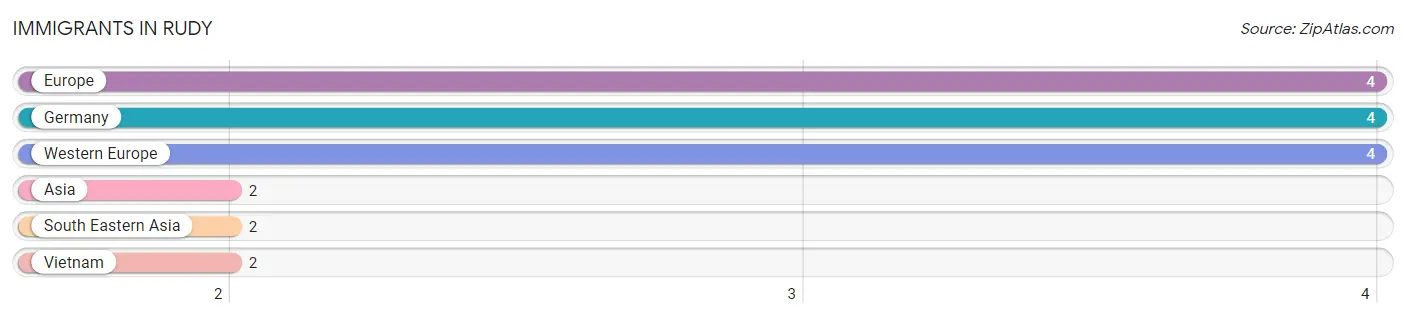
| Immigration Origin | # Population | % Population |
| Asia | 2 | 1.7% |
| Europe | 4 | 3.4% |
| Germany | 4 | 3.4% |
| South Eastern Asia | 2 | 1.7% |
| Vietnam | 2 | 1.7% |
| Western Europe | 4 | 3.4% | View All 6 Rows |
Sex and Age in Rudy
Sex and Age in Rudy
The most populous age groups in Rudy are 15 to 19 Years (9 | 19.6%) for men and 10 to 14 Years (23 | 31.5%) for women.
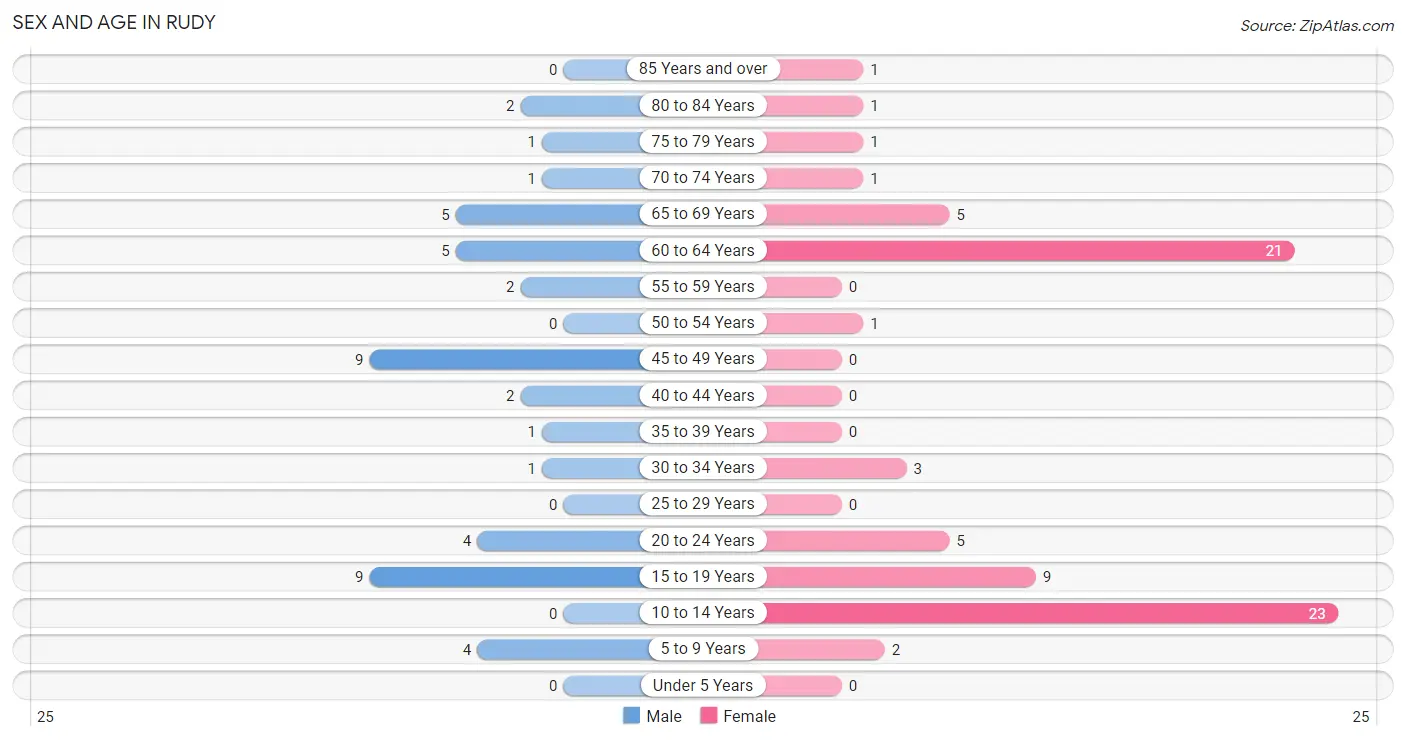
| Age Bracket | Male | Female |
| Under 5 Years | 0 (0.0%) | 0 (0.0%) |
| 5 to 9 Years | 4 (8.7%) | 2 (2.7%) |
| 10 to 14 Years | 0 (0.0%) | 23 (31.5%) |
| 15 to 19 Years | 9 (19.6%) | 9 (12.3%) |
| 20 to 24 Years | 4 (8.7%) | 5 (6.9%) |
| 25 to 29 Years | 0 (0.0%) | 0 (0.0%) |
| 30 to 34 Years | 1 (2.2%) | 3 (4.1%) |
| 35 to 39 Years | 1 (2.2%) | 0 (0.0%) |
| 40 to 44 Years | 2 (4.3%) | 0 (0.0%) |
| 45 to 49 Years | 9 (19.6%) | 0 (0.0%) |
| 50 to 54 Years | 0 (0.0%) | 1 (1.4%) |
| 55 to 59 Years | 2 (4.3%) | 0 (0.0%) |
| 60 to 64 Years | 5 (10.9%) | 21 (28.8%) |
| 65 to 69 Years | 5 (10.9%) | 5 (6.9%) |
| 70 to 74 Years | 1 (2.2%) | 1 (1.4%) |
| 75 to 79 Years | 1 (2.2%) | 1 (1.4%) |
| 80 to 84 Years | 2 (4.3%) | 1 (1.4%) |
| 85 Years and over | 0 (0.0%) | 1 (1.4%) |
| Total | 46 (100.0%) | 73 (100.0%) |
Families and Households in Rudy
Median Family Size in Rudy
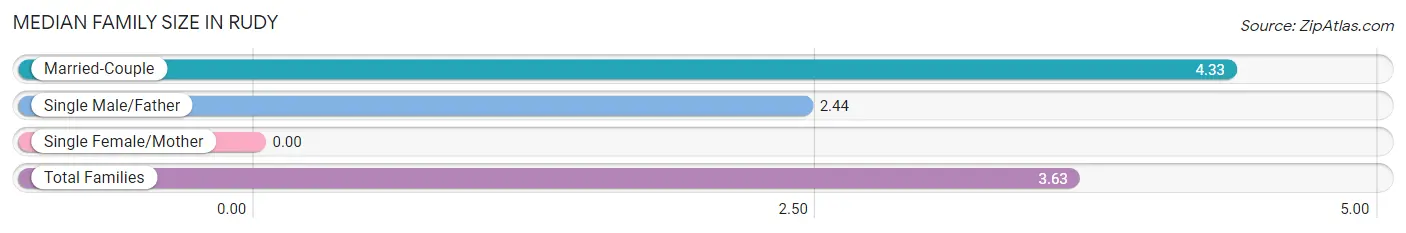
| Family Type | # Families | Family Size |
| Married-Couple | 15 (62.5%) | 4.33 |
| Single Male/Father | 9 (37.5%) | 2.44 |
| Single Female/Mother | 0 (0.0%) | - |
| Total Families | 24 (100.0%) | 3.63 |
Median Household Size in Rudy
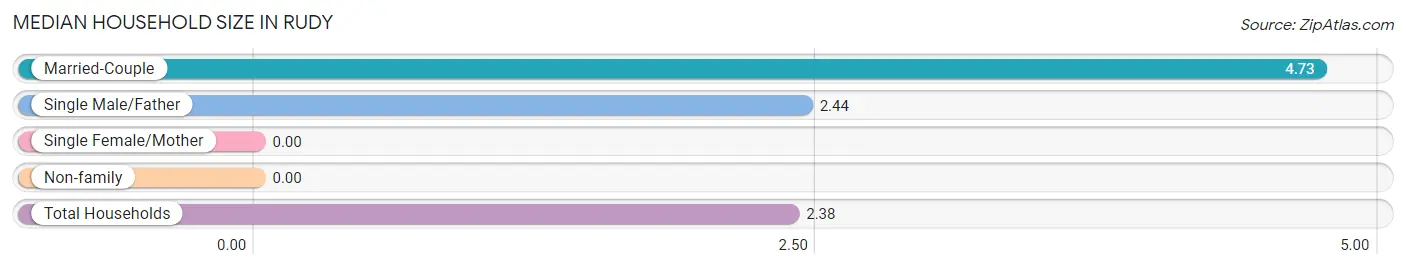
| Household Type | # Households | Household Size |
| Married-Couple | 15 (30.0%) | 4.73 |
| Single Male/Father | 9 (18.0%) | 2.44 |
| Single Female/Mother | 0 (0.0%) | - |
| Non-family | 26 (52.0%) | - |
| Total Households | 50 (100.0%) | 2.38 |
Household Size by Marriage Status in Rudy
Out of a total of 50 households in Rudy, 24 (48.0%) are family households, while 26 (52.0%) are nonfamily households. The most numerous type of family households are 3-person households, comprising 11, and the most common type of nonfamily households are 1-person households, comprising 26.
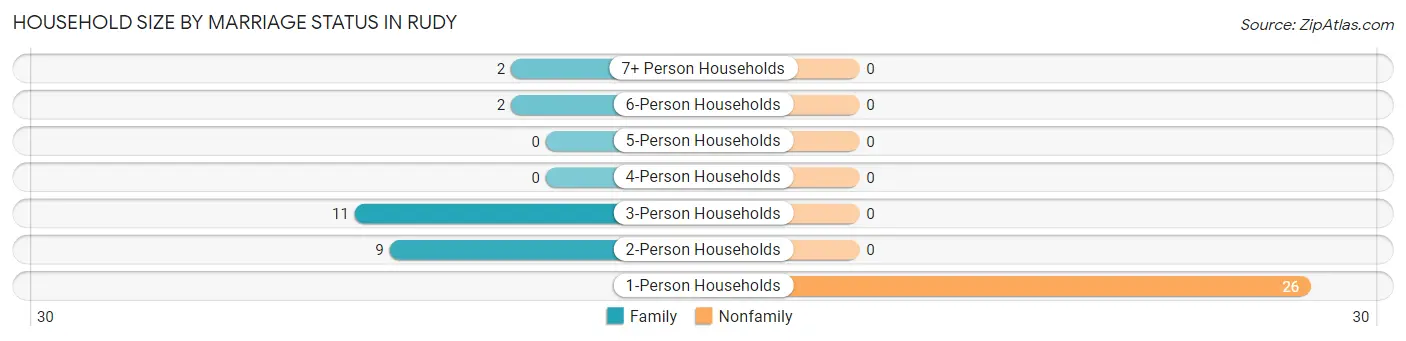
| Household Size | Family Households | Nonfamily Households |
| 1-Person Households | - | 26 (52.0%) |
| 2-Person Households | 9 (18.0%) | 0 (0.0%) |
| 3-Person Households | 11 (22.0%) | 0 (0.0%) |
| 4-Person Households | 0 (0.0%) | 0 (0.0%) |
| 5-Person Households | 0 (0.0%) | 0 (0.0%) |
| 6-Person Households | 2 (4.0%) | 0 (0.0%) |
| 7+ Person Households | 2 (4.0%) | 0 (0.0%) |
| Total | 24 (48.0%) | 26 (52.0%) |
Female Fertility in Rudy
Fertility by Age in Rudy
| Age Bracket | Women with Births | Births / 1,000 Women |
| 15 to 19 years | 0 (0.0%) | 0.0 |
| 20 to 34 years | 0 (0.0%) | 0.0 |
| 35 to 50 years | 0 (0.0%) | 0.0 |
| Total | 0 (0.0%) | 0.0 |
Fertility by Age by Marriage Status in Rudy
| Age Bracket | Married | Unmarried |
| 15 to 19 years | 0 (0.0%) | 0 (0.0%) |
| 20 to 34 years | 0 (0.0%) | 0 (0.0%) |
| 35 to 50 years | 0 (0.0%) | 0 (0.0%) |
| Total | 0 (0.0%) | 0 (0.0%) |
Fertility by Education in Rudy
| Educational Attainment | Women with Births | Births / 1,000 Women |
| Less than High School | 0 (0.0%) | 0.0 |
| High School Diploma | 0 (0.0%) | 0.0 |
| College or Associate's Degree | 0 (0.0%) | 0.0 |
| Bachelor's Degree | 0 (0.0%) | 0.0 |
| Graduate Degree | 0 (0.0%) | 0.0 |
| Total | 0 (0.0%) | 0.0 |
Fertility by Education by Marriage Status in Rudy
| Educational Attainment | Married | Unmarried |
| Less than High School | 0 (0.0%) | 0 (0.0%) |
| High School Diploma | 0 (0.0%) | 0 (0.0%) |
| College or Associate's Degree | 0 (0.0%) | 0 (0.0%) |
| Bachelor's Degree | 0 (0.0%) | 0 (0.0%) |
| Graduate Degree | 0 (0.0%) | 0 (0.0%) |
| Total | 0 (0.0%) | 0 (0.0%) |
Employment Characteristics in Rudy
Employment by Class of Employer in Rudy
Among the 28 employed individuals in Rudy, private company employees (9 | 32.1%), local government employees (6 | 21.4%), and self-employed (incorporated) (5 | 17.9%) make up the most common classes of employment.
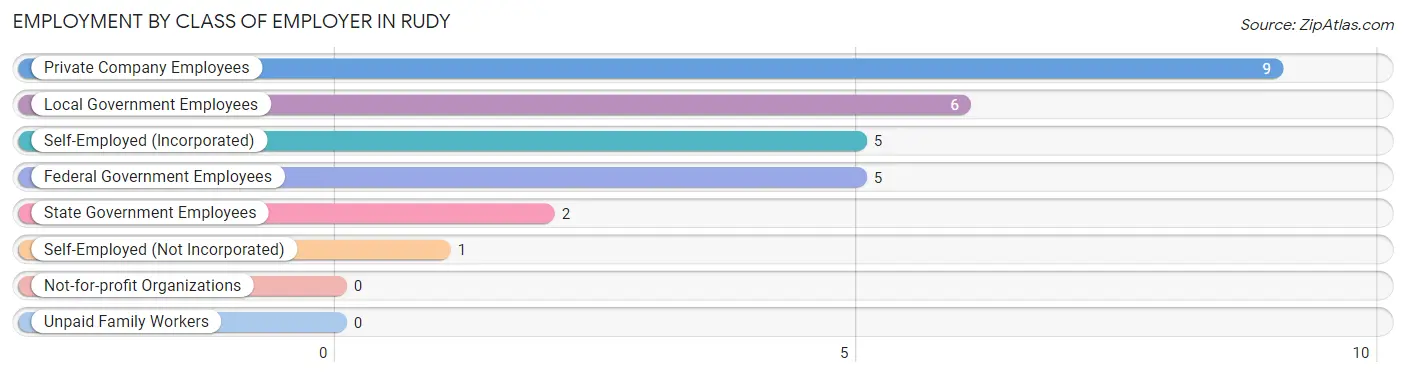
| Employer Class | # Employees | % Employees |
| Private Company Employees | 9 | 32.1% |
| Self-Employed (Incorporated) | 5 | 17.9% |
| Self-Employed (Not Incorporated) | 1 | 3.6% |
| Not-for-profit Organizations | 0 | 0.0% |
| Local Government Employees | 6 | 21.4% |
| State Government Employees | 2 | 7.1% |
| Federal Government Employees | 5 | 17.9% |
| Unpaid Family Workers | 0 | 0.0% |
| Total | 28 | 100.0% |
Employment Status by Age in Rudy
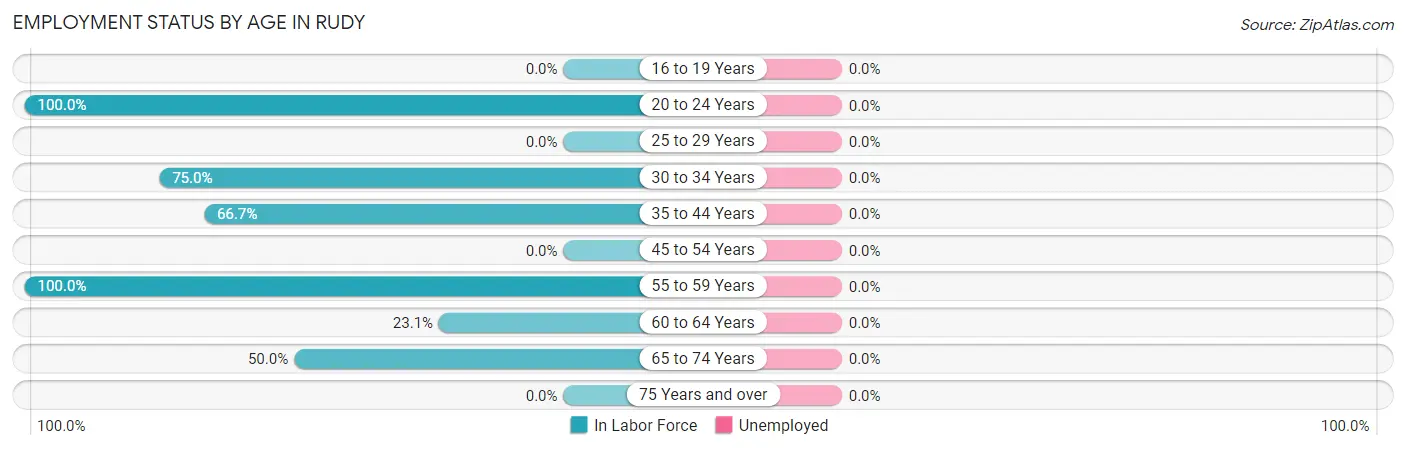
| Age Bracket | In Labor Force | Unemployed |
| 16 to 19 Years | 0 (0.0%) | 0 (0.0%) |
| 20 to 24 Years | 9 (100.0%) | 0 (0.0%) |
| 25 to 29 Years | 0 (0.0%) | 0 (0.0%) |
| 30 to 34 Years | 3 (75.0%) | 0 (0.0%) |
| 35 to 44 Years | 2 (66.7%) | 0 (0.0%) |
| 45 to 54 Years | 0 (0.0%) | 0 (0.0%) |
| 55 to 59 Years | 2 (100.0%) | 0 (0.0%) |
| 60 to 64 Years | 6 (23.1%) | 0 (0.0%) |
| 65 to 74 Years | 6 (50.0%) | 0 (0.0%) |
| 75 Years and over | 0 (0.0%) | 0 (0.0%) |
| Total | 28 (31.1%) | 0 (0.0%) |
Employment Status by Educational Attainment in Rudy
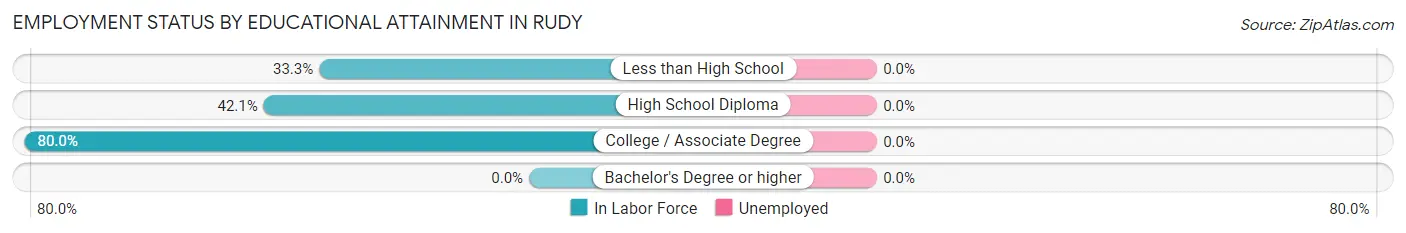
| Educational Attainment | In Labor Force | Unemployed |
| Less than High School | 1 (33.3%) | 0 (0.0%) |
| High School Diploma | 8 (42.1%) | 0 (0.0%) |
| College / Associate Degree | 4 (80.0%) | 0 (0.0%) |
| Bachelor's Degree or higher | 0 (0.0%) | 0 (0.0%) |
| Total | 13 (28.9%) | 0 (0.0%) |
Employment Occupations by Sex in Rudy
Management, Business, Science and Arts Occupations
The most common Management, Business, Science and Arts occupations in Rudy are Management (7 | 25.0%), Health Diagnosing & Treating (4 | 14.3%), and Health Technologists (1 | 3.6%).
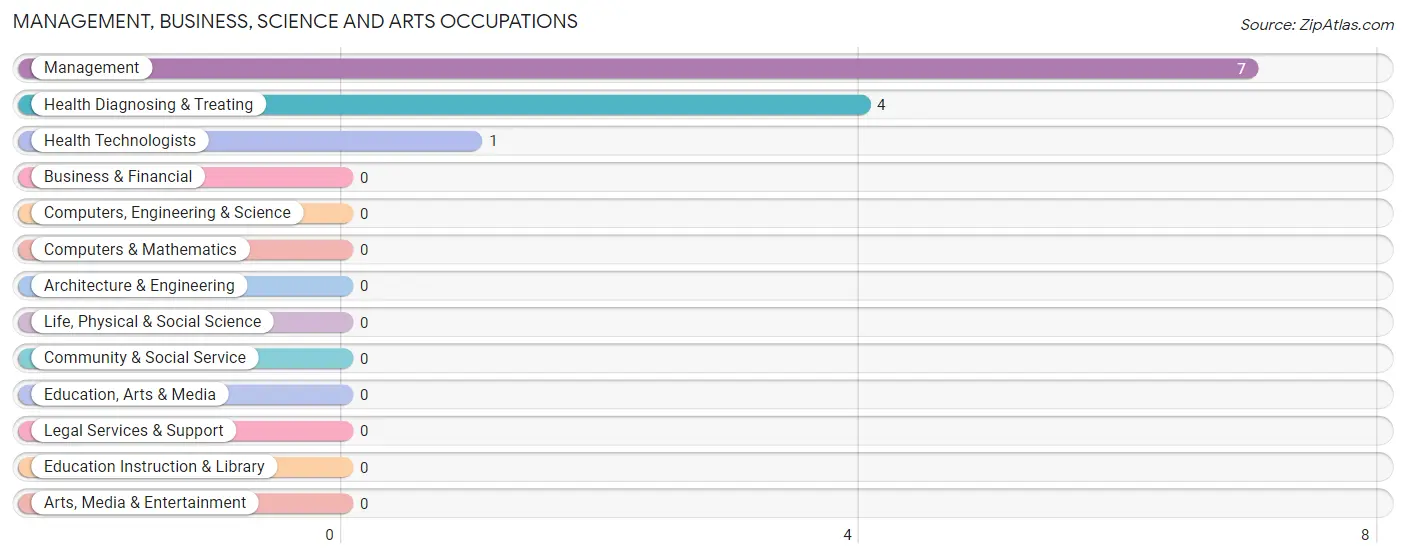
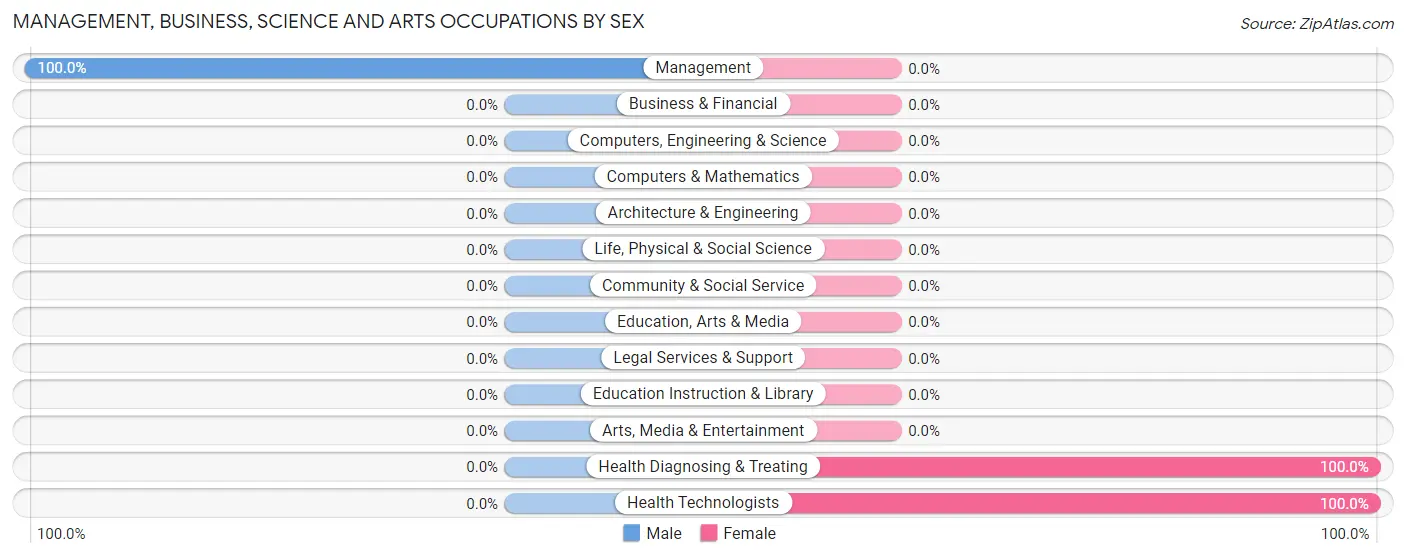
Management, Business, Science and Arts Occupations by Sex
| Occupation | Male | Female |
| Management | 7 (100.0%) | 0 (0.0%) |
| Business & Financial | 0 (0.0%) | 0 (0.0%) |
| Computers, Engineering & Science | 0 (0.0%) | 0 (0.0%) |
| Computers & Mathematics | 0 (0.0%) | 0 (0.0%) |
| Architecture & Engineering | 0 (0.0%) | 0 (0.0%) |
| Life, Physical & Social Science | 0 (0.0%) | 0 (0.0%) |
| Community & Social Service | 0 (0.0%) | 0 (0.0%) |
| Education, Arts & Media | 0 (0.0%) | 0 (0.0%) |
| Legal Services & Support | 0 (0.0%) | 0 (0.0%) |
| Education Instruction & Library | 0 (0.0%) | 0 (0.0%) |
| Arts, Media & Entertainment | 0 (0.0%) | 0 (0.0%) |
| Health Diagnosing & Treating | 0 (0.0%) | 4 (100.0%) |
| Health Technologists | 0 (0.0%) | 1 (100.0%) |
| Total (Category) | 7 (63.6%) | 4 (36.4%) |
| Total (Overall) | 18 (64.3%) | 10 (35.7%) |
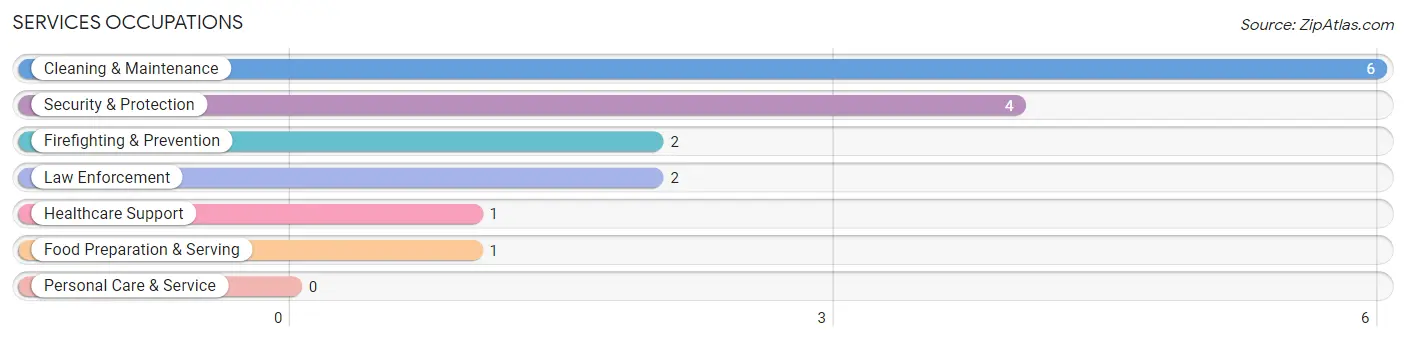
Services Occupations
The most common Services occupations in Rudy are Cleaning & Maintenance (6 | 21.4%), Security & Protection (4 | 14.3%), Firefighting & Prevention (2 | 7.1%), Law Enforcement (2 | 7.1%), and Healthcare Support (1 | 3.6%).
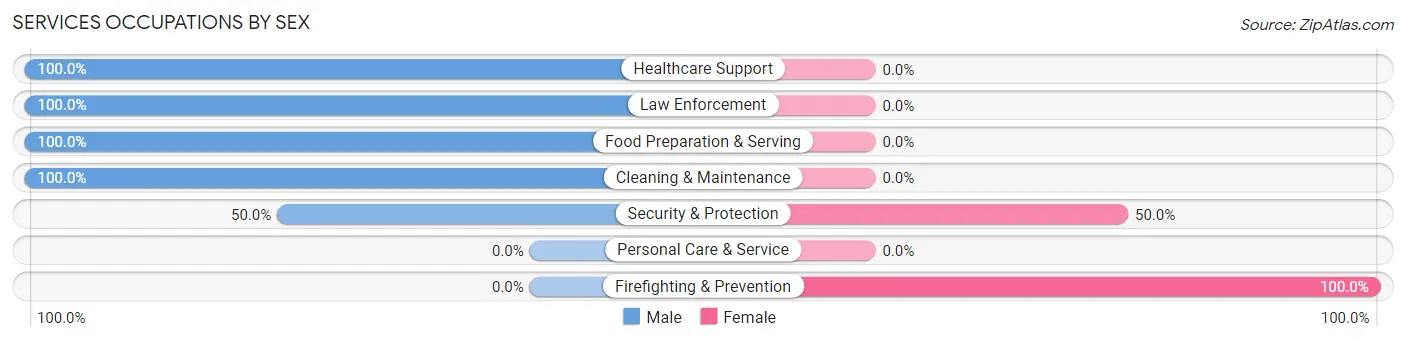
Services Occupations by Sex
Within the Services occupations in Rudy, the most male-oriented occupations are Healthcare Support (100.0%), Law Enforcement (100.0%), and Food Preparation & Serving (100.0%), while the most female-oriented occupations are Firefighting & Prevention (100.0%), and Security & Protection (50.0%).
| Occupation | Male | Female |
| Healthcare Support | 1 (100.0%) | 0 (0.0%) |
| Security & Protection | 2 (50.0%) | 2 (50.0%) |
| Firefighting & Prevention | 0 (0.0%) | 2 (100.0%) |
| Law Enforcement | 2 (100.0%) | 0 (0.0%) |
| Food Preparation & Serving | 1 (100.0%) | 0 (0.0%) |
| Cleaning & Maintenance | 6 (100.0%) | 0 (0.0%) |
| Personal Care & Service | 0 (0.0%) | 0 (0.0%) |
| Total (Category) | 10 (83.3%) | 2 (16.7%) |
| Total (Overall) | 18 (64.3%) | 10 (35.7%) |
Sales and Office Occupations
The most common Sales and Office occupations in Rudy are Office & Administration (3 | 10.7%), and Sales & Related (1 | 3.6%).
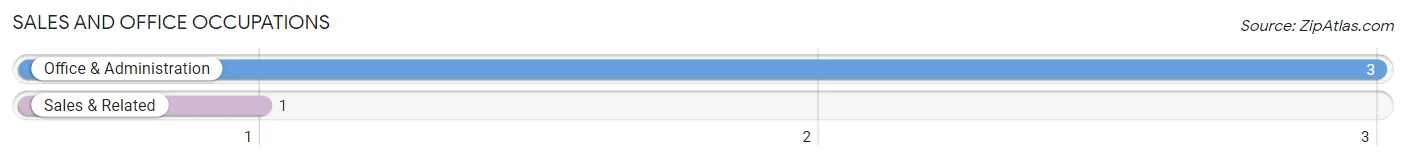
Sales and Office Occupations by Sex

| Occupation | Male | Female |
| Sales & Related | 0 (0.0%) | 1 (100.0%) |
| Office & Administration | 0 (0.0%) | 3 (100.0%) |
| Total (Category) | 0 (0.0%) | 4 (100.0%) |
| Total (Overall) | 18 (64.3%) | 10 (35.7%) |
Natural Resources, Construction and Maintenance Occupations
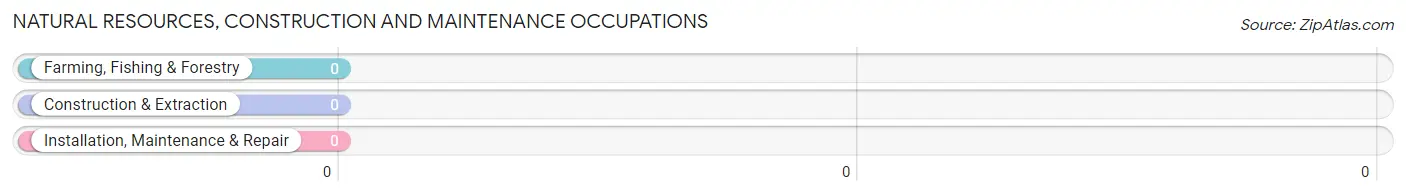
Natural Resources, Construction and Maintenance Occupations by Sex
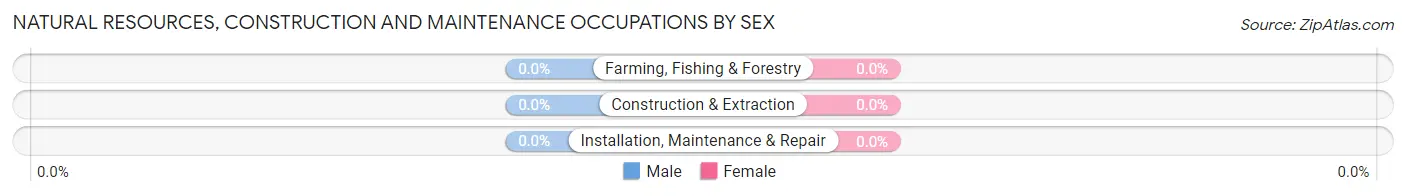
| Occupation | Male | Female |
| Farming, Fishing & Forestry | 0 (0.0%) | 0 (0.0%) |
| Construction & Extraction | 0 (0.0%) | 0 (0.0%) |
| Installation, Maintenance & Repair | 0 (0.0%) | 0 (0.0%) |
| Total (Category) | 0 (0.0%) | 0 (0.0%) |
| Total (Overall) | 18 (64.3%) | 10 (35.7%) |
Production, Transportation and Moving Occupations
The most common Production, Transportation and Moving occupations in Rudy are , and Transportation (1 | 3.6%).
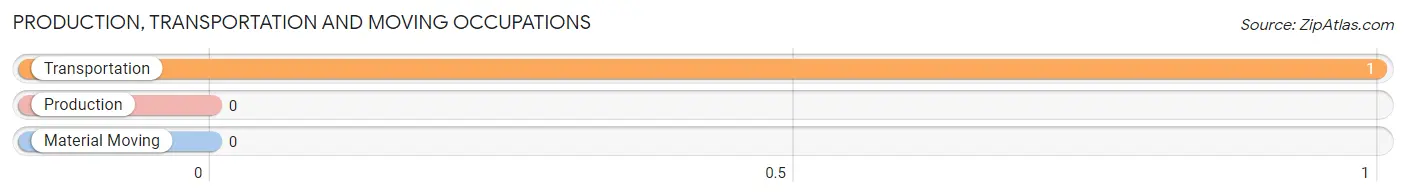
Production, Transportation and Moving Occupations by Sex
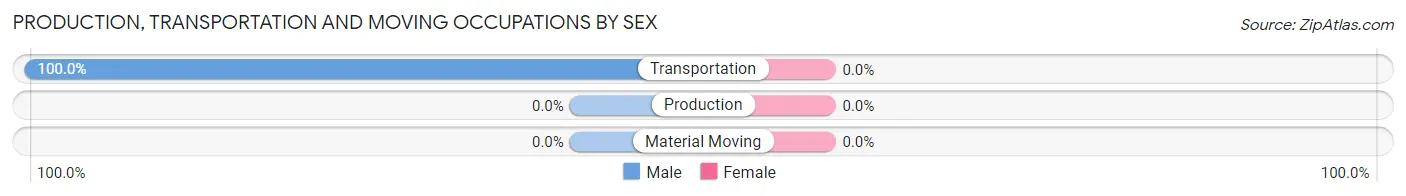
| Occupation | Male | Female |
| Production | 0 (0.0%) | 0 (0.0%) |
| Transportation | 1 (100.0%) | 0 (0.0%) |
| Material Moving | 0 (0.0%) | 0 (0.0%) |
| Total (Category) | 1 (100.0%) | 0 (0.0%) |
| Total (Overall) | 18 (64.3%) | 10 (35.7%) |
Employment Industries by Sex in Rudy
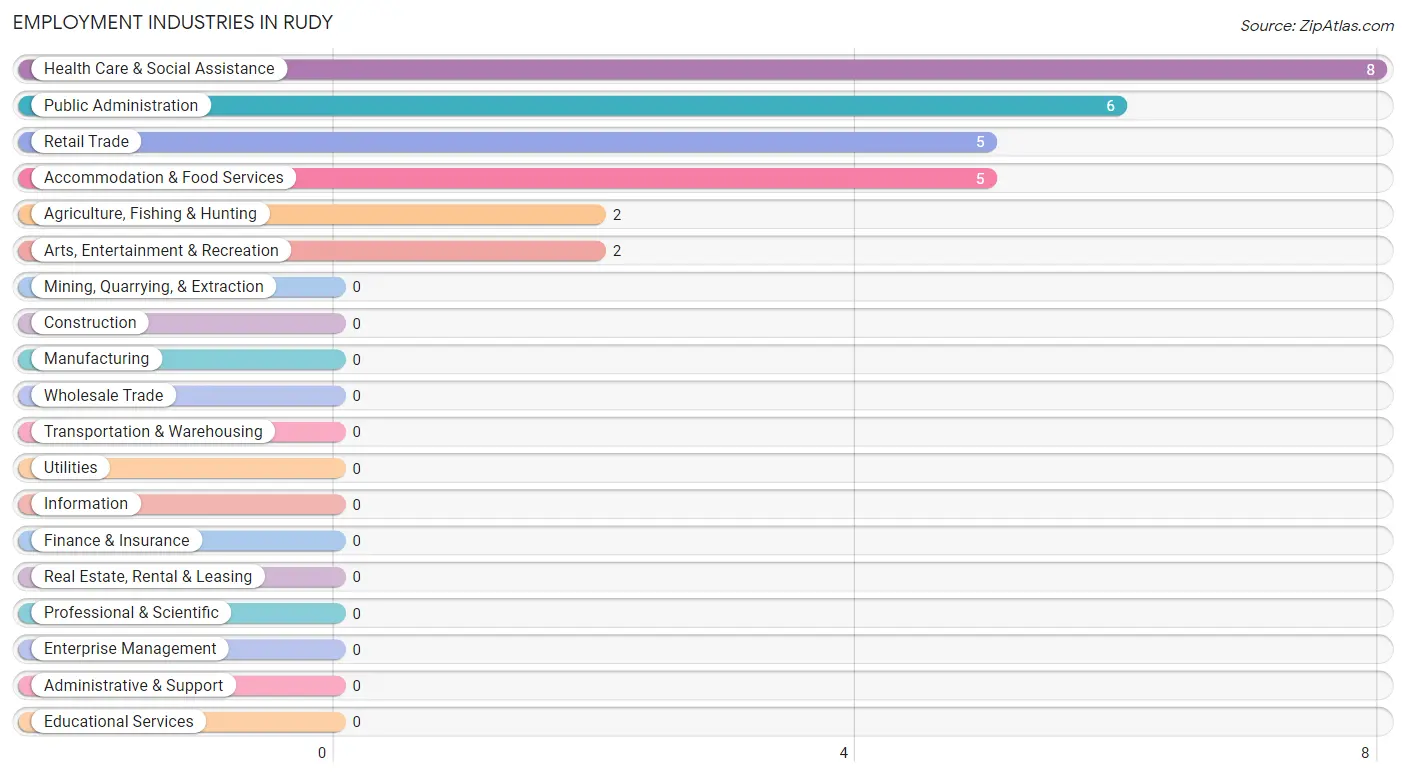
Employment Industries in Rudy
The major employment industries in Rudy include Health Care & Social Assistance (8 | 28.6%), Public Administration (6 | 21.4%), Retail Trade (5 | 17.9%), Accommodation & Food Services (5 | 17.9%), and Agriculture, Fishing & Hunting (2 | 7.1%).
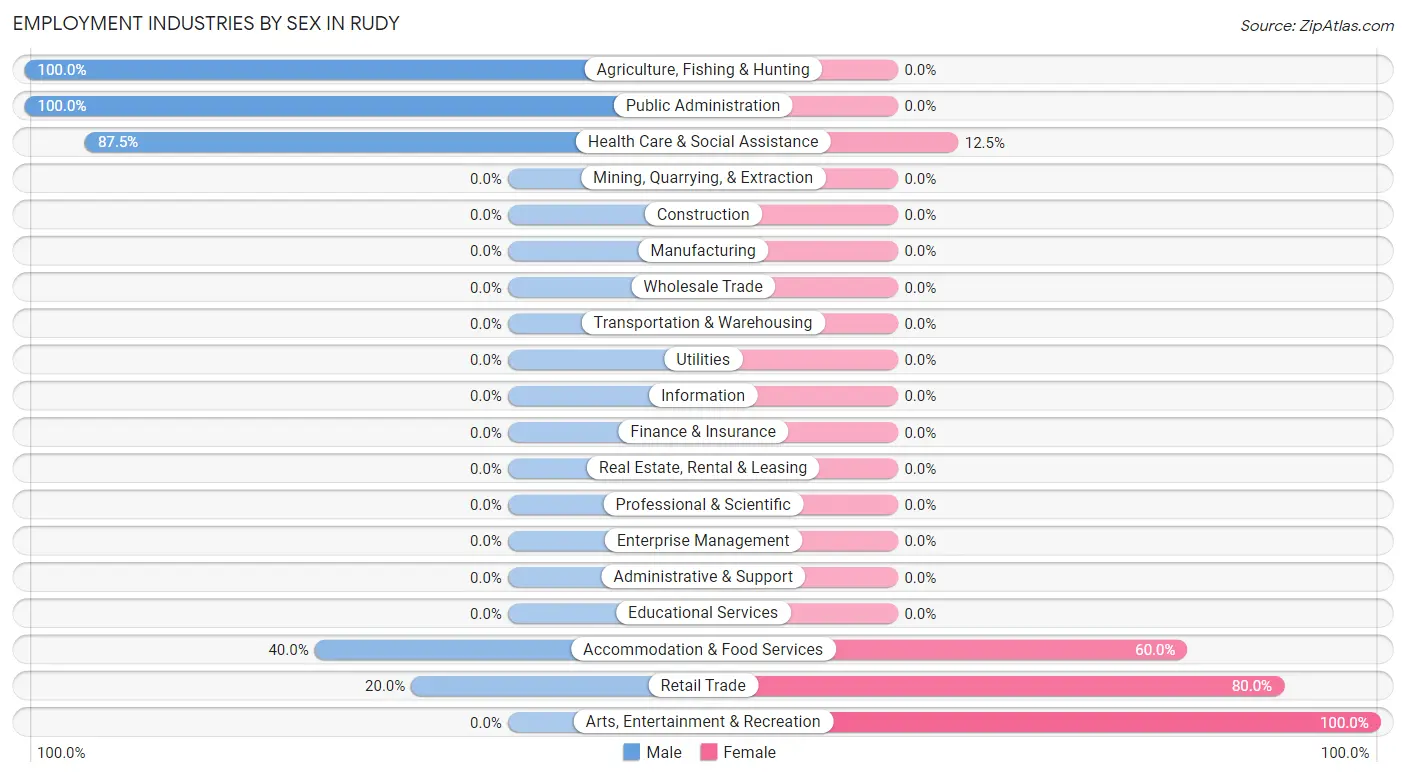
Employment Industries by Sex in Rudy
The Rudy industries that see more men than women are Agriculture, Fishing & Hunting (100.0%), Public Administration (100.0%), and Health Care & Social Assistance (87.5%), whereas the industries that tend to have a higher number of women are Arts, Entertainment & Recreation (100.0%), Retail Trade (80.0%), and Accommodation & Food Services (60.0%).
| Industry | Male | Female |
| Agriculture, Fishing & Hunting | 2 (100.0%) | 0 (0.0%) |
| Mining, Quarrying, & Extraction | 0 (0.0%) | 0 (0.0%) |
| Construction | 0 (0.0%) | 0 (0.0%) |
| Manufacturing | 0 (0.0%) | 0 (0.0%) |
| Wholesale Trade | 0 (0.0%) | 0 (0.0%) |
| Retail Trade | 1 (20.0%) | 4 (80.0%) |
| Transportation & Warehousing | 0 (0.0%) | 0 (0.0%) |
| Utilities | 0 (0.0%) | 0 (0.0%) |
| Information | 0 (0.0%) | 0 (0.0%) |
| Finance & Insurance | 0 (0.0%) | 0 (0.0%) |
| Real Estate, Rental & Leasing | 0 (0.0%) | 0 (0.0%) |
| Professional & Scientific | 0 (0.0%) | 0 (0.0%) |
| Enterprise Management | 0 (0.0%) | 0 (0.0%) |
| Administrative & Support | 0 (0.0%) | 0 (0.0%) |
| Educational Services | 0 (0.0%) | 0 (0.0%) |
| Health Care & Social Assistance | 7 (87.5%) | 1 (12.5%) |
| Arts, Entertainment & Recreation | 0 (0.0%) | 2 (100.0%) |
| Accommodation & Food Services | 2 (40.0%) | 3 (60.0%) |
| Public Administration | 6 (100.0%) | 0 (0.0%) |
| Total | 18 (64.3%) | 10 (35.7%) |
Education in Rudy
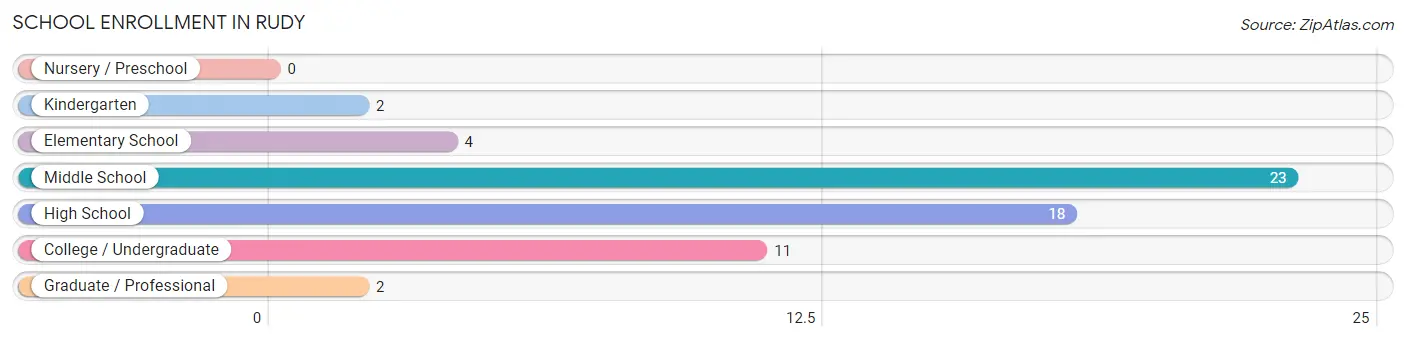
School Enrollment in Rudy
The most common levels of schooling among the 60 students in Rudy are middle school (23 | 38.3%), high school (18 | 30.0%), and college / undergraduate (11 | 18.3%).
| School Level | # Students | % Students |
| Nursery / Preschool | 0 | 0.0% |
| Kindergarten | 2 | 3.3% |
| Elementary School | 4 | 6.7% |
| Middle School | 23 | 38.3% |
| High School | 18 | 30.0% |
| College / Undergraduate | 11 | 18.3% |
| Graduate / Professional | 2 | 3.3% |
| Total | 60 | 100.0% |
School Enrollment by Age by Funding Source in Rudy
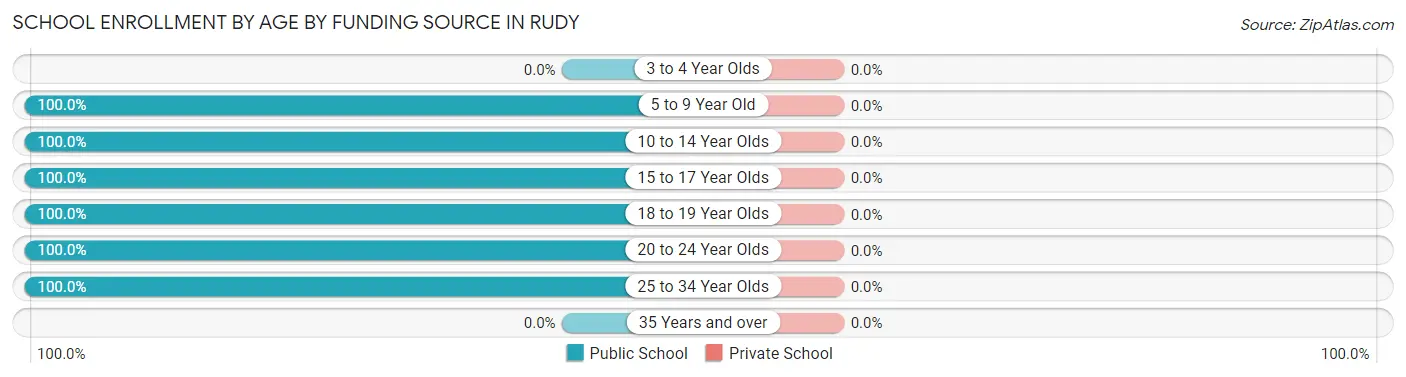
| Age Bracket | Public School | Private School |
| 3 to 4 Year Olds | 0 (0.0%) | 0 (0.0%) |
| 5 to 9 Year Old | 6 (100.0%) | 0 (0.0%) |
| 10 to 14 Year Olds | 23 (100.0%) | 0 (0.0%) |
| 15 to 17 Year Olds | 9 (100.0%) | 0 (0.0%) |
| 18 to 19 Year Olds | 9 (100.0%) | 0 (0.0%) |
| 20 to 24 Year Olds | 9 (100.0%) | 0 (0.0%) |
| 25 to 34 Year Olds | 4 (100.0%) | 0 (0.0%) |
| 35 Years and over | 0 (0.0%) | 0 (0.0%) |
| Total | 60 (100.0%) | 0 (0.0%) |
Educational Attainment by Field of Study in Rudy
, and education (18 | 100.0%) are the most common fields of study among 18 individuals in Rudy who have obtained a bachelor's degree or higher.
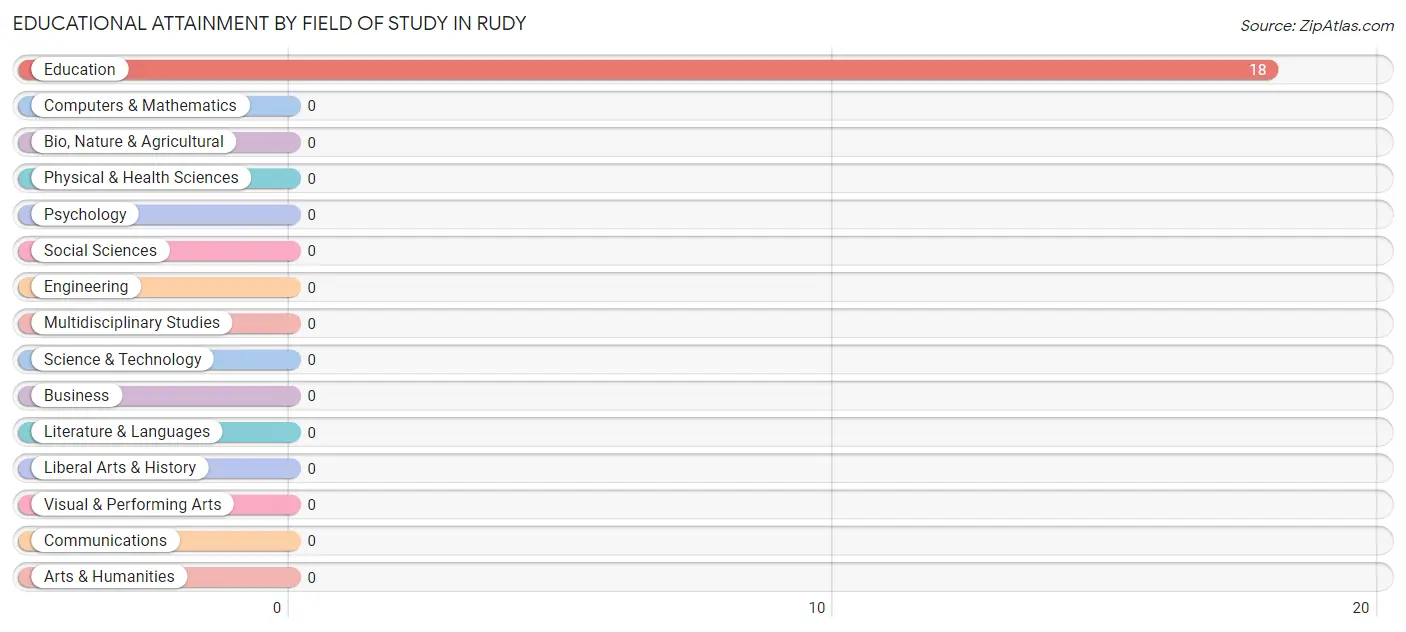
| Field of Study | # Graduates | % Graduates |
| Computers & Mathematics | 0 | 0.0% |
| Bio, Nature & Agricultural | 0 | 0.0% |
| Physical & Health Sciences | 0 | 0.0% |
| Psychology | 0 | 0.0% |
| Social Sciences | 0 | 0.0% |
| Engineering | 0 | 0.0% |
| Multidisciplinary Studies | 0 | 0.0% |
| Science & Technology | 0 | 0.0% |
| Business | 0 | 0.0% |
| Education | 18 | 100.0% |
| Literature & Languages | 0 | 0.0% |
| Liberal Arts & History | 0 | 0.0% |
| Visual & Performing Arts | 0 | 0.0% |
| Communications | 0 | 0.0% |
| Arts & Humanities | 0 | 0.0% |
| Total | 18 | 100.0% |
Transportation & Commute in Rudy
Vehicle Availability by Sex in Rudy
The most prevalent vehicle ownership categories in Rudy are males with 2 vehicles (8, accounting for 44.4%) and females with 2 vehicles (8, making up 80.0%).
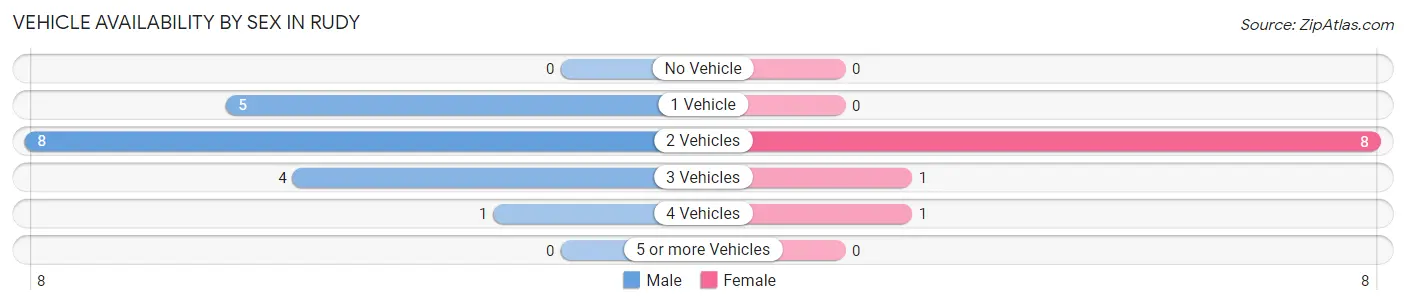
| Vehicles Available | Male | Female |
| No Vehicle | 0 (0.0%) | 0 (0.0%) |
| 1 Vehicle | 5 (27.8%) | 0 (0.0%) |
| 2 Vehicles | 8 (44.4%) | 8 (80.0%) |
| 3 Vehicles | 4 (22.2%) | 1 (10.0%) |
| 4 Vehicles | 1 (5.6%) | 1 (10.0%) |
| 5 or more Vehicles | 0 (0.0%) | 0 (0.0%) |
| Total | 18 (100.0%) | 10 (100.0%) |
Commute Time in Rudy
The most frequently occuring commute durations in Rudy are less than 5 minutes (7 commuters, 25.0%), 5 to 9 minutes (5 commuters, 17.9%), and 15 to 19 minutes (5 commuters, 17.9%).
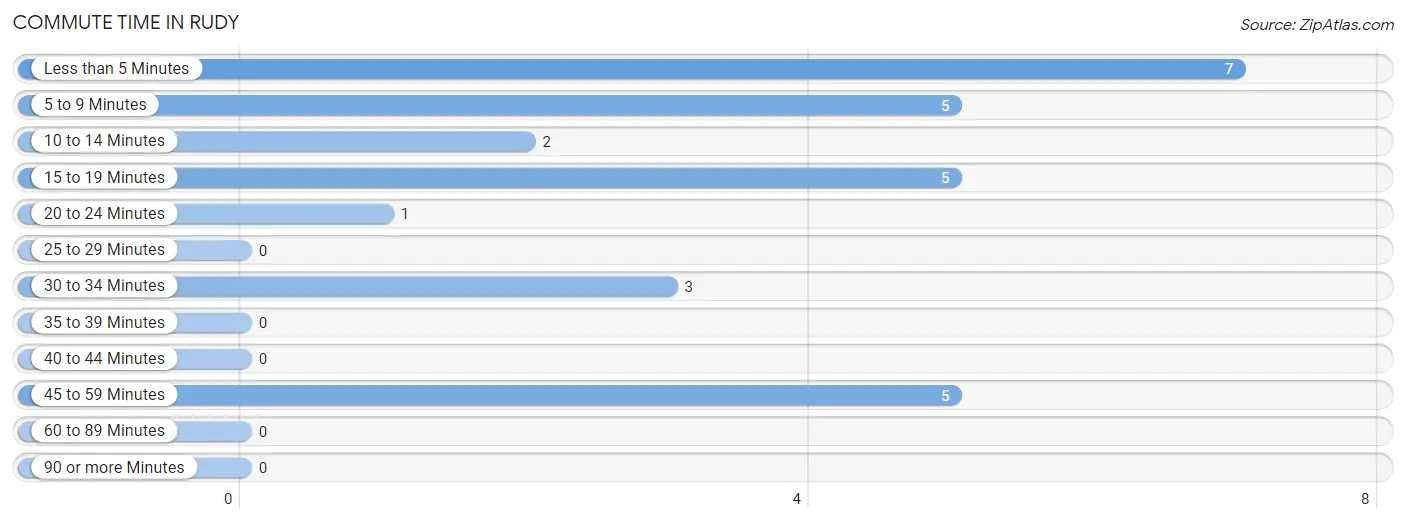
| Commute Time | # Commuters | % Commuters |
| Less than 5 Minutes | 7 | 25.0% |
| 5 to 9 Minutes | 5 | 17.9% |
| 10 to 14 Minutes | 2 | 7.1% |
| 15 to 19 Minutes | 5 | 17.9% |
| 20 to 24 Minutes | 1 | 3.6% |
| 25 to 29 Minutes | 0 | 0.0% |
| 30 to 34 Minutes | 3 | 10.7% |
| 35 to 39 Minutes | 0 | 0.0% |
| 40 to 44 Minutes | 0 | 0.0% |
| 45 to 59 Minutes | 5 | 17.9% |
| 60 to 89 Minutes | 0 | 0.0% |
| 90 or more Minutes | 0 | 0.0% |
Commute Time by Sex in Rudy
The most common commute times in Rudy are 15 to 19 minutes (5 commuters, 27.8%) for males and 5 to 9 minutes (5 commuters, 50.0%) for females.
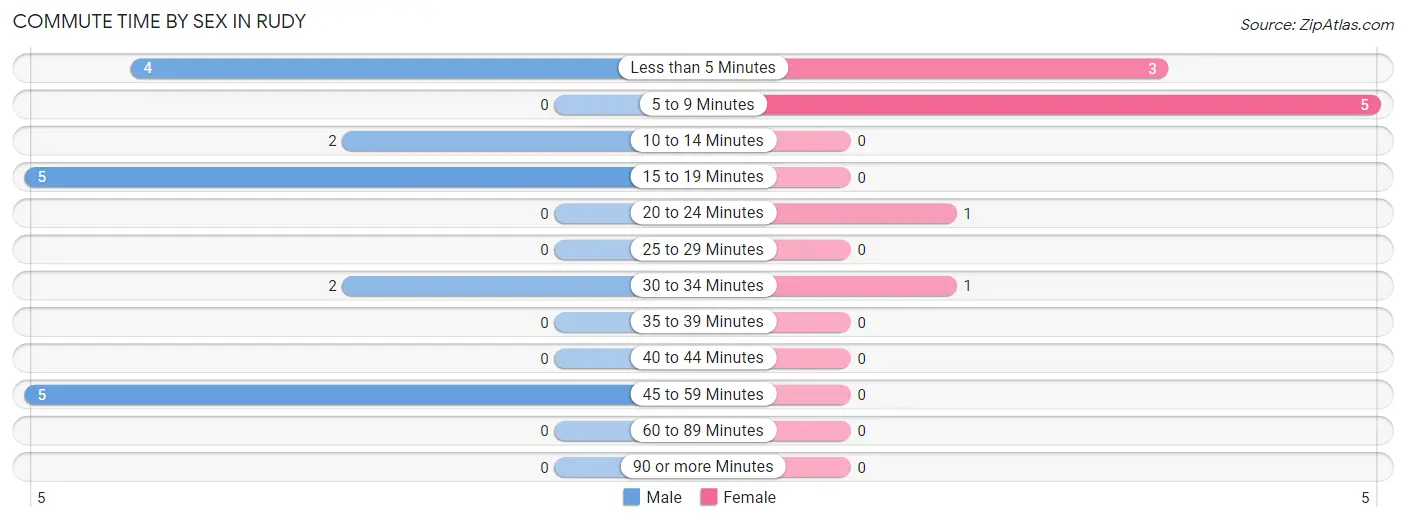
| Commute Time | Male | Female |
| Less than 5 Minutes | 4 (22.2%) | 3 (30.0%) |
| 5 to 9 Minutes | 0 (0.0%) | 5 (50.0%) |
| 10 to 14 Minutes | 2 (11.1%) | 0 (0.0%) |
| 15 to 19 Minutes | 5 (27.8%) | 0 (0.0%) |
| 20 to 24 Minutes | 0 (0.0%) | 1 (10.0%) |
| 25 to 29 Minutes | 0 (0.0%) | 0 (0.0%) |
| 30 to 34 Minutes | 2 (11.1%) | 1 (10.0%) |
| 35 to 39 Minutes | 0 (0.0%) | 0 (0.0%) |
| 40 to 44 Minutes | 0 (0.0%) | 0 (0.0%) |
| 45 to 59 Minutes | 5 (27.8%) | 0 (0.0%) |
| 60 to 89 Minutes | 0 (0.0%) | 0 (0.0%) |
| 90 or more Minutes | 0 (0.0%) | 0 (0.0%) |
Time of Departure to Work by Sex in Rudy
The most frequent times of departure to work in Rudy are 11:00 AM to 11:59 AM (5, 27.8%) for males and 7:30 AM to 7:59 AM (3, 30.0%) for females.
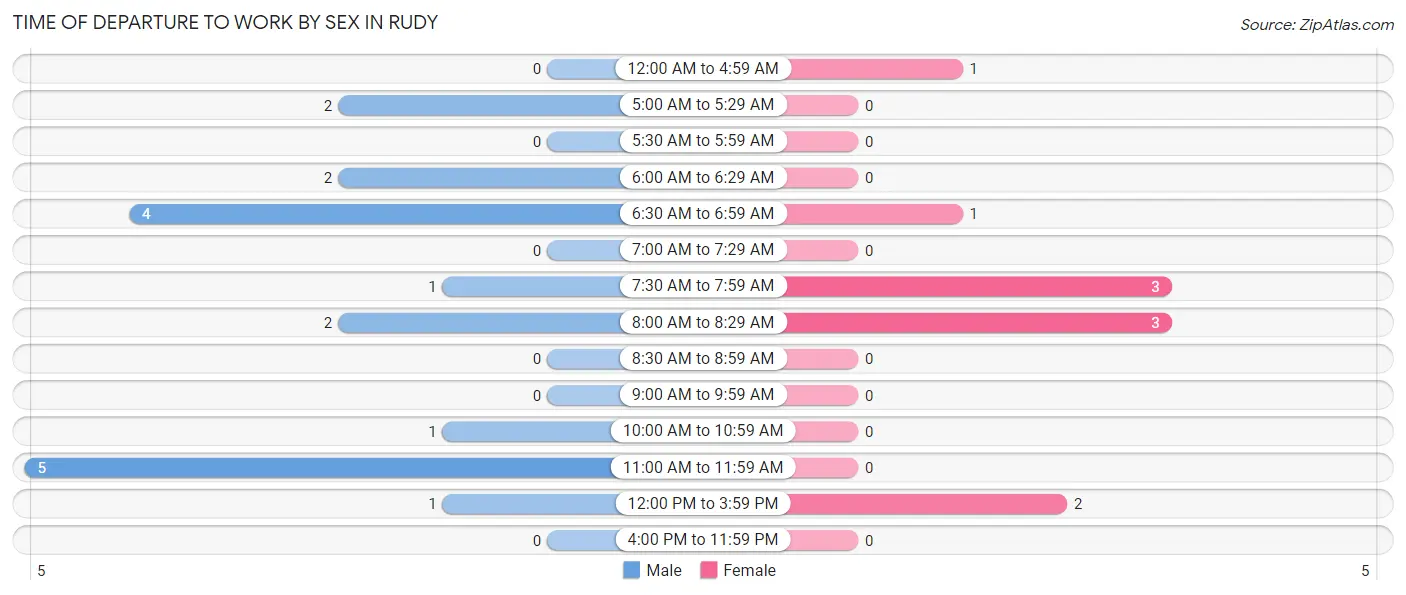
| Time of Departure | Male | Female |
| 12:00 AM to 4:59 AM | 0 (0.0%) | 1 (10.0%) |
| 5:00 AM to 5:29 AM | 2 (11.1%) | 0 (0.0%) |
| 5:30 AM to 5:59 AM | 0 (0.0%) | 0 (0.0%) |
| 6:00 AM to 6:29 AM | 2 (11.1%) | 0 (0.0%) |
| 6:30 AM to 6:59 AM | 4 (22.2%) | 1 (10.0%) |
| 7:00 AM to 7:29 AM | 0 (0.0%) | 0 (0.0%) |
| 7:30 AM to 7:59 AM | 1 (5.6%) | 3 (30.0%) |
| 8:00 AM to 8:29 AM | 2 (11.1%) | 3 (30.0%) |
| 8:30 AM to 8:59 AM | 0 (0.0%) | 0 (0.0%) |
| 9:00 AM to 9:59 AM | 0 (0.0%) | 0 (0.0%) |
| 10:00 AM to 10:59 AM | 1 (5.6%) | 0 (0.0%) |
| 11:00 AM to 11:59 AM | 5 (27.8%) | 0 (0.0%) |
| 12:00 PM to 3:59 PM | 1 (5.6%) | 2 (20.0%) |
| 4:00 PM to 11:59 PM | 0 (0.0%) | 0 (0.0%) |
| Total | 18 (100.0%) | 10 (100.0%) |
Housing Occupancy in Rudy
Occupancy by Ownership in Rudy
Of the total 50 dwellings in Rudy, owner-occupied units account for 32 (64.0%), while renter-occupied units make up 18 (36.0%).
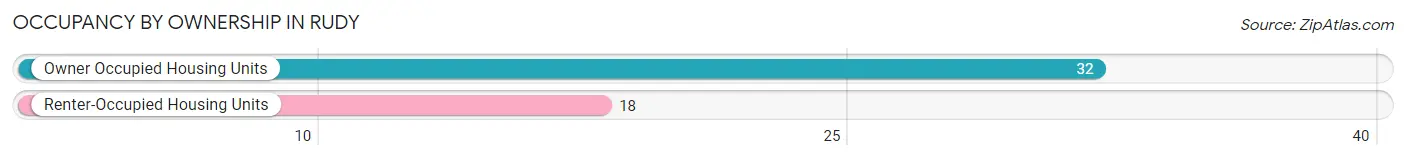
| Occupancy | # Housing Units | % Housing Units |
| Owner Occupied Housing Units | 32 | 64.0% |
| Renter-Occupied Housing Units | 18 | 36.0% |
| Total Occupied Housing Units | 50 | 100.0% |
Occupancy by Household Size in Rudy
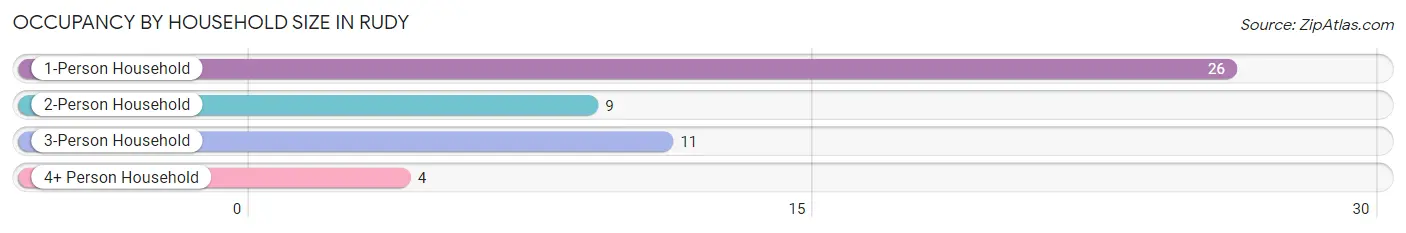
| Household Size | # Housing Units | % Housing Units |
| 1-Person Household | 26 | 52.0% |
| 2-Person Household | 9 | 18.0% |
| 3-Person Household | 11 | 22.0% |
| 4+ Person Household | 4 | 8.0% |
| Total Housing Units | 50 | 100.0% |
Occupancy by Ownership by Household Size in Rudy
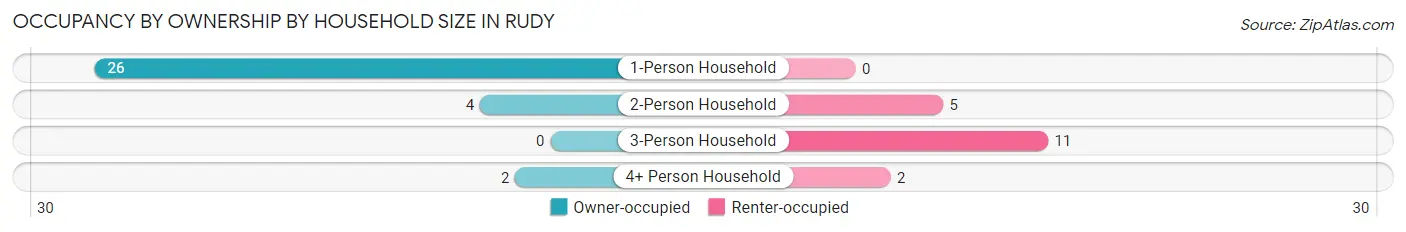
| Household Size | Owner-occupied | Renter-occupied |
| 1-Person Household | 26 (100.0%) | 0 (0.0%) |
| 2-Person Household | 4 (44.4%) | 5 (55.6%) |
| 3-Person Household | 0 (0.0%) | 11 (100.0%) |
| 4+ Person Household | 2 (50.0%) | 2 (50.0%) |
| Total Housing Units | 32 (64.0%) | 18 (36.0%) |
Occupancy by Educational Attainment in Rudy
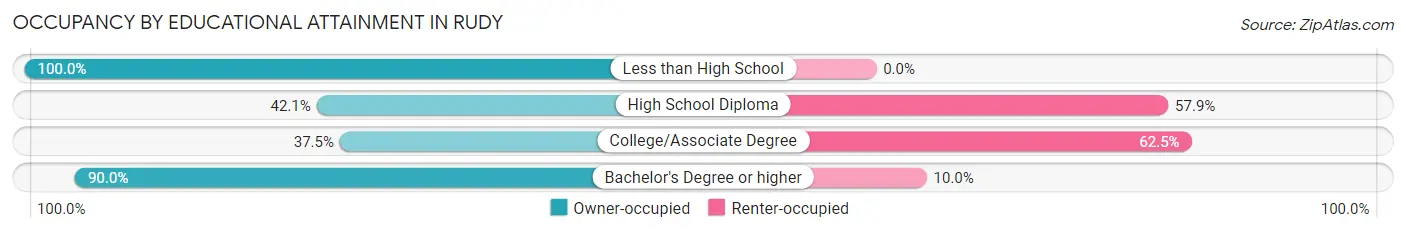
| Household Size | Owner-occupied | Renter-occupied |
| Less than High School | 3 (100.0%) | 0 (0.0%) |
| High School Diploma | 8 (42.1%) | 11 (57.9%) |
| College/Associate Degree | 3 (37.5%) | 5 (62.5%) |
| Bachelor's Degree or higher | 18 (90.0%) | 2 (10.0%) |
Occupancy by Age of Householder in Rudy
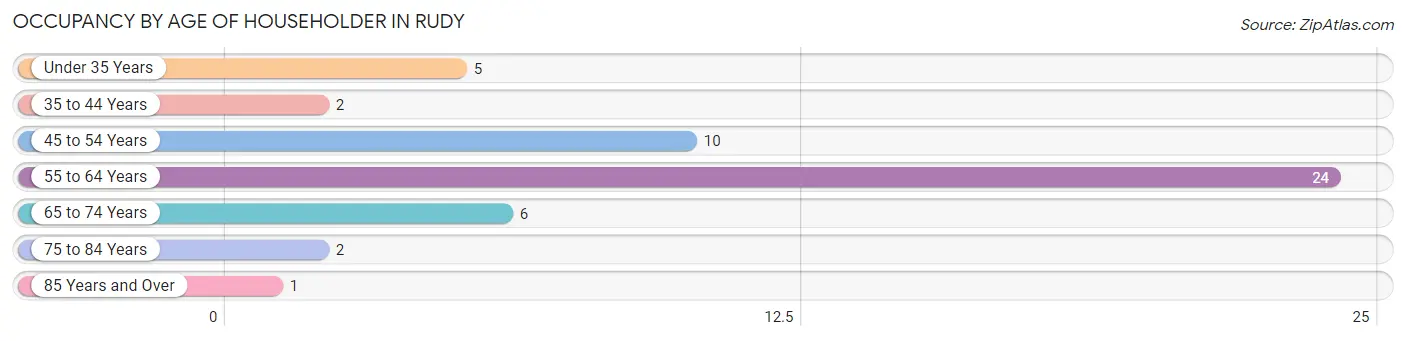
| Age Bracket | # Households | % Households |
| Under 35 Years | 5 | 10.0% |
| 35 to 44 Years | 2 | 4.0% |
| 45 to 54 Years | 10 | 20.0% |
| 55 to 64 Years | 24 | 48.0% |
| 65 to 74 Years | 6 | 12.0% |
| 75 to 84 Years | 2 | 4.0% |
| 85 Years and Over | 1 | 2.0% |
| Total | 50 | 100.0% |
Housing Finances in Rudy
Median Income by Occupancy in Rudy
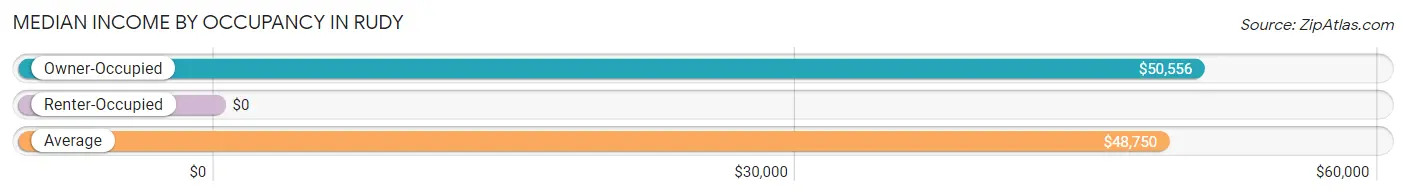
| Occupancy Type | # Households | Median Income |
| Owner-Occupied | 32 (64.0%) | $50,556 |
| Renter-Occupied | 18 (36.0%) | $0 |
| Average | 50 (100.0%) | $48,750 |
Occupancy by Householder Income Bracket in Rudy
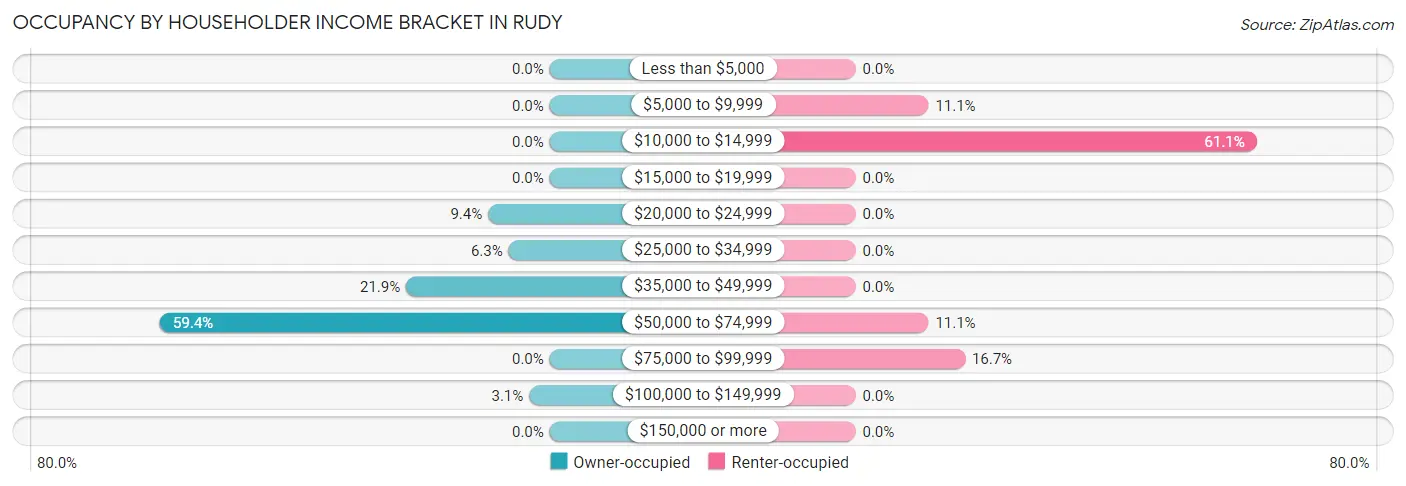
| Income Bracket | Owner-occupied | Renter-occupied |
| Less than $5,000 | 0 (0.0%) | 0 (0.0%) |
| $5,000 to $9,999 | 0 (0.0%) | 2 (11.1%) |
| $10,000 to $14,999 | 0 (0.0%) | 11 (61.1%) |
| $15,000 to $19,999 | 0 (0.0%) | 0 (0.0%) |
| $20,000 to $24,999 | 3 (9.4%) | 0 (0.0%) |
| $25,000 to $34,999 | 2 (6.2%) | 0 (0.0%) |
| $35,000 to $49,999 | 7 (21.9%) | 0 (0.0%) |
| $50,000 to $74,999 | 19 (59.4%) | 2 (11.1%) |
| $75,000 to $99,999 | 0 (0.0%) | 3 (16.7%) |
| $100,000 to $149,999 | 1 (3.1%) | 0 (0.0%) |
| $150,000 or more | 0 (0.0%) | 0 (0.0%) |
| Total | 32 (100.0%) | 18 (100.0%) |
Monthly Housing Cost Tiers in Rudy
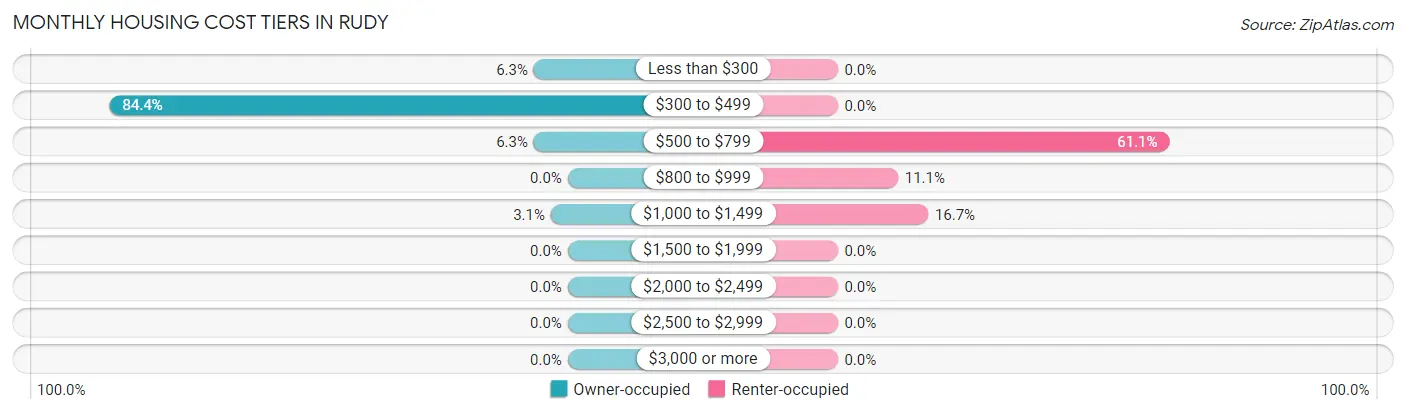
| Monthly Cost | Owner-occupied | Renter-occupied |
| Less than $300 | 2 (6.2%) | 0 (0.0%) |
| $300 to $499 | 27 (84.4%) | 0 (0.0%) |
| $500 to $799 | 2 (6.2%) | 11 (61.1%) |
| $800 to $999 | 0 (0.0%) | 2 (11.1%) |
| $1,000 to $1,499 | 1 (3.1%) | 3 (16.7%) |
| $1,500 to $1,999 | 0 (0.0%) | 0 (0.0%) |
| $2,000 to $2,499 | 0 (0.0%) | 0 (0.0%) |
| $2,500 to $2,999 | 0 (0.0%) | 0 (0.0%) |
| $3,000 or more | 0 (0.0%) | 0 (0.0%) |
| Total | 32 (100.0%) | 18 (100.0%) |
Physical Housing Characteristics in Rudy
Housing Structures in Rudy
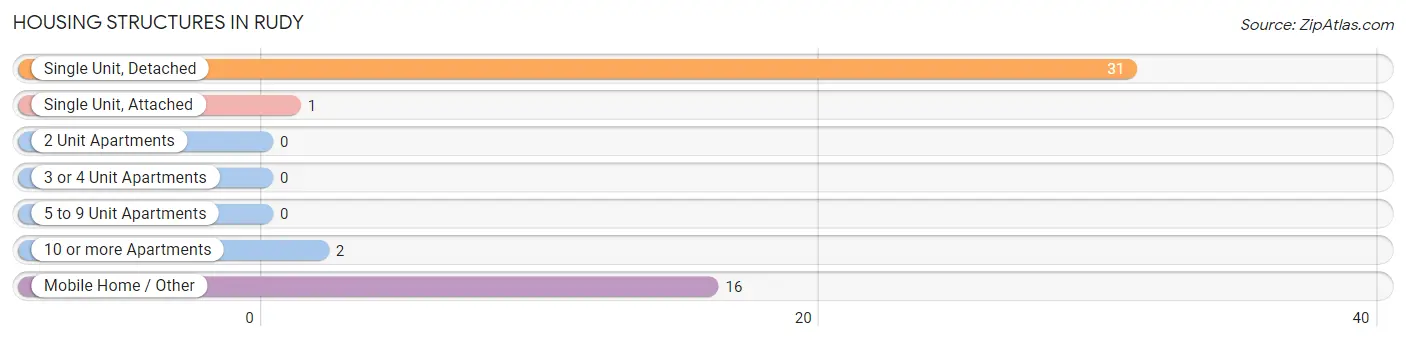
| Structure Type | # Housing Units | % Housing Units |
| Single Unit, Detached | 31 | 62.0% |
| Single Unit, Attached | 1 | 2.0% |
| 2 Unit Apartments | 0 | 0.0% |
| 3 or 4 Unit Apartments | 0 | 0.0% |
| 5 to 9 Unit Apartments | 0 | 0.0% |
| 10 or more Apartments | 2 | 4.0% |
| Mobile Home / Other | 16 | 32.0% |
| Total | 50 | 100.0% |
Housing Structures by Occupancy in Rudy
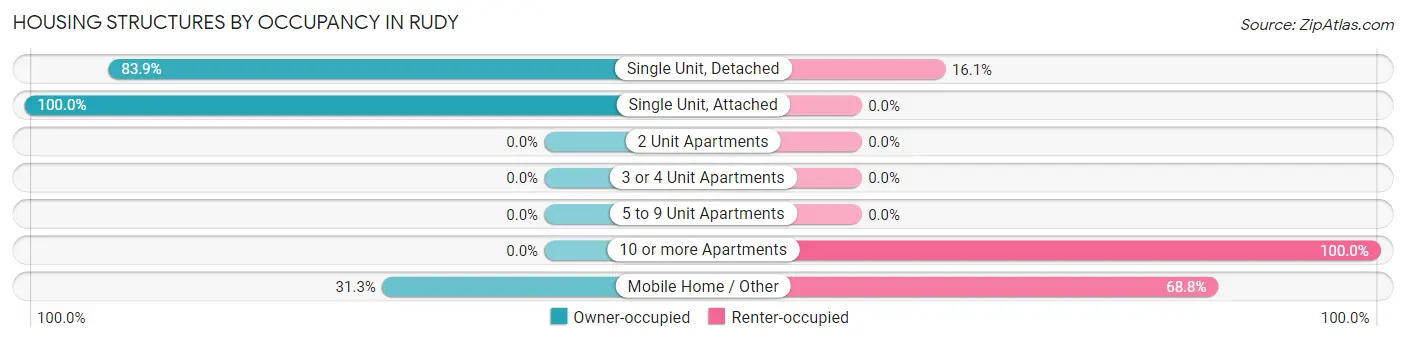
| Structure Type | Owner-occupied | Renter-occupied |
| Single Unit, Detached | 26 (83.9%) | 5 (16.1%) |
| Single Unit, Attached | 1 (100.0%) | 0 (0.0%) |
| 2 Unit Apartments | 0 (0.0%) | 0 (0.0%) |
| 3 or 4 Unit Apartments | 0 (0.0%) | 0 (0.0%) |
| 5 to 9 Unit Apartments | 0 (0.0%) | 0 (0.0%) |
| 10 or more Apartments | 0 (0.0%) | 2 (100.0%) |
| Mobile Home / Other | 5 (31.2%) | 11 (68.8%) |
| Total | 32 (64.0%) | 18 (36.0%) |
Housing Structures by Number of Rooms in Rudy
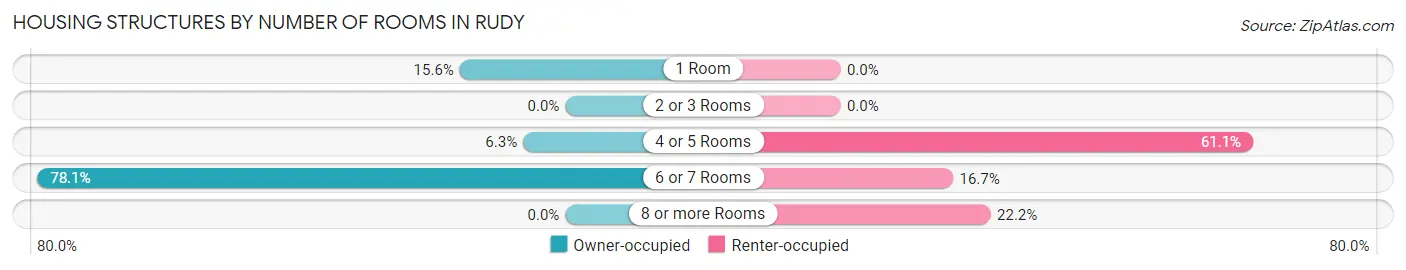
| Number of Rooms | Owner-occupied | Renter-occupied |
| 1 Room | 5 (15.6%) | 0 (0.0%) |
| 2 or 3 Rooms | 0 (0.0%) | 0 (0.0%) |
| 4 or 5 Rooms | 2 (6.2%) | 11 (61.1%) |
| 6 or 7 Rooms | 25 (78.1%) | 3 (16.7%) |
| 8 or more Rooms | 0 (0.0%) | 4 (22.2%) |
| Total | 32 (100.0%) | 18 (100.0%) |
Housing Structure by Heating Type in Rudy
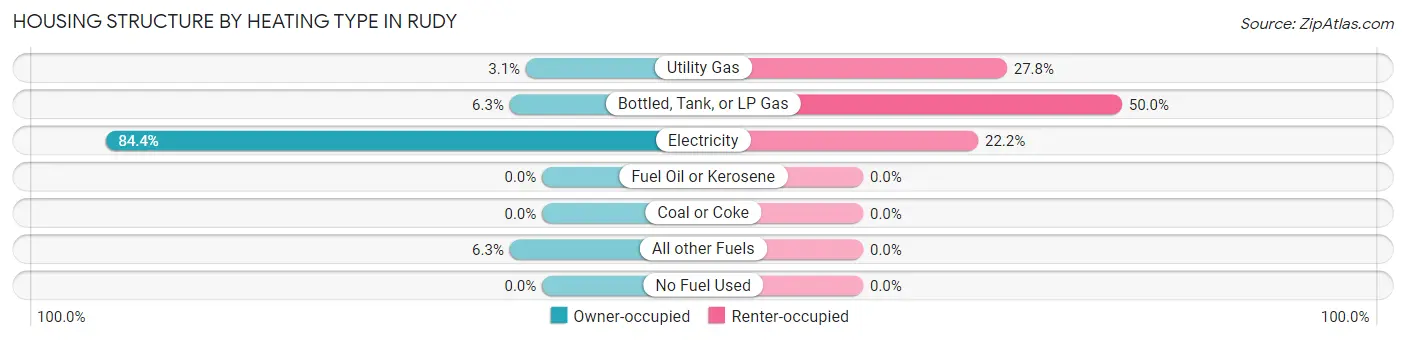
| Heating Type | Owner-occupied | Renter-occupied |
| Utility Gas | 1 (3.1%) | 5 (27.8%) |
| Bottled, Tank, or LP Gas | 2 (6.2%) | 9 (50.0%) |
| Electricity | 27 (84.4%) | 4 (22.2%) |
| Fuel Oil or Kerosene | 0 (0.0%) | 0 (0.0%) |
| Coal or Coke | 0 (0.0%) | 0 (0.0%) |
| All other Fuels | 2 (6.2%) | 0 (0.0%) |
| No Fuel Used | 0 (0.0%) | 0 (0.0%) |
| Total | 32 (100.0%) | 18 (100.0%) |
Household Vehicle Usage in Rudy
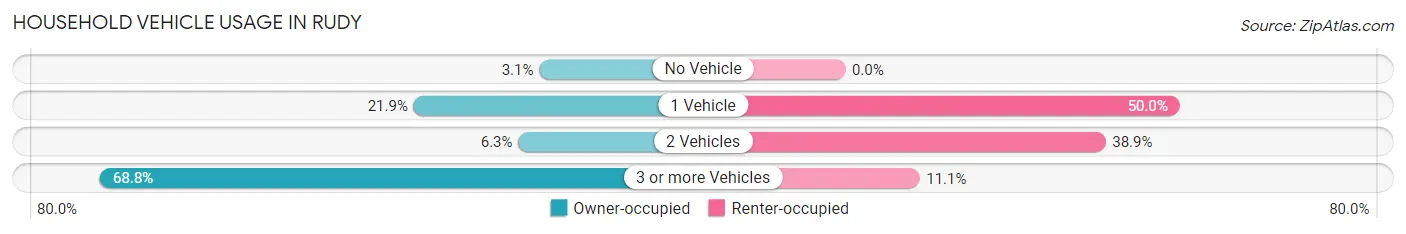
| Vehicles per Household | Owner-occupied | Renter-occupied |
| No Vehicle | 1 (3.1%) | 0 (0.0%) |
| 1 Vehicle | 7 (21.9%) | 9 (50.0%) |
| 2 Vehicles | 2 (6.2%) | 7 (38.9%) |
| 3 or more Vehicles | 22 (68.8%) | 2 (11.1%) |
| Total | 32 (100.0%) | 18 (100.0%) |
Real Estate & Mortgages in Rudy
Real Estate and Mortgage Overview in Rudy
| Characteristic | Without Mortgage | With Mortgage |
| Housing Units | 26 | 6 |
| Median Property Value | - | - |
| Median Household Income | $50,972 | $0 |
| Monthly Housing Costs | $376 | $0 |
| Real Estate Taxes | $1,697 | $0 |
Property Value by Mortgage Status in Rudy
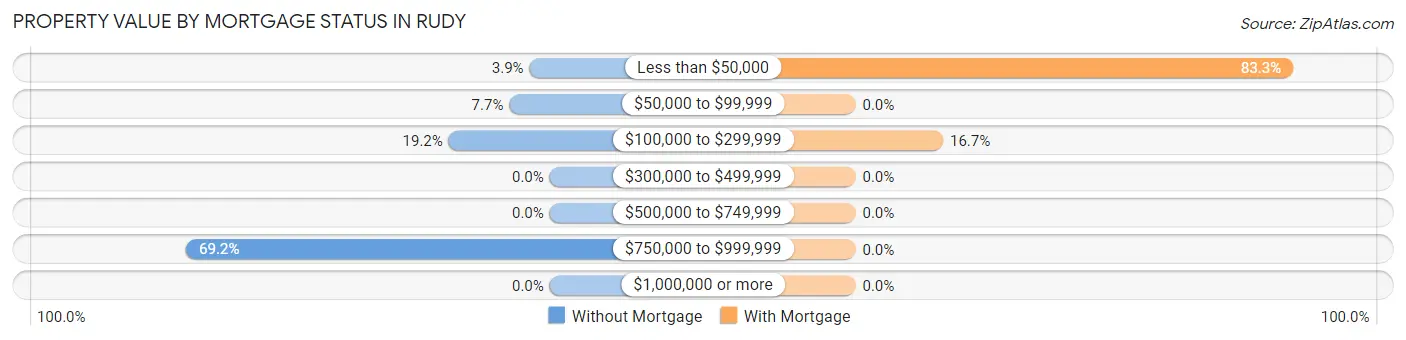
| Property Value | Without Mortgage | With Mortgage |
| Less than $50,000 | 1 (3.8%) | 5 (83.3%) |
| $50,000 to $99,999 | 2 (7.7%) | 0 (0.0%) |
| $100,000 to $299,999 | 5 (19.2%) | 1 (16.7%) |
| $300,000 to $499,999 | 0 (0.0%) | 0 (0.0%) |
| $500,000 to $749,999 | 0 (0.0%) | 0 (0.0%) |
| $750,000 to $999,999 | 18 (69.2%) | 0 (0.0%) |
| $1,000,000 or more | 0 (0.0%) | 0 (0.0%) |
| Total | 26 (100.0%) | 6 (100.0%) |
Household Income by Mortgage Status in Rudy
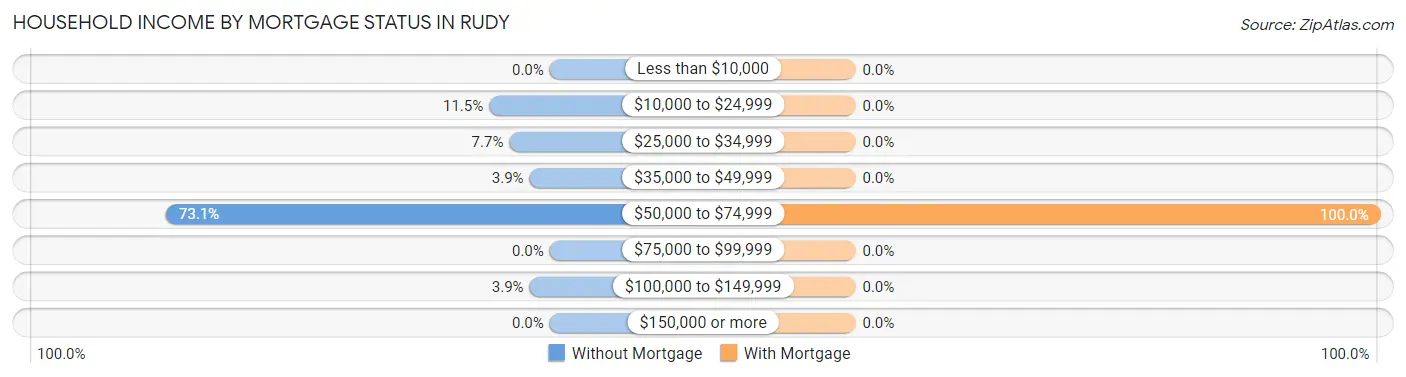
| Household Income | Without Mortgage | With Mortgage |
| Less than $10,000 | 0 (0.0%) | 0 (0.0%) |
| $10,000 to $24,999 | 3 (11.5%) | 0 (0.0%) |
| $25,000 to $34,999 | 2 (7.7%) | 0 (0.0%) |
| $35,000 to $49,999 | 1 (3.8%) | 0 (0.0%) |
| $50,000 to $74,999 | 19 (73.1%) | 6 (100.0%) |
| $75,000 to $99,999 | 0 (0.0%) | 0 (0.0%) |
| $100,000 to $149,999 | 1 (3.8%) | 0 (0.0%) |
| $150,000 or more | 0 (0.0%) | 0 (0.0%) |
| Total | 26 (100.0%) | 6 (100.0%) |
Property Value to Household Income Ratio in Rudy
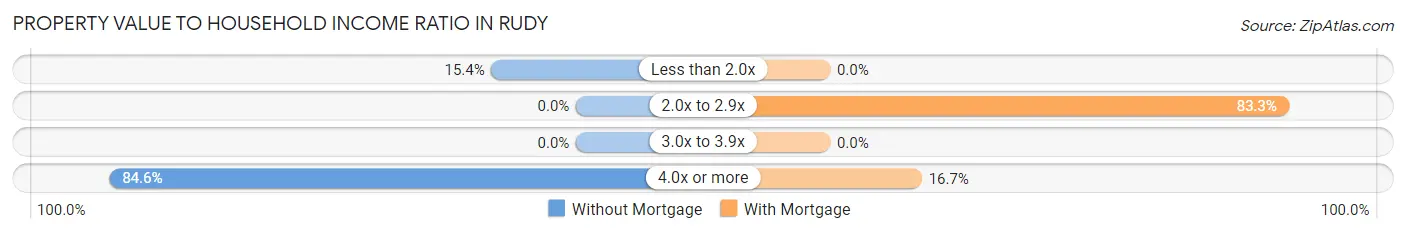
| Value-to-Income Ratio | Without Mortgage | With Mortgage |
| Less than 2.0x | 4 (15.4%) | 0 (0.0%) |
| 2.0x to 2.9x | 0 (0.0%) | 5 (83.3%) |
| 3.0x to 3.9x | 0 (0.0%) | 0 (0.0%) |
| 4.0x or more | 22 (84.6%) | 1 (16.7%) |
| Total | 26 (100.0%) | 6 (100.0%) |
Real Estate Taxes by Mortgage Status in Rudy
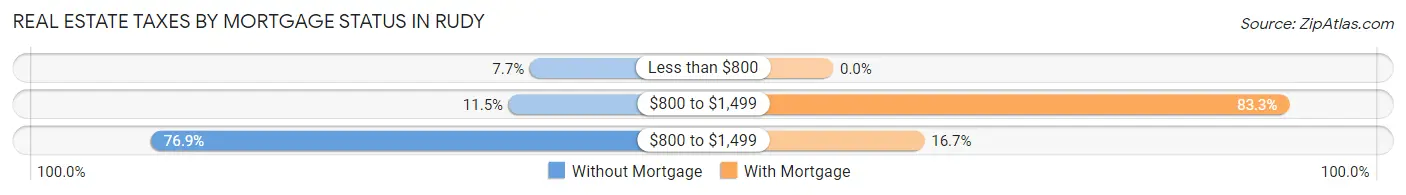
| Property Taxes | Without Mortgage | With Mortgage |
| Less than $800 | 2 (7.7%) | 0 (0.0%) |
| $800 to $1,499 | 3 (11.5%) | 5 (83.3%) |
| $800 to $1,499 | 20 (76.9%) | 1 (16.7%) |
| Total | 26 (100.0%) | 6 (100.0%) |
Health & Disability in Rudy
Health Insurance Coverage by Age in Rudy
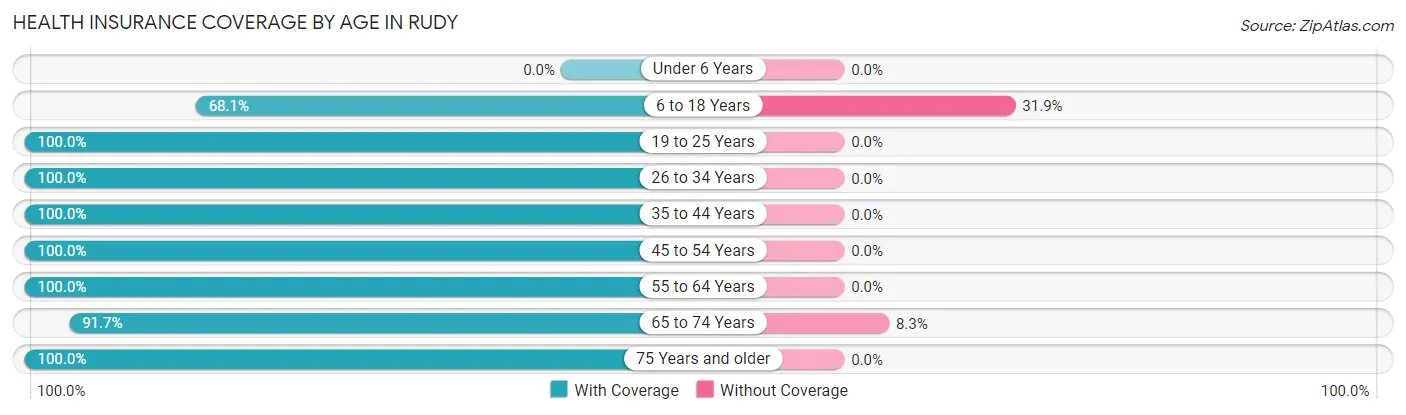
| Age Bracket | With Coverage | Without Coverage |
| Under 6 Years | 0 (0.0%) | 0 (0.0%) |
| 6 to 18 Years | 32 (68.1%) | 15 (31.9%) |
| 19 to 25 Years | 9 (100.0%) | 0 (0.0%) |
| 26 to 34 Years | 4 (100.0%) | 0 (0.0%) |
| 35 to 44 Years | 3 (100.0%) | 0 (0.0%) |
| 45 to 54 Years | 10 (100.0%) | 0 (0.0%) |
| 55 to 64 Years | 28 (100.0%) | 0 (0.0%) |
| 65 to 74 Years | 11 (91.7%) | 1 (8.3%) |
| 75 Years and older | 6 (100.0%) | 0 (0.0%) |
| Total | 103 (86.6%) | 16 (13.5%) |
Health Insurance Coverage by Citizenship Status in Rudy
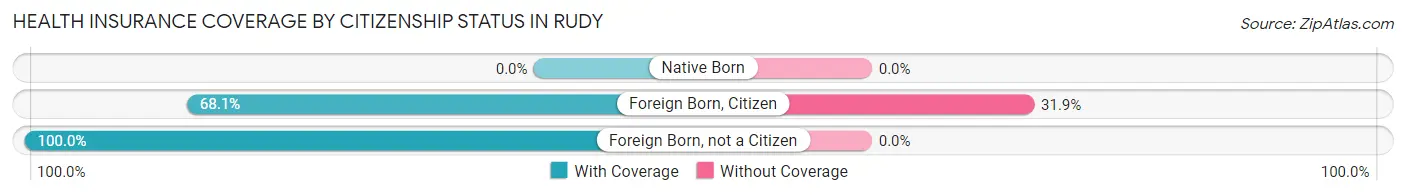
| Citizenship Status | With Coverage | Without Coverage |
| Native Born | 0 (0.0%) | 0 (0.0%) |
| Foreign Born, Citizen | 32 (68.1%) | 15 (31.9%) |
| Foreign Born, not a Citizen | 9 (100.0%) | 0 (0.0%) |
Health Insurance Coverage by Household Income in Rudy
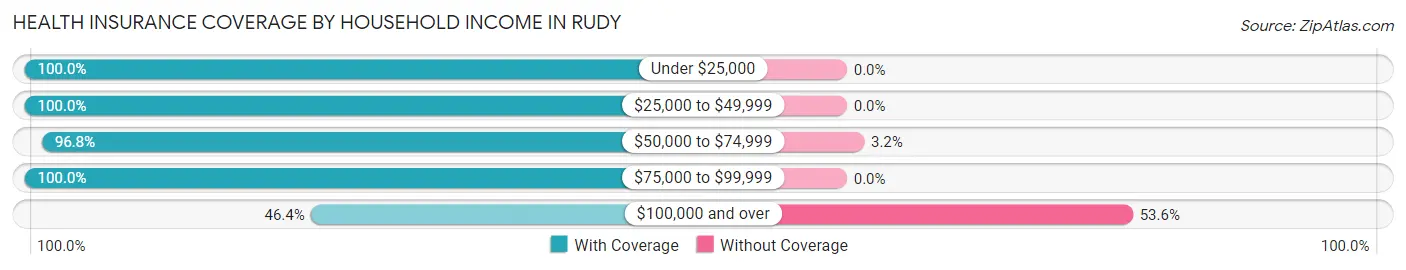
| Household Income | With Coverage | Without Coverage |
| Under $25,000 | 41 (100.0%) | 0 (0.0%) |
| $25,000 to $49,999 | 12 (100.0%) | 0 (0.0%) |
| $50,000 to $74,999 | 30 (96.8%) | 1 (3.2%) |
| $75,000 to $99,999 | 7 (100.0%) | 0 (0.0%) |
| $100,000 and over | 13 (46.4%) | 15 (53.6%) |
Public vs Private Health Insurance Coverage by Age in Rudy
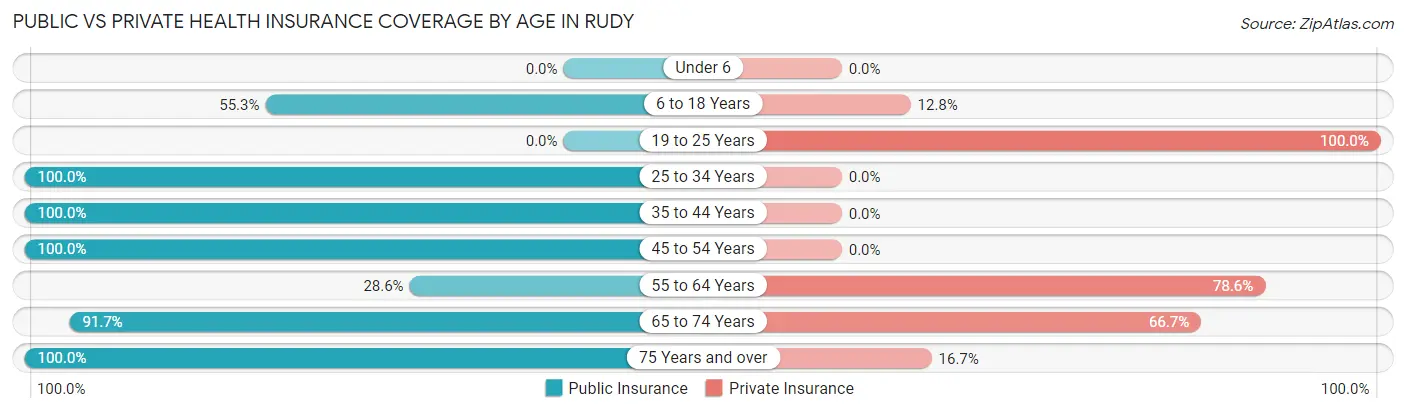
| Age Bracket | Public Insurance | Private Insurance |
| Under 6 | 0 (0.0%) | 0 (0.0%) |
| 6 to 18 Years | 26 (55.3%) | 6 (12.8%) |
| 19 to 25 Years | 0 (0.0%) | 9 (100.0%) |
| 25 to 34 Years | 4 (100.0%) | 0 (0.0%) |
| 35 to 44 Years | 3 (100.0%) | 0 (0.0%) |
| 45 to 54 Years | 10 (100.0%) | 0 (0.0%) |
| 55 to 64 Years | 8 (28.6%) | 22 (78.6%) |
| 65 to 74 Years | 11 (91.7%) | 8 (66.7%) |
| 75 Years and over | 6 (100.0%) | 1 (16.7%) |
| Total | 68 (57.1%) | 46 (38.7%) |
Disability Status by Sex by Age in Rudy
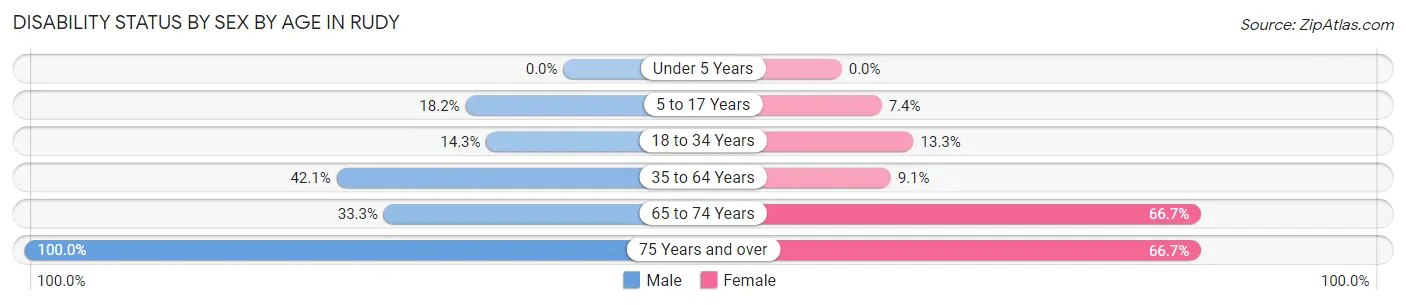
| Age Bracket | Male | Female |
| Under 5 Years | 0 (0.0%) | 0 (0.0%) |
| 5 to 17 Years | 2 (18.2%) | 2 (7.4%) |
| 18 to 34 Years | 1 (14.3%) | 2 (13.3%) |
| 35 to 64 Years | 8 (42.1%) | 2 (9.1%) |
| 65 to 74 Years | 2 (33.3%) | 4 (66.7%) |
| 75 Years and over | 3 (100.0%) | 2 (66.7%) |
Disability Class by Sex by Age in Rudy
Disability Class: Hearing Difficulty
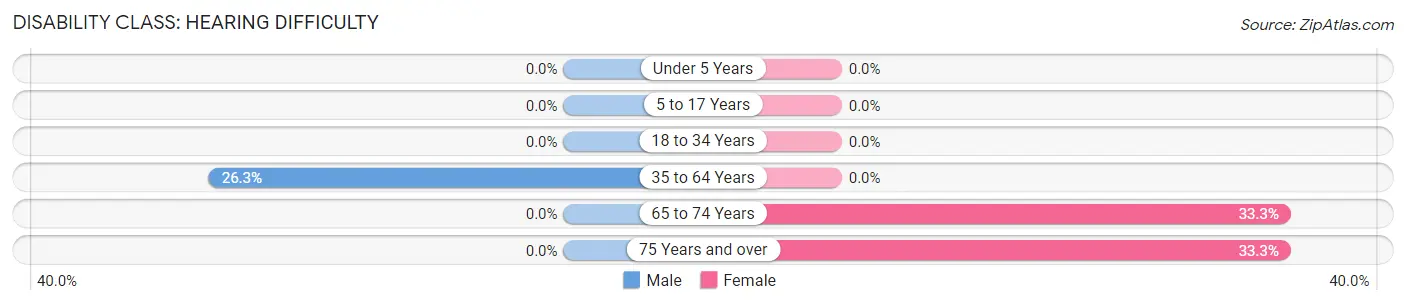
| Age Bracket | Male | Female |
| Under 5 Years | 0 (0.0%) | 0 (0.0%) |
| 5 to 17 Years | 0 (0.0%) | 0 (0.0%) |
| 18 to 34 Years | 0 (0.0%) | 0 (0.0%) |
| 35 to 64 Years | 5 (26.3%) | 0 (0.0%) |
| 65 to 74 Years | 0 (0.0%) | 2 (33.3%) |
| 75 Years and over | 0 (0.0%) | 1 (33.3%) |
Disability Class: Vision Difficulty
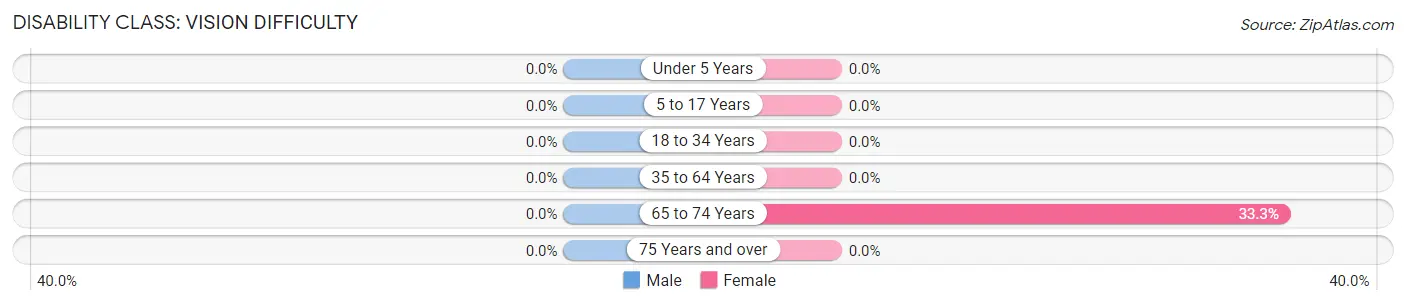
| Age Bracket | Male | Female |
| Under 5 Years | 0 (0.0%) | 0 (0.0%) |
| 5 to 17 Years | 0 (0.0%) | 0 (0.0%) |
| 18 to 34 Years | 0 (0.0%) | 0 (0.0%) |
| 35 to 64 Years | 0 (0.0%) | 0 (0.0%) |
| 65 to 74 Years | 0 (0.0%) | 2 (33.3%) |
| 75 Years and over | 0 (0.0%) | 0 (0.0%) |
Disability Class: Cognitive Difficulty
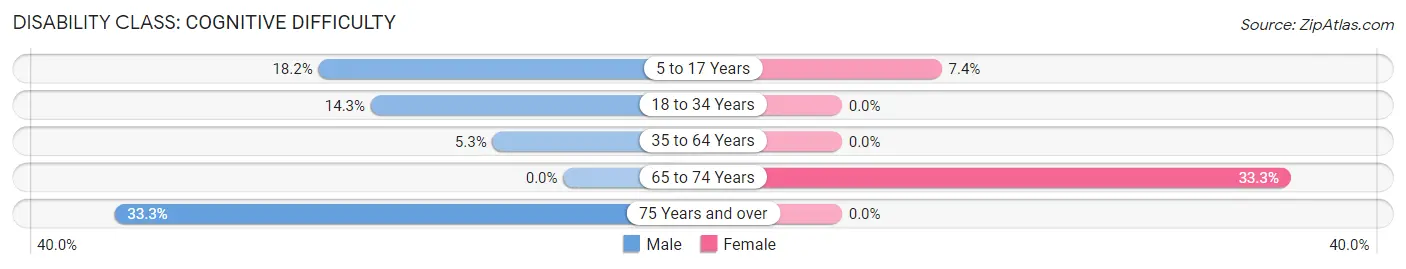
| Age Bracket | Male | Female |
| 5 to 17 Years | 2 (18.2%) | 2 (7.4%) |
| 18 to 34 Years | 1 (14.3%) | 0 (0.0%) |
| 35 to 64 Years | 1 (5.3%) | 0 (0.0%) |
| 65 to 74 Years | 0 (0.0%) | 2 (33.3%) |
| 75 Years and over | 1 (33.3%) | 0 (0.0%) |
Disability Class: Ambulatory Difficulty
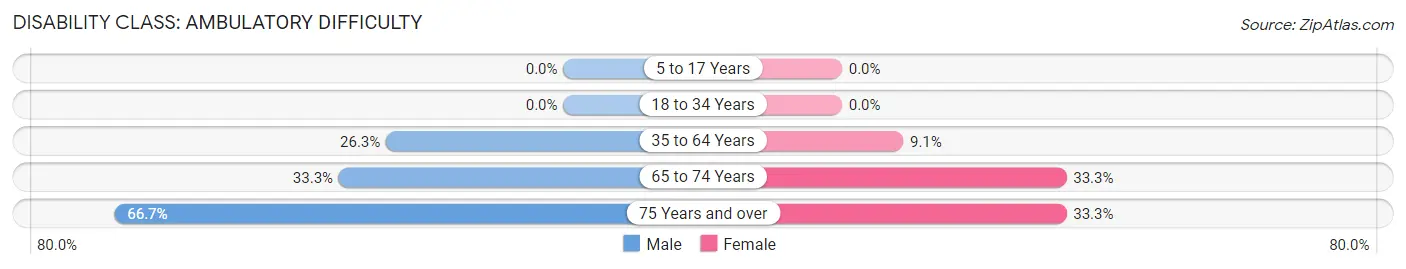
| Age Bracket | Male | Female |
| 5 to 17 Years | 0 (0.0%) | 0 (0.0%) |
| 18 to 34 Years | 0 (0.0%) | 0 (0.0%) |
| 35 to 64 Years | 5 (26.3%) | 2 (9.1%) |
| 65 to 74 Years | 2 (33.3%) | 2 (33.3%) |
| 75 Years and over | 2 (66.7%) | 1 (33.3%) |
Disability Class: Self-Care Difficulty
| Age Bracket | Male | Female |
| 5 to 17 Years | 0 (0.0%) | 0 (0.0%) |
| 18 to 34 Years | 0 (0.0%) | 0 (0.0%) |
| 35 to 64 Years | 0 (0.0%) | 0 (0.0%) |
| 65 to 74 Years | 0 (0.0%) | 0 (0.0%) |
| 75 Years and over | 0 (0.0%) | 0 (0.0%) |
Technology Access in Rudy
Computing Device Access in Rudy
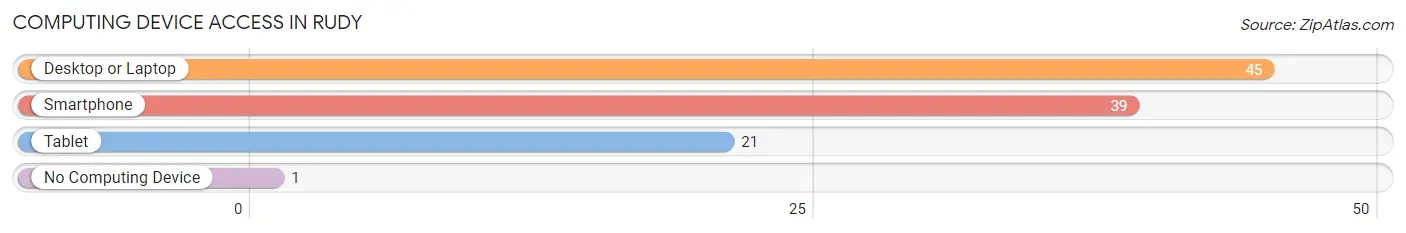
| Device Type | # Households | % Households |
| Desktop or Laptop | 45 | 90.0% |
| Smartphone | 39 | 78.0% |
| Tablet | 21 | 42.0% |
| No Computing Device | 1 | 2.0% |
| Total | 50 | 100.0% |
Internet Access in Rudy
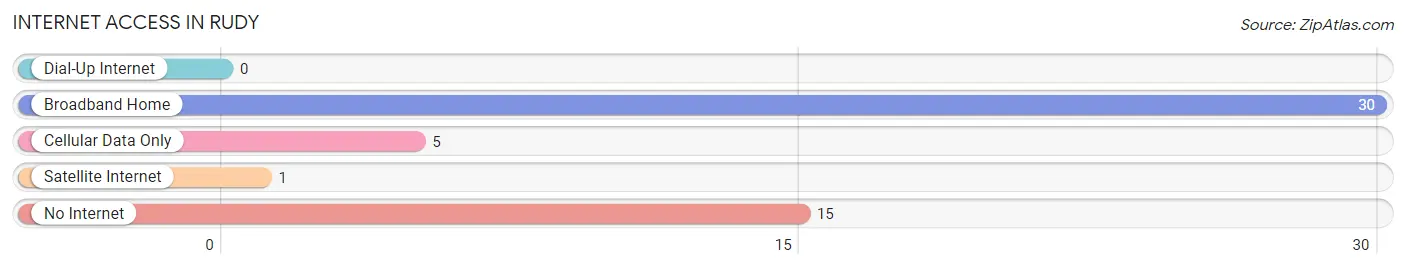
| Internet Type | # Households | % Households |
| Dial-Up Internet | 0 | 0.0% |
| Broadband Home | 30 | 60.0% |
| Cellular Data Only | 5 | 10.0% |
| Satellite Internet | 1 | 2.0% |
| No Internet | 15 | 30.0% |
| Total | 50 | 100.0% |
Rudy Summary
Rudy is a city located in Crawford County, Arkansas, United States. It is situated along the Arkansas River, approximately 8 miles (13 km) east of Van Buren. The population was 1,845 at the 2010 census.
Geography
Rudy is located at 35°27'25" North, 94°17'17" West (35.456944, -94.288333). According to the United States Census Bureau, the city has a total area of 1.2 square miles (3.1 km2), all land.
History
Rudy was founded in 1883 by the St. Louis and San Francisco Railway. The city was named after the railroad's president, Rudolph Kurz. The first post office was established in 1884.
Rudy was incorporated in 1887. The city was a major shipping point for cotton and other agricultural products. The city also had a large lumber industry.
Economy
Rudy's economy is largely based on agriculture and manufacturing. The city is home to several manufacturing plants, including a Tyson Foods poultry processing plant and a Georgia-Pacific lumber mill.
The city also has a strong tourism industry, with several attractions, including the historic downtown area, the Arkansas River, and the nearby Ozark National Forest.
Demographics
As of the census of 2010, there were 1,845 people, 745 households, and 486 families residing in the city. The population density was 1,539.2 people per square mile (595.2/km2). There were 845 housing units at an average density of 708.3 per square mile (273.9/km2). The racial makeup of the city was 95.2% White, 0.7% African American, 0.7% Native American, 0.2% Asian, 0.1% Pacific Islander, 1.2% from other races, and 1.9% from two or more races. Hispanic or Latino of any race were 3.2% of the population.
There were 745 households, out of which 28.2% had children under the age of 18 living with them, 46.2% were married couples living together, 13.7% had a female householder with no husband present, and 35.2% were non-families. 30.2% of all households were made up of individuals, and 14.2% had someone living alone who was 65 years of age or older. The average household size was 2.41 and the average family size was 2.97.
In the city, the population was spread out, with 24.2% under the age of 18, 8.7% from 18 to 24, 25.2% from 25 to 44, 24.2% from 45 to 64, and 17.7% who were 65 years of age or older. The median age was 38 years. For every 100 females, there were 91.2 males. For every 100 females age 18 and over, there were 87.2 males.
The median income for a household in the city was $27,917, and the median income for a family was $35,000. Males had a median income of $27,500 versus $20,000 for females. The per capita income for the city was $14,945. About 13.2% of families and 16.2% of the population were below the poverty line, including 22.2% of those under age 18 and 14.2% of those age 65 or over.
Common Questions
What is Per Capita Income in Rudy?
Per Capita income in Rudy is $17,308.
What is the Median Household income in Rudy?
Median Household Income in Rudy is $48,750.
What is Inequality or Gini Index in Rudy?
Inequality or Gini Index in Rudy is 0.32.
What is the Total Population of Rudy?
Total Population of Rudy is 119.
What is the Total Male Population of Rudy?
Total Male Population of Rudy is 46.
What is the Total Female Population of Rudy?
Total Female Population of Rudy is 73.
What is the Ratio of Males per 100 Females in Rudy?
There are 63.01 Males per 100 Females in Rudy.
What is the Ratio of Females per 100 Males in Rudy?
There are 158.70 Females per 100 Males in Rudy.
What is the Median Population Age in Rudy?
Median Population Age in Rudy is 32.8 Years.
What is the Average Family Size in Rudy
Average Family Size in Rudy is 3.6 People.
What is the Average Household Size in Rudy
Average Household Size in Rudy is 2.4 People.
How Large is the Labor Force in Rudy?
There are 28 People in the Labor Forcein in Rudy.
What is the Percentage of People in the Labor Force in Rudy?
31.1% of People are in the Labor Force in Rudy.