Valley City, OH Map & Demographics
Valley City Map
Valley City Overview
$49,093
PER CAPITA INCOME
$134,643
AVG FAMILY INCOME
$117,000
AVG HOUSEHOLD INCOME
29.6%
WAGE / INCOME GAP [ % ]
70.4¢/ $1
WAGE / INCOME GAP [ $ ]
0.26
INEQUALITY / GINI INDEX
677
TOTAL POPULATION
284
MALE POPULATION
393
FEMALE POPULATION
72.26
MALES / 100 FEMALES
138.38
FEMALES / 100 MALES
55.9
MEDIAN AGE
2.8
AVG FAMILY SIZE
2.3
AVG HOUSEHOLD SIZE
339
LABOR FORCE [ PEOPLE ]
59.9%
PERCENT IN LABOR FORCE
Valley City Zip Codes
Income in Valley City
Income Overview in Valley City
Per Capita Income in Valley City is $49,093, while median incomes of families and households are $134,643 and $117,000 respectively.
| Characteristic | Number | Measure |
| Per Capita Income | 677 | $49,093 |
| Median Family Income | 216 | $134,643 |
| Mean Family Income | 216 | $123,506 |
| Median Household Income | 300 | $117,000 |
| Mean Household Income | 300 | $111,373 |
| Income Deficit | 216 | $0 |
| Wage / Income Gap (%) | 677 | 29.62% |
| Wage / Income Gap ($) | 677 | 70.38¢ per $1 |
| Gini / Inequality Index | 677 | 0.26 |
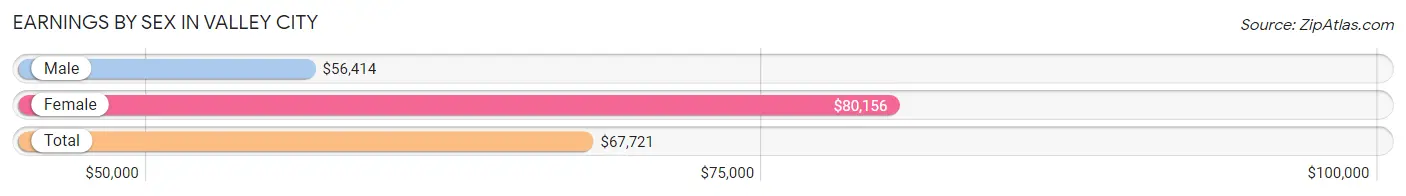
Earnings by Sex in Valley City
Average Earnings in Valley City are $67,721, $56,414 for men and $80,156 for women, a difference of 29.6%.
| Sex | Number | Average Earnings |
| Male | 163 (48.1%) | $56,414 |
| Female | 176 (51.9%) | $80,156 |
| Total | 339 (100.0%) | $67,721 |
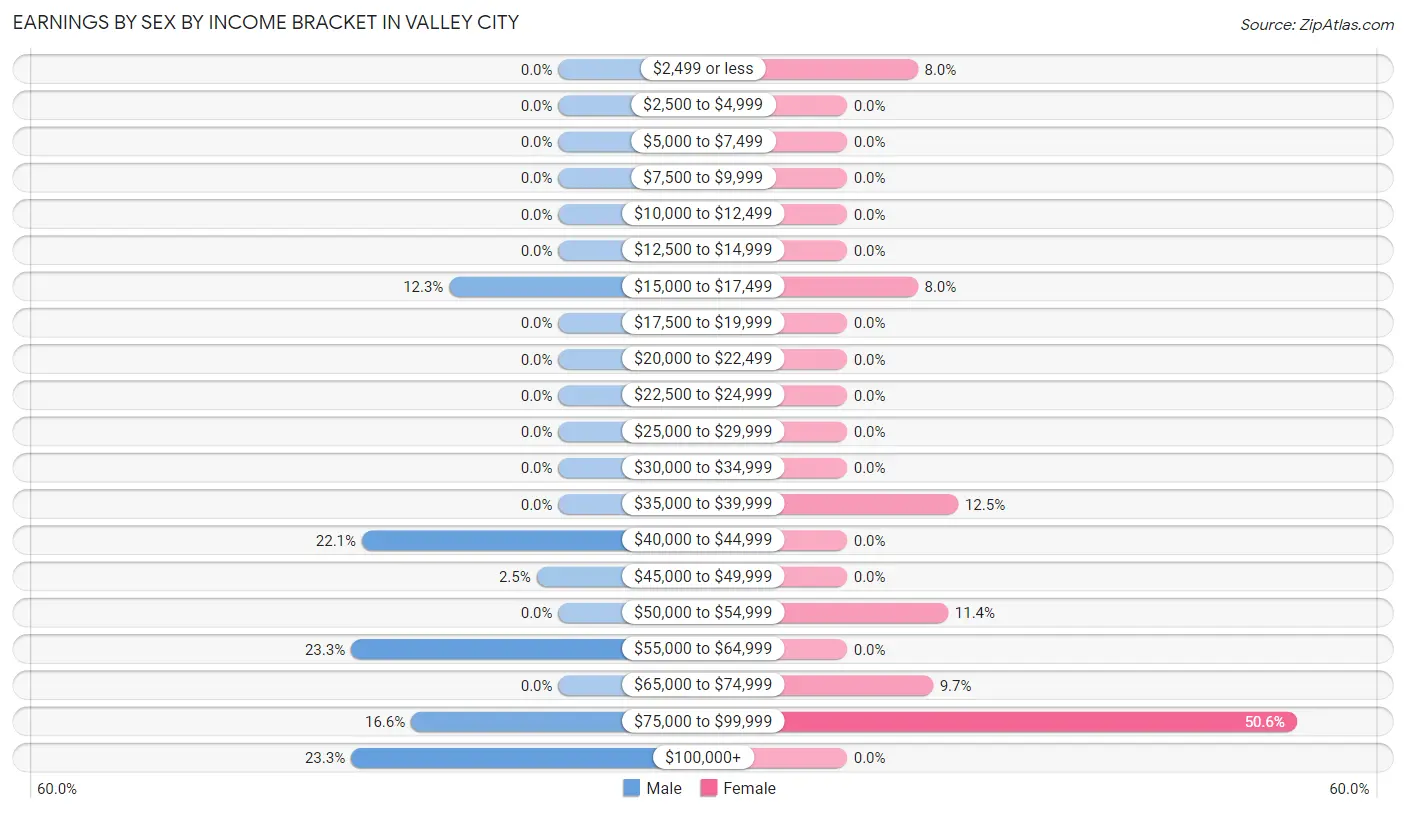
Earnings by Sex by Income Bracket in Valley City
The most common earnings brackets in Valley City are $55,000 to $64,999 for men (38 | 23.3%) and $75,000 to $99,999 for women (89 | 50.6%).
| Income | Male | Female |
| $2,499 or less | 0 (0.0%) | 14 (8.0%) |
| $2,500 to $4,999 | 0 (0.0%) | 0 (0.0%) |
| $5,000 to $7,499 | 0 (0.0%) | 0 (0.0%) |
| $7,500 to $9,999 | 0 (0.0%) | 0 (0.0%) |
| $10,000 to $12,499 | 0 (0.0%) | 0 (0.0%) |
| $12,500 to $14,999 | 0 (0.0%) | 0 (0.0%) |
| $15,000 to $17,499 | 20 (12.3%) | 14 (8.0%) |
| $17,500 to $19,999 | 0 (0.0%) | 0 (0.0%) |
| $20,000 to $22,499 | 0 (0.0%) | 0 (0.0%) |
| $22,500 to $24,999 | 0 (0.0%) | 0 (0.0%) |
| $25,000 to $29,999 | 0 (0.0%) | 0 (0.0%) |
| $30,000 to $34,999 | 0 (0.0%) | 0 (0.0%) |
| $35,000 to $39,999 | 0 (0.0%) | 22 (12.5%) |
| $40,000 to $44,999 | 36 (22.1%) | 0 (0.0%) |
| $45,000 to $49,999 | 4 (2.5%) | 0 (0.0%) |
| $50,000 to $54,999 | 0 (0.0%) | 20 (11.4%) |
| $55,000 to $64,999 | 38 (23.3%) | 0 (0.0%) |
| $65,000 to $74,999 | 0 (0.0%) | 17 (9.7%) |
| $75,000 to $99,999 | 27 (16.6%) | 89 (50.6%) |
| $100,000+ | 38 (23.3%) | 0 (0.0%) |
| Total | 163 (100.0%) | 176 (100.0%) |
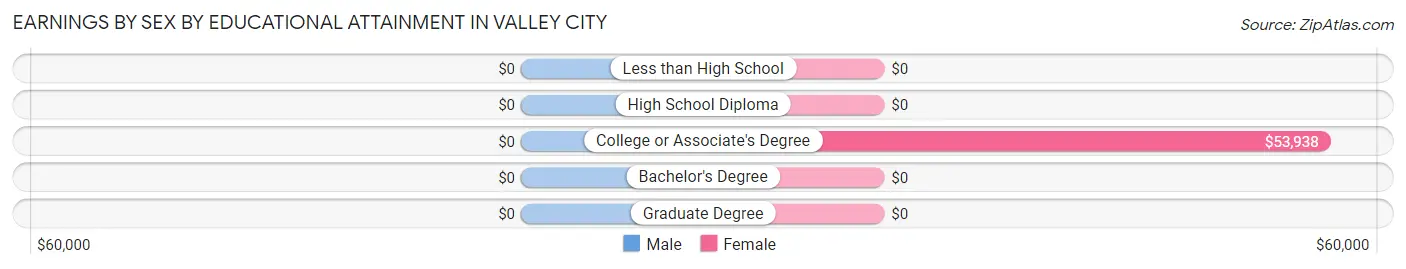
Earnings by Sex by Educational Attainment in Valley City
| Educational Attainment | Male Income | Female Income |
| Less than High School | - | - |
| High School Diploma | - | - |
| College or Associate's Degree | - | - |
| Bachelor's Degree | - | - |
| Graduate Degree | - | - |
| Total | $56,414 | $80,156 |
Family Income in Valley City
Family Income Brackets in Valley City
According to the Valley City family income data, there are 95 families falling into the $100,000 to $149,999 income range, which is the most common income bracket and makes up 44.0% of all families.
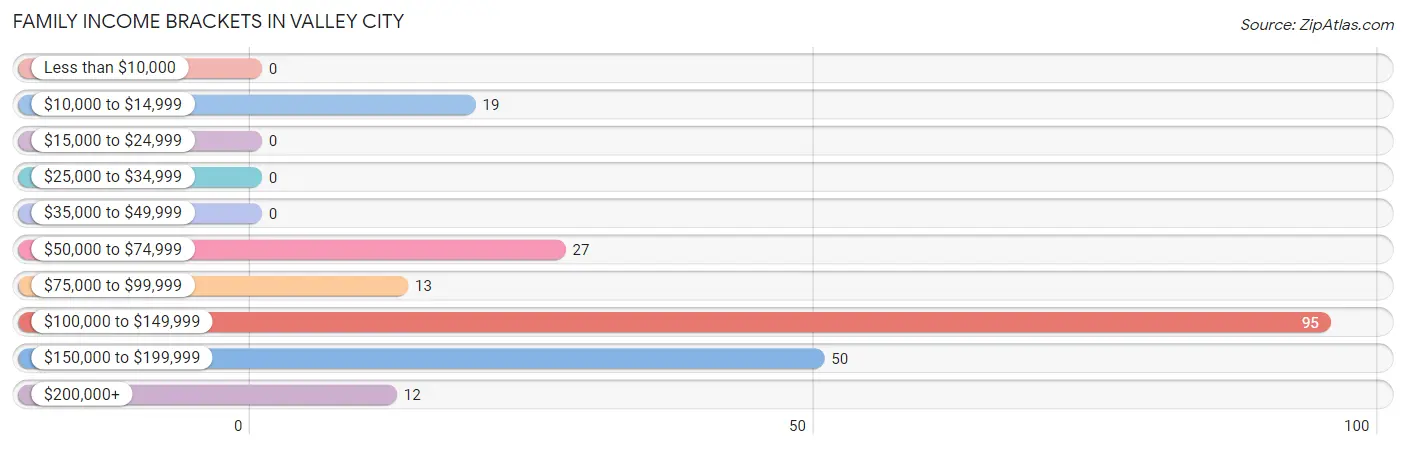
| Income Bracket | # Families | % Families |
| Less than $10,000 | 0 | 0.0% |
| $10,000 to $14,999 | 19 | 8.8% |
| $15,000 to $24,999 | 0 | 0.0% |
| $25,000 to $34,999 | 0 | 0.0% |
| $35,000 to $49,999 | 0 | 0.0% |
| $50,000 to $74,999 | 27 | 12.5% |
| $75,000 to $99,999 | 13 | 6.0% |
| $100,000 to $149,999 | 95 | 44.0% |
| $150,000 to $199,999 | 50 | 23.1% |
| $200,000+ | 12 | 5.6% |
Family Income by Famaliy Size in Valley City
2-person families (106 | 49.1%) account for the highest median family income in Valley City with $158,162 per family, while 2-person families (106 | 49.1%) have the highest median income of $79,081 per family member.
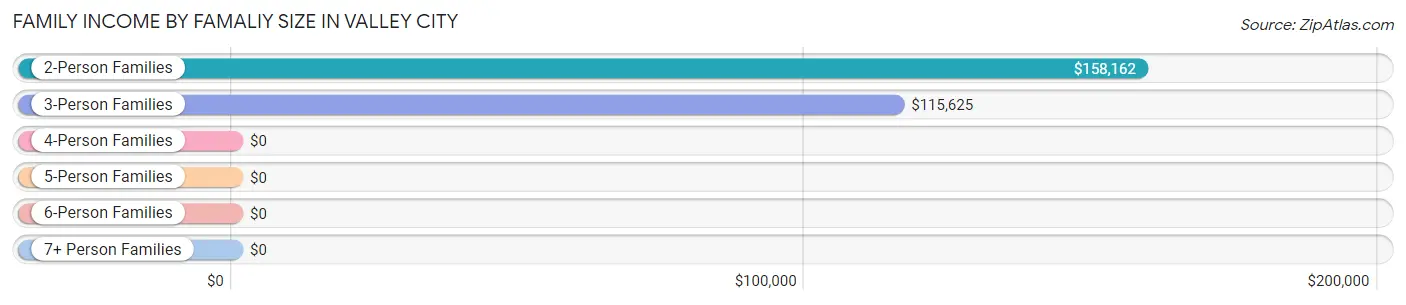
| Income Bracket | # Families | Median Income |
| 2-Person Families | 106 (49.1%) | $158,162 |
| 3-Person Families | 66 (30.6%) | $115,625 |
| 4-Person Families | 44 (20.4%) | $0 |
| 5-Person Families | 0 (0.0%) | $0 |
| 6-Person Families | 0 (0.0%) | $0 |
| 7+ Person Families | 0 (0.0%) | $0 |
| Total | 216 (100.0%) | $134,643 |
Family Income by Number of Earners in Valley City
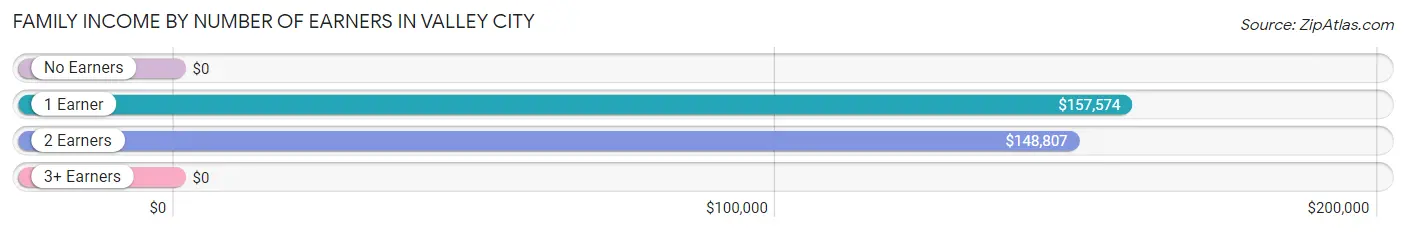
| Number of Earners | # Families | Median Income |
| No Earners | 56 (25.9%) | $0 |
| 1 Earner | 66 (30.6%) | $157,574 |
| 2 Earners | 74 (34.3%) | $148,807 |
| 3+ Earners | 20 (9.3%) | $0 |
| Total | 216 (100.0%) | $134,643 |
Household Income in Valley City
Household Income Brackets in Valley City
With 117 households falling in the category, the $100,000 to $149,999 income range is the most frequent in Valley City, accounting for 39.0% of all households.
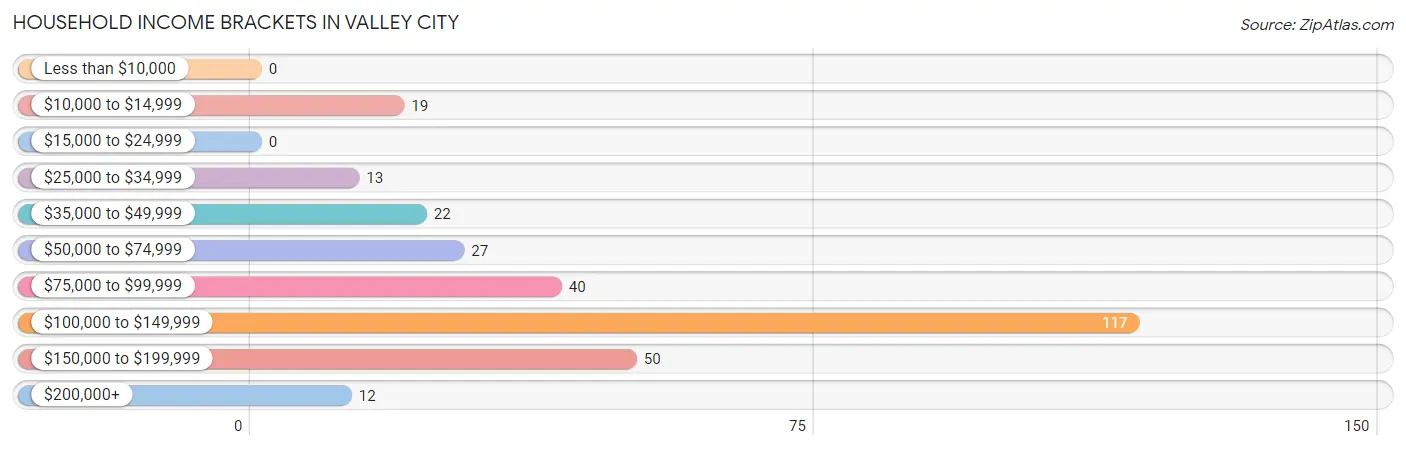
| Income Bracket | # Households | % Households |
| Less than $10,000 | 0 | 0.0% |
| $10,000 to $14,999 | 19 | 6.3% |
| $15,000 to $24,999 | 0 | 0.0% |
| $25,000 to $34,999 | 13 | 4.3% |
| $35,000 to $49,999 | 22 | 7.3% |
| $50,000 to $74,999 | 27 | 9.0% |
| $75,000 to $99,999 | 40 | 13.3% |
| $100,000 to $149,999 | 117 | 39.0% |
| $150,000 to $199,999 | 50 | 16.7% |
| $200,000+ | 12 | 4.0% |
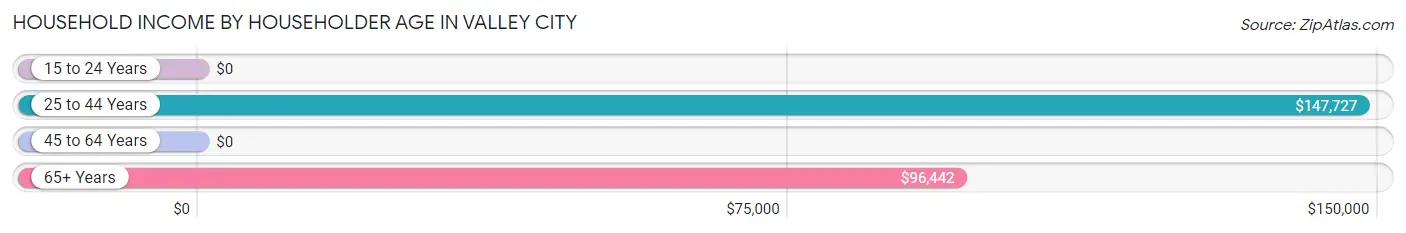
Household Income by Householder Age in Valley City
The median household income in Valley City is $117,000, with the highest median household income of $147,727 found in the 25 to 44 years age bracket for the primary householder. A total of 80 households (26.7%) fall into this category.
| Income Bracket | # Households | Median Income |
| 15 to 24 Years | 0 (0.0%) | $0 |
| 25 to 44 Years | 80 (26.7%) | $147,727 |
| 45 to 64 Years | 87 (29.0%) | $0 |
| 65+ Years | 133 (44.3%) | $96,442 |
| Total | 300 (100.0%) | $117,000 |
Poverty in Valley City
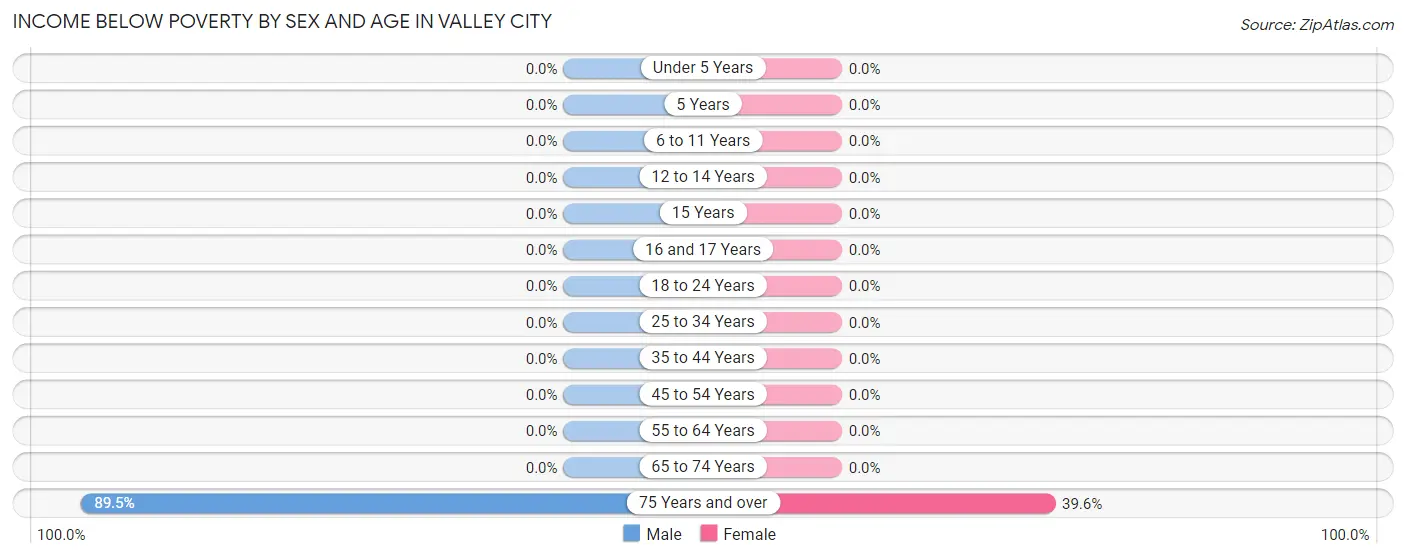
Income Below Poverty by Sex and Age in Valley City
With 6.0% poverty level for males and 4.8% for females among the residents of Valley City, 75 year old and over males and 75 year old and over females are the most vulnerable to poverty, with 17 males (89.5%) and 19 females (39.6%) in their respective age groups living below the poverty level.
| Age Bracket | Male | Female |
| Under 5 Years | 0 (0.0%) | 0 (0.0%) |
| 5 Years | 0 (0.0%) | 0 (0.0%) |
| 6 to 11 Years | 0 (0.0%) | 0 (0.0%) |
| 12 to 14 Years | 0 (0.0%) | 0 (0.0%) |
| 15 Years | 0 (0.0%) | 0 (0.0%) |
| 16 and 17 Years | 0 (0.0%) | 0 (0.0%) |
| 18 to 24 Years | 0 (0.0%) | 0 (0.0%) |
| 25 to 34 Years | 0 (0.0%) | 0 (0.0%) |
| 35 to 44 Years | 0 (0.0%) | 0 (0.0%) |
| 45 to 54 Years | 0 (0.0%) | 0 (0.0%) |
| 55 to 64 Years | 0 (0.0%) | 0 (0.0%) |
| 65 to 74 Years | 0 (0.0%) | 0 (0.0%) |
| 75 Years and over | 17 (89.5%) | 19 (39.6%) |
| Total | 17 (6.0%) | 19 (4.8%) |
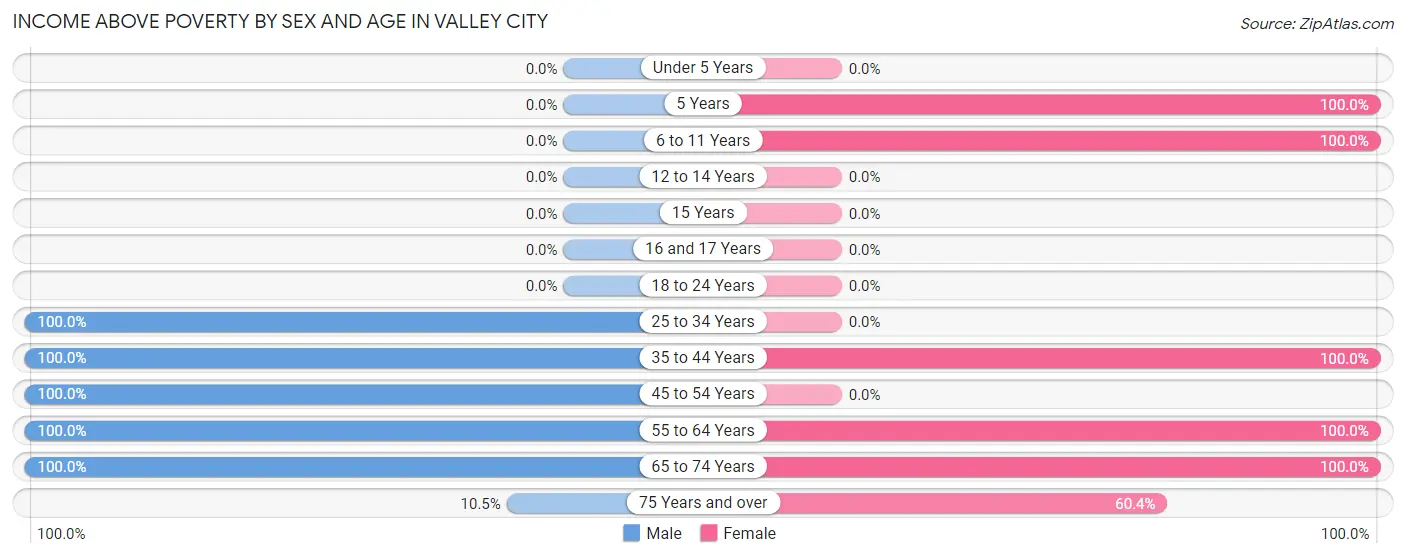
Income Above Poverty by Sex and Age in Valley City
According to the poverty statistics in Valley City, males aged 25 to 34 years and females aged 5 years are the age groups that are most secure financially, with 100.0% of males and 100.0% of females in these age groups living above the poverty line.
| Age Bracket | Male | Female |
| Under 5 Years | 0 (0.0%) | 0 (0.0%) |
| 5 Years | 0 (0.0%) | 43 (100.0%) |
| 6 to 11 Years | 0 (0.0%) | 68 (100.0%) |
| 12 to 14 Years | 0 (0.0%) | 0 (0.0%) |
| 15 Years | 0 (0.0%) | 0 (0.0%) |
| 16 and 17 Years | 0 (0.0%) | 0 (0.0%) |
| 18 to 24 Years | 0 (0.0%) | 0 (0.0%) |
| 25 to 34 Years | 42 (100.0%) | 0 (0.0%) |
| 35 to 44 Years | 38 (100.0%) | 89 (100.0%) |
| 45 to 54 Years | 20 (100.0%) | 0 (0.0%) |
| 55 to 64 Years | 65 (100.0%) | 87 (100.0%) |
| 65 to 74 Years | 100 (100.0%) | 58 (100.0%) |
| 75 Years and over | 2 (10.5%) | 29 (60.4%) |
| Total | 267 (94.0%) | 374 (95.2%) |
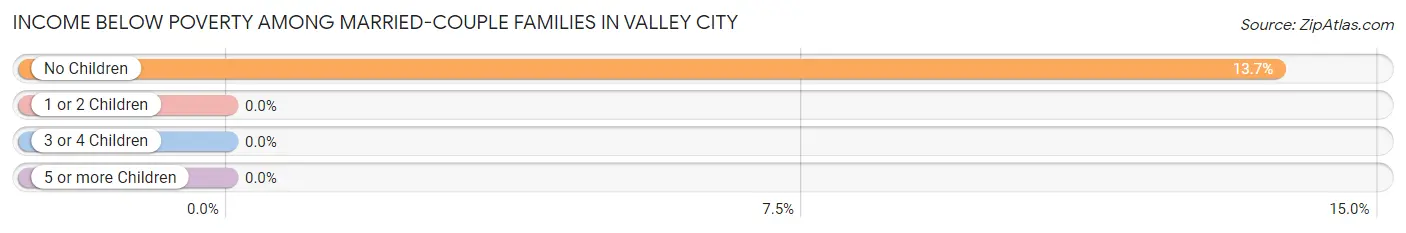
Income Below Poverty Among Married-Couple Families in Valley City
The poverty statistics for married-couple families in Valley City show that 9.6% or 19 of the total 197 families live below the poverty line. Families with no children have the highest poverty rate of 13.7%, comprising of 19 families. On the other hand, families with 1 or 2 children have the lowest poverty rate of 0.0%, which includes 0 families.
| Children | Above Poverty | Below Poverty |
| No Children | 120 (86.3%) | 19 (13.7%) |
| 1 or 2 Children | 58 (100.0%) | 0 (0.0%) |
| 3 or 4 Children | 0 (0.0%) | 0 (0.0%) |
| 5 or more Children | 0 (0.0%) | 0 (0.0%) |
| Total | 178 (90.4%) | 19 (9.6%) |
Income Below Poverty Among Single-Parent Households in Valley City
| Children | Single Father | Single Mother |
| No Children | 0 (0.0%) | 0 (0.0%) |
| 1 or 2 Children | 0 (0.0%) | 0 (0.0%) |
| 3 or 4 Children | 0 (0.0%) | 0 (0.0%) |
| 5 or more Children | 0 (0.0%) | 0 (0.0%) |
| Total | 0 (0.0%) | 0 (0.0%) |
Income Below Poverty Among Married-Couple vs Single-Parent Households in Valley City
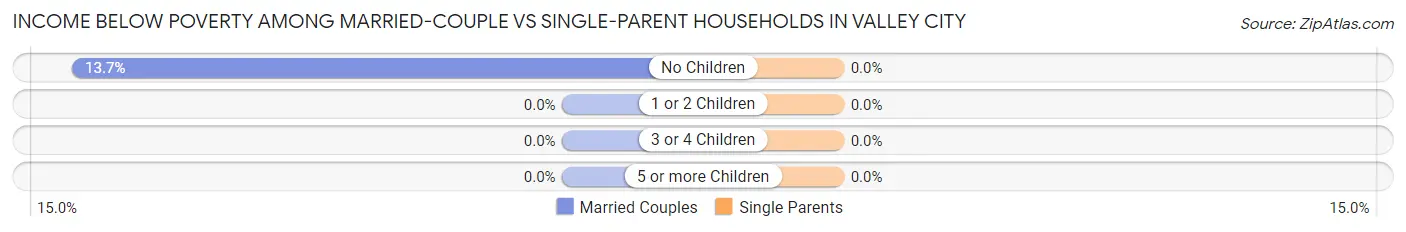
| Children | Married-Couple Families | Single-Parent Households |
| No Children | 19 (13.7%) | 0 (0.0%) |
| 1 or 2 Children | 0 (0.0%) | 0 (0.0%) |
| 3 or 4 Children | 0 (0.0%) | 0 (0.0%) |
| 5 or more Children | 0 (0.0%) | 0 (0.0%) |
| Total | 19 (9.6%) | 0 (0.0%) |
Race in Valley City
The most populous races in Valley City are White / Caucasian (675 | 99.7%), and Two or more Races (2 | 0.3%).
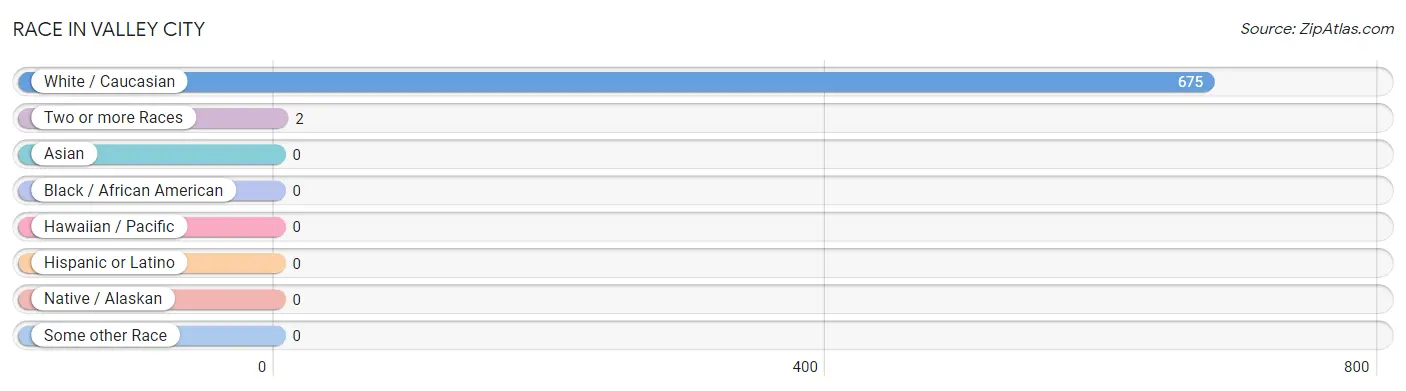
| Race | # Population | % Population |
| Asian | 0 | 0.0% |
| Black / African American | 0 | 0.0% |
| Hawaiian / Pacific | 0 | 0.0% |
| Hispanic or Latino | 0 | 0.0% |
| Native / Alaskan | 0 | 0.0% |
| White / Caucasian | 675 | 99.7% |
| Two or more Races | 2 | 0.3% |
| Some other Race | 0 | 0.0% |
| Total | 677 | 100.0% |
Ancestry in Valley City
The most populous ancestries reported in Valley City are Italian (195 | 28.8%), German (173 | 25.6%), Irish (159 | 23.5%), Hungarian (66 | 9.8%), and Dutch (49 | 7.2%), together accounting for 94.8% of all Valley City residents.
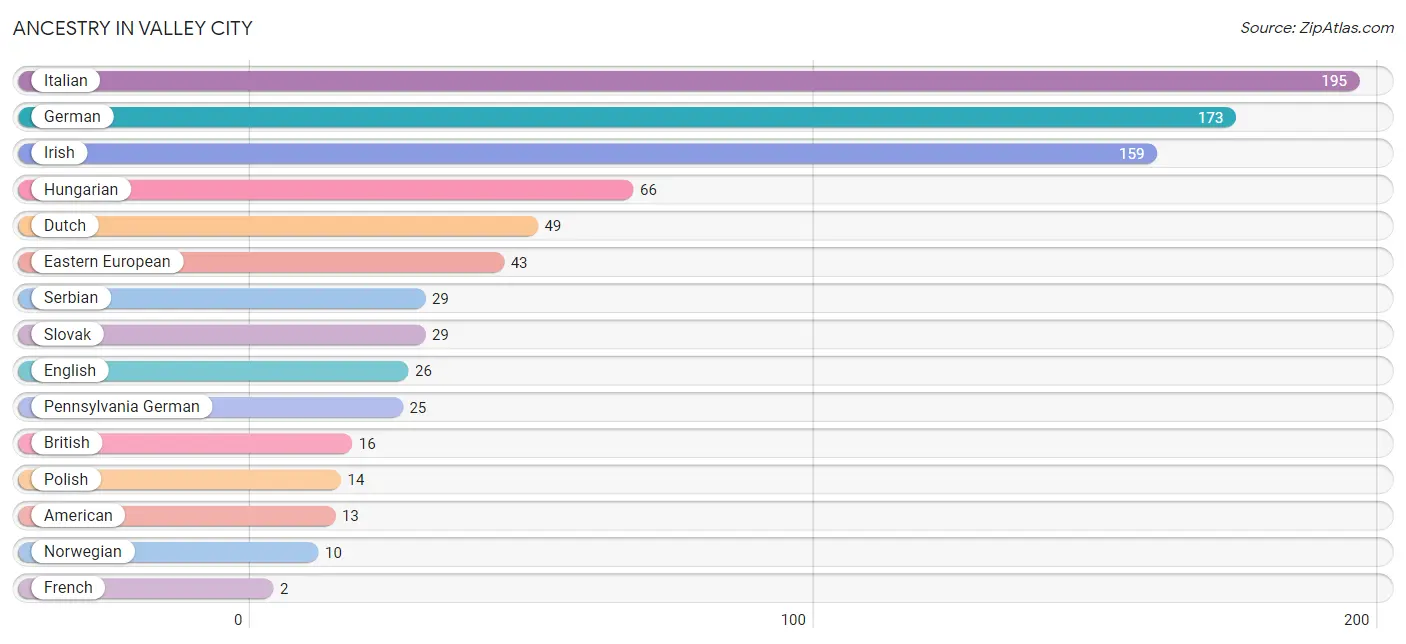
| Ancestry | # Population | % Population |
| American | 13 | 1.9% |
| British | 16 | 2.4% |
| Dutch | 49 | 7.2% |
| Eastern European | 43 | 6.4% |
| English | 26 | 3.8% |
| French | 2 | 0.3% |
| German | 173 | 25.6% |
| Hungarian | 66 | 9.8% |
| Irish | 159 | 23.5% |
| Italian | 195 | 28.8% |
| Norwegian | 10 | 1.5% |
| Pennsylvania German | 25 | 3.7% |
| Polish | 14 | 2.1% |
| Serbian | 29 | 4.3% |
| Slovak | 29 | 4.3% | View All 15 Rows |
Immigrants in Valley City

| Immigration Origin | # Population | % Population | View All 0 Rows |
Sex and Age in Valley City
Sex and Age in Valley City
The most populous age groups in Valley City are 65 to 69 Years (87 | 30.6%) for men and 5 to 9 Years (111 | 28.2%) for women.
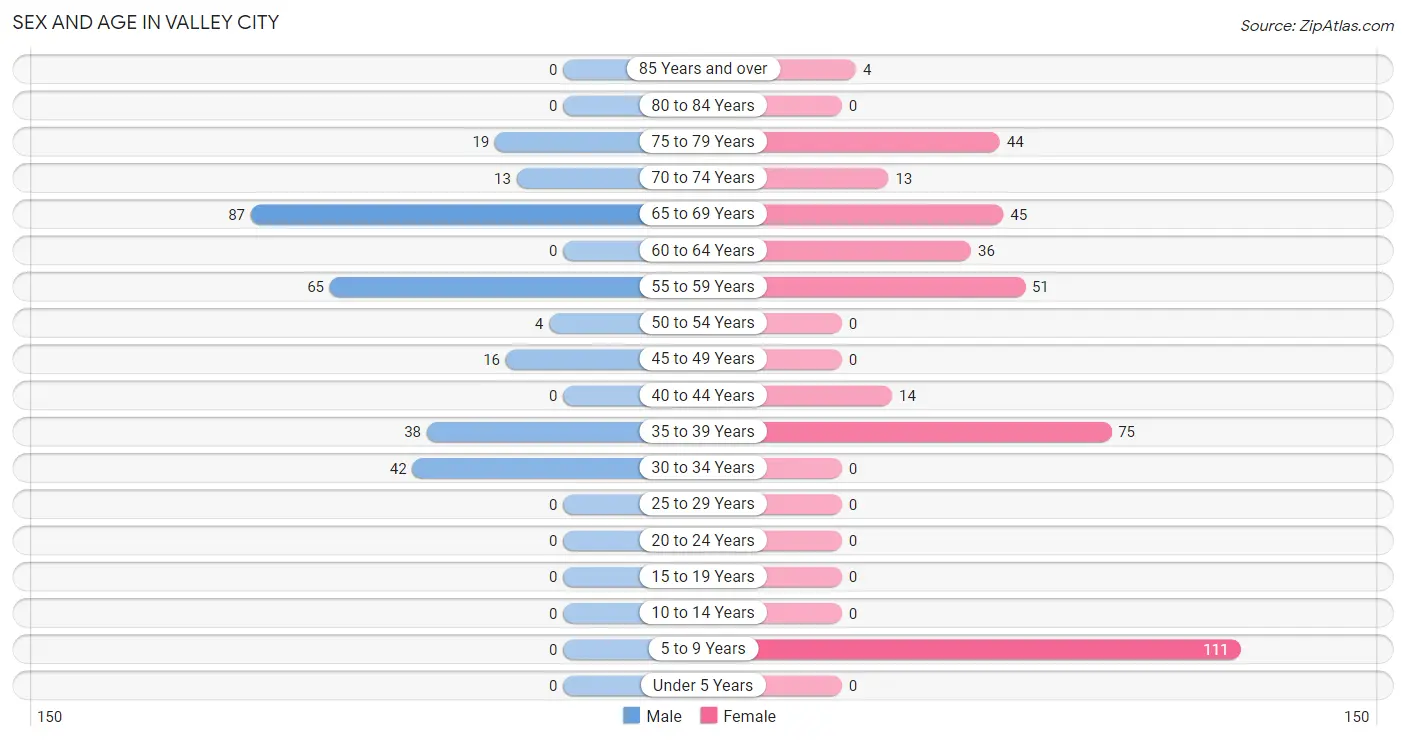
| Age Bracket | Male | Female |
| Under 5 Years | 0 (0.0%) | 0 (0.0%) |
| 5 to 9 Years | 0 (0.0%) | 111 (28.2%) |
| 10 to 14 Years | 0 (0.0%) | 0 (0.0%) |
| 15 to 19 Years | 0 (0.0%) | 0 (0.0%) |
| 20 to 24 Years | 0 (0.0%) | 0 (0.0%) |
| 25 to 29 Years | 0 (0.0%) | 0 (0.0%) |
| 30 to 34 Years | 42 (14.8%) | 0 (0.0%) |
| 35 to 39 Years | 38 (13.4%) | 75 (19.1%) |
| 40 to 44 Years | 0 (0.0%) | 14 (3.6%) |
| 45 to 49 Years | 16 (5.6%) | 0 (0.0%) |
| 50 to 54 Years | 4 (1.4%) | 0 (0.0%) |
| 55 to 59 Years | 65 (22.9%) | 51 (13.0%) |
| 60 to 64 Years | 0 (0.0%) | 36 (9.2%) |
| 65 to 69 Years | 87 (30.6%) | 45 (11.5%) |
| 70 to 74 Years | 13 (4.6%) | 13 (3.3%) |
| 75 to 79 Years | 19 (6.7%) | 44 (11.2%) |
| 80 to 84 Years | 0 (0.0%) | 0 (0.0%) |
| 85 Years and over | 0 (0.0%) | 4 (1.0%) |
| Total | 284 (100.0%) | 393 (100.0%) |
Families and Households in Valley City
Median Family Size in Valley City
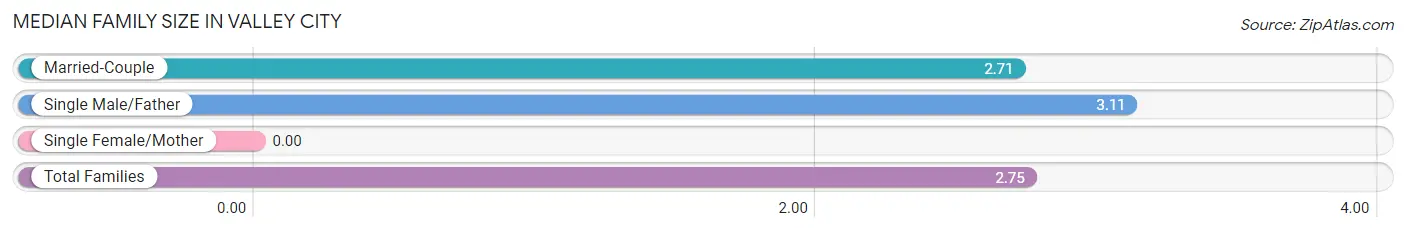
| Family Type | # Families | Family Size |
| Married-Couple | 197 (91.2%) | 2.71 |
| Single Male/Father | 19 (8.8%) | 3.11 |
| Single Female/Mother | 0 (0.0%) | - |
| Total Families | 216 (100.0%) | 2.75 |
Median Household Size in Valley City
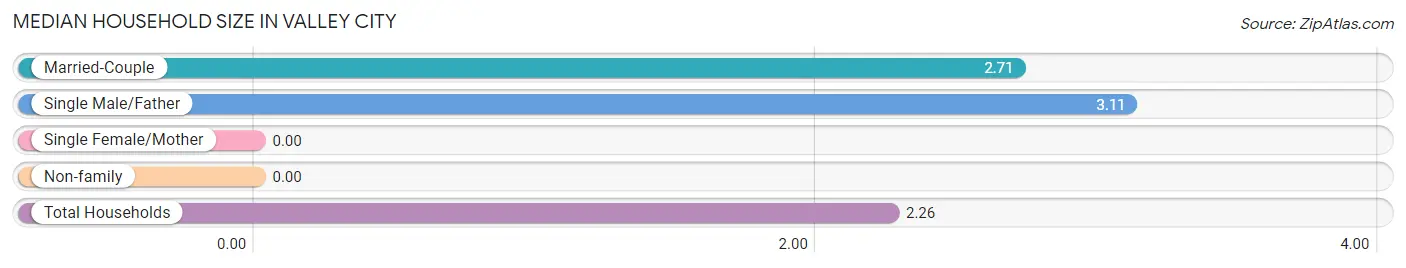
| Household Type | # Households | Household Size |
| Married-Couple | 197 (65.7%) | 2.71 |
| Single Male/Father | 19 (6.3%) | 3.11 |
| Single Female/Mother | 0 (0.0%) | - |
| Non-family | 84 (28.0%) | - |
| Total Households | 300 (100.0%) | 2.26 |
Household Size by Marriage Status in Valley City
Out of a total of 300 households in Valley City, 216 (72.0%) are family households, while 84 (28.0%) are nonfamily households. The most numerous type of family households are 2-person households, comprising 106, and the most common type of nonfamily households are 1-person households, comprising 84.
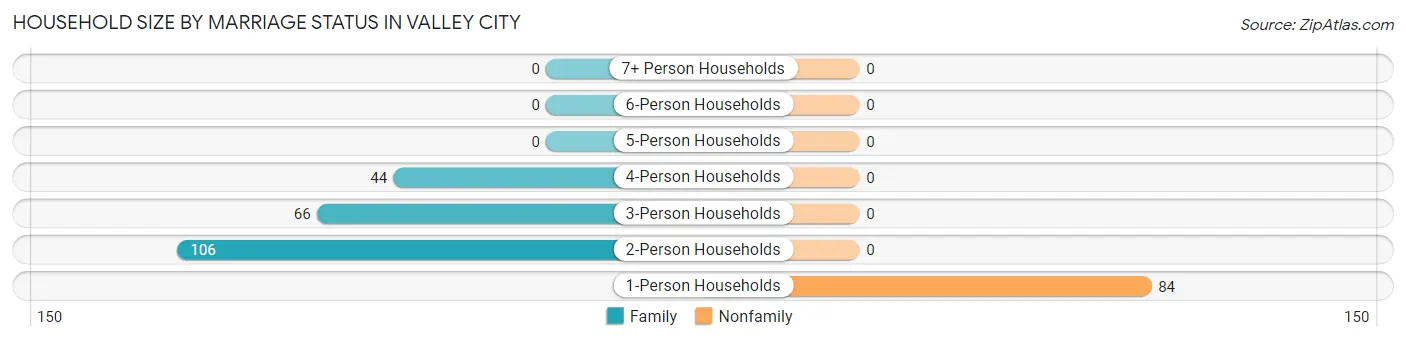
| Household Size | Family Households | Nonfamily Households |
| 1-Person Households | - | 84 (28.0%) |
| 2-Person Households | 106 (35.3%) | 0 (0.0%) |
| 3-Person Households | 66 (22.0%) | 0 (0.0%) |
| 4-Person Households | 44 (14.7%) | 0 (0.0%) |
| 5-Person Households | 0 (0.0%) | 0 (0.0%) |
| 6-Person Households | 0 (0.0%) | 0 (0.0%) |
| 7+ Person Households | 0 (0.0%) | 0 (0.0%) |
| Total | 216 (72.0%) | 84 (28.0%) |
Female Fertility in Valley City
Fertility by Age in Valley City
| Age Bracket | Women with Births | Births / 1,000 Women |
| 15 to 19 years | 0 (0.0%) | 0.0 |
| 20 to 34 years | 0 (0.0%) | 0.0 |
| 35 to 50 years | 0 (0.0%) | 0.0 |
| Total | 0 (0.0%) | 0.0 |
Fertility by Age by Marriage Status in Valley City
| Age Bracket | Married | Unmarried |
| 15 to 19 years | 0 (0.0%) | 0 (0.0%) |
| 20 to 34 years | 0 (0.0%) | 0 (0.0%) |
| 35 to 50 years | 0 (0.0%) | 0 (0.0%) |
| Total | 0 (0.0%) | 0 (0.0%) |
Fertility by Education in Valley City
| Educational Attainment | Women with Births | Births / 1,000 Women |
| Less than High School | 0 (0.0%) | 0.0 |
| High School Diploma | 0 (0.0%) | 0.0 |
| College or Associate's Degree | 0 (0.0%) | 0.0 |
| Bachelor's Degree | 0 (0.0%) | 0.0 |
| Graduate Degree | 0 (0.0%) | 0.0 |
| Total | 0 (0.0%) | 0.0 |
Fertility by Education by Marriage Status in Valley City
| Educational Attainment | Married | Unmarried |
| Less than High School | 0 (0.0%) | 0 (0.0%) |
| High School Diploma | 0 (0.0%) | 0 (0.0%) |
| College or Associate's Degree | 0 (0.0%) | 0 (0.0%) |
| Bachelor's Degree | 0 (0.0%) | 0 (0.0%) |
| Graduate Degree | 0 (0.0%) | 0 (0.0%) |
| Total | 0 (0.0%) | 0 (0.0%) |
Employment Characteristics in Valley City
Employment by Class of Employer in Valley City
Among the 339 employed individuals in Valley City, private company employees (182 | 53.7%), not-for-profit organizations (51 | 15.0%), and self-employed (incorporated) (38 | 11.2%) make up the most common classes of employment.
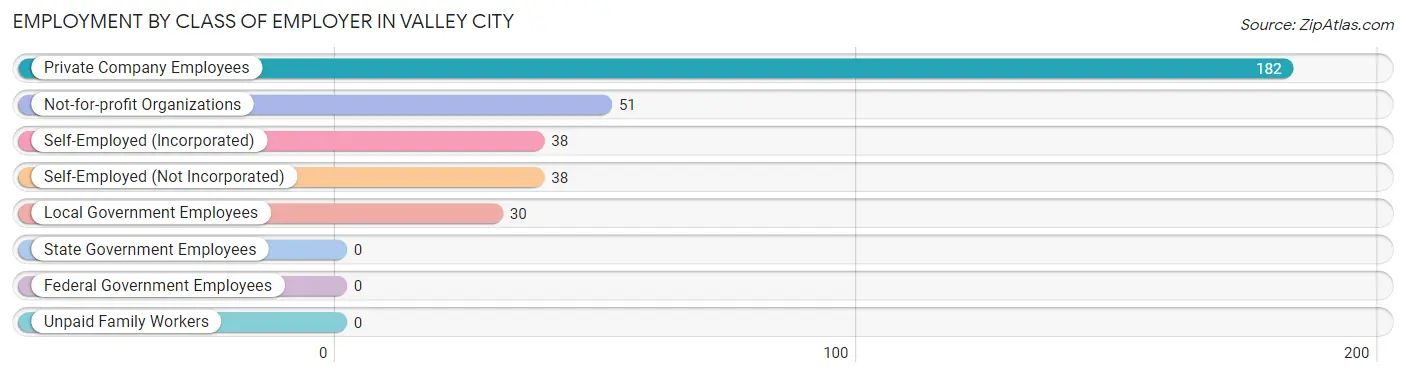
| Employer Class | # Employees | % Employees |
| Private Company Employees | 182 | 53.7% |
| Self-Employed (Incorporated) | 38 | 11.2% |
| Self-Employed (Not Incorporated) | 38 | 11.2% |
| Not-for-profit Organizations | 51 | 15.0% |
| Local Government Employees | 30 | 8.8% |
| State Government Employees | 0 | 0.0% |
| Federal Government Employees | 0 | 0.0% |
| Unpaid Family Workers | 0 | 0.0% |
| Total | 339 | 100.0% |
Employment Status by Age in Valley City
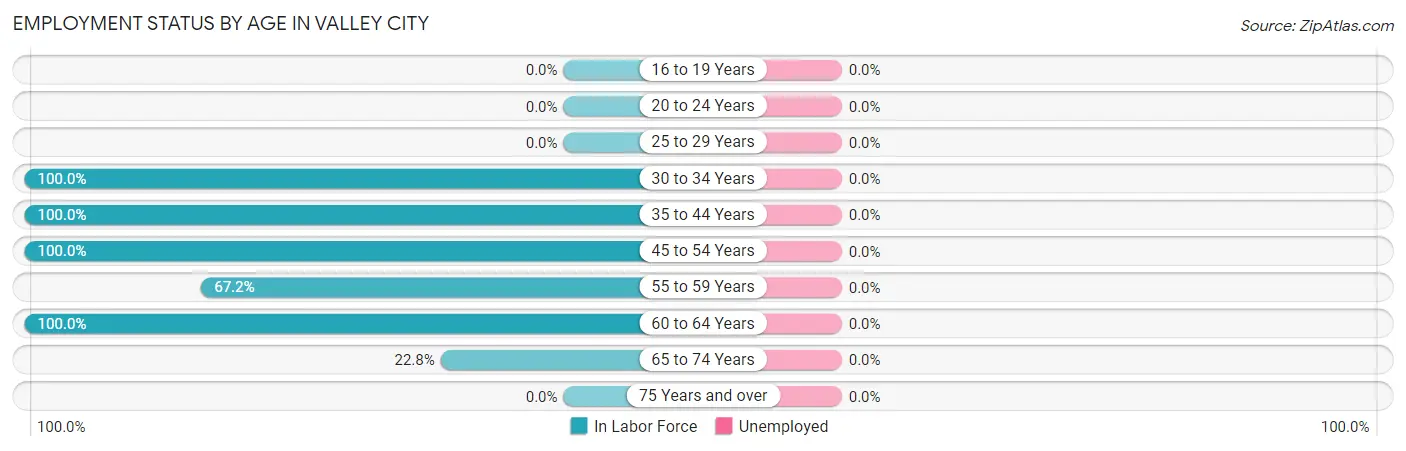
| Age Bracket | In Labor Force | Unemployed |
| 16 to 19 Years | 0 (0.0%) | 0 (0.0%) |
| 20 to 24 Years | 0 (0.0%) | 0 (0.0%) |
| 25 to 29 Years | 0 (0.0%) | 0 (0.0%) |
| 30 to 34 Years | 42 (100.0%) | 0 (0.0%) |
| 35 to 44 Years | 127 (100.0%) | 0 (0.0%) |
| 45 to 54 Years | 20 (100.0%) | 0 (0.0%) |
| 55 to 59 Years | 78 (67.2%) | 0 (0.0%) |
| 60 to 64 Years | 36 (100.0%) | 0 (0.0%) |
| 65 to 74 Years | 36 (22.8%) | 0 (0.0%) |
| 75 Years and over | 0 (0.0%) | 0 (0.0%) |
| Total | 339 (59.9%) | 0 (0.0%) |
Employment Status by Educational Attainment in Valley City
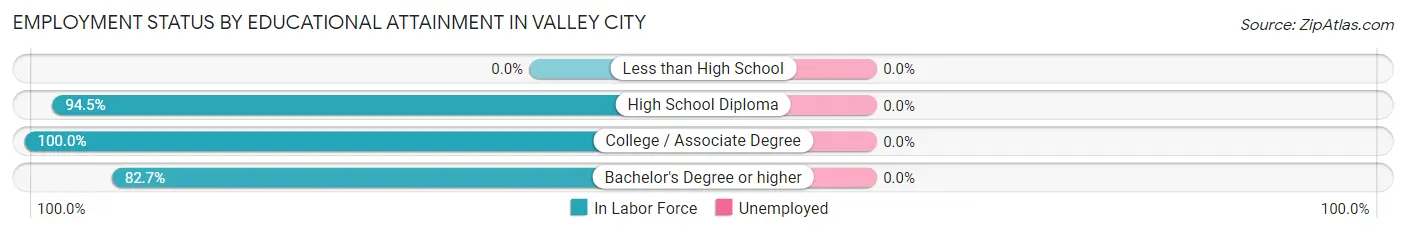
| Educational Attainment | In Labor Force | Unemployed |
| Less than High School | 0 (0.0%) | 0 (0.0%) |
| High School Diploma | 69 (94.5%) | 0 (0.0%) |
| College / Associate Degree | 71 (100.0%) | 0 (0.0%) |
| Bachelor's Degree or higher | 163 (82.7%) | 0 (0.0%) |
| Total | 303 (88.9%) | 0 (0.0%) |
Employment Occupations by Sex in Valley City
Management, Business, Science and Arts Occupations
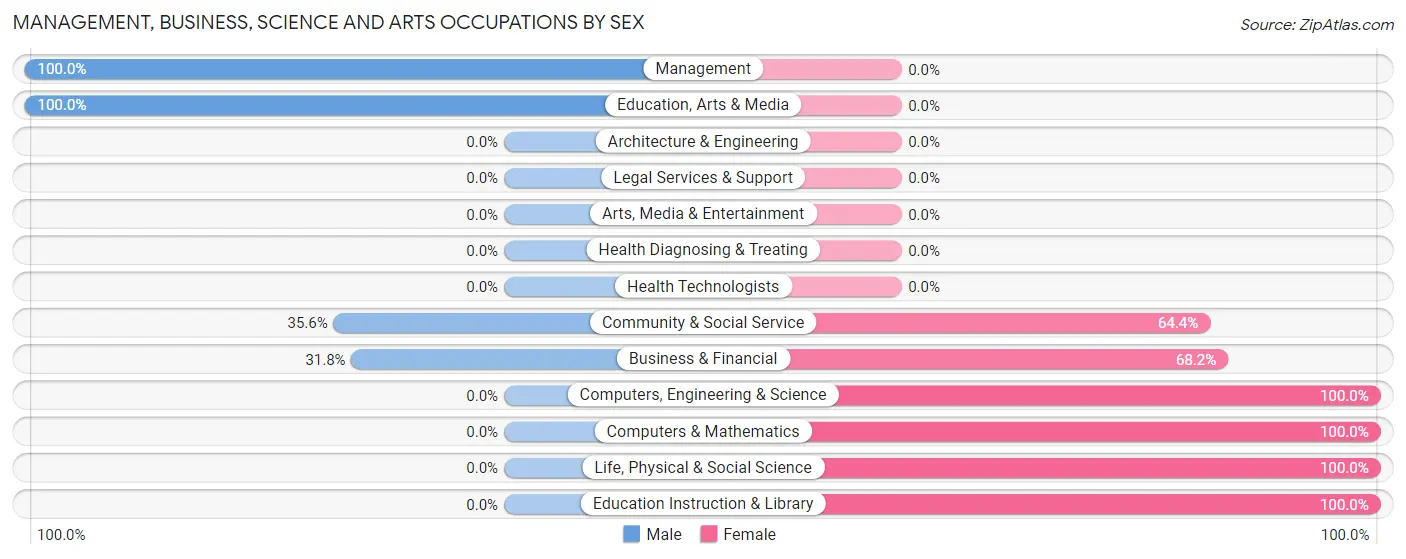
The most common Management, Business, Science and Arts occupations in Valley City are Computers, Engineering & Science (61 | 18.0%), Community & Social Service (45 | 13.3%), Business & Financial (44 | 13.0%), Computers & Mathematics (44 | 13.0%), and Management (38 | 11.2%).
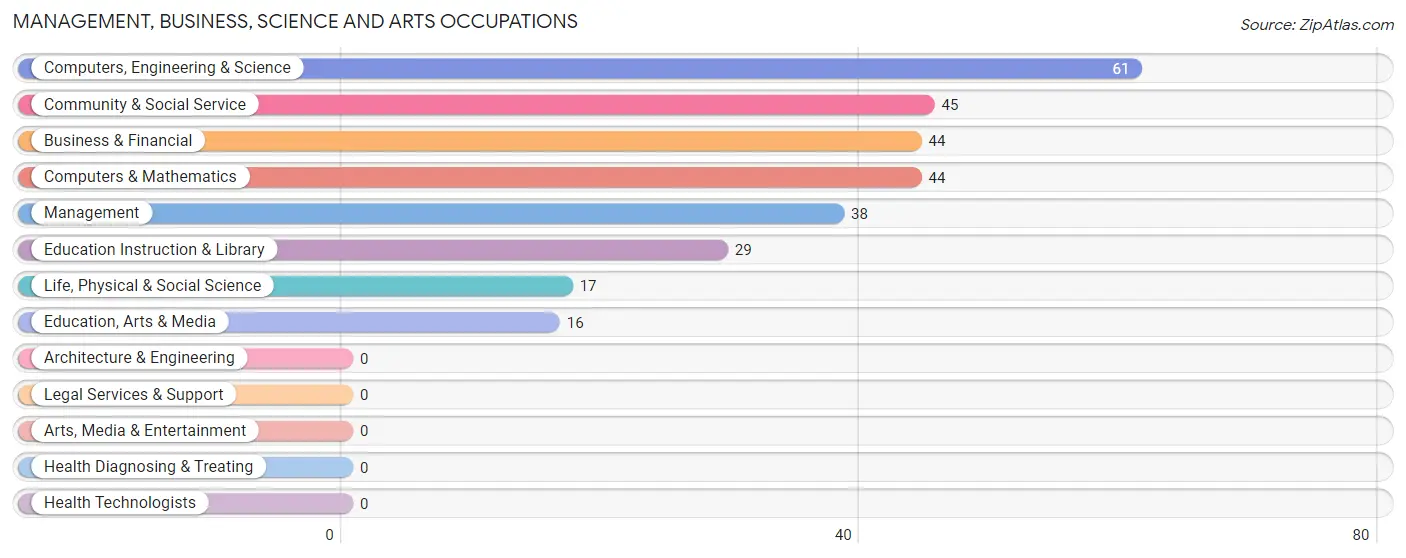
Management, Business, Science and Arts Occupations by Sex
Within the Management, Business, Science and Arts occupations in Valley City, the most male-oriented occupations are Management (100.0%), Education, Arts & Media (100.0%), and Community & Social Service (35.6%), while the most female-oriented occupations are Computers, Engineering & Science (100.0%), Computers & Mathematics (100.0%), and Life, Physical & Social Science (100.0%).
| Occupation | Male | Female |
| Management | 38 (100.0%) | 0 (0.0%) |
| Business & Financial | 14 (31.8%) | 30 (68.2%) |
| Computers, Engineering & Science | 0 (0.0%) | 61 (100.0%) |
| Computers & Mathematics | 0 (0.0%) | 44 (100.0%) |
| Architecture & Engineering | 0 (0.0%) | 0 (0.0%) |
| Life, Physical & Social Science | 0 (0.0%) | 17 (100.0%) |
| Community & Social Service | 16 (35.6%) | 29 (64.4%) |
| Education, Arts & Media | 16 (100.0%) | 0 (0.0%) |
| Legal Services & Support | 0 (0.0%) | 0 (0.0%) |
| Education Instruction & Library | 0 (0.0%) | 29 (100.0%) |
| Arts, Media & Entertainment | 0 (0.0%) | 0 (0.0%) |
| Health Diagnosing & Treating | 0 (0.0%) | 0 (0.0%) |
| Health Technologists | 0 (0.0%) | 0 (0.0%) |
| Total (Category) | 68 (36.2%) | 120 (63.8%) |
| Total (Overall) | 163 (48.1%) | 176 (51.9%) |
Services Occupations
Services Occupations by Sex
| Occupation | Male | Female |
| Healthcare Support | 0 (0.0%) | 0 (0.0%) |
| Security & Protection | 0 (0.0%) | 0 (0.0%) |
| Firefighting & Prevention | 0 (0.0%) | 0 (0.0%) |
| Law Enforcement | 0 (0.0%) | 0 (0.0%) |
| Food Preparation & Serving | 0 (0.0%) | 0 (0.0%) |
| Cleaning & Maintenance | 0 (0.0%) | 0 (0.0%) |
| Personal Care & Service | 0 (0.0%) | 0 (0.0%) |
| Total (Category) | 0 (0.0%) | 0 (0.0%) |
| Total (Overall) | 163 (48.1%) | 176 (51.9%) |
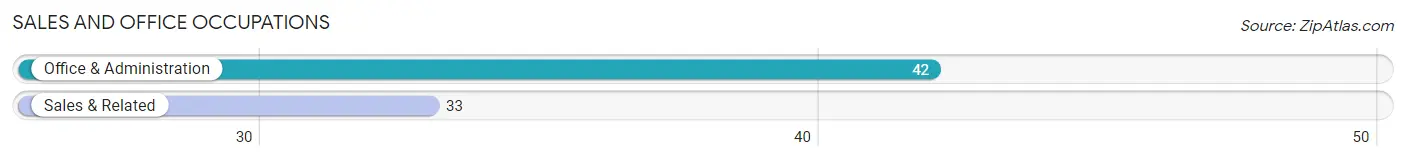
Sales and Office Occupations
The most common Sales and Office occupations in Valley City are Office & Administration (42 | 12.4%), and Sales & Related (33 | 9.7%).
Sales and Office Occupations by Sex

| Occupation | Male | Female |
| Sales & Related | 33 (100.0%) | 0 (0.0%) |
| Office & Administration | 0 (0.0%) | 42 (100.0%) |
| Total (Category) | 33 (44.0%) | 42 (56.0%) |
| Total (Overall) | 163 (48.1%) | 176 (51.9%) |
Natural Resources, Construction and Maintenance Occupations
The most common Natural Resources, Construction and Maintenance occupations in Valley City are Construction & Extraction (38 | 11.2%), and Installation, Maintenance & Repair (24 | 7.1%).
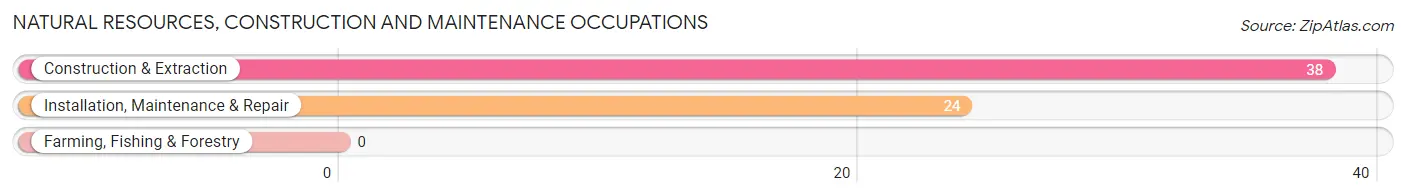
Natural Resources, Construction and Maintenance Occupations by Sex
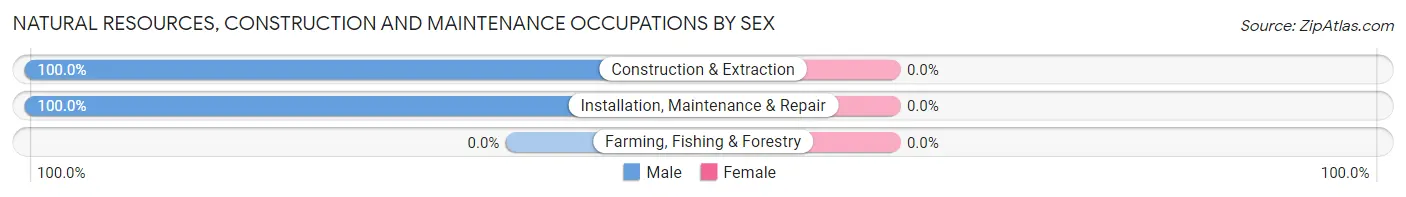
| Occupation | Male | Female |
| Farming, Fishing & Forestry | 0 (0.0%) | 0 (0.0%) |
| Construction & Extraction | 38 (100.0%) | 0 (0.0%) |
| Installation, Maintenance & Repair | 24 (100.0%) | 0 (0.0%) |
| Total (Category) | 62 (100.0%) | 0 (0.0%) |
| Total (Overall) | 163 (48.1%) | 176 (51.9%) |
Production, Transportation and Moving Occupations
The most common Production, Transportation and Moving occupations in Valley City are , and Material Moving (14 | 4.1%).
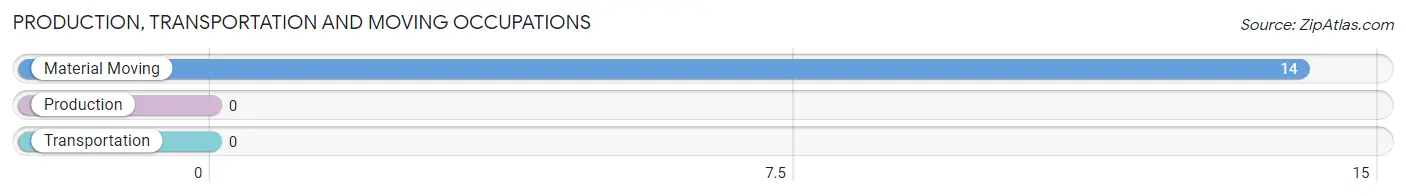
Production, Transportation and Moving Occupations by Sex
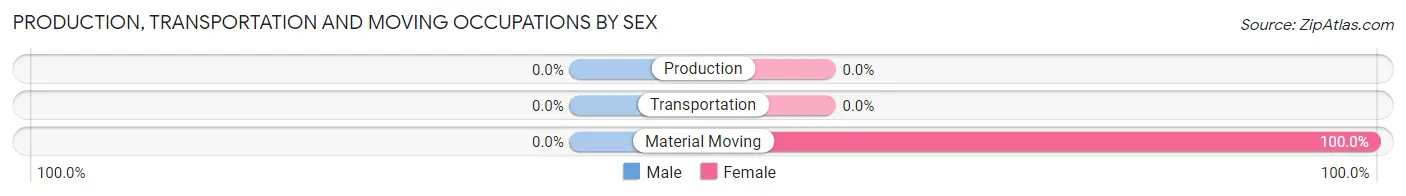
| Occupation | Male | Female |
| Production | 0 (0.0%) | 0 (0.0%) |
| Transportation | 0 (0.0%) | 0 (0.0%) |
| Material Moving | 0 (0.0%) | 14 (100.0%) |
| Total (Category) | 0 (0.0%) | 14 (100.0%) |
| Total (Overall) | 163 (48.1%) | 176 (51.9%) |
Employment Industries by Sex in Valley City
Employment Industries in Valley City
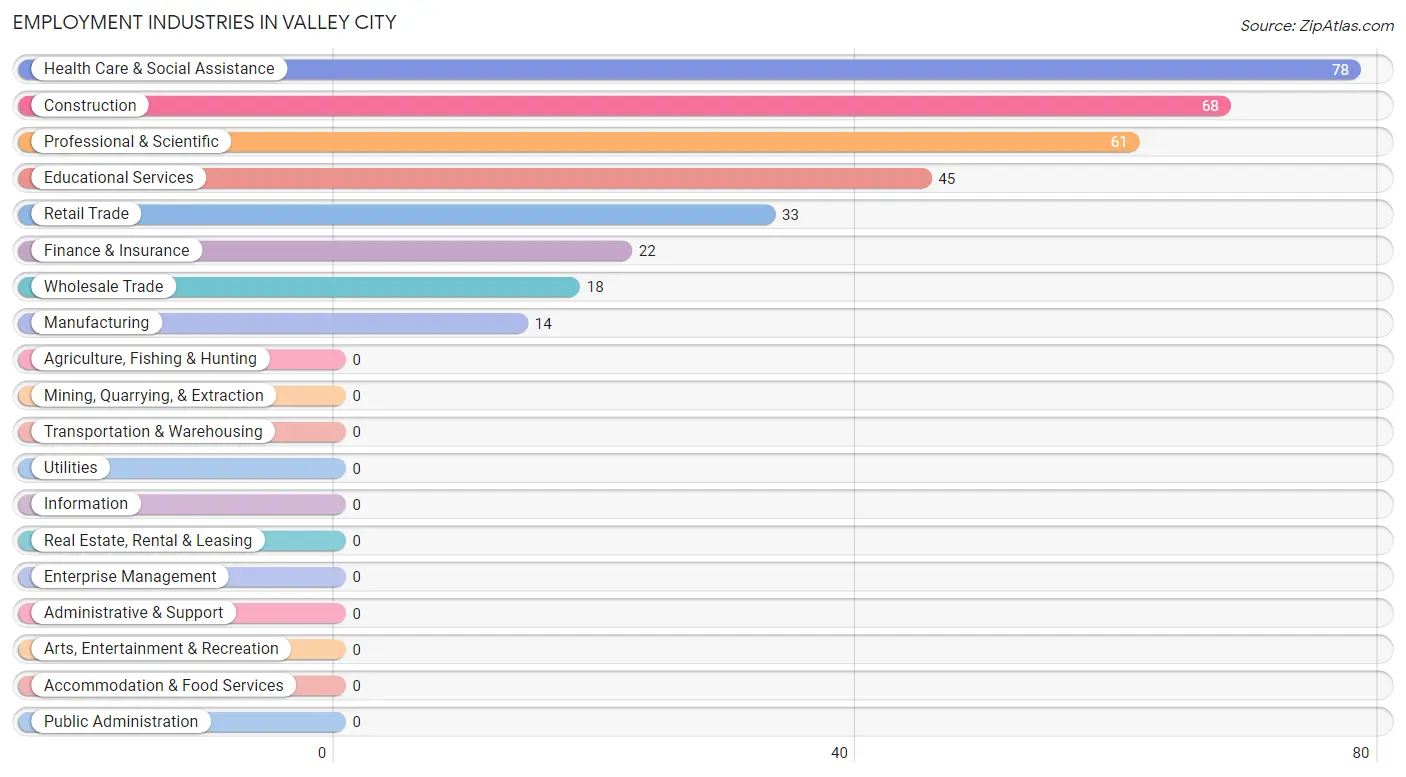
The major employment industries in Valley City include Health Care & Social Assistance (78 | 23.0%), Construction (68 | 20.1%), Professional & Scientific (61 | 18.0%), Educational Services (45 | 13.3%), and Retail Trade (33 | 9.7%).
Employment Industries by Sex in Valley City
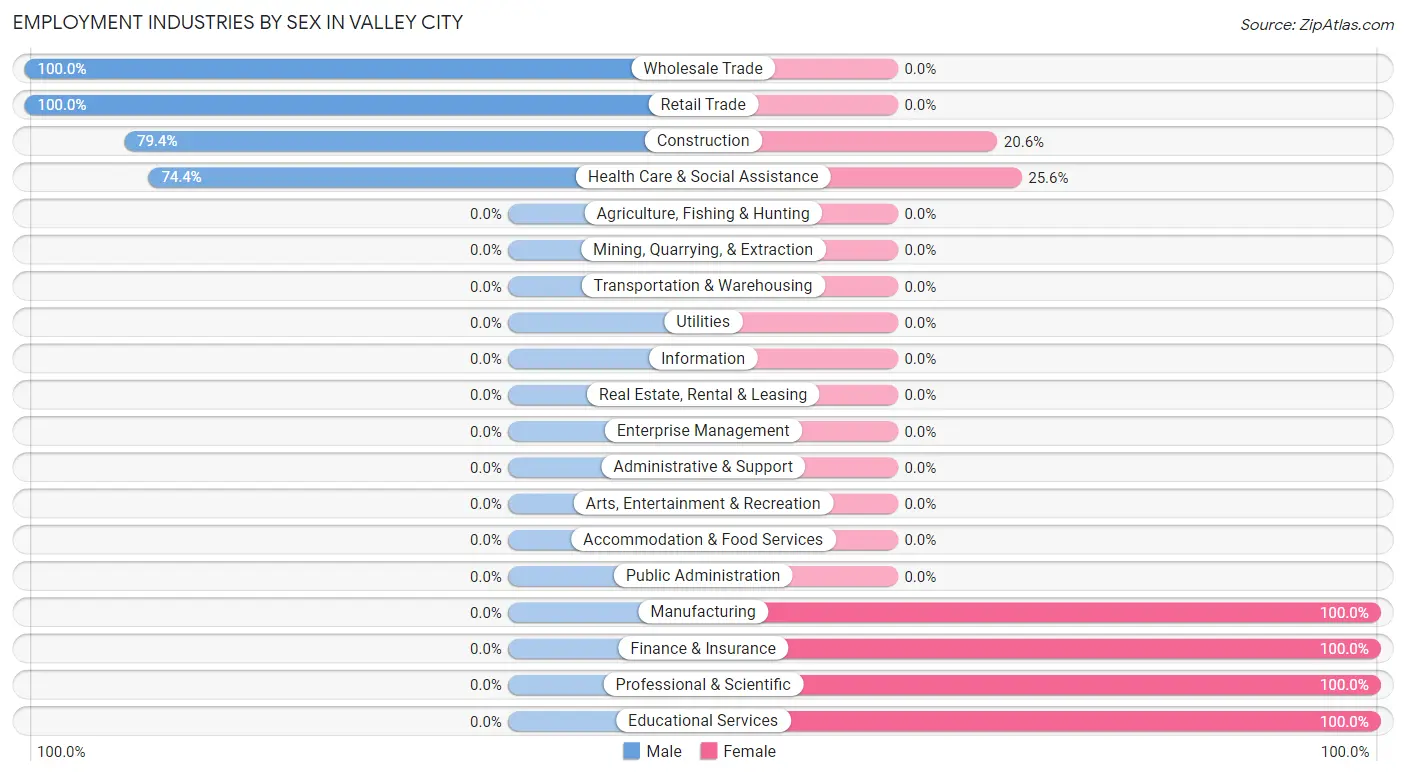
The Valley City industries that see more men than women are Wholesale Trade (100.0%), Retail Trade (100.0%), and Construction (79.4%), whereas the industries that tend to have a higher number of women are Manufacturing (100.0%), Finance & Insurance (100.0%), and Professional & Scientific (100.0%).
| Industry | Male | Female |
| Agriculture, Fishing & Hunting | 0 (0.0%) | 0 (0.0%) |
| Mining, Quarrying, & Extraction | 0 (0.0%) | 0 (0.0%) |
| Construction | 54 (79.4%) | 14 (20.6%) |
| Manufacturing | 0 (0.0%) | 14 (100.0%) |
| Wholesale Trade | 18 (100.0%) | 0 (0.0%) |
| Retail Trade | 33 (100.0%) | 0 (0.0%) |
| Transportation & Warehousing | 0 (0.0%) | 0 (0.0%) |
| Utilities | 0 (0.0%) | 0 (0.0%) |
| Information | 0 (0.0%) | 0 (0.0%) |
| Finance & Insurance | 0 (0.0%) | 22 (100.0%) |
| Real Estate, Rental & Leasing | 0 (0.0%) | 0 (0.0%) |
| Professional & Scientific | 0 (0.0%) | 61 (100.0%) |
| Enterprise Management | 0 (0.0%) | 0 (0.0%) |
| Administrative & Support | 0 (0.0%) | 0 (0.0%) |
| Educational Services | 0 (0.0%) | 45 (100.0%) |
| Health Care & Social Assistance | 58 (74.4%) | 20 (25.6%) |
| Arts, Entertainment & Recreation | 0 (0.0%) | 0 (0.0%) |
| Accommodation & Food Services | 0 (0.0%) | 0 (0.0%) |
| Public Administration | 0 (0.0%) | 0 (0.0%) |
| Total | 163 (48.1%) | 176 (51.9%) |
Education in Valley City
School Enrollment in Valley City
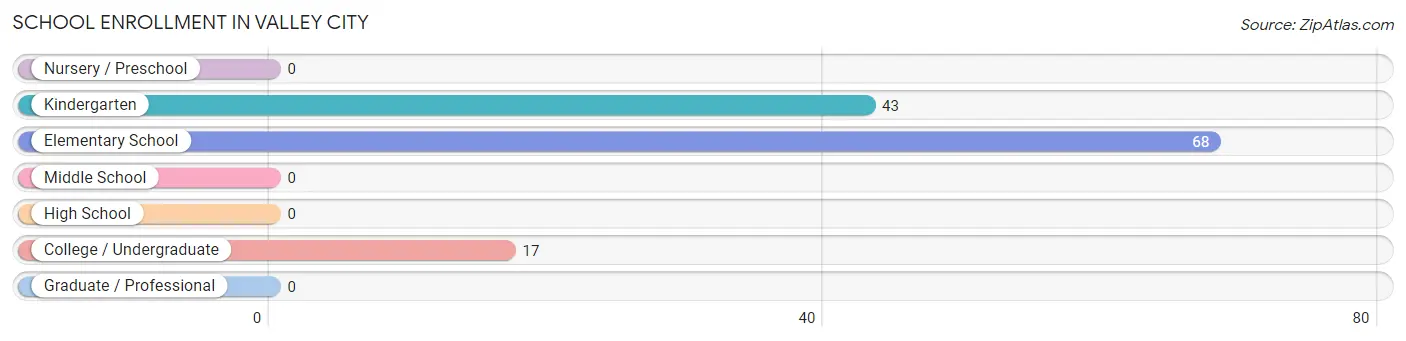
The most common levels of schooling among the 128 students in Valley City are elementary school (68 | 53.1%), kindergarten (43 | 33.6%), and college / undergraduate (17 | 13.3%).
| School Level | # Students | % Students |
| Nursery / Preschool | 0 | 0.0% |
| Kindergarten | 43 | 33.6% |
| Elementary School | 68 | 53.1% |
| Middle School | 0 | 0.0% |
| High School | 0 | 0.0% |
| College / Undergraduate | 17 | 13.3% |
| Graduate / Professional | 0 | 0.0% |
| Total | 128 | 100.0% |
School Enrollment by Age by Funding Source in Valley City
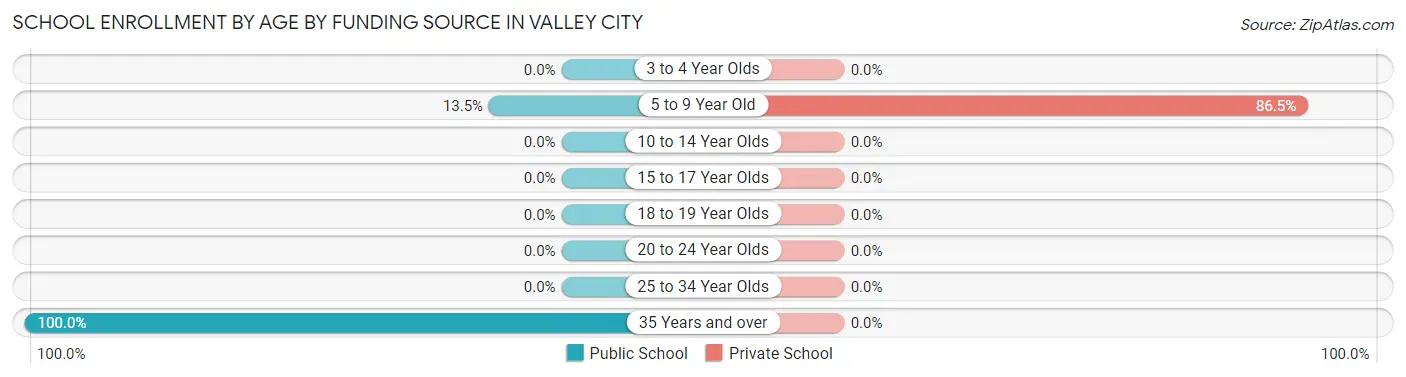
Out of a total of 128 students who are enrolled in schools in Valley City, 96 (75.0%) attend a private institution, while the remaining 32 (25.0%) are enrolled in public schools. The age group of 5 to 9 year old has the highest likelihood of being enrolled in private schools, with 96 (86.5% in the age bracket) enrolled. Conversely, the age group of 35 years and over has the lowest likelihood of being enrolled in a private school, with 17 (100.0% in the age bracket) attending a public institution.
| Age Bracket | Public School | Private School |
| 3 to 4 Year Olds | 0 (0.0%) | 0 (0.0%) |
| 5 to 9 Year Old | 15 (13.5%) | 96 (86.5%) |
| 10 to 14 Year Olds | 0 (0.0%) | 0 (0.0%) |
| 15 to 17 Year Olds | 0 (0.0%) | 0 (0.0%) |
| 18 to 19 Year Olds | 0 (0.0%) | 0 (0.0%) |
| 20 to 24 Year Olds | 0 (0.0%) | 0 (0.0%) |
| 25 to 34 Year Olds | 0 (0.0%) | 0 (0.0%) |
| 35 Years and over | 17 (100.0%) | 0 (0.0%) |
| Total | 32 (25.0%) | 96 (75.0%) |
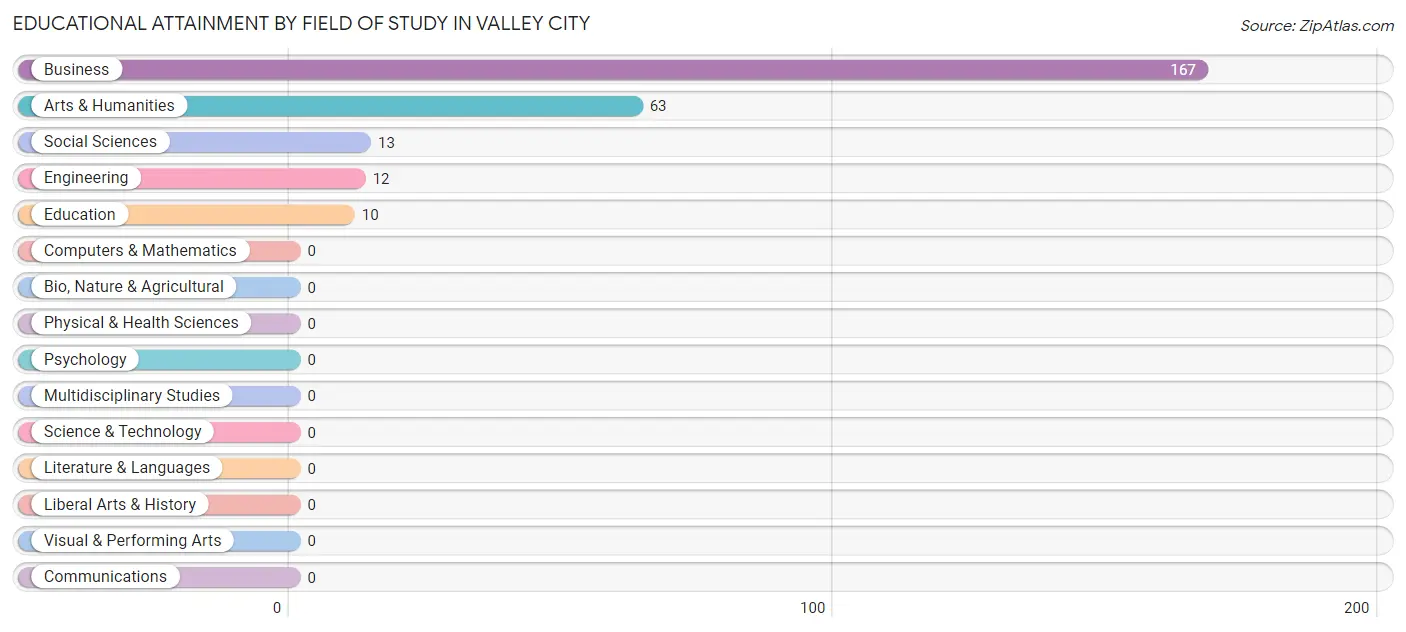
Educational Attainment by Field of Study in Valley City
Business (167 | 63.0%), arts & humanities (63 | 23.8%), social sciences (13 | 4.9%), engineering (12 | 4.5%), and education (10 | 3.8%) are the most common fields of study among 265 individuals in Valley City who have obtained a bachelor's degree or higher.
| Field of Study | # Graduates | % Graduates |
| Computers & Mathematics | 0 | 0.0% |
| Bio, Nature & Agricultural | 0 | 0.0% |
| Physical & Health Sciences | 0 | 0.0% |
| Psychology | 0 | 0.0% |
| Social Sciences | 13 | 4.9% |
| Engineering | 12 | 4.5% |
| Multidisciplinary Studies | 0 | 0.0% |
| Science & Technology | 0 | 0.0% |
| Business | 167 | 63.0% |
| Education | 10 | 3.8% |
| Literature & Languages | 0 | 0.0% |
| Liberal Arts & History | 0 | 0.0% |
| Visual & Performing Arts | 0 | 0.0% |
| Communications | 0 | 0.0% |
| Arts & Humanities | 63 | 23.8% |
| Total | 265 | 100.0% |
Transportation & Commute in Valley City
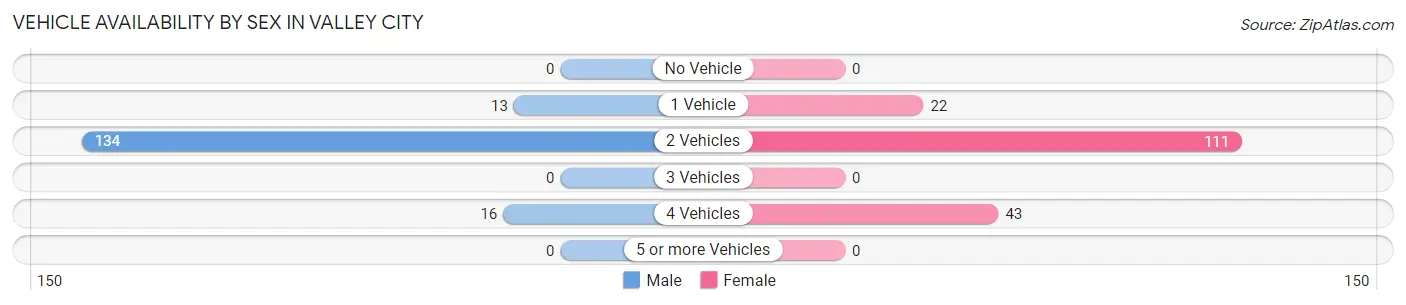
Vehicle Availability by Sex in Valley City
The most prevalent vehicle ownership categories in Valley City are males with 2 vehicles (134, accounting for 82.2%) and females with 2 vehicles (111, making up 76.1%).
| Vehicles Available | Male | Female |
| No Vehicle | 0 (0.0%) | 0 (0.0%) |
| 1 Vehicle | 13 (8.0%) | 22 (12.5%) |
| 2 Vehicles | 134 (82.2%) | 111 (63.1%) |
| 3 Vehicles | 0 (0.0%) | 0 (0.0%) |
| 4 Vehicles | 16 (9.8%) | 43 (24.4%) |
| 5 or more Vehicles | 0 (0.0%) | 0 (0.0%) |
| Total | 163 (100.0%) | 176 (100.0%) |
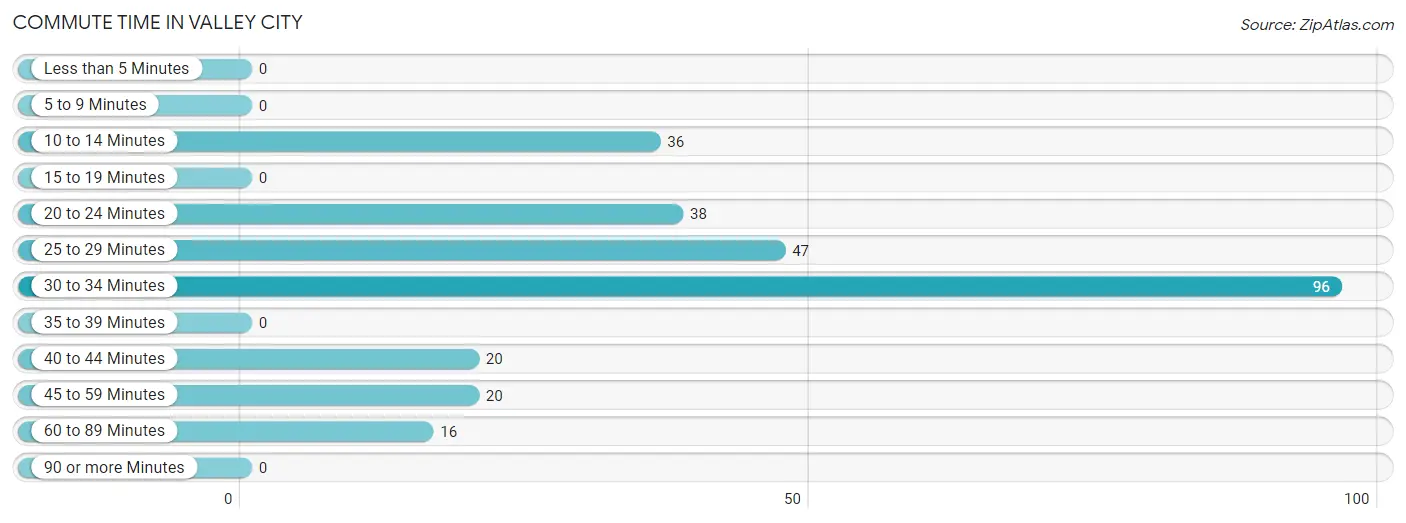
Commute Time in Valley City
The most frequently occuring commute durations in Valley City are 30 to 34 minutes (96 commuters, 35.2%), 25 to 29 minutes (47 commuters, 17.2%), and 20 to 24 minutes (38 commuters, 13.9%).
| Commute Time | # Commuters | % Commuters |
| Less than 5 Minutes | 0 | 0.0% |
| 5 to 9 Minutes | 0 | 0.0% |
| 10 to 14 Minutes | 36 | 13.2% |
| 15 to 19 Minutes | 0 | 0.0% |
| 20 to 24 Minutes | 38 | 13.9% |
| 25 to 29 Minutes | 47 | 17.2% |
| 30 to 34 Minutes | 96 | 35.2% |
| 35 to 39 Minutes | 0 | 0.0% |
| 40 to 44 Minutes | 20 | 7.3% |
| 45 to 59 Minutes | 20 | 7.3% |
| 60 to 89 Minutes | 16 | 5.9% |
| 90 or more Minutes | 0 | 0.0% |
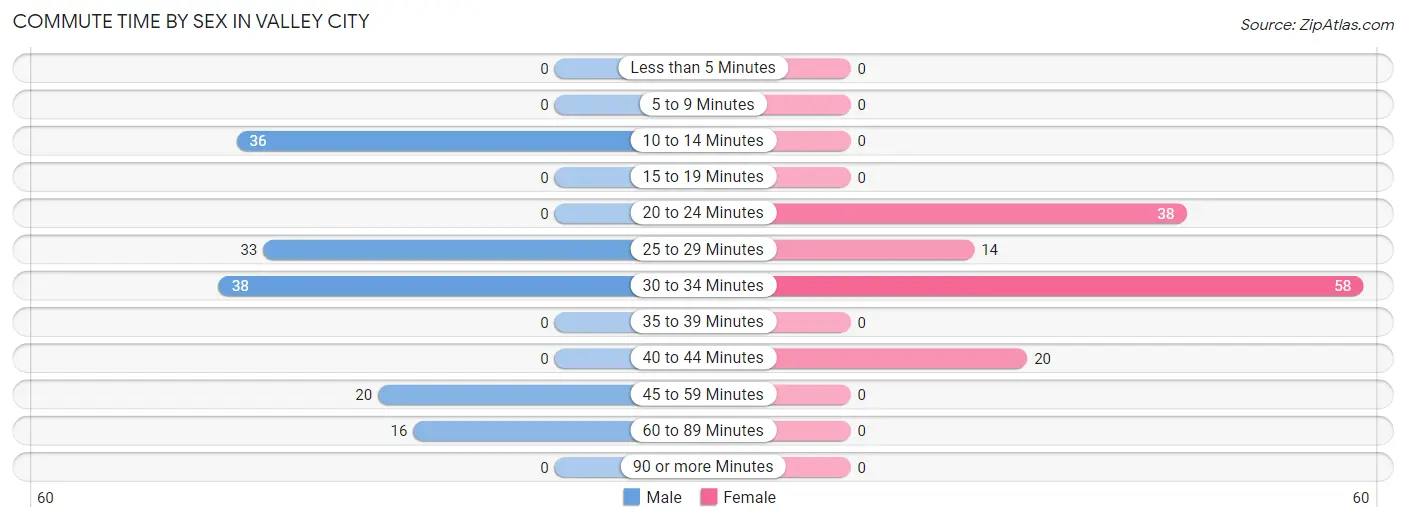
Commute Time by Sex in Valley City
The most common commute times in Valley City are 30 to 34 minutes (38 commuters, 26.6%) for males and 30 to 34 minutes (58 commuters, 44.6%) for females.
| Commute Time | Male | Female |
| Less than 5 Minutes | 0 (0.0%) | 0 (0.0%) |
| 5 to 9 Minutes | 0 (0.0%) | 0 (0.0%) |
| 10 to 14 Minutes | 36 (25.2%) | 0 (0.0%) |
| 15 to 19 Minutes | 0 (0.0%) | 0 (0.0%) |
| 20 to 24 Minutes | 0 (0.0%) | 38 (29.2%) |
| 25 to 29 Minutes | 33 (23.1%) | 14 (10.8%) |
| 30 to 34 Minutes | 38 (26.6%) | 58 (44.6%) |
| 35 to 39 Minutes | 0 (0.0%) | 0 (0.0%) |
| 40 to 44 Minutes | 0 (0.0%) | 20 (15.4%) |
| 45 to 59 Minutes | 20 (14.0%) | 0 (0.0%) |
| 60 to 89 Minutes | 16 (11.2%) | 0 (0.0%) |
| 90 or more Minutes | 0 (0.0%) | 0 (0.0%) |
Time of Departure to Work by Sex in Valley City
The most frequent times of departure to work in Valley City are 6:00 AM to 6:29 AM (58, 40.6%) for males and 7:30 AM to 7:59 AM (60, 46.2%) for females.
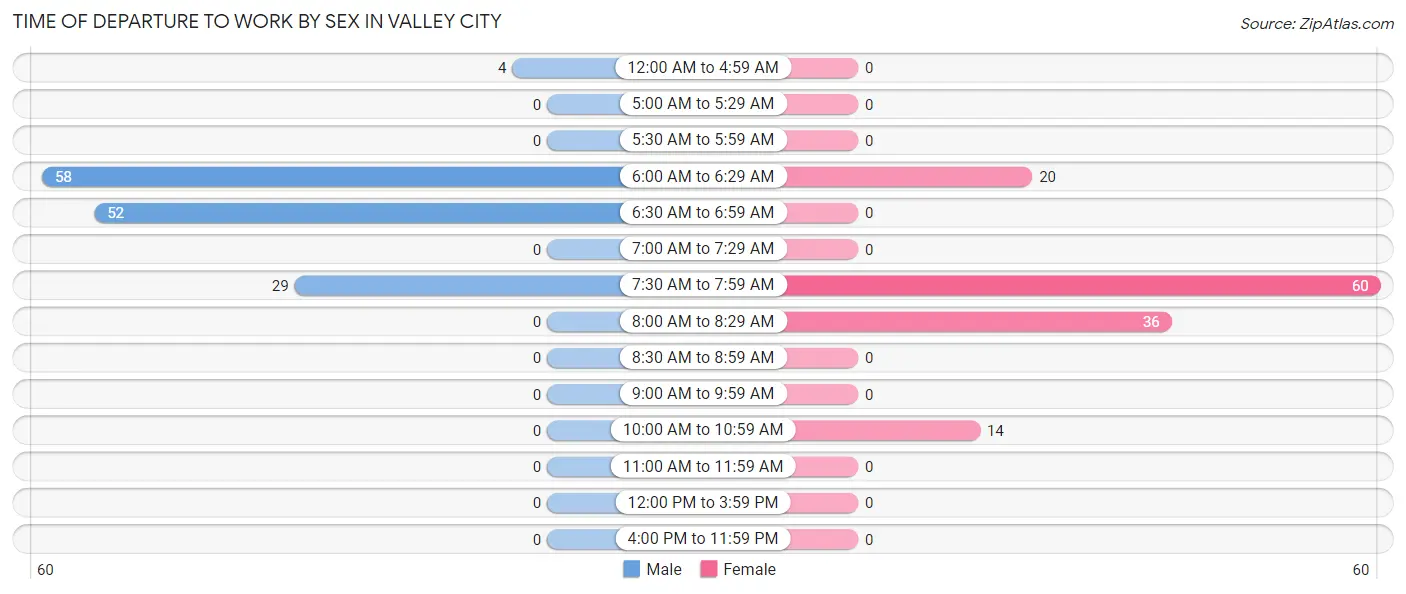
| Time of Departure | Male | Female |
| 12:00 AM to 4:59 AM | 4 (2.8%) | 0 (0.0%) |
| 5:00 AM to 5:29 AM | 0 (0.0%) | 0 (0.0%) |
| 5:30 AM to 5:59 AM | 0 (0.0%) | 0 (0.0%) |
| 6:00 AM to 6:29 AM | 58 (40.6%) | 20 (15.4%) |
| 6:30 AM to 6:59 AM | 52 (36.4%) | 0 (0.0%) |
| 7:00 AM to 7:29 AM | 0 (0.0%) | 0 (0.0%) |
| 7:30 AM to 7:59 AM | 29 (20.3%) | 60 (46.2%) |
| 8:00 AM to 8:29 AM | 0 (0.0%) | 36 (27.7%) |
| 8:30 AM to 8:59 AM | 0 (0.0%) | 0 (0.0%) |
| 9:00 AM to 9:59 AM | 0 (0.0%) | 0 (0.0%) |
| 10:00 AM to 10:59 AM | 0 (0.0%) | 14 (10.8%) |
| 11:00 AM to 11:59 AM | 0 (0.0%) | 0 (0.0%) |
| 12:00 PM to 3:59 PM | 0 (0.0%) | 0 (0.0%) |
| 4:00 PM to 11:59 PM | 0 (0.0%) | 0 (0.0%) |
| Total | 143 (100.0%) | 130 (100.0%) |
Housing Occupancy in Valley City
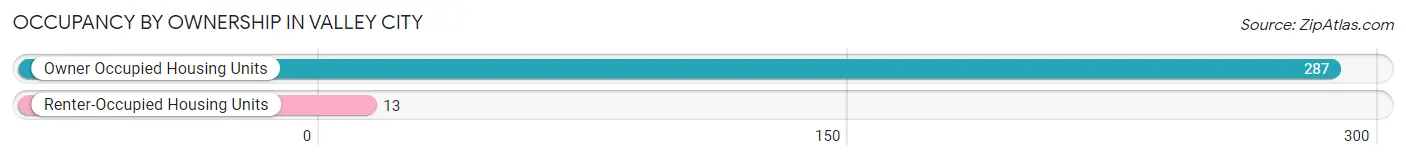
Occupancy by Ownership in Valley City
Of the total 300 dwellings in Valley City, owner-occupied units account for 287 (95.7%), while renter-occupied units make up 13 (4.3%).
| Occupancy | # Housing Units | % Housing Units |
| Owner Occupied Housing Units | 287 | 95.7% |
| Renter-Occupied Housing Units | 13 | 4.3% |
| Total Occupied Housing Units | 300 | 100.0% |
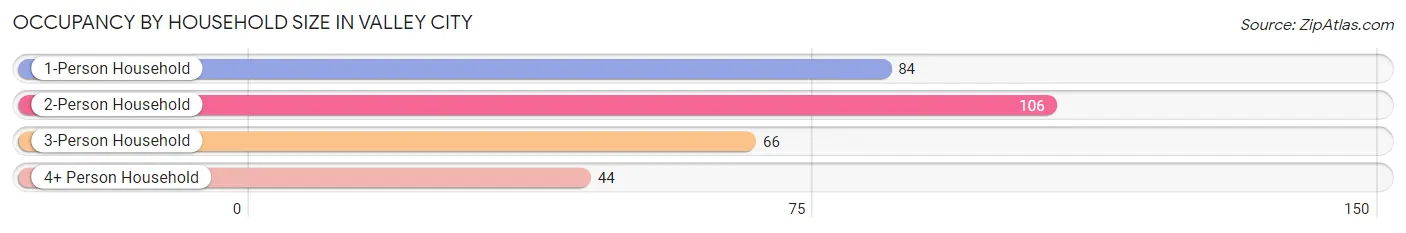
Occupancy by Household Size in Valley City
| Household Size | # Housing Units | % Housing Units |
| 1-Person Household | 84 | 28.0% |
| 2-Person Household | 106 | 35.3% |
| 3-Person Household | 66 | 22.0% |
| 4+ Person Household | 44 | 14.7% |
| Total Housing Units | 300 | 100.0% |
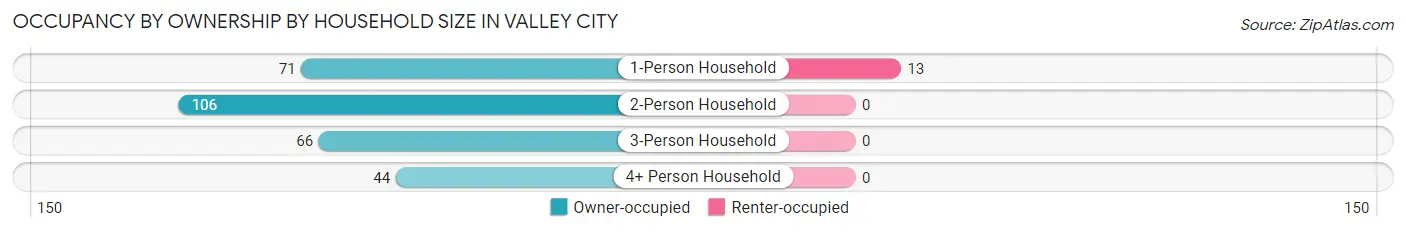
Occupancy by Ownership by Household Size in Valley City
| Household Size | Owner-occupied | Renter-occupied |
| 1-Person Household | 71 (84.5%) | 13 (15.5%) |
| 2-Person Household | 106 (100.0%) | 0 (0.0%) |
| 3-Person Household | 66 (100.0%) | 0 (0.0%) |
| 4+ Person Household | 44 (100.0%) | 0 (0.0%) |
| Total Housing Units | 287 (95.7%) | 13 (4.3%) |
Occupancy by Educational Attainment in Valley City
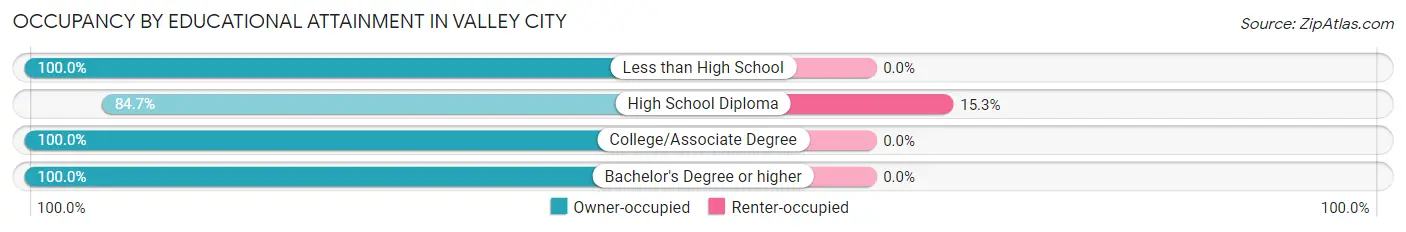
| Household Size | Owner-occupied | Renter-occupied |
| Less than High School | 15 (100.0%) | 0 (0.0%) |
| High School Diploma | 72 (84.7%) | 13 (15.3%) |
| College/Associate Degree | 51 (100.0%) | 0 (0.0%) |
| Bachelor's Degree or higher | 149 (100.0%) | 0 (0.0%) |
Occupancy by Age of Householder in Valley City
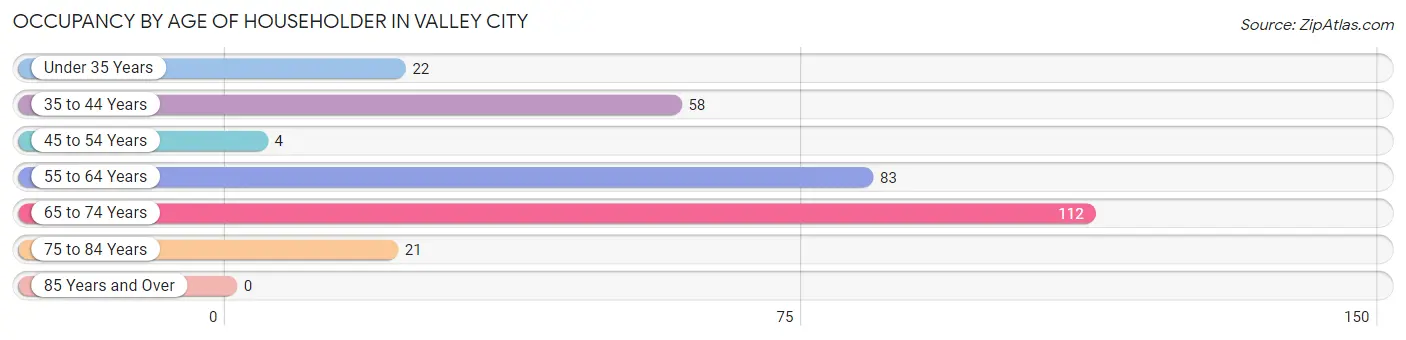
| Age Bracket | # Households | % Households |
| Under 35 Years | 22 | 7.3% |
| 35 to 44 Years | 58 | 19.3% |
| 45 to 54 Years | 4 | 1.3% |
| 55 to 64 Years | 83 | 27.7% |
| 65 to 74 Years | 112 | 37.3% |
| 75 to 84 Years | 21 | 7.0% |
| 85 Years and Over | 0 | 0.0% |
| Total | 300 | 100.0% |
Housing Finances in Valley City
Median Income by Occupancy in Valley City
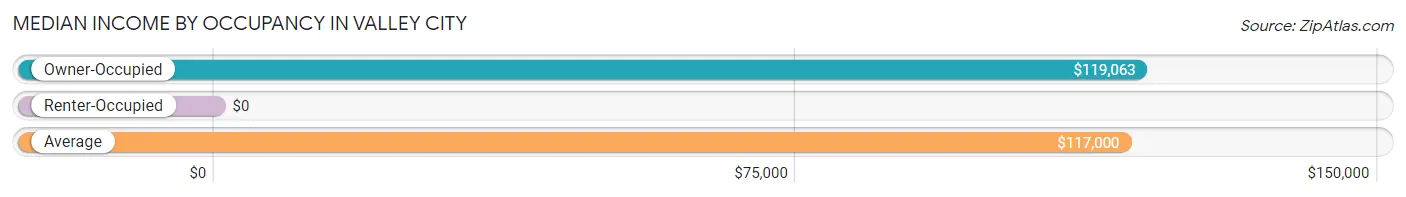
| Occupancy Type | # Households | Median Income |
| Owner-Occupied | 287 (95.7%) | $119,063 |
| Renter-Occupied | 13 (4.3%) | $0 |
| Average | 300 (100.0%) | $117,000 |
Occupancy by Householder Income Bracket in Valley City
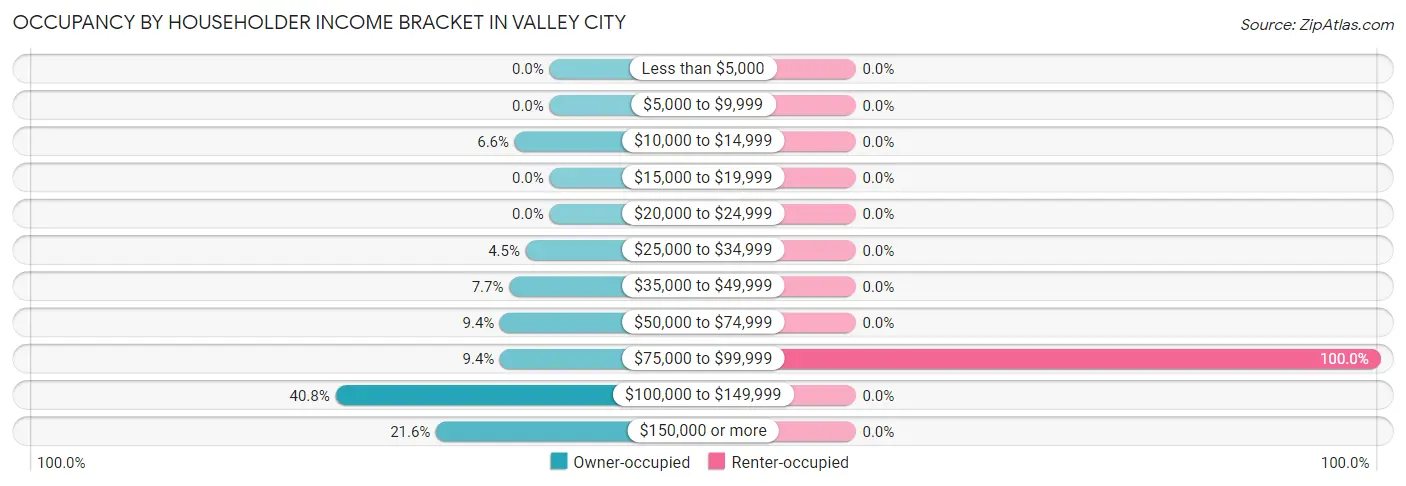
| Income Bracket | Owner-occupied | Renter-occupied |
| Less than $5,000 | 0 (0.0%) | 0 (0.0%) |
| $5,000 to $9,999 | 0 (0.0%) | 0 (0.0%) |
| $10,000 to $14,999 | 19 (6.6%) | 0 (0.0%) |
| $15,000 to $19,999 | 0 (0.0%) | 0 (0.0%) |
| $20,000 to $24,999 | 0 (0.0%) | 0 (0.0%) |
| $25,000 to $34,999 | 13 (4.5%) | 0 (0.0%) |
| $35,000 to $49,999 | 22 (7.7%) | 0 (0.0%) |
| $50,000 to $74,999 | 27 (9.4%) | 0 (0.0%) |
| $75,000 to $99,999 | 27 (9.4%) | 13 (100.0%) |
| $100,000 to $149,999 | 117 (40.8%) | 0 (0.0%) |
| $150,000 or more | 62 (21.6%) | 0 (0.0%) |
| Total | 287 (100.0%) | 13 (100.0%) |
Monthly Housing Cost Tiers in Valley City
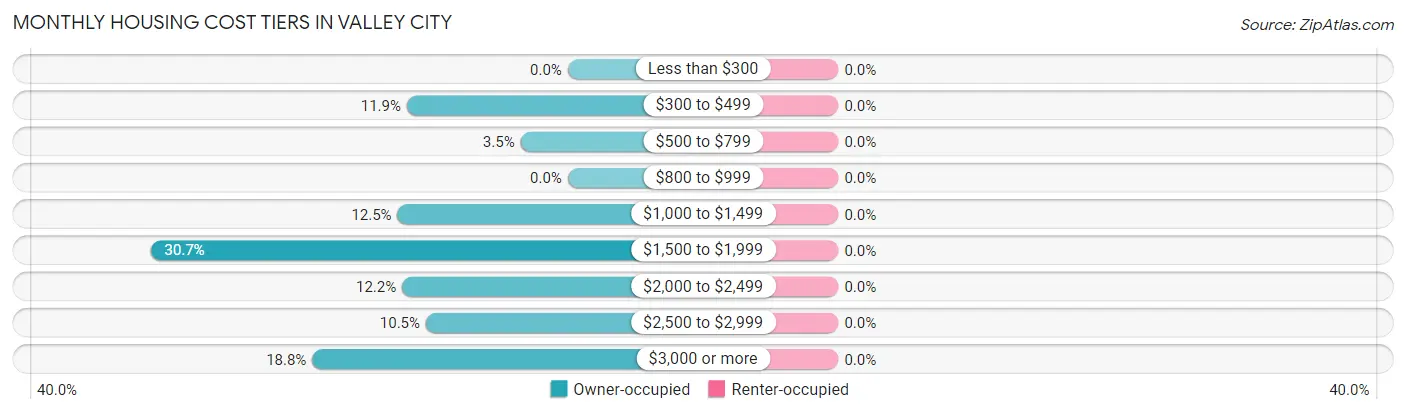
| Monthly Cost | Owner-occupied | Renter-occupied |
| Less than $300 | 0 (0.0%) | 0 (0.0%) |
| $300 to $499 | 34 (11.8%) | 0 (0.0%) |
| $500 to $799 | 10 (3.5%) | 0 (0.0%) |
| $800 to $999 | 0 (0.0%) | 0 (0.0%) |
| $1,000 to $1,499 | 36 (12.5%) | 0 (0.0%) |
| $1,500 to $1,999 | 88 (30.7%) | 0 (0.0%) |
| $2,000 to $2,499 | 35 (12.2%) | 0 (0.0%) |
| $2,500 to $2,999 | 30 (10.4%) | 0 (0.0%) |
| $3,000 or more | 54 (18.8%) | 0 (0.0%) |
| Total | 287 (100.0%) | 13 (100.0%) |
Physical Housing Characteristics in Valley City
Housing Structures in Valley City
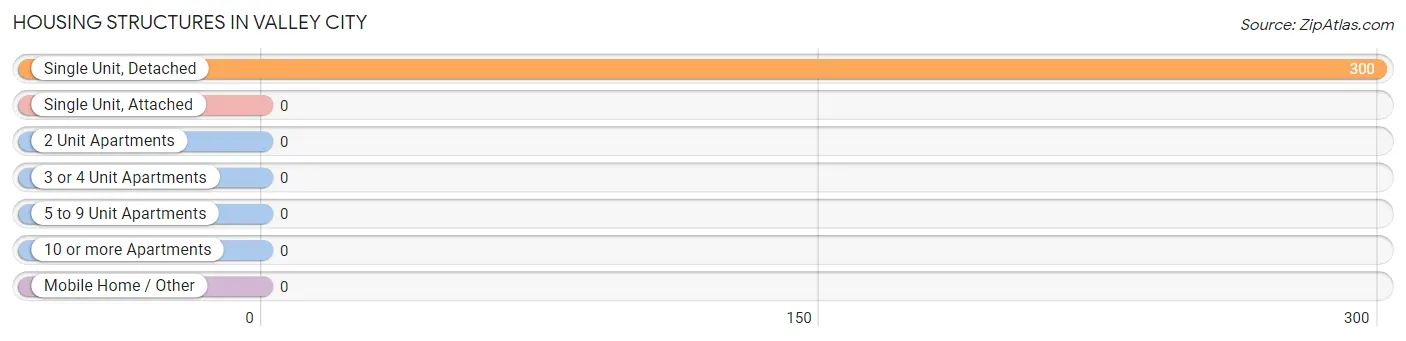
| Structure Type | # Housing Units | % Housing Units |
| Single Unit, Detached | 300 | 100.0% |
| Single Unit, Attached | 0 | 0.0% |
| 2 Unit Apartments | 0 | 0.0% |
| 3 or 4 Unit Apartments | 0 | 0.0% |
| 5 to 9 Unit Apartments | 0 | 0.0% |
| 10 or more Apartments | 0 | 0.0% |
| Mobile Home / Other | 0 | 0.0% |
| Total | 300 | 100.0% |
Housing Structures by Occupancy in Valley City
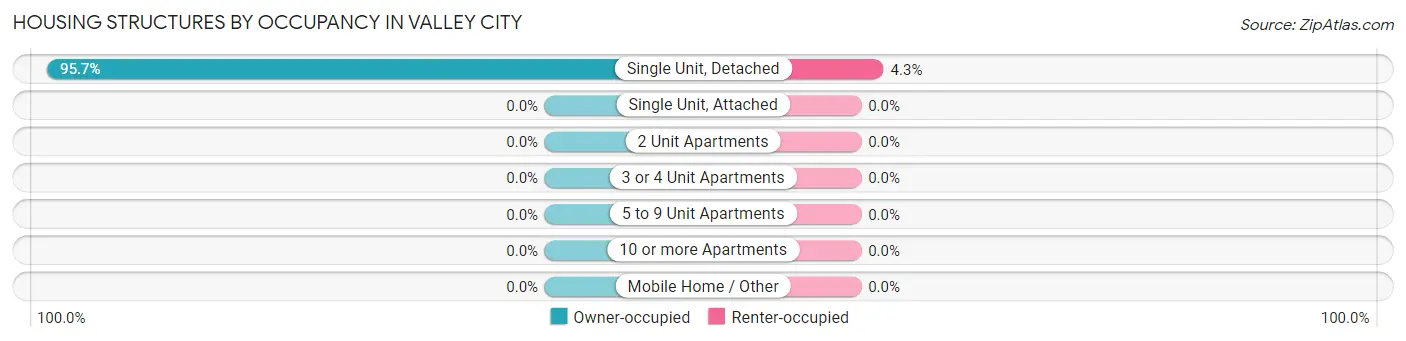
| Structure Type | Owner-occupied | Renter-occupied |
| Single Unit, Detached | 287 (95.7%) | 13 (4.3%) |
| Single Unit, Attached | 0 (0.0%) | 0 (0.0%) |
| 2 Unit Apartments | 0 (0.0%) | 0 (0.0%) |
| 3 or 4 Unit Apartments | 0 (0.0%) | 0 (0.0%) |
| 5 to 9 Unit Apartments | 0 (0.0%) | 0 (0.0%) |
| 10 or more Apartments | 0 (0.0%) | 0 (0.0%) |
| Mobile Home / Other | 0 (0.0%) | 0 (0.0%) |
| Total | 287 (95.7%) | 13 (4.3%) |
Housing Structures by Number of Rooms in Valley City
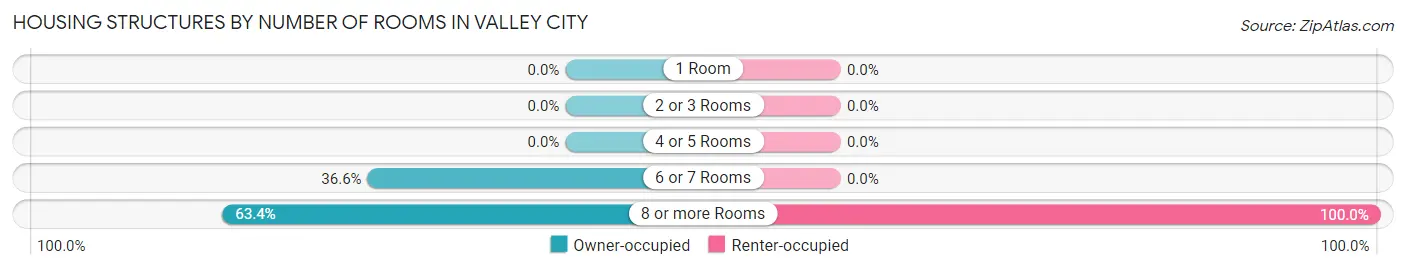
| Number of Rooms | Owner-occupied | Renter-occupied |
| 1 Room | 0 (0.0%) | 0 (0.0%) |
| 2 or 3 Rooms | 0 (0.0%) | 0 (0.0%) |
| 4 or 5 Rooms | 0 (0.0%) | 0 (0.0%) |
| 6 or 7 Rooms | 105 (36.6%) | 0 (0.0%) |
| 8 or more Rooms | 182 (63.4%) | 13 (100.0%) |
| Total | 287 (100.0%) | 13 (100.0%) |
Housing Structure by Heating Type in Valley City
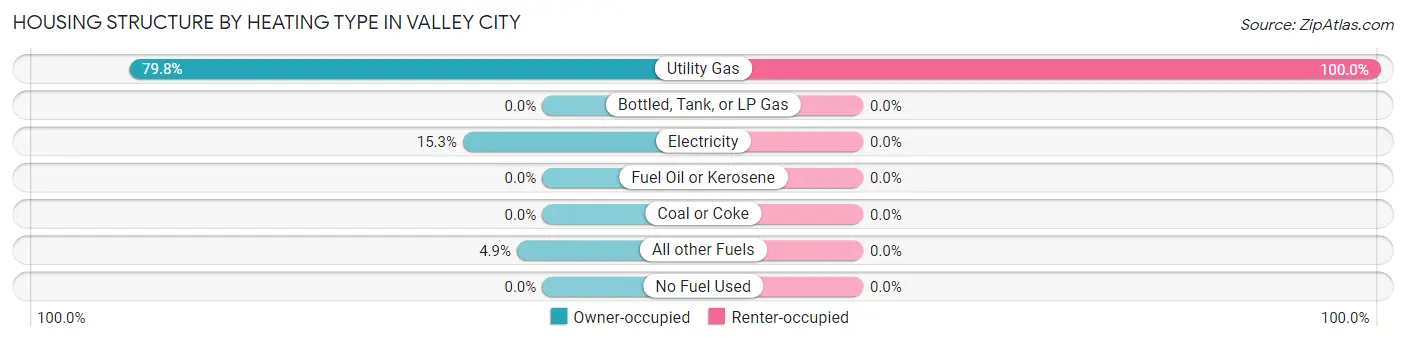
| Heating Type | Owner-occupied | Renter-occupied |
| Utility Gas | 229 (79.8%) | 13 (100.0%) |
| Bottled, Tank, or LP Gas | 0 (0.0%) | 0 (0.0%) |
| Electricity | 44 (15.3%) | 0 (0.0%) |
| Fuel Oil or Kerosene | 0 (0.0%) | 0 (0.0%) |
| Coal or Coke | 0 (0.0%) | 0 (0.0%) |
| All other Fuels | 14 (4.9%) | 0 (0.0%) |
| No Fuel Used | 0 (0.0%) | 0 (0.0%) |
| Total | 287 (100.0%) | 13 (100.0%) |
Household Vehicle Usage in Valley City
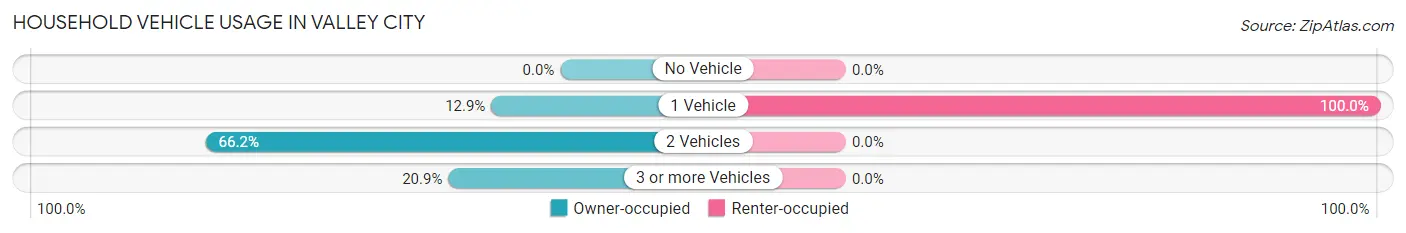
| Vehicles per Household | Owner-occupied | Renter-occupied |
| No Vehicle | 0 (0.0%) | 0 (0.0%) |
| 1 Vehicle | 37 (12.9%) | 13 (100.0%) |
| 2 Vehicles | 190 (66.2%) | 0 (0.0%) |
| 3 or more Vehicles | 60 (20.9%) | 0 (0.0%) |
| Total | 287 (100.0%) | 13 (100.0%) |
Real Estate & Mortgages in Valley City
Real Estate and Mortgage Overview in Valley City
| Characteristic | Without Mortgage | With Mortgage |
| Housing Units | 44 | 243 |
| Median Property Value | $184,200 | $437,900 |
| Median Household Income | - | - |
| Monthly Housing Costs | $443 | $54 |
| Real Estate Taxes | $3,368 | $0 |
Property Value by Mortgage Status in Valley City
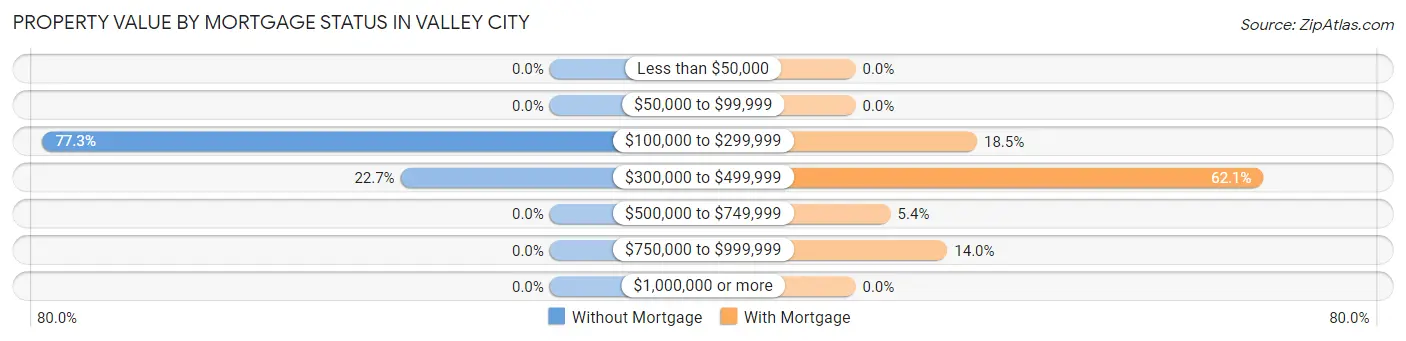
| Property Value | Without Mortgage | With Mortgage |
| Less than $50,000 | 0 (0.0%) | 0 (0.0%) |
| $50,000 to $99,999 | 0 (0.0%) | 0 (0.0%) |
| $100,000 to $299,999 | 34 (77.3%) | 45 (18.5%) |
| $300,000 to $499,999 | 10 (22.7%) | 151 (62.1%) |
| $500,000 to $749,999 | 0 (0.0%) | 13 (5.3%) |
| $750,000 to $999,999 | 0 (0.0%) | 34 (14.0%) |
| $1,000,000 or more | 0 (0.0%) | 0 (0.0%) |
| Total | 44 (100.0%) | 243 (100.0%) |
Household Income by Mortgage Status in Valley City
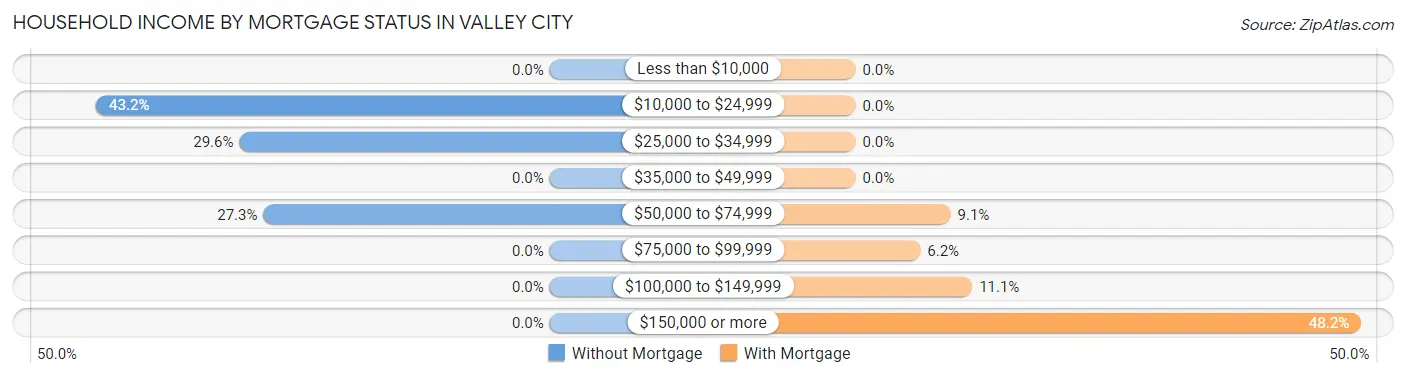
| Household Income | Without Mortgage | With Mortgage |
| Less than $10,000 | 0 (0.0%) | 0 (0.0%) |
| $10,000 to $24,999 | 19 (43.2%) | 0 (0.0%) |
| $25,000 to $34,999 | 13 (29.5%) | 0 (0.0%) |
| $35,000 to $49,999 | 0 (0.0%) | 0 (0.0%) |
| $50,000 to $74,999 | 12 (27.3%) | 22 (9.0%) |
| $75,000 to $99,999 | 0 (0.0%) | 15 (6.2%) |
| $100,000 to $149,999 | 0 (0.0%) | 27 (11.1%) |
| $150,000 or more | 0 (0.0%) | 117 (48.1%) |
| Total | 44 (100.0%) | 243 (100.0%) |
Property Value to Household Income Ratio in Valley City
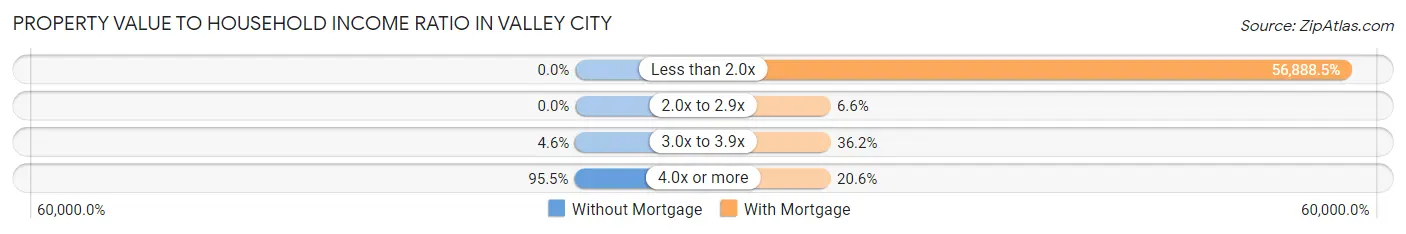
| Value-to-Income Ratio | Without Mortgage | With Mortgage |
| Less than 2.0x | 0 (0.0%) | 138,239 (56,888.5%) |
| 2.0x to 2.9x | 0 (0.0%) | 16 (6.6%) |
| 3.0x to 3.9x | 2 (4.5%) | 88 (36.2%) |
| 4.0x or more | 42 (95.5%) | 50 (20.6%) |
| Total | 44 (100.0%) | 243 (100.0%) |
Real Estate Taxes by Mortgage Status in Valley City
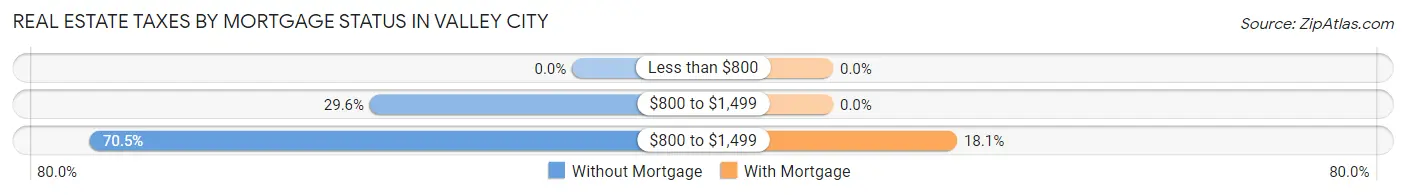
| Property Taxes | Without Mortgage | With Mortgage |
| Less than $800 | 0 (0.0%) | 0 (0.0%) |
| $800 to $1,499 | 13 (29.5%) | 0 (0.0%) |
| $800 to $1,499 | 31 (70.5%) | 44 (18.1%) |
| Total | 44 (100.0%) | 243 (100.0%) |
Health & Disability in Valley City
Health Insurance Coverage by Age in Valley City
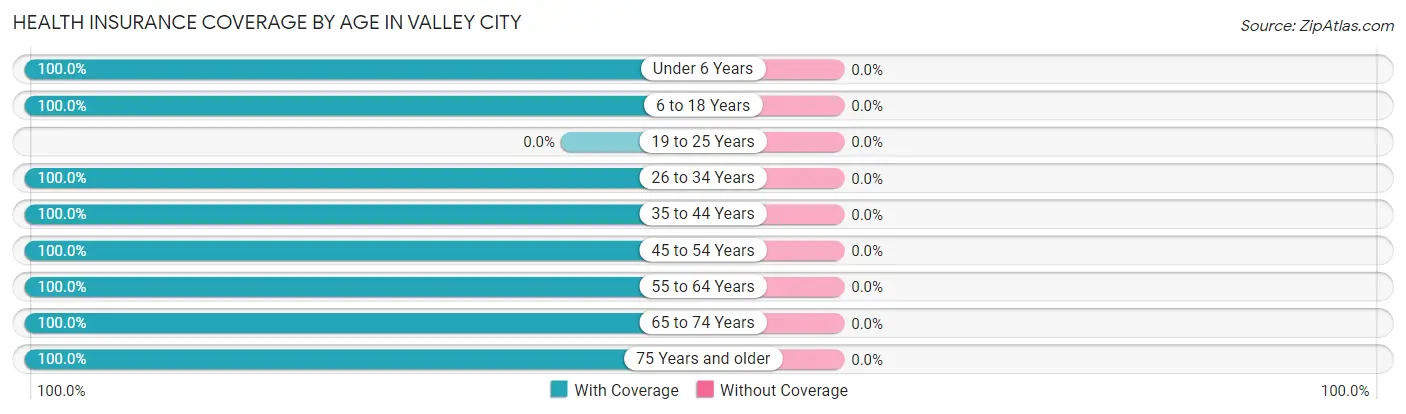
| Age Bracket | With Coverage | Without Coverage |
| Under 6 Years | 43 (100.0%) | 0 (0.0%) |
| 6 to 18 Years | 68 (100.0%) | 0 (0.0%) |
| 19 to 25 Years | 0 (0.0%) | 0 (0.0%) |
| 26 to 34 Years | 42 (100.0%) | 0 (0.0%) |
| 35 to 44 Years | 127 (100.0%) | 0 (0.0%) |
| 45 to 54 Years | 20 (100.0%) | 0 (0.0%) |
| 55 to 64 Years | 152 (100.0%) | 0 (0.0%) |
| 65 to 74 Years | 158 (100.0%) | 0 (0.0%) |
| 75 Years and older | 67 (100.0%) | 0 (0.0%) |
| Total | 677 (100.0%) | 0 (0.0%) |
Health Insurance Coverage by Citizenship Status in Valley City
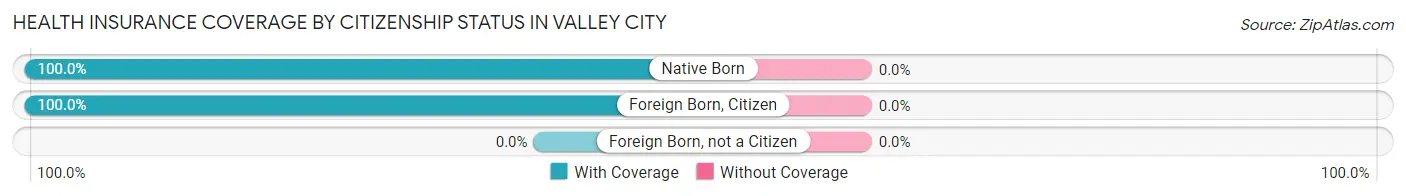
| Citizenship Status | With Coverage | Without Coverage |
| Native Born | 43 (100.0%) | 0 (0.0%) |
| Foreign Born, Citizen | 68 (100.0%) | 0 (0.0%) |
| Foreign Born, not a Citizen | 0 (0.0%) | 0 (0.0%) |
Health Insurance Coverage by Household Income in Valley City
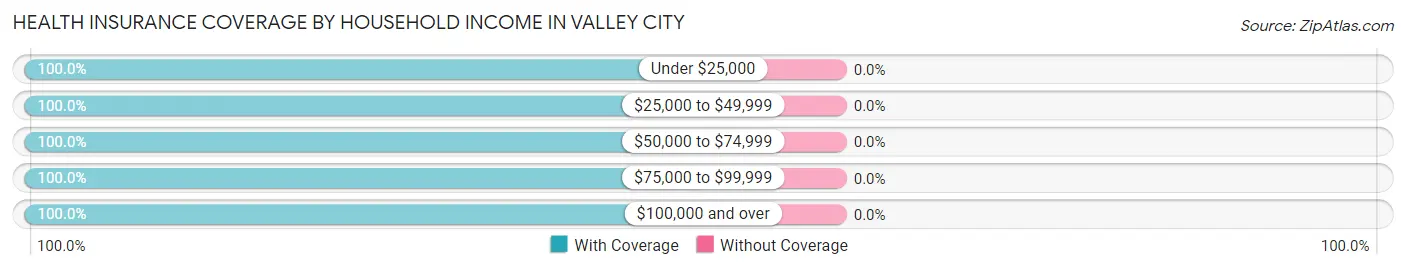
| Household Income | With Coverage | Without Coverage |
| Under $25,000 | 36 (100.0%) | 0 (0.0%) |
| $25,000 to $49,999 | 35 (100.0%) | 0 (0.0%) |
| $50,000 to $74,999 | 95 (100.0%) | 0 (0.0%) |
| $75,000 to $99,999 | 65 (100.0%) | 0 (0.0%) |
| $100,000 and over | 446 (100.0%) | 0 (0.0%) |
Public vs Private Health Insurance Coverage by Age in Valley City
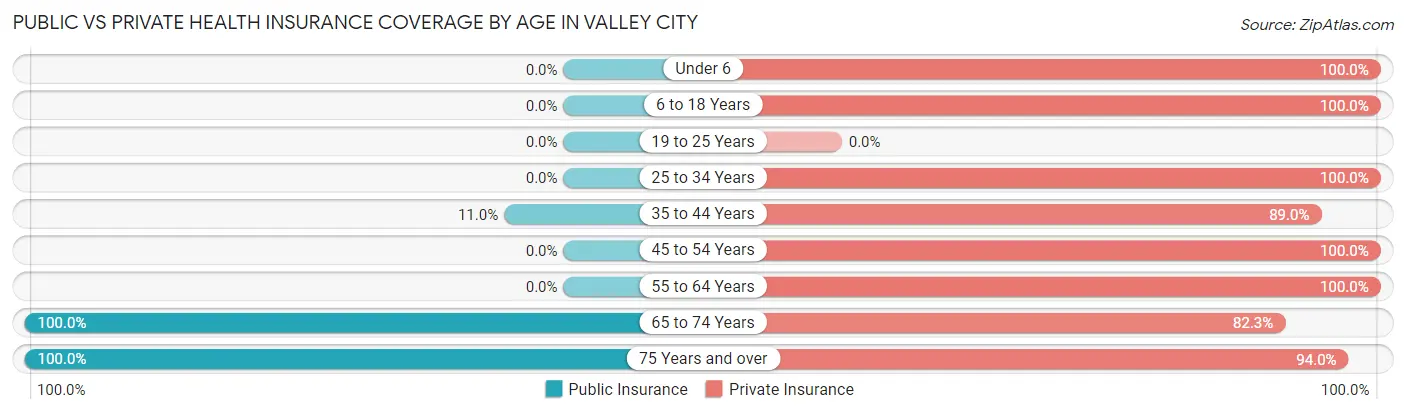
| Age Bracket | Public Insurance | Private Insurance |
| Under 6 | 0 (0.0%) | 43 (100.0%) |
| 6 to 18 Years | 0 (0.0%) | 68 (100.0%) |
| 19 to 25 Years | 0 (0.0%) | 0 (0.0%) |
| 25 to 34 Years | 0 (0.0%) | 42 (100.0%) |
| 35 to 44 Years | 14 (11.0%) | 113 (89.0%) |
| 45 to 54 Years | 0 (0.0%) | 20 (100.0%) |
| 55 to 64 Years | 0 (0.0%) | 152 (100.0%) |
| 65 to 74 Years | 158 (100.0%) | 130 (82.3%) |
| 75 Years and over | 67 (100.0%) | 63 (94.0%) |
| Total | 239 (35.3%) | 631 (93.2%) |
Disability Status by Sex by Age in Valley City
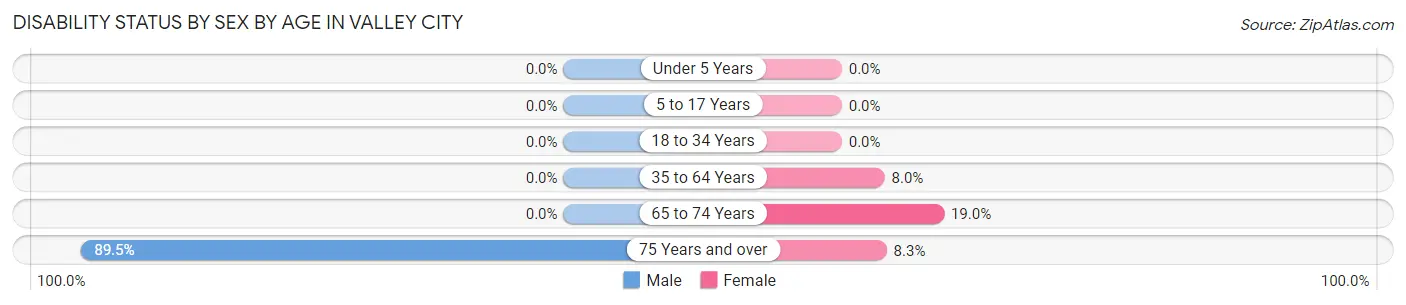
| Age Bracket | Male | Female |
| Under 5 Years | 0 (0.0%) | 0 (0.0%) |
| 5 to 17 Years | 0 (0.0%) | 0 (0.0%) |
| 18 to 34 Years | 0 (0.0%) | 0 (0.0%) |
| 35 to 64 Years | 0 (0.0%) | 14 (8.0%) |
| 65 to 74 Years | 0 (0.0%) | 11 (19.0%) |
| 75 Years and over | 17 (89.5%) | 4 (8.3%) |
Disability Class by Sex by Age in Valley City
Disability Class: Hearing Difficulty
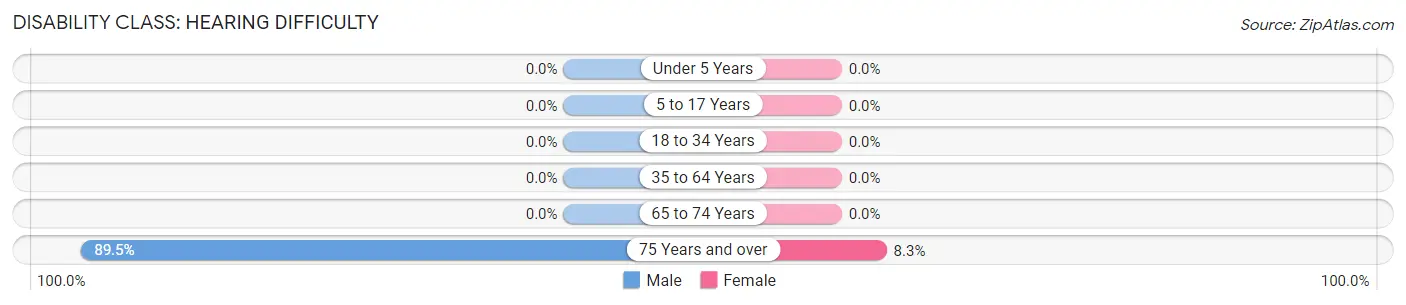
| Age Bracket | Male | Female |
| Under 5 Years | 0 (0.0%) | 0 (0.0%) |
| 5 to 17 Years | 0 (0.0%) | 0 (0.0%) |
| 18 to 34 Years | 0 (0.0%) | 0 (0.0%) |
| 35 to 64 Years | 0 (0.0%) | 0 (0.0%) |
| 65 to 74 Years | 0 (0.0%) | 0 (0.0%) |
| 75 Years and over | 17 (89.5%) | 4 (8.3%) |
Disability Class: Vision Difficulty
| Age Bracket | Male | Female |
| Under 5 Years | 0 (0.0%) | 0 (0.0%) |
| 5 to 17 Years | 0 (0.0%) | 0 (0.0%) |
| 18 to 34 Years | 0 (0.0%) | 0 (0.0%) |
| 35 to 64 Years | 0 (0.0%) | 0 (0.0%) |
| 65 to 74 Years | 0 (0.0%) | 0 (0.0%) |
| 75 Years and over | 0 (0.0%) | 0 (0.0%) |
Disability Class: Cognitive Difficulty

| Age Bracket | Male | Female |
| 5 to 17 Years | 0 (0.0%) | 0 (0.0%) |
| 18 to 34 Years | 0 (0.0%) | 0 (0.0%) |
| 35 to 64 Years | 0 (0.0%) | 14 (8.0%) |
| 65 to 74 Years | 0 (0.0%) | 11 (19.0%) |
| 75 Years and over | 17 (89.5%) | 0 (0.0%) |
Disability Class: Ambulatory Difficulty
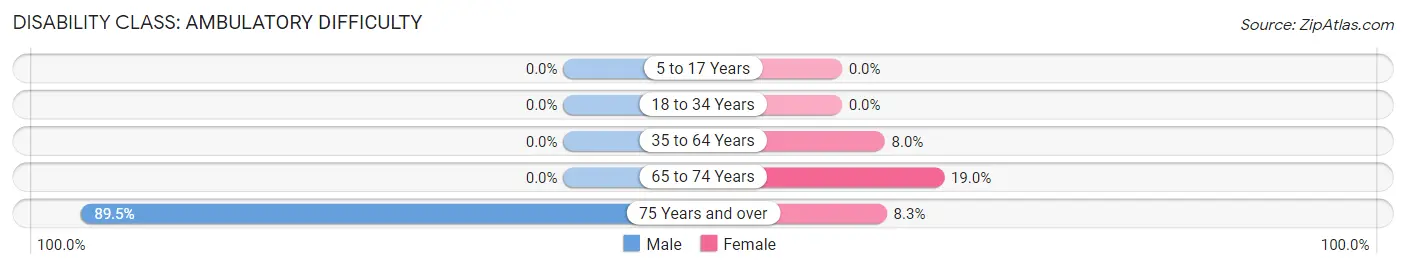
| Age Bracket | Male | Female |
| 5 to 17 Years | 0 (0.0%) | 0 (0.0%) |
| 18 to 34 Years | 0 (0.0%) | 0 (0.0%) |
| 35 to 64 Years | 0 (0.0%) | 14 (8.0%) |
| 65 to 74 Years | 0 (0.0%) | 11 (19.0%) |
| 75 Years and over | 17 (89.5%) | 4 (8.3%) |
Disability Class: Self-Care Difficulty
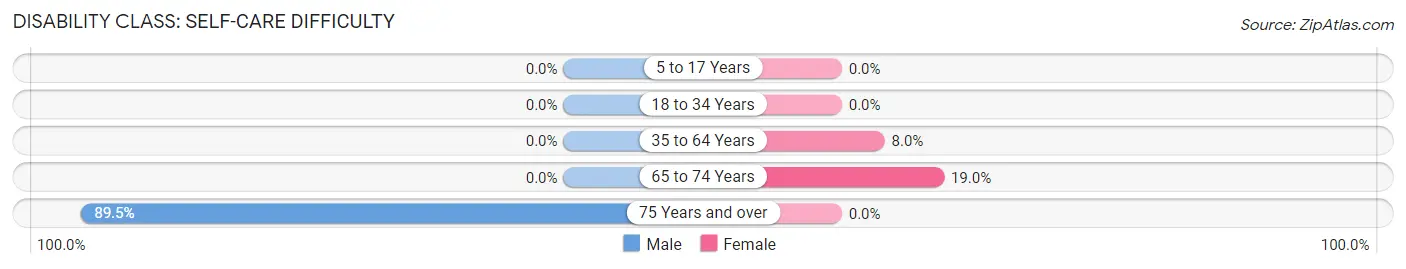
| Age Bracket | Male | Female |
| 5 to 17 Years | 0 (0.0%) | 0 (0.0%) |
| 18 to 34 Years | 0 (0.0%) | 0 (0.0%) |
| 35 to 64 Years | 0 (0.0%) | 14 (8.0%) |
| 65 to 74 Years | 0 (0.0%) | 11 (19.0%) |
| 75 Years and over | 17 (89.5%) | 0 (0.0%) |
Technology Access in Valley City
Computing Device Access in Valley City
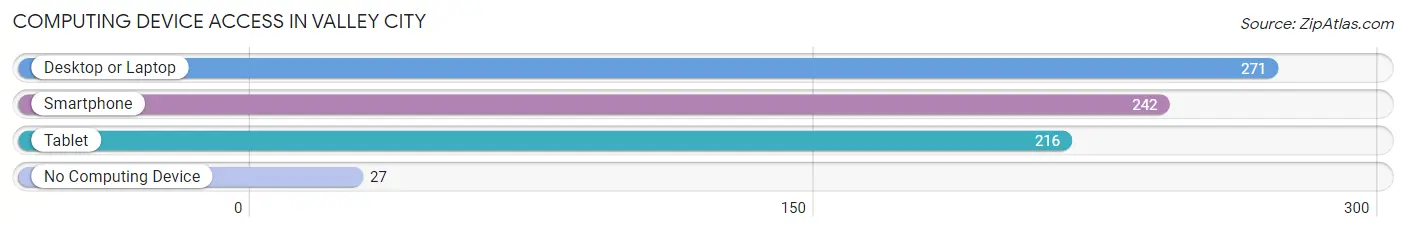
| Device Type | # Households | % Households |
| Desktop or Laptop | 271 | 90.3% |
| Smartphone | 242 | 80.7% |
| Tablet | 216 | 72.0% |
| No Computing Device | 27 | 9.0% |
| Total | 300 | 100.0% |
Internet Access in Valley City

| Internet Type | # Households | % Households |
| Dial-Up Internet | 0 | 0.0% |
| Broadband Home | 273 | 91.0% |
| Cellular Data Only | 0 | 0.0% |
| Satellite Internet | 22 | 7.3% |
| No Internet | 27 | 9.0% |
| Total | 300 | 100.0% |
Valley City Summary
Valley City, Ohio is a small village located in Medina County, Ohio. It is situated in the northeast corner of the county, approximately 25 miles south of Cleveland. The village has a population of approximately 1,500 people and is part of the larger Brunswick-Medina-Valley City Metropolitan Statistical Area.
History
Valley City was founded in 1818 by a group of settlers from Connecticut. The village was originally known as “Valley” and was later changed to “Valley City” in 1837. The village was incorporated in 1867 and has remained a small, rural community ever since.
The village was originally a farming community, but in the late 19th century, the railroad came to Valley City and the village began to grow. The railroad brought new businesses and industries to the area, including a brickyard, a sawmill, and a flour mill. The village also became a popular tourist destination, as it was located near the Cuyahoga Valley National Park.
Geography
Valley City is located in the northeast corner of Medina County, Ohio. It is situated on the banks of the Cuyahoga River, which flows through the village. The village is surrounded by rolling hills and farmland, and is located approximately 25 miles south of Cleveland.
The village has a total area of 1.2 square miles, all of which is land. The village is located at an elevation of 890 feet above sea level.
Economy
Valley City is a small, rural community with a population of approximately 1,500 people. The village is primarily a bedroom community, with most of its residents commuting to nearby cities for work.
The village does have a few businesses, including a grocery store, a hardware store, and a few restaurants. The village also has a few small manufacturing companies, including a plastics manufacturer and a metal fabrication company.
Demographics
As of the 2010 census, Valley City had a population of 1,521 people. The racial makeup of the village was 97.3% White, 0.7% African American, 0.2% Native American, 0.3% Asian, 0.1% Pacific Islander, 0.3% from other races, and 1.2% from two or more races. Hispanic or Latino of any race were 1.2% of the population.
The median household income in Valley City was $50,938, and the median family income was $60,000. The per capita income for the village was $22,845. About 5.3% of families and 6.7% of the population were below the poverty line, including 8.3% of those under age 18 and 4.2% of those age 65 or over.
Common Questions
What is Per Capita Income in Valley City?
Per Capita income in Valley City is $49,093.
What is the Median Family Income in Valley City?
Median Family Income in Valley City is $134,643.
What is the Median Household income in Valley City?
Median Household Income in Valley City is $117,000.
What is Income or Wage Gap in Valley City?
Income or Wage Gap in Valley City is 29.6%.
Women in Valley City earn 70.4 cents for every dollar earned by a man.
What is Inequality or Gini Index in Valley City?
Inequality or Gini Index in Valley City is 0.26.
What is the Total Population of Valley City?
Total Population of Valley City is 677.
What is the Total Male Population of Valley City?
Total Male Population of Valley City is 284.
What is the Total Female Population of Valley City?
Total Female Population of Valley City is 393.
What is the Ratio of Males per 100 Females in Valley City?
There are 72.26 Males per 100 Females in Valley City.
What is the Ratio of Females per 100 Males in Valley City?
There are 138.38 Females per 100 Males in Valley City.
What is the Median Population Age in Valley City?
Median Population Age in Valley City is 55.9 Years.
What is the Average Family Size in Valley City
Average Family Size in Valley City is 2.8 People.
What is the Average Household Size in Valley City
Average Household Size in Valley City is 2.3 People.
How Large is the Labor Force in Valley City?
There are 339 People in the Labor Forcein in Valley City.
What is the Percentage of People in the Labor Force in Valley City?
59.9% of People are in the Labor Force in Valley City.