Edie, PA Map & Demographics
Edie Map
Edie Overview
$30,005
PER CAPITA INCOME
$63,438
AVG FAMILY INCOME
$63,438
AVG HOUSEHOLD INCOME
39.7%
WAGE / INCOME GAP [ % ]
60.3¢/ $1
WAGE / INCOME GAP [ $ ]
0.30
INEQUALITY / GINI INDEX
87
TOTAL POPULATION
40
MALE POPULATION
47
FEMALE POPULATION
85.11
MALES / 100 FEMALES
117.50
FEMALES / 100 MALES
58.3
MEDIAN AGE
2.5
AVG FAMILY SIZE
2.4
AVG HOUSEHOLD SIZE
37
LABOR FORCE [ PEOPLE ]
52.1%
PERCENT IN LABOR FORCE
Income in Edie
Income Overview in Edie
Per Capita Income in Edie is $30,005, while median incomes of families and households are $63,438 and $63,438 respectively.
| Characteristic | Number | Measure |
| Per Capita Income | 87 | $30,005 |
| Median Family Income | 33 | $63,438 |
| Mean Family Income | 33 | $70,052 |
| Median Household Income | 37 | $63,438 |
| Mean Household Income | 37 | $68,676 |
| Income Deficit | 33 | $0 |
| Wage / Income Gap (%) | 87 | 39.72% |
| Wage / Income Gap ($) | 87 | 60.28¢ per $1 |
| Gini / Inequality Index | 87 | 0.30 |
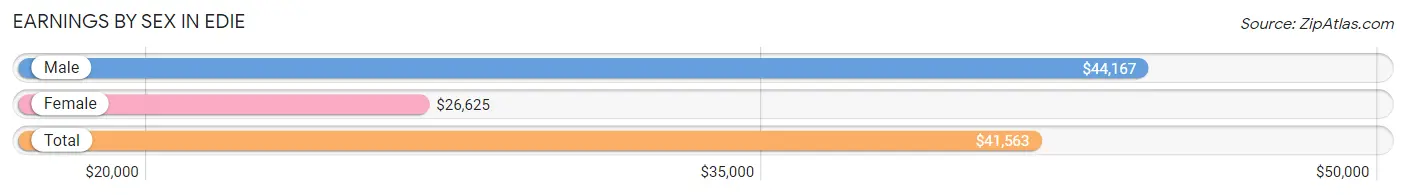
Earnings by Sex in Edie
Average Earnings in Edie are $41,563, $44,167 for men and $26,625 for women, a difference of 39.7%.
| Sex | Number | Average Earnings |
| Male | 24 (64.9%) | $44,167 |
| Female | 13 (35.1%) | $26,625 |
| Total | 37 (100.0%) | $41,563 |
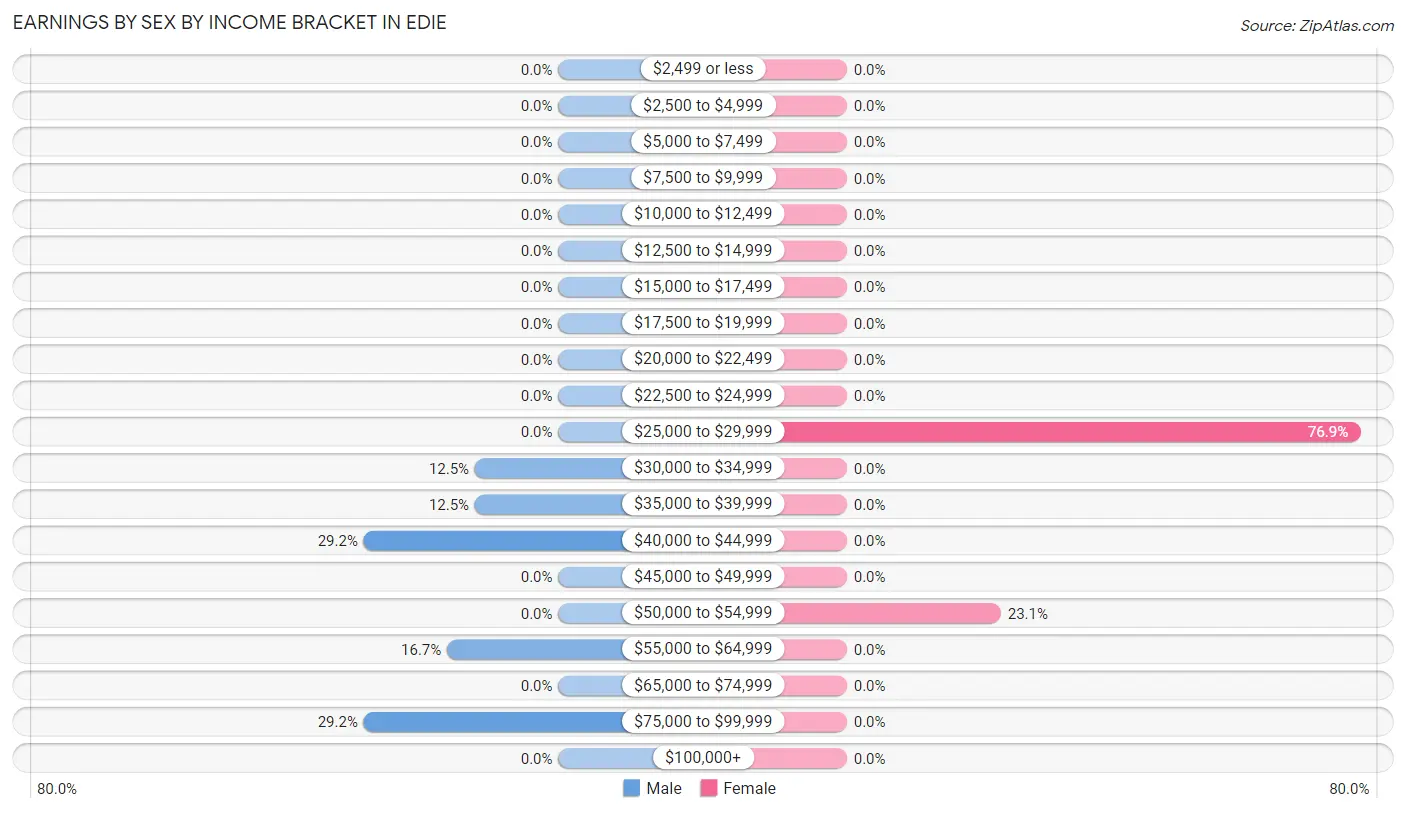
Earnings by Sex by Income Bracket in Edie
The most common earnings brackets in Edie are $40,000 to $44,999 for men (7 | 29.2%) and $25,000 to $29,999 for women (10 | 76.9%).
| Income | Male | Female |
| $2,499 or less | 0 (0.0%) | 0 (0.0%) |
| $2,500 to $4,999 | 0 (0.0%) | 0 (0.0%) |
| $5,000 to $7,499 | 0 (0.0%) | 0 (0.0%) |
| $7,500 to $9,999 | 0 (0.0%) | 0 (0.0%) |
| $10,000 to $12,499 | 0 (0.0%) | 0 (0.0%) |
| $12,500 to $14,999 | 0 (0.0%) | 0 (0.0%) |
| $15,000 to $17,499 | 0 (0.0%) | 0 (0.0%) |
| $17,500 to $19,999 | 0 (0.0%) | 0 (0.0%) |
| $20,000 to $22,499 | 0 (0.0%) | 0 (0.0%) |
| $22,500 to $24,999 | 0 (0.0%) | 0 (0.0%) |
| $25,000 to $29,999 | 0 (0.0%) | 10 (76.9%) |
| $30,000 to $34,999 | 3 (12.5%) | 0 (0.0%) |
| $35,000 to $39,999 | 3 (12.5%) | 0 (0.0%) |
| $40,000 to $44,999 | 7 (29.2%) | 0 (0.0%) |
| $45,000 to $49,999 | 0 (0.0%) | 0 (0.0%) |
| $50,000 to $54,999 | 0 (0.0%) | 3 (23.1%) |
| $55,000 to $64,999 | 4 (16.7%) | 0 (0.0%) |
| $65,000 to $74,999 | 0 (0.0%) | 0 (0.0%) |
| $75,000 to $99,999 | 7 (29.2%) | 0 (0.0%) |
| $100,000+ | 0 (0.0%) | 0 (0.0%) |
| Total | 24 (100.0%) | 13 (100.0%) |
Earnings by Sex by Educational Attainment in Edie

| Educational Attainment | Male Income | Female Income |
| Less than High School | - | - |
| High School Diploma | - | - |
| College or Associate's Degree | - | - |
| Bachelor's Degree | - | - |
| Graduate Degree | - | - |
| Total | $44,167 | $0 |
Family Income in Edie
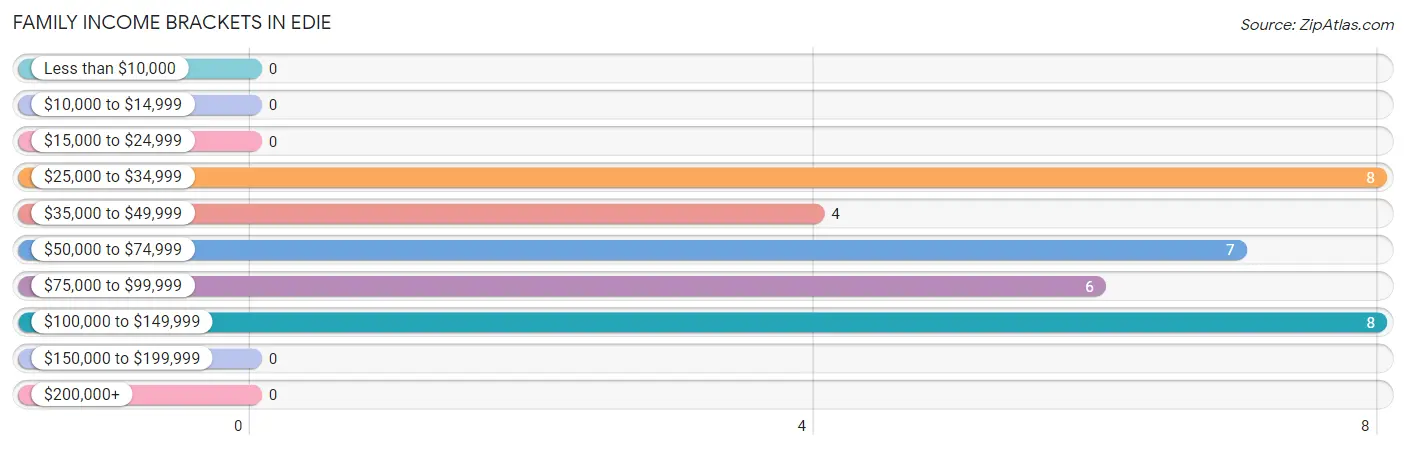
Family Income Brackets in Edie
According to the Edie family income data, there are 8 families falling into the $25,000 to $34,999 income range, which is the most common income bracket and makes up 24.2% of all families.
| Income Bracket | # Families | % Families |
| Less than $10,000 | 0 | 0.0% |
| $10,000 to $14,999 | 0 | 0.0% |
| $15,000 to $24,999 | 0 | 0.0% |
| $25,000 to $34,999 | 8 | 24.2% |
| $35,000 to $49,999 | 4 | 12.1% |
| $50,000 to $74,999 | 7 | 21.2% |
| $75,000 to $99,999 | 6 | 18.2% |
| $100,000 to $149,999 | 8 | 24.2% |
| $150,000 to $199,999 | 0 | 0.0% |
| $200,000+ | 0 | 0.0% |
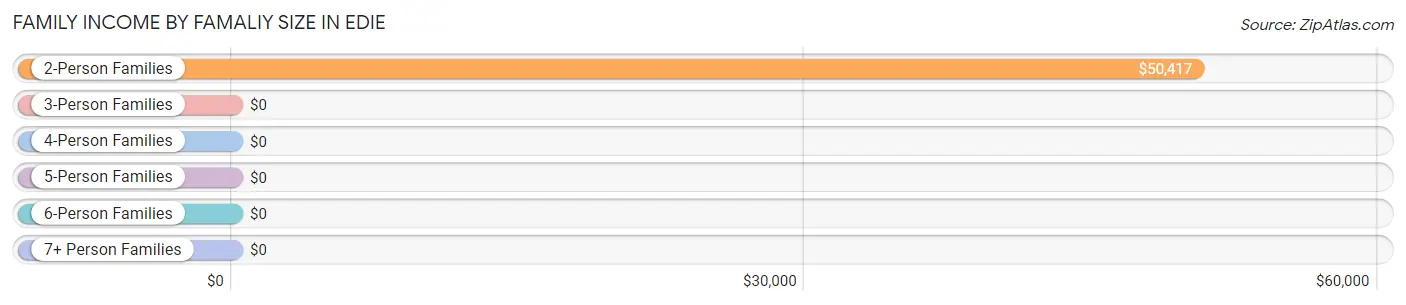
Family Income by Famaliy Size in Edie
2-person families (25 | 75.8%) account for the highest median family income in Edie with $50,417 per family, while 2-person families (25 | 75.8%) have the highest median income of $25,208 per family member.
| Income Bracket | # Families | Median Income |
| 2-Person Families | 25 (75.8%) | $50,417 |
| 3-Person Families | 3 (9.1%) | $0 |
| 4-Person Families | 5 (15.1%) | $0 |
| 5-Person Families | 0 (0.0%) | $0 |
| 6-Person Families | 0 (0.0%) | $0 |
| 7+ Person Families | 0 (0.0%) | $0 |
| Total | 33 (100.0%) | $63,438 |
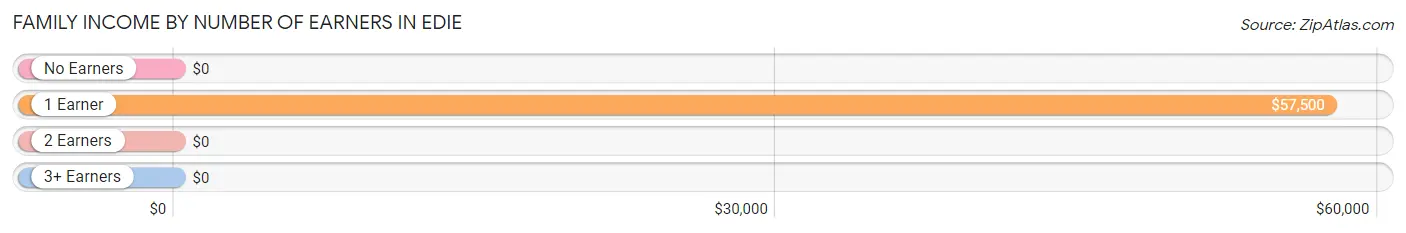
Family Income by Number of Earners in Edie
| Number of Earners | # Families | Median Income |
| No Earners | 11 (33.3%) | $0 |
| 1 Earner | 14 (42.4%) | $57,500 |
| 2 Earners | 5 (15.1%) | $0 |
| 3+ Earners | 3 (9.1%) | $0 |
| Total | 33 (100.0%) | $63,438 |
Household Income in Edie
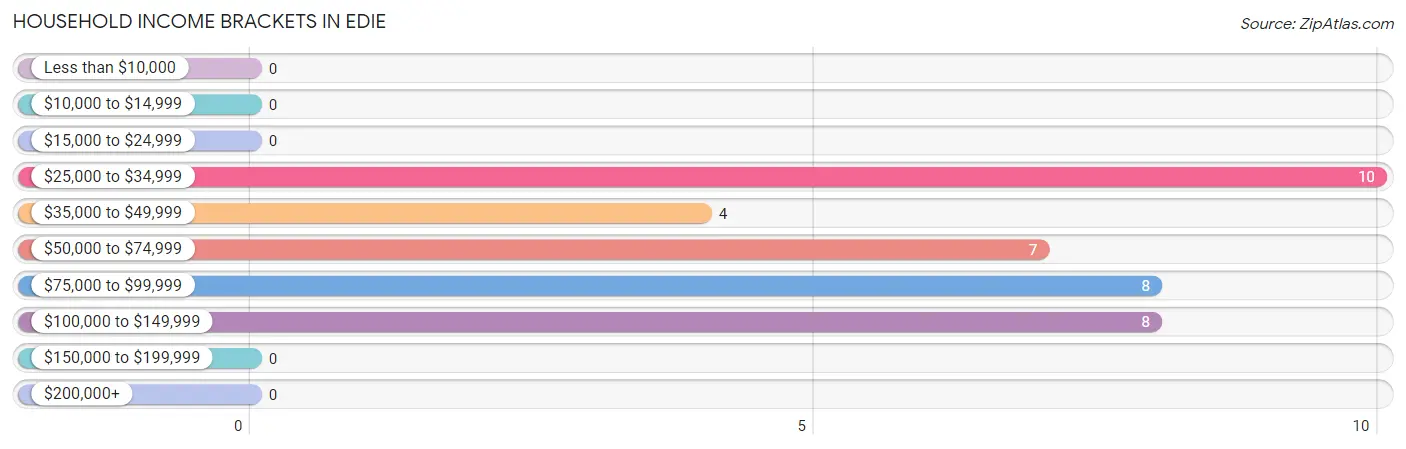
Household Income Brackets in Edie
With 10 households falling in the category, the $25,000 to $34,999 income range is the most frequent in Edie, accounting for 27.0% of all households.
| Income Bracket | # Households | % Households |
| Less than $10,000 | 0 | 0.0% |
| $10,000 to $14,999 | 0 | 0.0% |
| $15,000 to $24,999 | 0 | 0.0% |
| $25,000 to $34,999 | 10 | 27.0% |
| $35,000 to $49,999 | 4 | 10.8% |
| $50,000 to $74,999 | 7 | 18.9% |
| $75,000 to $99,999 | 8 | 21.6% |
| $100,000 to $149,999 | 8 | 21.6% |
| $150,000 to $199,999 | 0 | 0.0% |
| $200,000+ | 0 | 0.0% |
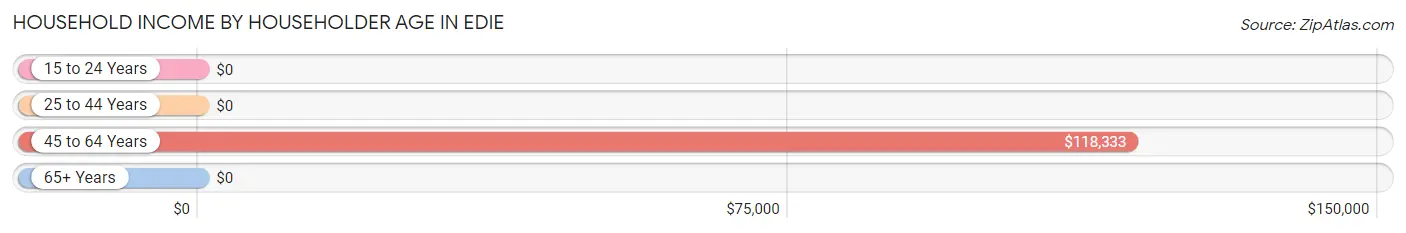
Household Income by Householder Age in Edie
The median household income in Edie is $63,438, with the highest median household income of $118,333 found in the 45 to 64 years age bracket for the primary householder. A total of 14 households (37.8%) fall into this category.
| Income Bracket | # Households | Median Income |
| 15 to 24 Years | 0 (0.0%) | $0 |
| 25 to 44 Years | 4 (10.8%) | $0 |
| 45 to 64 Years | 14 (37.8%) | $118,333 |
| 65+ Years | 19 (51.3%) | $0 |
| Total | 37 (100.0%) | $63,438 |
Poverty in Edie
Income Below Poverty by Sex and Age in Edie
| Age Bracket | Male | Female |
| Under 5 Years | 0 (0.0%) | 0 (0.0%) |
| 5 Years | 0 (0.0%) | 0 (0.0%) |
| 6 to 11 Years | 0 (0.0%) | 0 (0.0%) |
| 12 to 14 Years | 0 (0.0%) | 0 (0.0%) |
| 15 Years | 0 (0.0%) | 0 (0.0%) |
| 16 and 17 Years | 0 (0.0%) | 0 (0.0%) |
| 18 to 24 Years | 0 (0.0%) | 0 (0.0%) |
| 25 to 34 Years | 0 (0.0%) | 0 (0.0%) |
| 35 to 44 Years | 0 (0.0%) | 0 (0.0%) |
| 45 to 54 Years | 0 (0.0%) | 0 (0.0%) |
| 55 to 64 Years | 0 (0.0%) | 0 (0.0%) |
| 65 to 74 Years | 0 (0.0%) | 0 (0.0%) |
| 75 Years and over | 0 (0.0%) | 0 (0.0%) |
| Total | 0 (0.0%) | 0 (0.0%) |
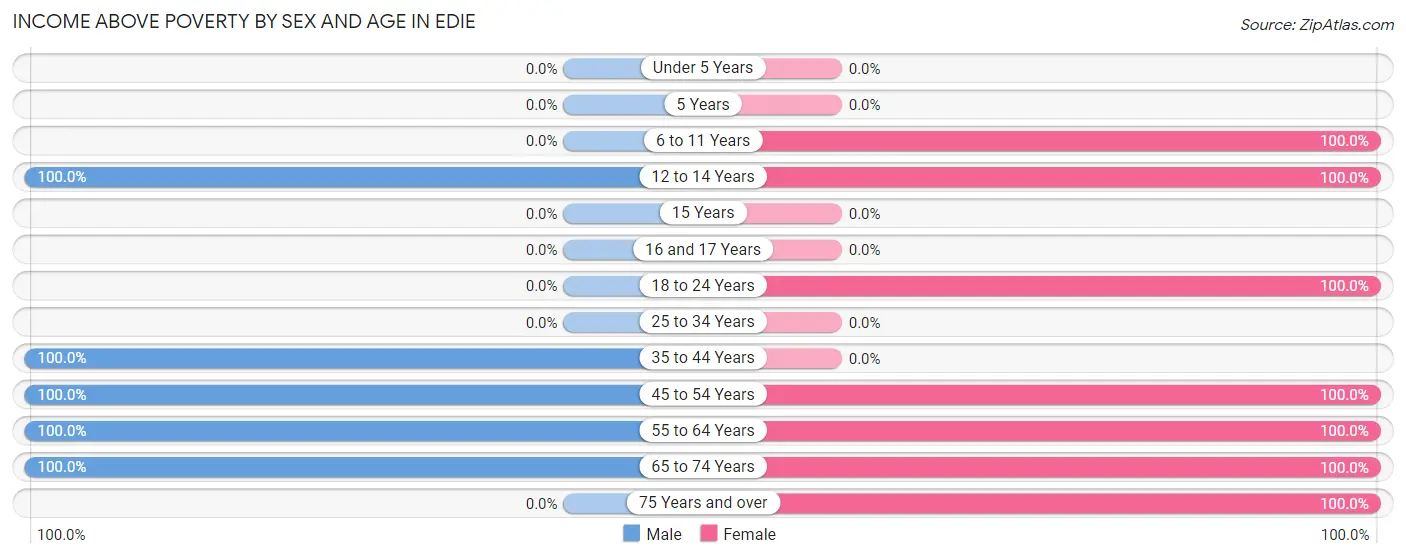
Income Above Poverty by Sex and Age in Edie
According to the poverty statistics in Edie, males aged 12 to 14 years and females aged 6 to 11 years are the age groups that are most secure financially, with 100.0% of males and 100.0% of females in these age groups living above the poverty line.
| Age Bracket | Male | Female |
| Under 5 Years | 0 (0.0%) | 0 (0.0%) |
| 5 Years | 0 (0.0%) | 0 (0.0%) |
| 6 to 11 Years | 0 (0.0%) | 6 (100.0%) |
| 12 to 14 Years | 5 (100.0%) | 5 (100.0%) |
| 15 Years | 0 (0.0%) | 0 (0.0%) |
| 16 and 17 Years | 0 (0.0%) | 0 (0.0%) |
| 18 to 24 Years | 0 (0.0%) | 3 (100.0%) |
| 25 to 34 Years | 0 (0.0%) | 0 (0.0%) |
| 35 to 44 Years | 4 (100.0%) | 0 (0.0%) |
| 45 to 54 Years | 9 (100.0%) | 10 (100.0%) |
| 55 to 64 Years | 8 (100.0%) | 4 (100.0%) |
| 65 to 74 Years | 14 (100.0%) | 14 (100.0%) |
| 75 Years and over | 0 (0.0%) | 5 (100.0%) |
| Total | 40 (100.0%) | 47 (100.0%) |
Income Below Poverty Among Married-Couple Families in Edie
| Children | Above Poverty | Below Poverty |
| No Children | 21 (100.0%) | 0 (0.0%) |
| 1 or 2 Children | 5 (100.0%) | 0 (0.0%) |
| 3 or 4 Children | 0 (0.0%) | 0 (0.0%) |
| 5 or more Children | 0 (0.0%) | 0 (0.0%) |
| Total | 26 (100.0%) | 0 (0.0%) |
Income Below Poverty Among Single-Parent Households in Edie
| Children | Single Father | Single Mother |
| No Children | 0 (0.0%) | 0 (0.0%) |
| 1 or 2 Children | 0 (0.0%) | 0 (0.0%) |
| 3 or 4 Children | 0 (0.0%) | 0 (0.0%) |
| 5 or more Children | 0 (0.0%) | 0 (0.0%) |
| Total | 0 (0.0%) | 0 (0.0%) |
Income Below Poverty Among Married-Couple vs Single-Parent Households in Edie
| Children | Married-Couple Families | Single-Parent Households |
| No Children | 0 (0.0%) | 0 (0.0%) |
| 1 or 2 Children | 0 (0.0%) | 0 (0.0%) |
| 3 or 4 Children | 0 (0.0%) | 0 (0.0%) |
| 5 or more Children | 0 (0.0%) | 0 (0.0%) |
| Total | 0 (0.0%) | 0 (0.0%) |
Race in Edie
The most populous races in Edie are , and White / Caucasian (87 | 100.0%).
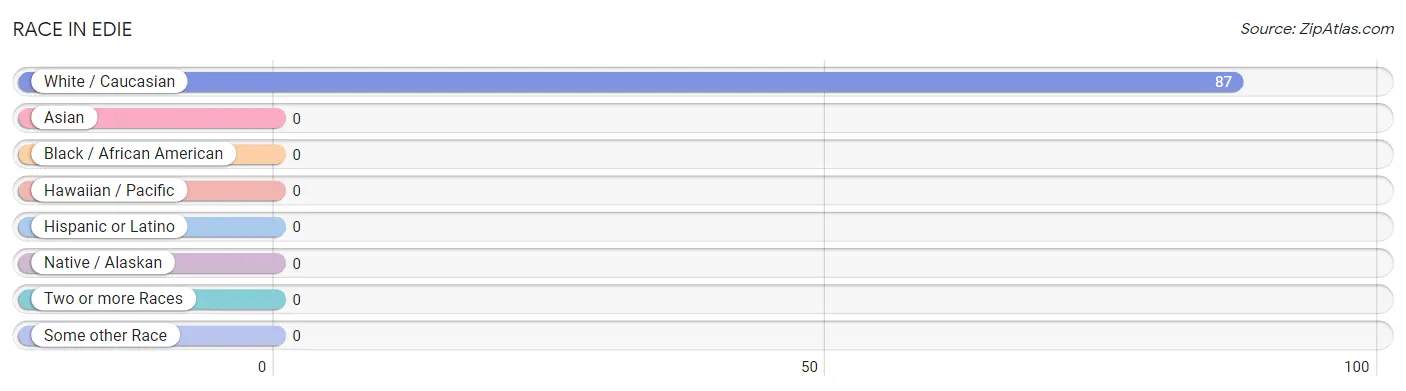
| Race | # Population | % Population |
| Asian | 0 | 0.0% |
| Black / African American | 0 | 0.0% |
| Hawaiian / Pacific | 0 | 0.0% |
| Hispanic or Latino | 0 | 0.0% |
| Native / Alaskan | 0 | 0.0% |
| White / Caucasian | 87 | 100.0% |
| Two or more Races | 0 | 0.0% |
| Some other Race | 0 | 0.0% |
| Total | 87 | 100.0% |
Ancestry in Edie
The most populous ancestries reported in Edie are German (25 | 28.7%), English (13 | 14.9%), Eastern European (12 | 13.8%), American (9 | 10.3%), and Scotch-Irish (3 | 3.5%), together accounting for 71.3% of all Edie residents.
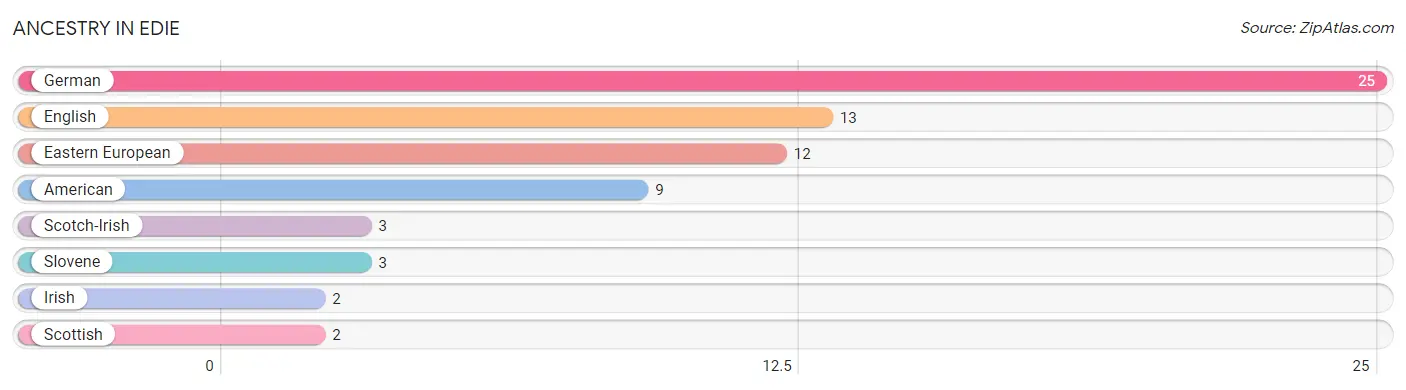
| Ancestry | # Population | % Population |
| American | 9 | 10.3% |
| Eastern European | 12 | 13.8% |
| English | 13 | 14.9% |
| German | 25 | 28.7% |
| Irish | 2 | 2.3% |
| Scotch-Irish | 3 | 3.5% |
| Scottish | 2 | 2.3% |
| Slovene | 3 | 3.5% | View All 8 Rows |
Immigrants in Edie

| Immigration Origin | # Population | % Population | View All 0 Rows |
Sex and Age in Edie
Sex and Age in Edie
The most populous age groups in Edie are 70 to 74 Years (11 | 27.5%) for men and 65 to 69 Years (14 | 29.8%) for women.
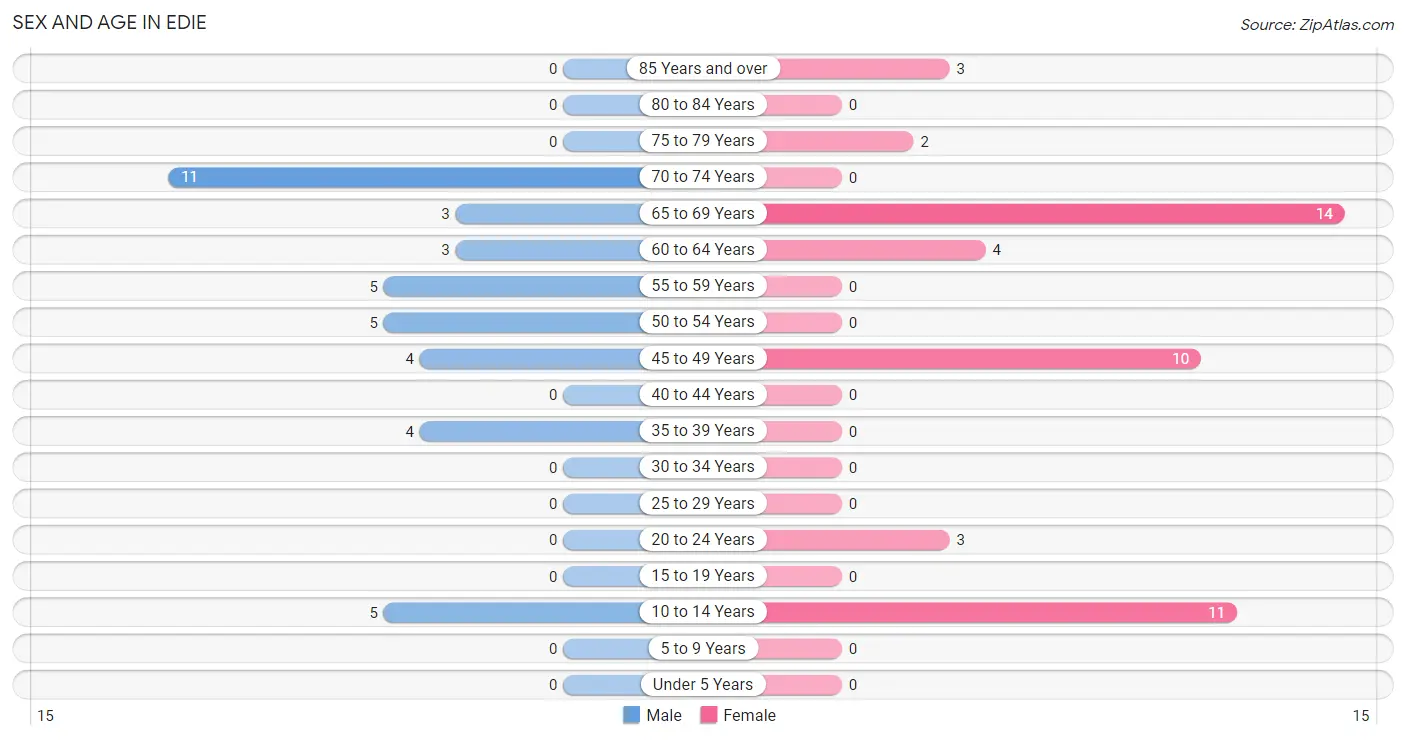
| Age Bracket | Male | Female |
| Under 5 Years | 0 (0.0%) | 0 (0.0%) |
| 5 to 9 Years | 0 (0.0%) | 0 (0.0%) |
| 10 to 14 Years | 5 (12.5%) | 11 (23.4%) |
| 15 to 19 Years | 0 (0.0%) | 0 (0.0%) |
| 20 to 24 Years | 0 (0.0%) | 3 (6.4%) |
| 25 to 29 Years | 0 (0.0%) | 0 (0.0%) |
| 30 to 34 Years | 0 (0.0%) | 0 (0.0%) |
| 35 to 39 Years | 4 (10.0%) | 0 (0.0%) |
| 40 to 44 Years | 0 (0.0%) | 0 (0.0%) |
| 45 to 49 Years | 4 (10.0%) | 10 (21.3%) |
| 50 to 54 Years | 5 (12.5%) | 0 (0.0%) |
| 55 to 59 Years | 5 (12.5%) | 0 (0.0%) |
| 60 to 64 Years | 3 (7.5%) | 4 (8.5%) |
| 65 to 69 Years | 3 (7.5%) | 14 (29.8%) |
| 70 to 74 Years | 11 (27.5%) | 0 (0.0%) |
| 75 to 79 Years | 0 (0.0%) | 2 (4.3%) |
| 80 to 84 Years | 0 (0.0%) | 0 (0.0%) |
| 85 Years and over | 0 (0.0%) | 3 (6.4%) |
| Total | 40 (100.0%) | 47 (100.0%) |
Families and Households in Edie
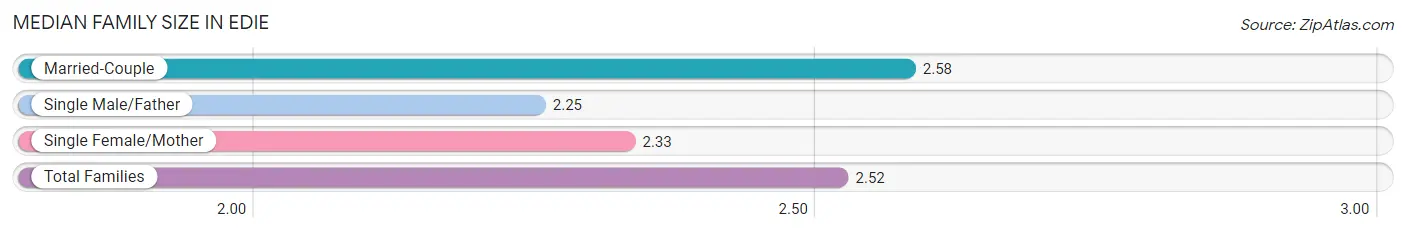
Median Family Size in Edie
The median family size in Edie is 2.52 persons per family, with married-couple families (26 | 78.8%) accounting for the largest median family size of 2.58 persons per family. On the other hand, single male/father families (4 | 12.1%) represent the smallest median family size with 2.25 persons per family.
| Family Type | # Families | Family Size |
| Married-Couple | 26 (78.8%) | 2.58 |
| Single Male/Father | 4 (12.1%) | 2.25 |
| Single Female/Mother | 3 (9.1%) | 2.33 |
| Total Families | 33 (100.0%) | 2.52 |
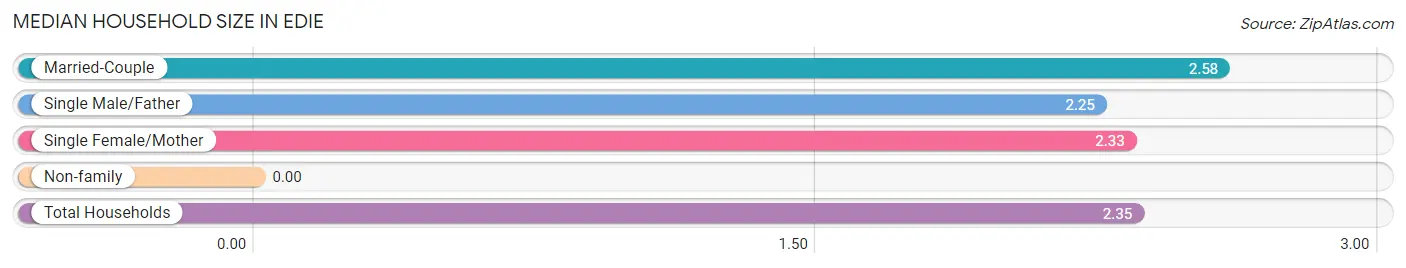
Median Household Size in Edie
| Household Type | # Households | Household Size |
| Married-Couple | 26 (70.3%) | 2.58 |
| Single Male/Father | 4 (10.8%) | 2.25 |
| Single Female/Mother | 3 (8.1%) | 2.33 |
| Non-family | 4 (10.8%) | - |
| Total Households | 37 (100.0%) | 2.35 |
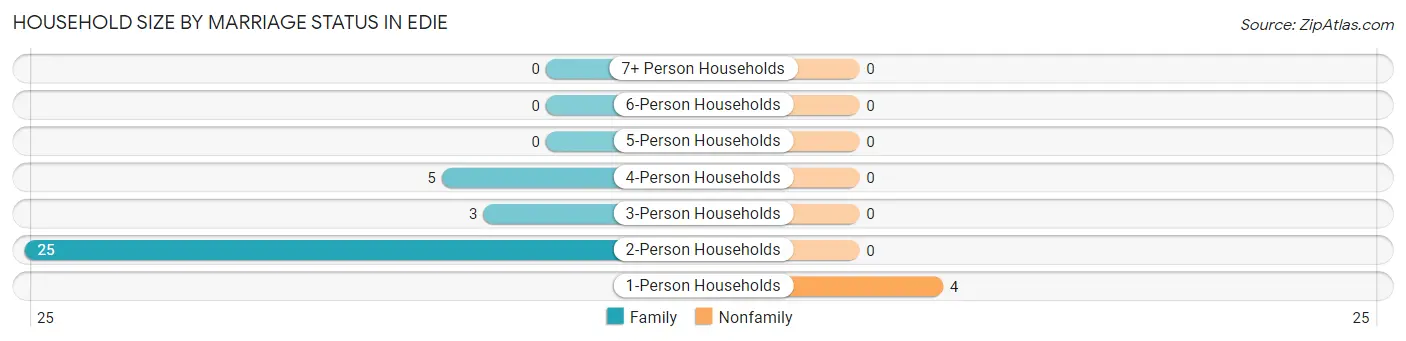
Household Size by Marriage Status in Edie
Out of a total of 37 households in Edie, 33 (89.2%) are family households, while 4 (10.8%) are nonfamily households. The most numerous type of family households are 2-person households, comprising 25, and the most common type of nonfamily households are 1-person households, comprising 4.
| Household Size | Family Households | Nonfamily Households |
| 1-Person Households | - | 4 (10.8%) |
| 2-Person Households | 25 (67.6%) | 0 (0.0%) |
| 3-Person Households | 3 (8.1%) | 0 (0.0%) |
| 4-Person Households | 5 (13.5%) | 0 (0.0%) |
| 5-Person Households | 0 (0.0%) | 0 (0.0%) |
| 6-Person Households | 0 (0.0%) | 0 (0.0%) |
| 7+ Person Households | 0 (0.0%) | 0 (0.0%) |
| Total | 33 (89.2%) | 4 (10.8%) |
Female Fertility in Edie
Fertility by Age in Edie
| Age Bracket | Women with Births | Births / 1,000 Women |
| 15 to 19 years | 0 (0.0%) | 0.0 |
| 20 to 34 years | 0 (0.0%) | 0.0 |
| 35 to 50 years | 0 (0.0%) | 0.0 |
| Total | 0 (0.0%) | 0.0 |
Fertility by Age by Marriage Status in Edie
| Age Bracket | Married | Unmarried |
| 15 to 19 years | 0 (0.0%) | 0 (0.0%) |
| 20 to 34 years | 0 (0.0%) | 0 (0.0%) |
| 35 to 50 years | 0 (0.0%) | 0 (0.0%) |
| Total | 0 (0.0%) | 0 (0.0%) |
Fertility by Education in Edie
| Educational Attainment | Women with Births | Births / 1,000 Women |
| Less than High School | 0 (0.0%) | 0.0 |
| High School Diploma | 0 (0.0%) | 0.0 |
| College or Associate's Degree | 0 (0.0%) | 0.0 |
| Bachelor's Degree | 0 (0.0%) | 0.0 |
| Graduate Degree | 0 (0.0%) | 0.0 |
| Total | 0 (0.0%) | 0.0 |
Fertility by Education by Marriage Status in Edie
| Educational Attainment | Married | Unmarried |
| Less than High School | 0 (0.0%) | 0 (0.0%) |
| High School Diploma | 0 (0.0%) | 0 (0.0%) |
| College or Associate's Degree | 0 (0.0%) | 0 (0.0%) |
| Bachelor's Degree | 0 (0.0%) | 0 (0.0%) |
| Graduate Degree | 0 (0.0%) | 0 (0.0%) |
| Total | 0 (0.0%) | 0 (0.0%) |
Employment Characteristics in Edie
Employment by Class of Employer in Edie
Among the 33 employed individuals in Edie, private company employees (25 | 75.8%), self-employed (not incorporated) (3 | 9.1%), and not-for-profit organizations (3 | 9.1%) make up the most common classes of employment.
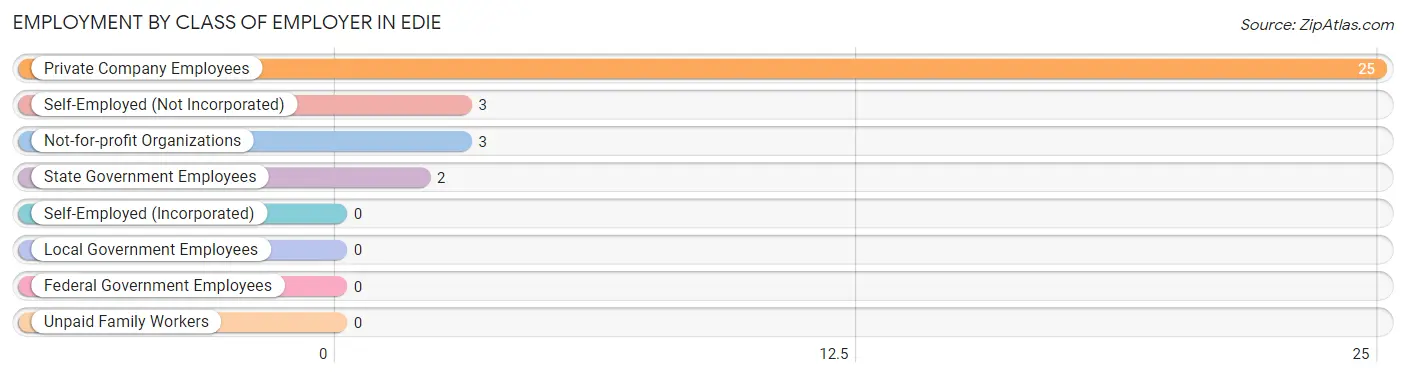
| Employer Class | # Employees | % Employees |
| Private Company Employees | 25 | 75.8% |
| Self-Employed (Incorporated) | 0 | 0.0% |
| Self-Employed (Not Incorporated) | 3 | 9.1% |
| Not-for-profit Organizations | 3 | 9.1% |
| Local Government Employees | 0 | 0.0% |
| State Government Employees | 2 | 6.1% |
| Federal Government Employees | 0 | 0.0% |
| Unpaid Family Workers | 0 | 0.0% |
| Total | 33 | 100.0% |
Employment Status by Age in Edie
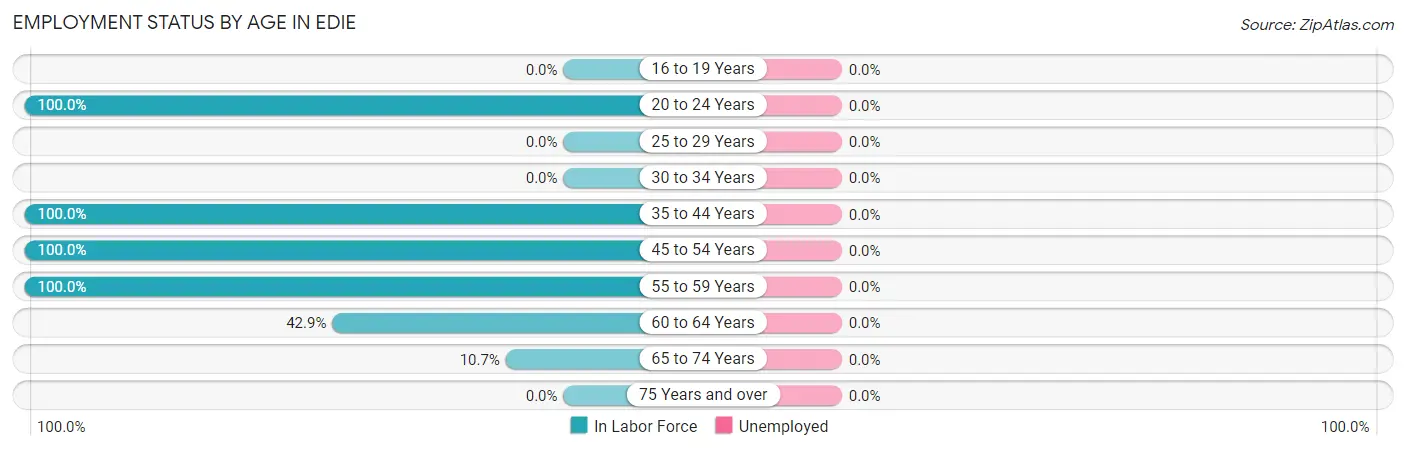
| Age Bracket | In Labor Force | Unemployed |
| 16 to 19 Years | 0 (0.0%) | 0 (0.0%) |
| 20 to 24 Years | 3 (100.0%) | 0 (0.0%) |
| 25 to 29 Years | 0 (0.0%) | 0 (0.0%) |
| 30 to 34 Years | 0 (0.0%) | 0 (0.0%) |
| 35 to 44 Years | 4 (100.0%) | 0 (0.0%) |
| 45 to 54 Years | 19 (100.0%) | 0 (0.0%) |
| 55 to 59 Years | 5 (100.0%) | 0 (0.0%) |
| 60 to 64 Years | 3 (42.9%) | 0 (0.0%) |
| 65 to 74 Years | 3 (10.7%) | 0 (0.0%) |
| 75 Years and over | 0 (0.0%) | 0 (0.0%) |
| Total | 37 (52.1%) | 0 (0.0%) |
Employment Status by Educational Attainment in Edie
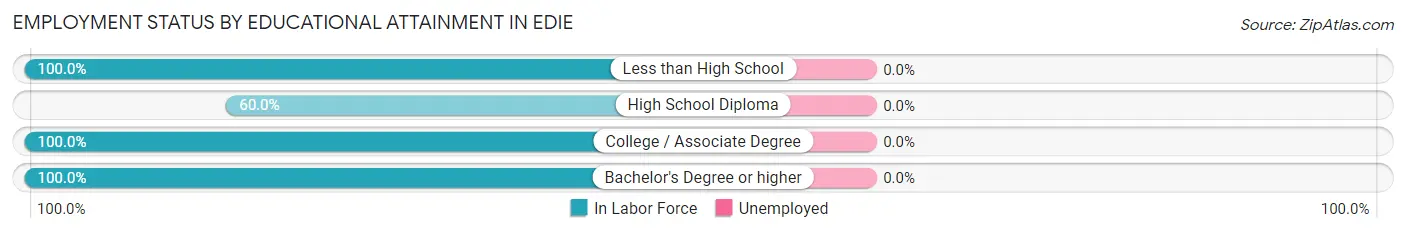
| Educational Attainment | In Labor Force | Unemployed |
| Less than High School | 3 (100.0%) | 0 (0.0%) |
| High School Diploma | 6 (60.0%) | 0 (0.0%) |
| College / Associate Degree | 10 (100.0%) | 0 (0.0%) |
| Bachelor's Degree or higher | 12 (100.0%) | 0 (0.0%) |
| Total | 31 (88.6%) | 0 (0.0%) |
Employment Occupations by Sex in Edie
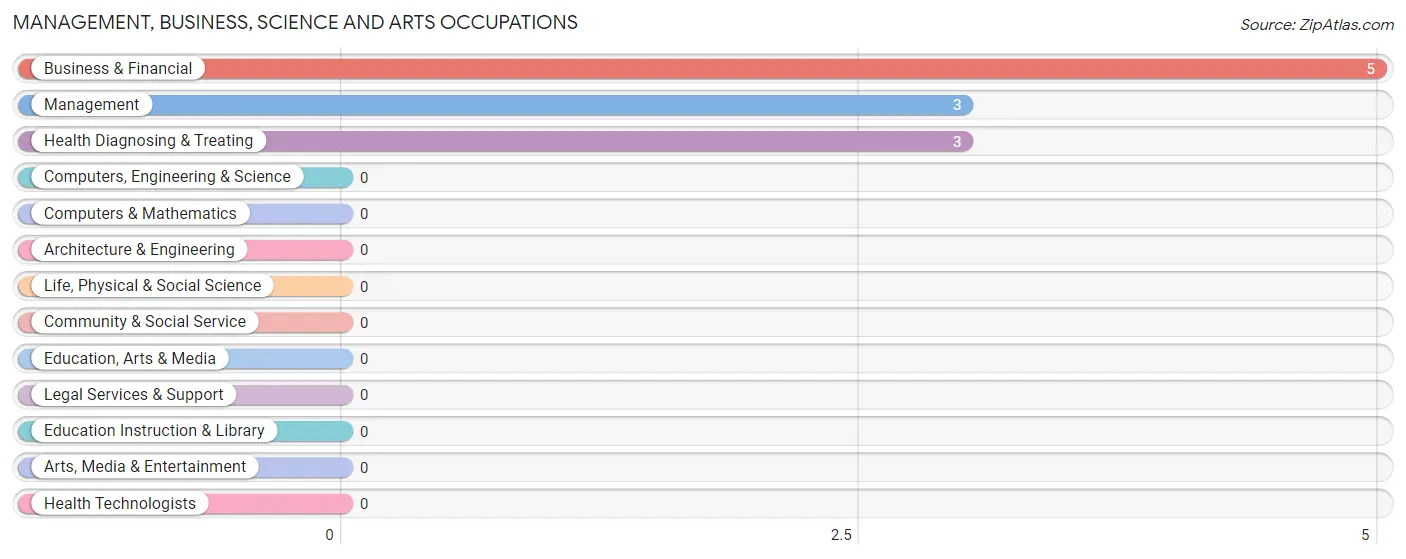
Management, Business, Science and Arts Occupations
The most common Management, Business, Science and Arts occupations in Edie are Business & Financial (5 | 13.5%), Management (3 | 8.1%), and Health Diagnosing & Treating (3 | 8.1%).
Management, Business, Science and Arts Occupations by Sex
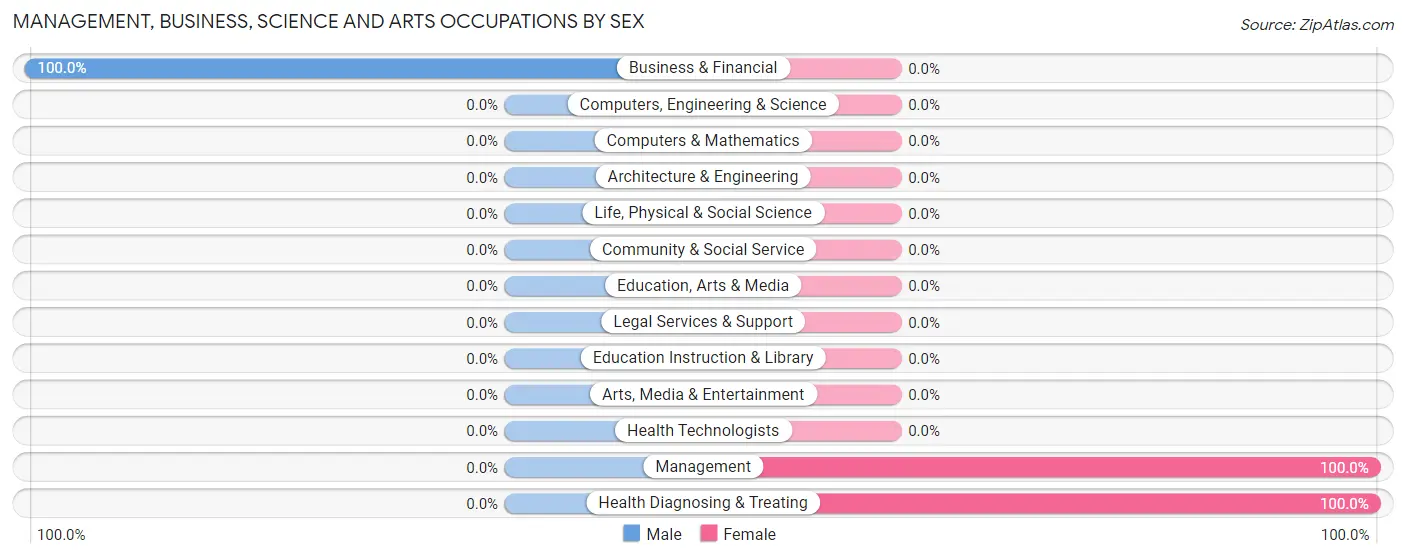
| Occupation | Male | Female |
| Management | 0 (0.0%) | 3 (100.0%) |
| Business & Financial | 5 (100.0%) | 0 (0.0%) |
| Computers, Engineering & Science | 0 (0.0%) | 0 (0.0%) |
| Computers & Mathematics | 0 (0.0%) | 0 (0.0%) |
| Architecture & Engineering | 0 (0.0%) | 0 (0.0%) |
| Life, Physical & Social Science | 0 (0.0%) | 0 (0.0%) |
| Community & Social Service | 0 (0.0%) | 0 (0.0%) |
| Education, Arts & Media | 0 (0.0%) | 0 (0.0%) |
| Legal Services & Support | 0 (0.0%) | 0 (0.0%) |
| Education Instruction & Library | 0 (0.0%) | 0 (0.0%) |
| Arts, Media & Entertainment | 0 (0.0%) | 0 (0.0%) |
| Health Diagnosing & Treating | 0 (0.0%) | 3 (100.0%) |
| Health Technologists | 0 (0.0%) | 0 (0.0%) |
| Total (Category) | 5 (45.5%) | 6 (54.5%) |
| Total (Overall) | 24 (64.9%) | 13 (35.1%) |
Services Occupations
Services Occupations by Sex
| Occupation | Male | Female |
| Healthcare Support | 0 (0.0%) | 0 (0.0%) |
| Security & Protection | 0 (0.0%) | 0 (0.0%) |
| Firefighting & Prevention | 0 (0.0%) | 0 (0.0%) |
| Law Enforcement | 0 (0.0%) | 0 (0.0%) |
| Food Preparation & Serving | 0 (0.0%) | 0 (0.0%) |
| Cleaning & Maintenance | 0 (0.0%) | 0 (0.0%) |
| Personal Care & Service | 0 (0.0%) | 0 (0.0%) |
| Total (Category) | 0 (0.0%) | 0 (0.0%) |
| Total (Overall) | 24 (64.9%) | 13 (35.1%) |
Sales and Office Occupations
The most common Sales and Office occupations in Edie are , and Sales & Related (7 | 18.9%).
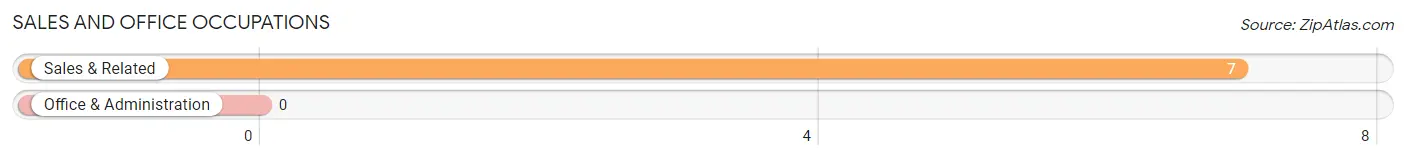
Sales and Office Occupations by Sex
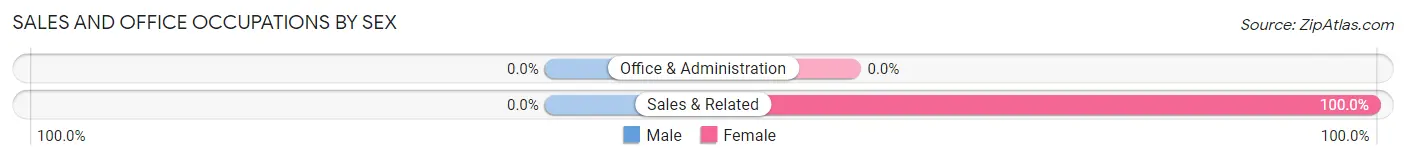
| Occupation | Male | Female |
| Sales & Related | 0 (0.0%) | 7 (100.0%) |
| Office & Administration | 0 (0.0%) | 0 (0.0%) |
| Total (Category) | 0 (0.0%) | 7 (100.0%) |
| Total (Overall) | 24 (64.9%) | 13 (35.1%) |
Natural Resources, Construction and Maintenance Occupations
The most common Natural Resources, Construction and Maintenance occupations in Edie are , and Construction & Extraction (13 | 35.1%).
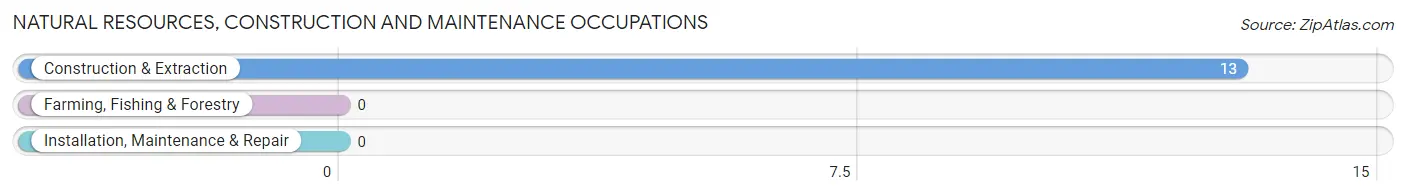
Natural Resources, Construction and Maintenance Occupations by Sex
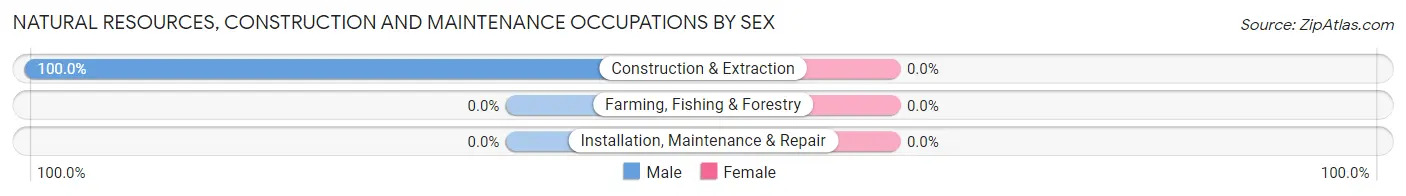
| Occupation | Male | Female |
| Farming, Fishing & Forestry | 0 (0.0%) | 0 (0.0%) |
| Construction & Extraction | 13 (100.0%) | 0 (0.0%) |
| Installation, Maintenance & Repair | 0 (0.0%) | 0 (0.0%) |
| Total (Category) | 13 (100.0%) | 0 (0.0%) |
| Total (Overall) | 24 (64.9%) | 13 (35.1%) |
Production, Transportation and Moving Occupations
The most common Production, Transportation and Moving occupations in Edie are Production (3 | 8.1%), and Transportation (3 | 8.1%).
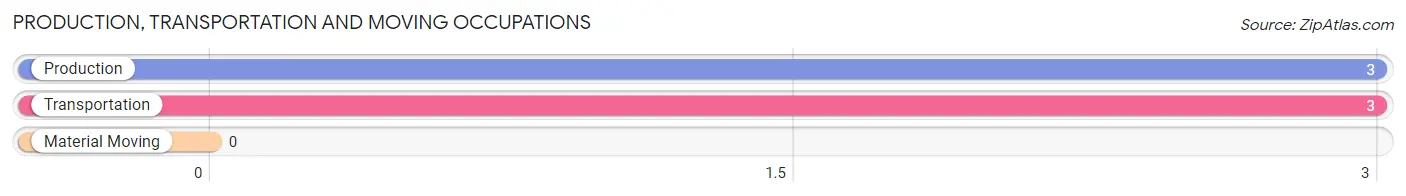
Production, Transportation and Moving Occupations by Sex
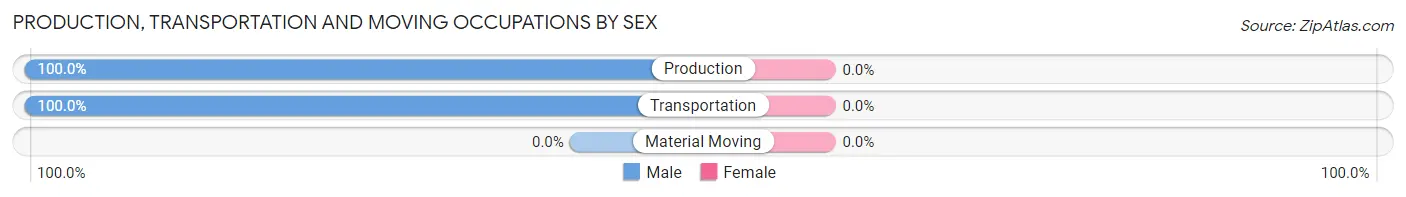
| Occupation | Male | Female |
| Production | 3 (100.0%) | 0 (0.0%) |
| Transportation | 3 (100.0%) | 0 (0.0%) |
| Material Moving | 0 (0.0%) | 0 (0.0%) |
| Total (Category) | 6 (100.0%) | 0 (0.0%) |
| Total (Overall) | 24 (64.9%) | 13 (35.1%) |
Employment Industries by Sex in Edie
Employment Industries in Edie
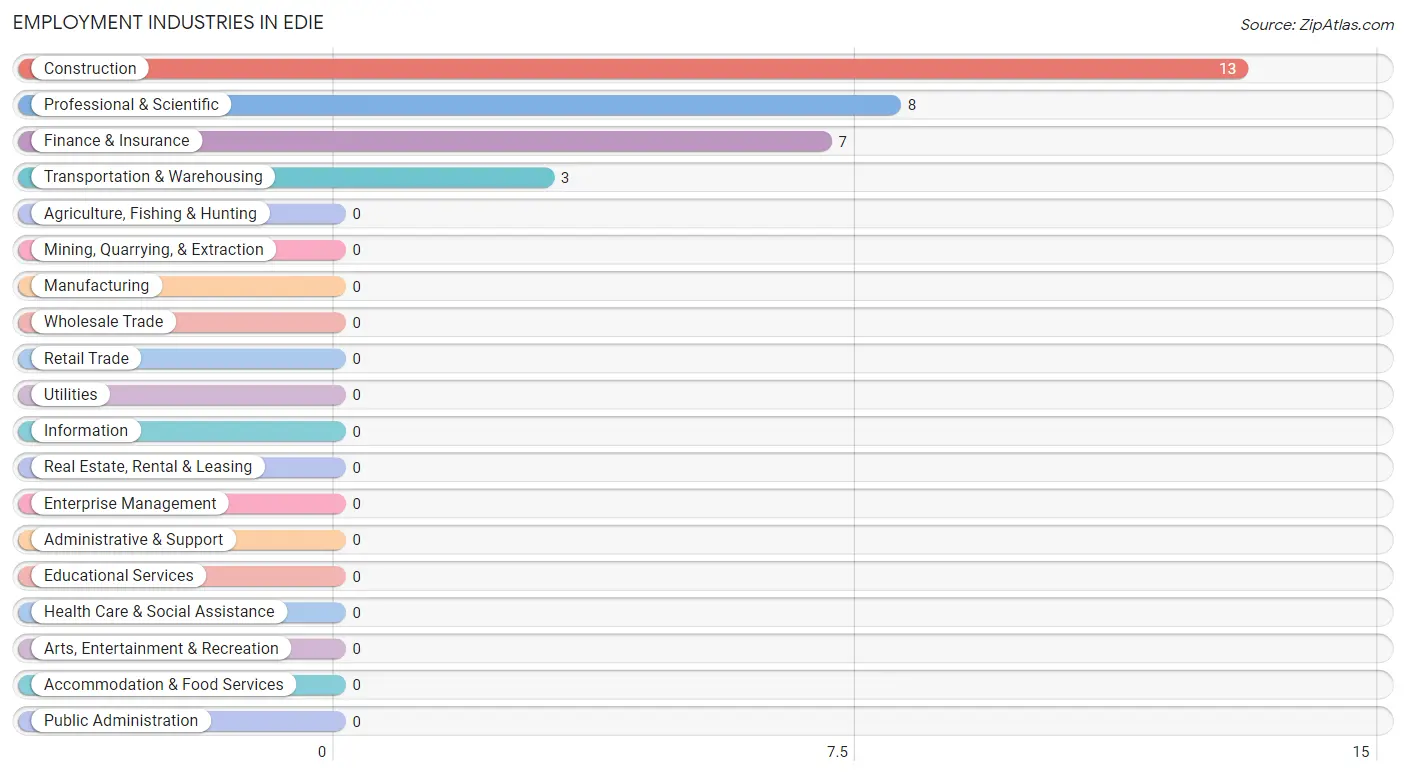
The major employment industries in Edie include Construction (13 | 35.1%), Professional & Scientific (8 | 21.6%), Finance & Insurance (7 | 18.9%), and Transportation & Warehousing (3 | 8.1%).
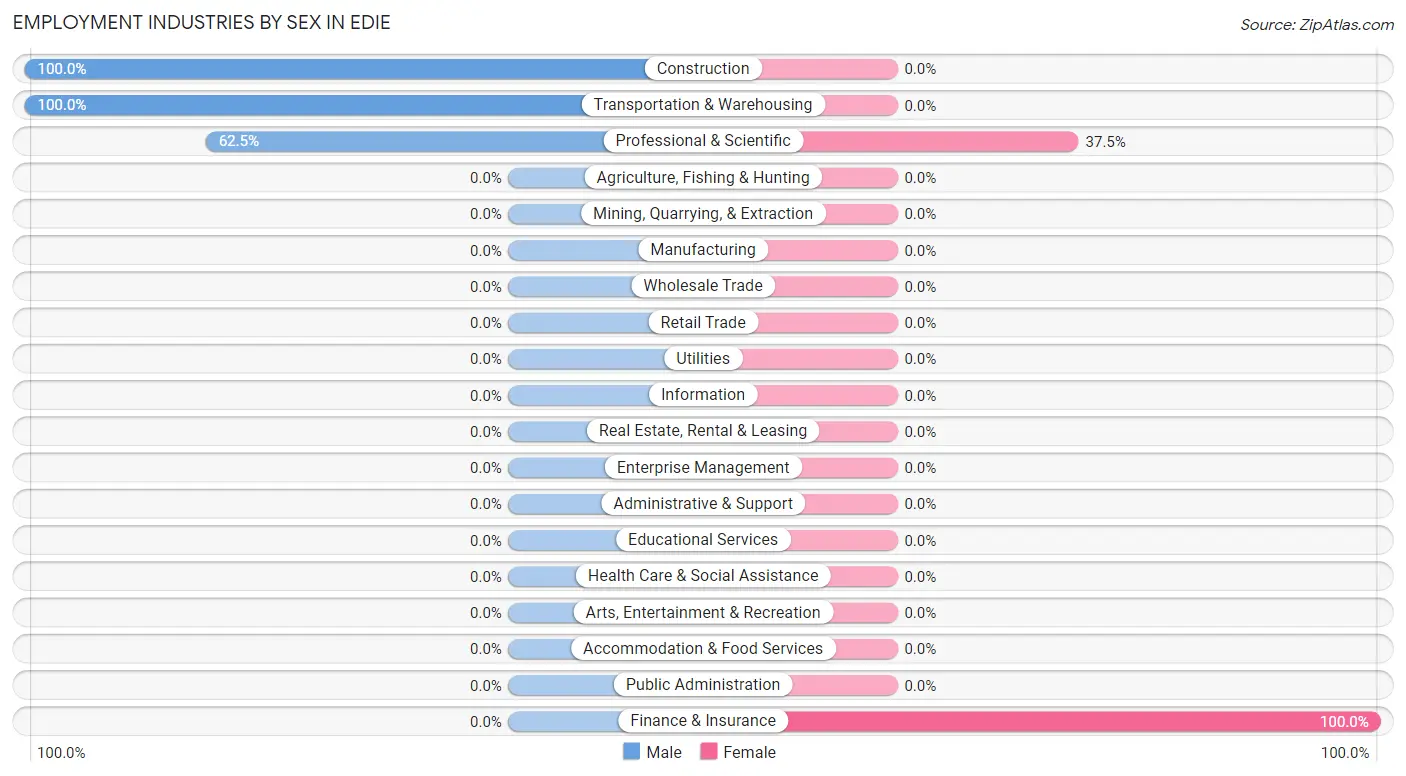
Employment Industries by Sex in Edie
The Edie industries that see more men than women are Construction (100.0%), Transportation & Warehousing (100.0%), and Professional & Scientific (62.5%), whereas the industries that tend to have a higher number of women are Finance & Insurance (100.0%), and Professional & Scientific (37.5%).
| Industry | Male | Female |
| Agriculture, Fishing & Hunting | 0 (0.0%) | 0 (0.0%) |
| Mining, Quarrying, & Extraction | 0 (0.0%) | 0 (0.0%) |
| Construction | 13 (100.0%) | 0 (0.0%) |
| Manufacturing | 0 (0.0%) | 0 (0.0%) |
| Wholesale Trade | 0 (0.0%) | 0 (0.0%) |
| Retail Trade | 0 (0.0%) | 0 (0.0%) |
| Transportation & Warehousing | 3 (100.0%) | 0 (0.0%) |
| Utilities | 0 (0.0%) | 0 (0.0%) |
| Information | 0 (0.0%) | 0 (0.0%) |
| Finance & Insurance | 0 (0.0%) | 7 (100.0%) |
| Real Estate, Rental & Leasing | 0 (0.0%) | 0 (0.0%) |
| Professional & Scientific | 5 (62.5%) | 3 (37.5%) |
| Enterprise Management | 0 (0.0%) | 0 (0.0%) |
| Administrative & Support | 0 (0.0%) | 0 (0.0%) |
| Educational Services | 0 (0.0%) | 0 (0.0%) |
| Health Care & Social Assistance | 0 (0.0%) | 0 (0.0%) |
| Arts, Entertainment & Recreation | 0 (0.0%) | 0 (0.0%) |
| Accommodation & Food Services | 0 (0.0%) | 0 (0.0%) |
| Public Administration | 0 (0.0%) | 0 (0.0%) |
| Total | 24 (64.9%) | 13 (35.1%) |
Education in Edie
School Enrollment in Edie
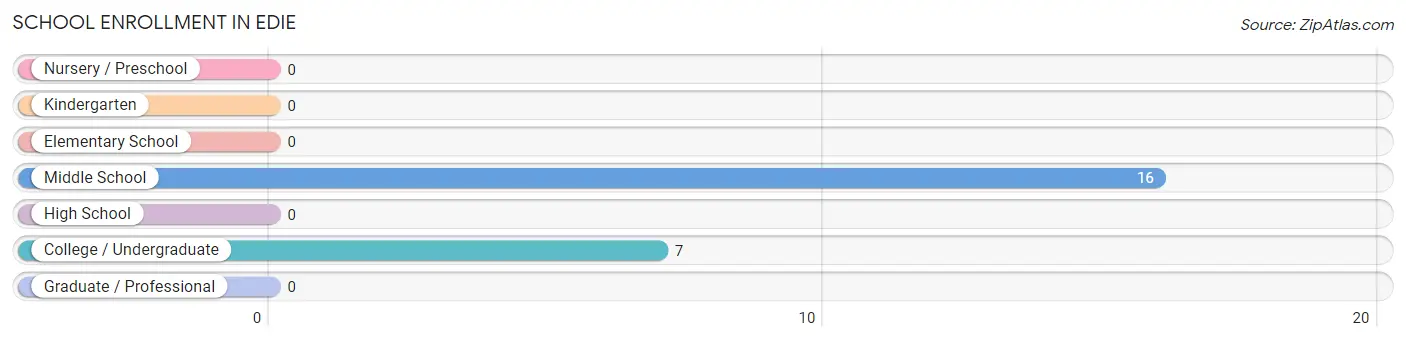
The most common levels of schooling among the 23 students in Edie are middle school (16 | 69.6%), and college / undergraduate (7 | 30.4%).
| School Level | # Students | % Students |
| Nursery / Preschool | 0 | 0.0% |
| Kindergarten | 0 | 0.0% |
| Elementary School | 0 | 0.0% |
| Middle School | 16 | 69.6% |
| High School | 0 | 0.0% |
| College / Undergraduate | 7 | 30.4% |
| Graduate / Professional | 0 | 0.0% |
| Total | 23 | 100.0% |
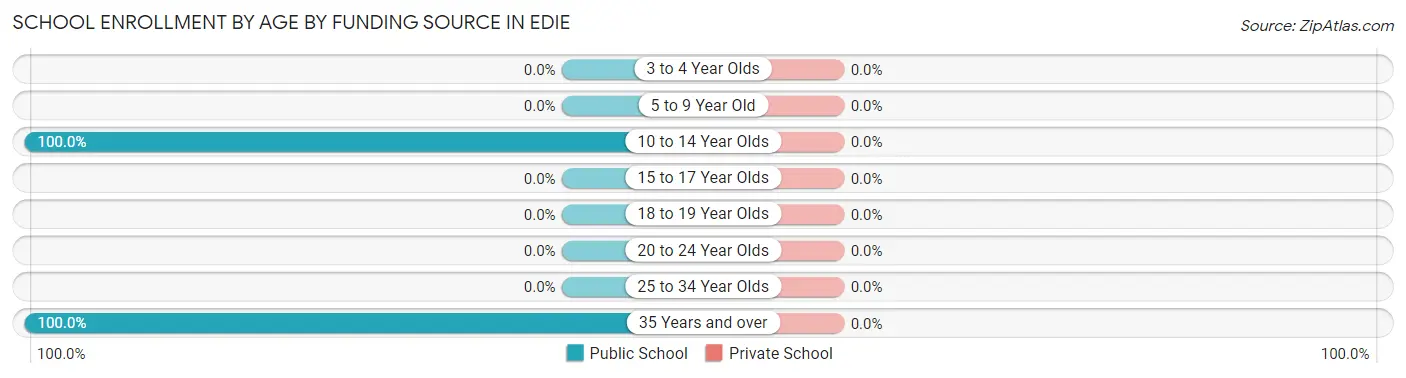
School Enrollment by Age by Funding Source in Edie
| Age Bracket | Public School | Private School |
| 3 to 4 Year Olds | 0 (0.0%) | 0 (0.0%) |
| 5 to 9 Year Old | 0 (0.0%) | 0 (0.0%) |
| 10 to 14 Year Olds | 16 (100.0%) | 0 (0.0%) |
| 15 to 17 Year Olds | 0 (0.0%) | 0 (0.0%) |
| 18 to 19 Year Olds | 0 (0.0%) | 0 (0.0%) |
| 20 to 24 Year Olds | 0 (0.0%) | 0 (0.0%) |
| 25 to 34 Year Olds | 0 (0.0%) | 0 (0.0%) |
| 35 Years and over | 7 (100.0%) | 0 (0.0%) |
| Total | 23 (100.0%) | 0 (0.0%) |
Educational Attainment by Field of Study in Edie
Bio, nature & agricultural (13 | 41.9%), business (7 | 22.6%), physical & health sciences (5 | 16.1%), social sciences (3 | 9.7%), and education (3 | 9.7%) are the most common fields of study among 31 individuals in Edie who have obtained a bachelor's degree or higher.
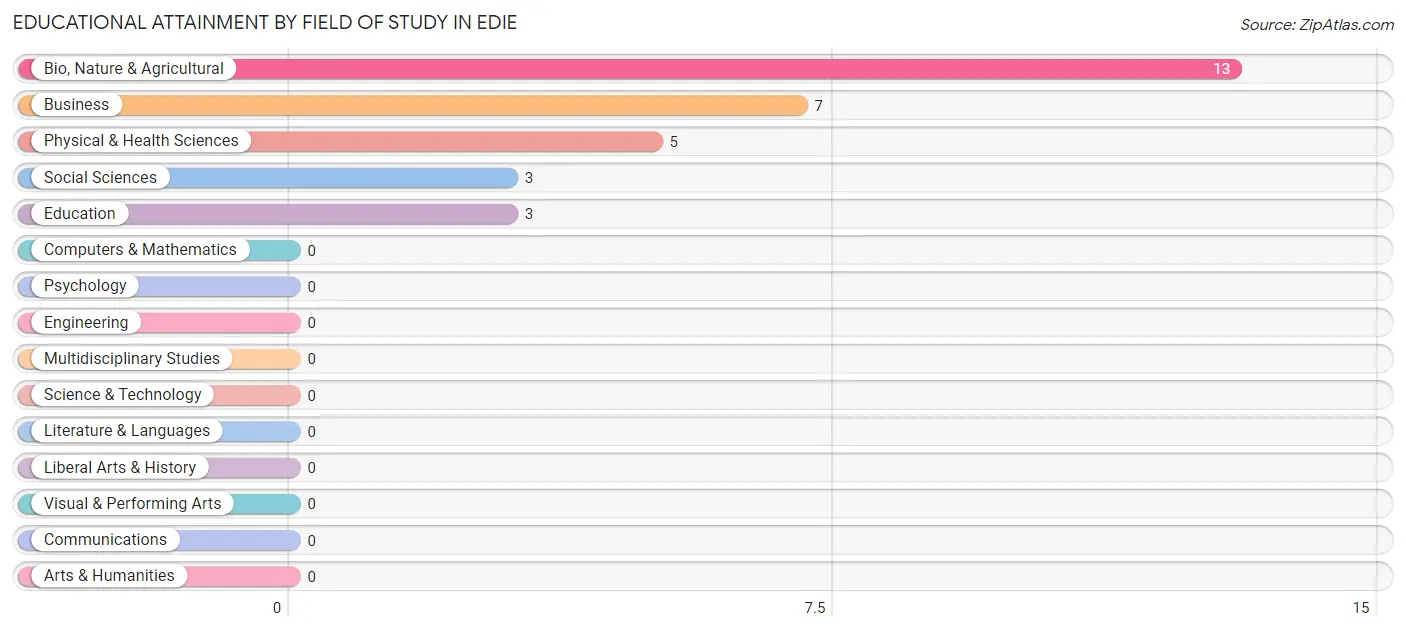
| Field of Study | # Graduates | % Graduates |
| Computers & Mathematics | 0 | 0.0% |
| Bio, Nature & Agricultural | 13 | 41.9% |
| Physical & Health Sciences | 5 | 16.1% |
| Psychology | 0 | 0.0% |
| Social Sciences | 3 | 9.7% |
| Engineering | 0 | 0.0% |
| Multidisciplinary Studies | 0 | 0.0% |
| Science & Technology | 0 | 0.0% |
| Business | 7 | 22.6% |
| Education | 3 | 9.7% |
| Literature & Languages | 0 | 0.0% |
| Liberal Arts & History | 0 | 0.0% |
| Visual & Performing Arts | 0 | 0.0% |
| Communications | 0 | 0.0% |
| Arts & Humanities | 0 | 0.0% |
| Total | 31 | 100.0% |
Transportation & Commute in Edie
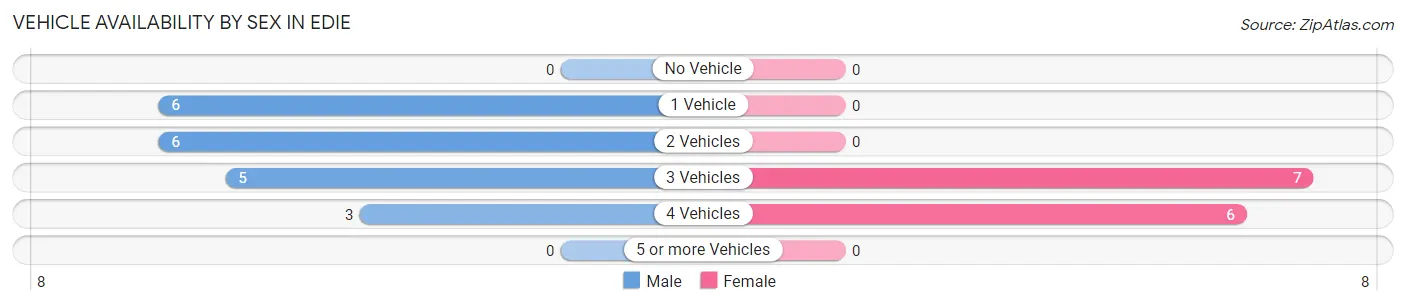
Vehicle Availability by Sex in Edie
The most prevalent vehicle ownership categories in Edie are males with 1 vehicle (6, accounting for 30.0%) and females with 1 vehicle (0, making up 46.2%).
| Vehicles Available | Male | Female |
| No Vehicle | 0 (0.0%) | 0 (0.0%) |
| 1 Vehicle | 6 (30.0%) | 0 (0.0%) |
| 2 Vehicles | 6 (30.0%) | 0 (0.0%) |
| 3 Vehicles | 5 (25.0%) | 7 (53.8%) |
| 4 Vehicles | 3 (15.0%) | 6 (46.2%) |
| 5 or more Vehicles | 0 (0.0%) | 0 (0.0%) |
| Total | 20 (100.0%) | 13 (100.0%) |
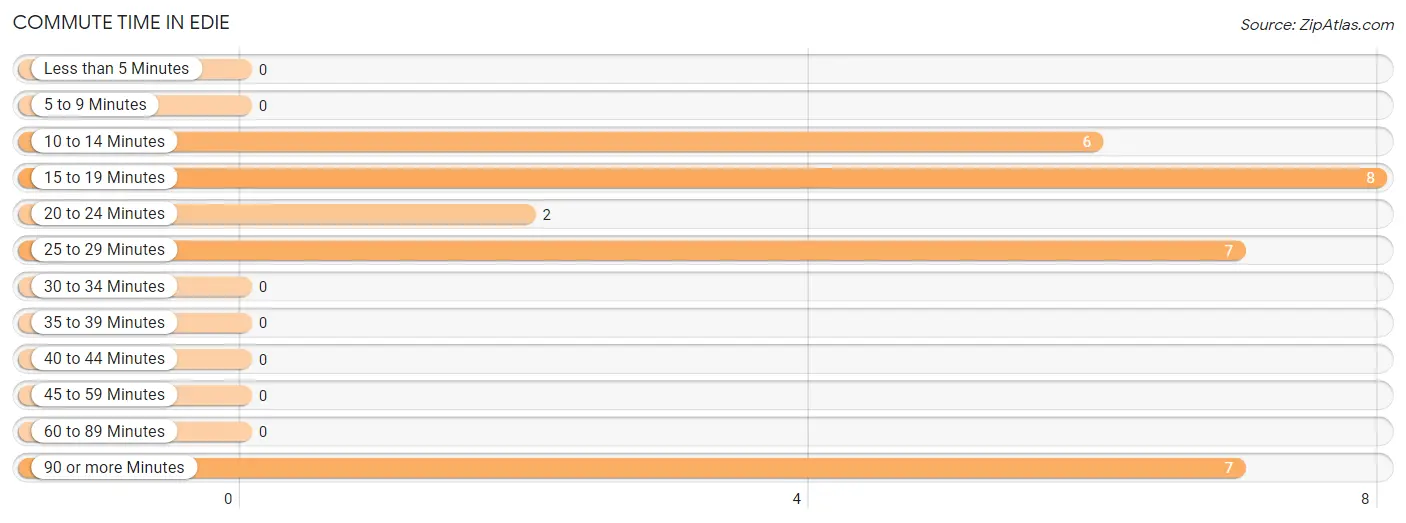
Commute Time in Edie
The most frequently occuring commute durations in Edie are 15 to 19 minutes (8 commuters, 26.7%), 25 to 29 minutes (7 commuters, 23.3%), and 90 or more minutes (7 commuters, 23.3%).
| Commute Time | # Commuters | % Commuters |
| Less than 5 Minutes | 0 | 0.0% |
| 5 to 9 Minutes | 0 | 0.0% |
| 10 to 14 Minutes | 6 | 20.0% |
| 15 to 19 Minutes | 8 | 26.7% |
| 20 to 24 Minutes | 2 | 6.7% |
| 25 to 29 Minutes | 7 | 23.3% |
| 30 to 34 Minutes | 0 | 0.0% |
| 35 to 39 Minutes | 0 | 0.0% |
| 40 to 44 Minutes | 0 | 0.0% |
| 45 to 59 Minutes | 0 | 0.0% |
| 60 to 89 Minutes | 0 | 0.0% |
| 90 or more Minutes | 7 | 23.3% |
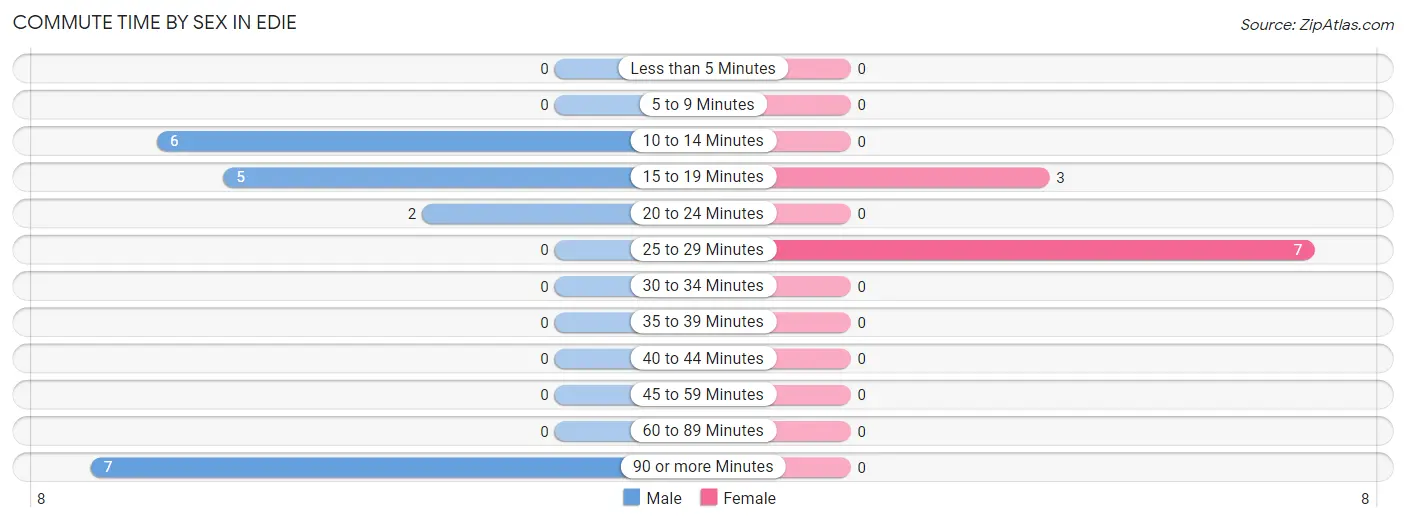
Commute Time by Sex in Edie
The most common commute times in Edie are 90 or more minutes (7 commuters, 35.0%) for males and 25 to 29 minutes (7 commuters, 70.0%) for females.
| Commute Time | Male | Female |
| Less than 5 Minutes | 0 (0.0%) | 0 (0.0%) |
| 5 to 9 Minutes | 0 (0.0%) | 0 (0.0%) |
| 10 to 14 Minutes | 6 (30.0%) | 0 (0.0%) |
| 15 to 19 Minutes | 5 (25.0%) | 3 (30.0%) |
| 20 to 24 Minutes | 2 (10.0%) | 0 (0.0%) |
| 25 to 29 Minutes | 0 (0.0%) | 7 (70.0%) |
| 30 to 34 Minutes | 0 (0.0%) | 0 (0.0%) |
| 35 to 39 Minutes | 0 (0.0%) | 0 (0.0%) |
| 40 to 44 Minutes | 0 (0.0%) | 0 (0.0%) |
| 45 to 59 Minutes | 0 (0.0%) | 0 (0.0%) |
| 60 to 89 Minutes | 0 (0.0%) | 0 (0.0%) |
| 90 or more Minutes | 7 (35.0%) | 0 (0.0%) |
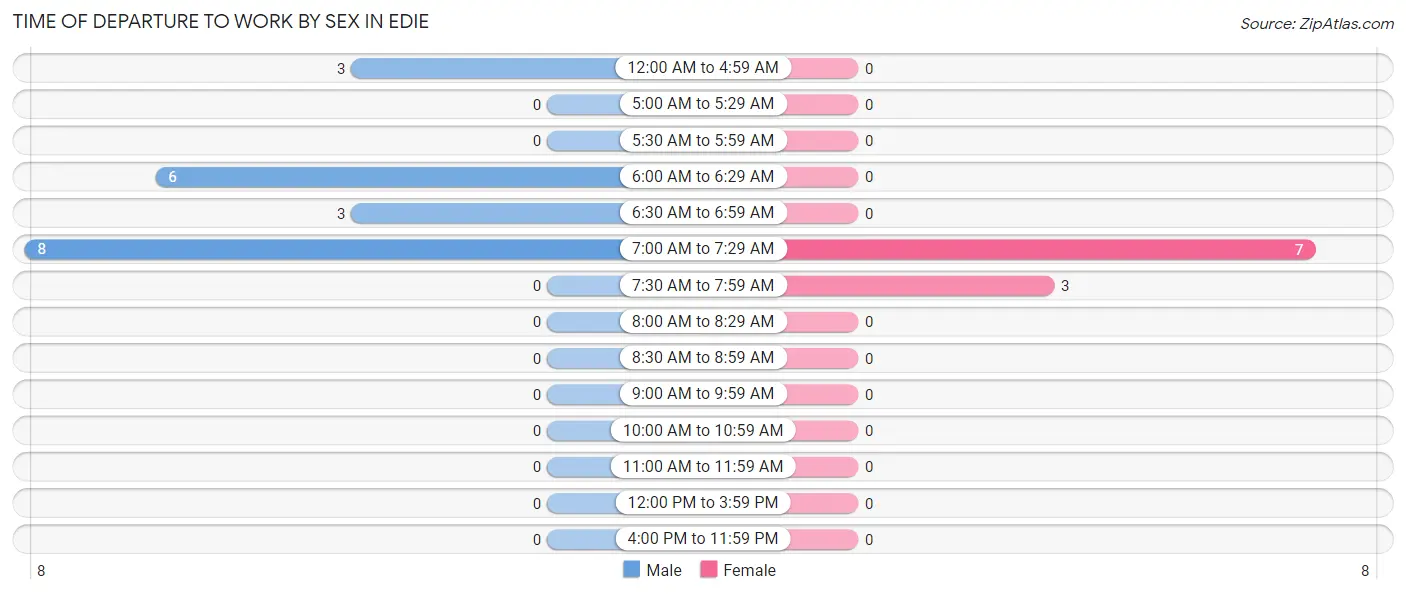
Time of Departure to Work by Sex in Edie
The most frequent times of departure to work in Edie are 7:00 AM to 7:29 AM (8, 40.0%) for males and 7:00 AM to 7:29 AM (7, 70.0%) for females.
| Time of Departure | Male | Female |
| 12:00 AM to 4:59 AM | 3 (15.0%) | 0 (0.0%) |
| 5:00 AM to 5:29 AM | 0 (0.0%) | 0 (0.0%) |
| 5:30 AM to 5:59 AM | 0 (0.0%) | 0 (0.0%) |
| 6:00 AM to 6:29 AM | 6 (30.0%) | 0 (0.0%) |
| 6:30 AM to 6:59 AM | 3 (15.0%) | 0 (0.0%) |
| 7:00 AM to 7:29 AM | 8 (40.0%) | 7 (70.0%) |
| 7:30 AM to 7:59 AM | 0 (0.0%) | 3 (30.0%) |
| 8:00 AM to 8:29 AM | 0 (0.0%) | 0 (0.0%) |
| 8:30 AM to 8:59 AM | 0 (0.0%) | 0 (0.0%) |
| 9:00 AM to 9:59 AM | 0 (0.0%) | 0 (0.0%) |
| 10:00 AM to 10:59 AM | 0 (0.0%) | 0 (0.0%) |
| 11:00 AM to 11:59 AM | 0 (0.0%) | 0 (0.0%) |
| 12:00 PM to 3:59 PM | 0 (0.0%) | 0 (0.0%) |
| 4:00 PM to 11:59 PM | 0 (0.0%) | 0 (0.0%) |
| Total | 20 (100.0%) | 10 (100.0%) |
Housing Occupancy in Edie
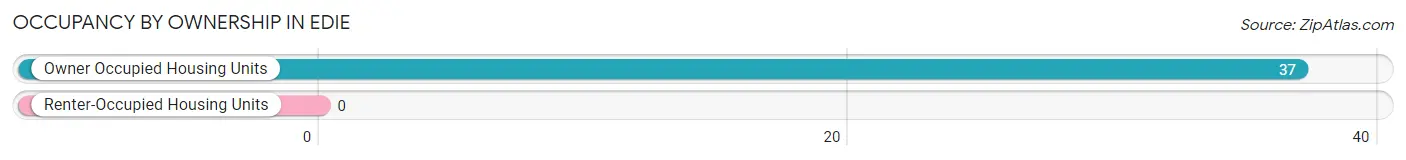
Occupancy by Ownership in Edie
Of the total 37 dwellings in Edie, owner-occupied units account for 37 (100.0%), while renter-occupied units make up 0 (0.0%).
| Occupancy | # Housing Units | % Housing Units |
| Owner Occupied Housing Units | 37 | 100.0% |
| Renter-Occupied Housing Units | 0 | 0.0% |
| Total Occupied Housing Units | 37 | 100.0% |
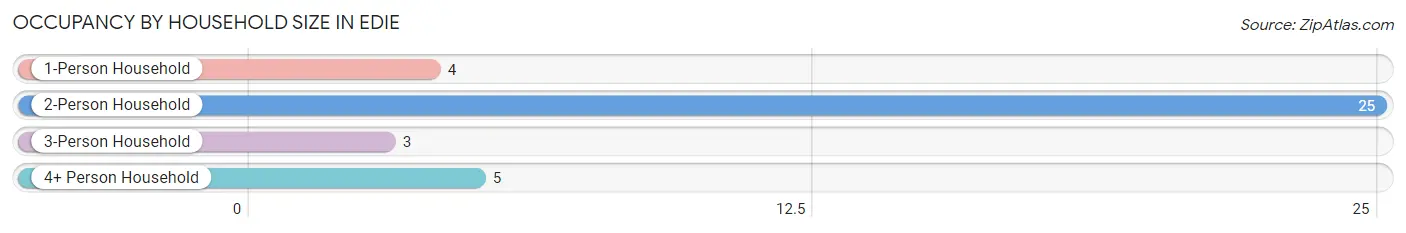
Occupancy by Household Size in Edie
| Household Size | # Housing Units | % Housing Units |
| 1-Person Household | 4 | 10.8% |
| 2-Person Household | 25 | 67.6% |
| 3-Person Household | 3 | 8.1% |
| 4+ Person Household | 5 | 13.5% |
| Total Housing Units | 37 | 100.0% |
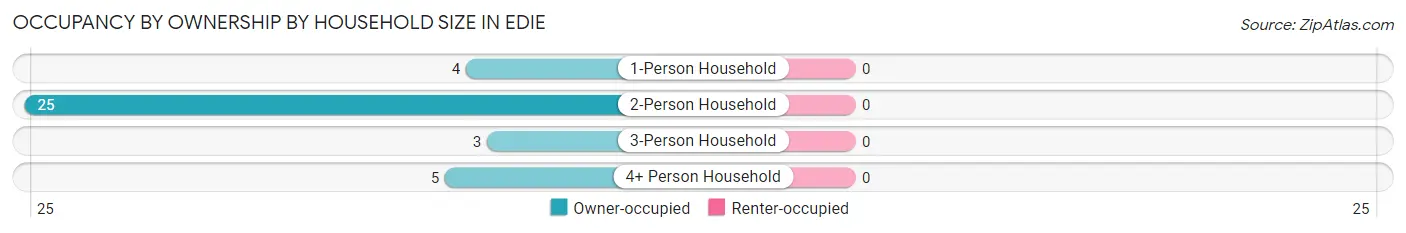
Occupancy by Ownership by Household Size in Edie
| Household Size | Owner-occupied | Renter-occupied |
| 1-Person Household | 4 (100.0%) | 0 (0.0%) |
| 2-Person Household | 25 (100.0%) | 0 (0.0%) |
| 3-Person Household | 3 (100.0%) | 0 (0.0%) |
| 4+ Person Household | 5 (100.0%) | 0 (0.0%) |
| Total Housing Units | 37 (100.0%) | 0 (0.0%) |
Occupancy by Educational Attainment in Edie
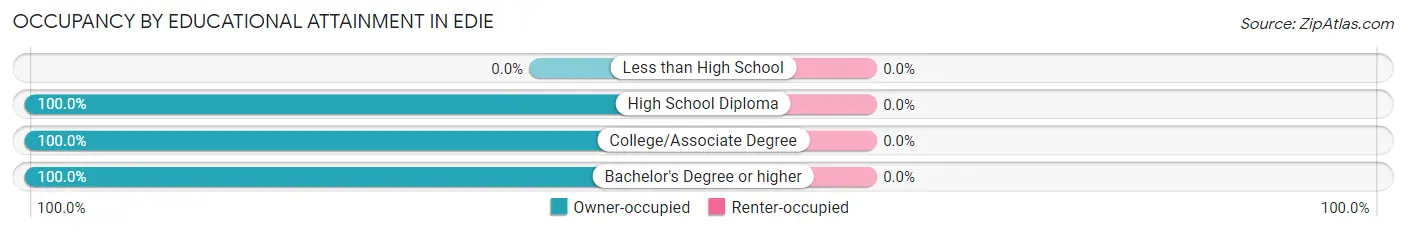
| Household Size | Owner-occupied | Renter-occupied |
| Less than High School | 0 (0.0%) | 0 (0.0%) |
| High School Diploma | 18 (100.0%) | 0 (0.0%) |
| College/Associate Degree | 8 (100.0%) | 0 (0.0%) |
| Bachelor's Degree or higher | 11 (100.0%) | 0 (0.0%) |
Occupancy by Age of Householder in Edie
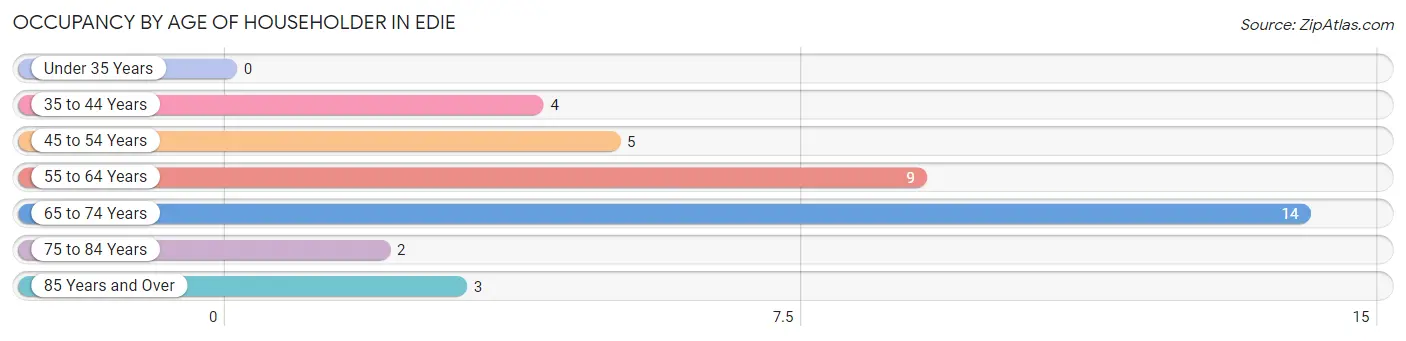
| Age Bracket | # Households | % Households |
| Under 35 Years | 0 | 0.0% |
| 35 to 44 Years | 4 | 10.8% |
| 45 to 54 Years | 5 | 13.5% |
| 55 to 64 Years | 9 | 24.3% |
| 65 to 74 Years | 14 | 37.8% |
| 75 to 84 Years | 2 | 5.4% |
| 85 Years and Over | 3 | 8.1% |
| Total | 37 | 100.0% |
Housing Finances in Edie
Median Income by Occupancy in Edie
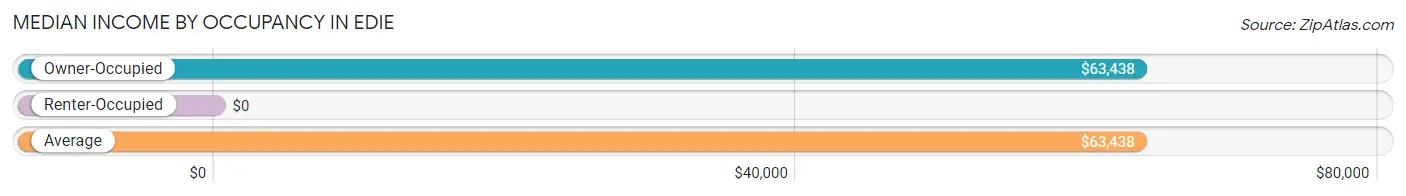
| Occupancy Type | # Households | Median Income |
| Owner-Occupied | 37 (100.0%) | $63,438 |
| Renter-Occupied | 0 (0.0%) | $0 |
| Average | 37 (100.0%) | $63,438 |
Occupancy by Householder Income Bracket in Edie
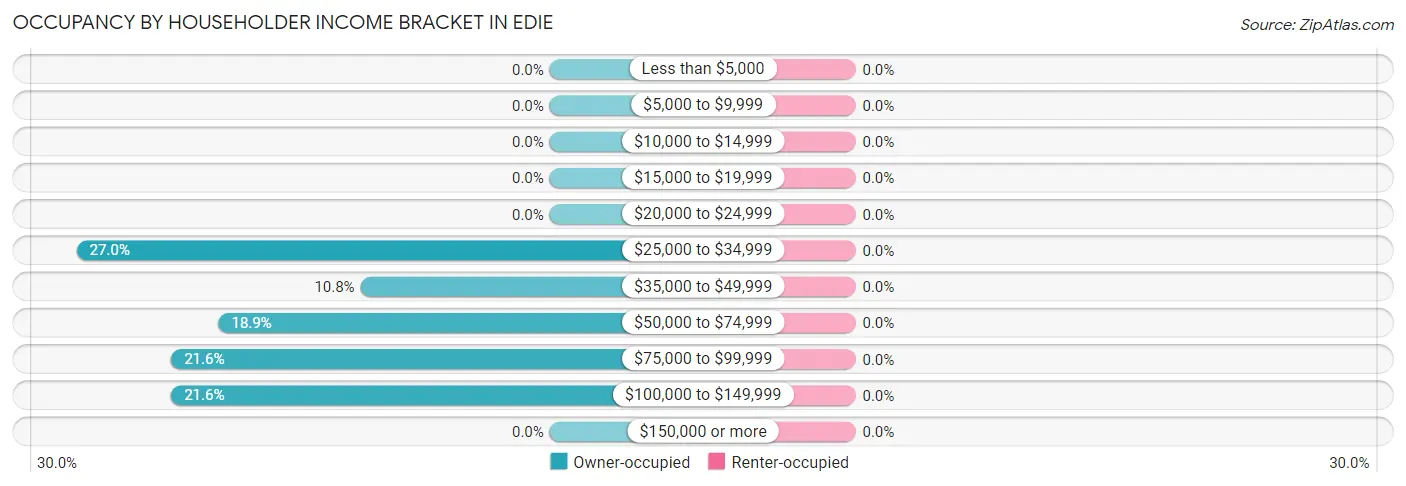
| Income Bracket | Owner-occupied | Renter-occupied |
| Less than $5,000 | 0 (0.0%) | 0 (0.0%) |
| $5,000 to $9,999 | 0 (0.0%) | 0 (0.0%) |
| $10,000 to $14,999 | 0 (0.0%) | 0 (0.0%) |
| $15,000 to $19,999 | 0 (0.0%) | 0 (0.0%) |
| $20,000 to $24,999 | 0 (0.0%) | 0 (0.0%) |
| $25,000 to $34,999 | 10 (27.0%) | 0 (0.0%) |
| $35,000 to $49,999 | 4 (10.8%) | 0 (0.0%) |
| $50,000 to $74,999 | 7 (18.9%) | 0 (0.0%) |
| $75,000 to $99,999 | 8 (21.6%) | 0 (0.0%) |
| $100,000 to $149,999 | 8 (21.6%) | 0 (0.0%) |
| $150,000 or more | 0 (0.0%) | 0 (0.0%) |
| Total | 37 (100.0%) | 0 (0.0%) |
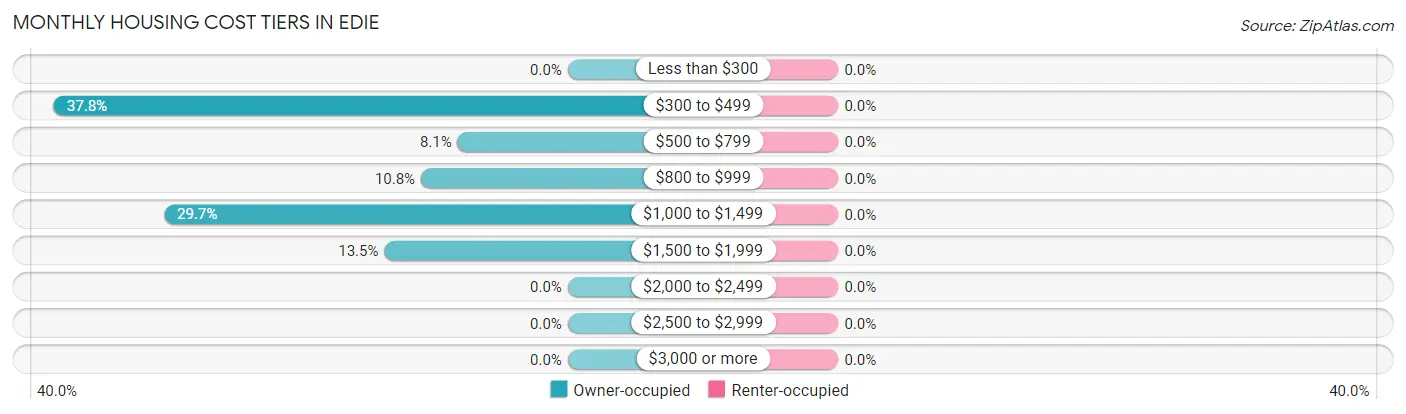
Monthly Housing Cost Tiers in Edie
| Monthly Cost | Owner-occupied | Renter-occupied |
| Less than $300 | 0 (0.0%) | 0 (0.0%) |
| $300 to $499 | 14 (37.8%) | 0 (0.0%) |
| $500 to $799 | 3 (8.1%) | 0 (0.0%) |
| $800 to $999 | 4 (10.8%) | 0 (0.0%) |
| $1,000 to $1,499 | 11 (29.7%) | 0 (0.0%) |
| $1,500 to $1,999 | 5 (13.5%) | 0 (0.0%) |
| $2,000 to $2,499 | 0 (0.0%) | 0 (0.0%) |
| $2,500 to $2,999 | 0 (0.0%) | 0 (0.0%) |
| $3,000 or more | 0 (0.0%) | 0 (0.0%) |
| Total | 37 (100.0%) | 0 (0.0%) |
Physical Housing Characteristics in Edie
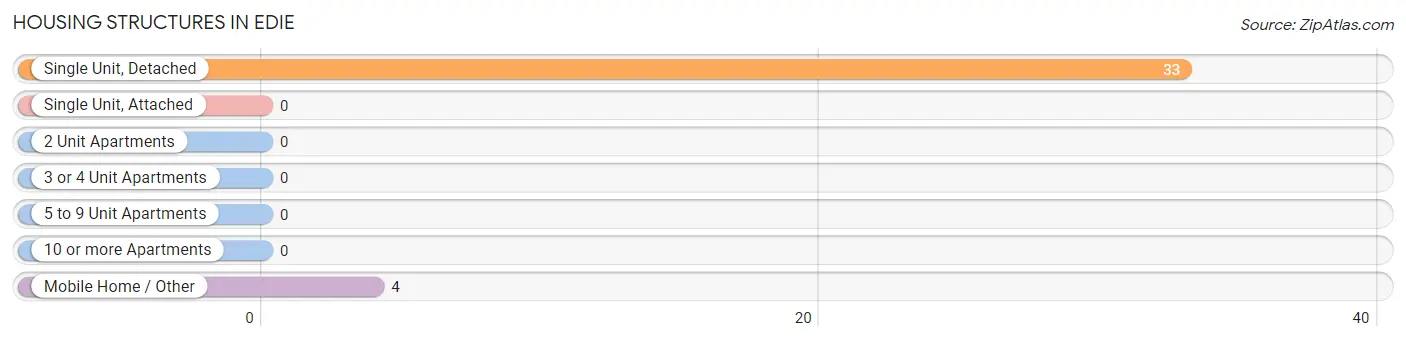
Housing Structures in Edie
| Structure Type | # Housing Units | % Housing Units |
| Single Unit, Detached | 33 | 89.2% |
| Single Unit, Attached | 0 | 0.0% |
| 2 Unit Apartments | 0 | 0.0% |
| 3 or 4 Unit Apartments | 0 | 0.0% |
| 5 to 9 Unit Apartments | 0 | 0.0% |
| 10 or more Apartments | 0 | 0.0% |
| Mobile Home / Other | 4 | 10.8% |
| Total | 37 | 100.0% |
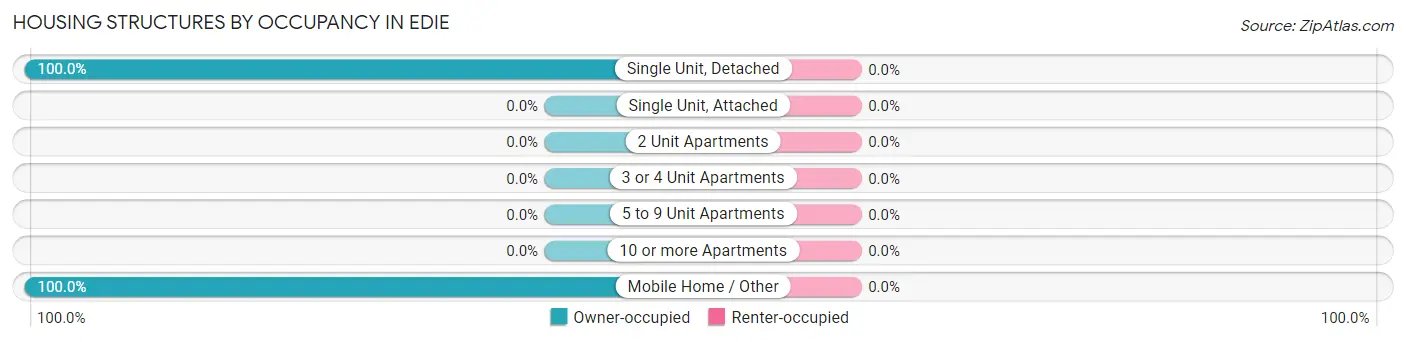
Housing Structures by Occupancy in Edie
| Structure Type | Owner-occupied | Renter-occupied |
| Single Unit, Detached | 33 (100.0%) | 0 (0.0%) |
| Single Unit, Attached | 0 (0.0%) | 0 (0.0%) |
| 2 Unit Apartments | 0 (0.0%) | 0 (0.0%) |
| 3 or 4 Unit Apartments | 0 (0.0%) | 0 (0.0%) |
| 5 to 9 Unit Apartments | 0 (0.0%) | 0 (0.0%) |
| 10 or more Apartments | 0 (0.0%) | 0 (0.0%) |
| Mobile Home / Other | 4 (100.0%) | 0 (0.0%) |
| Total | 37 (100.0%) | 0 (0.0%) |
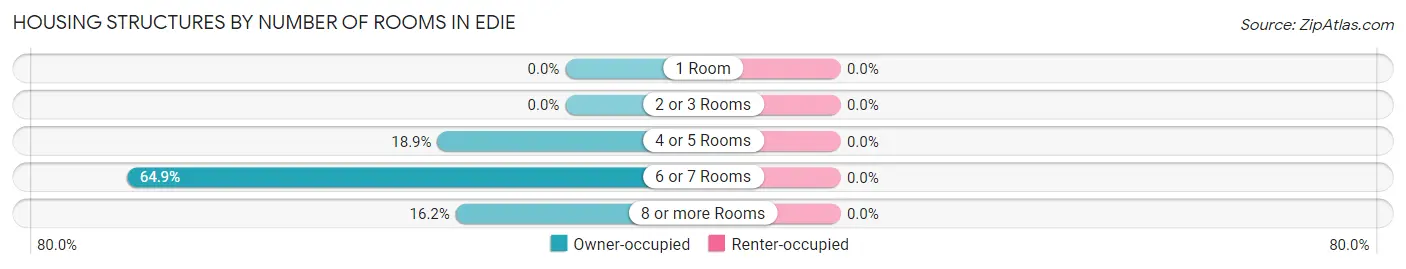
Housing Structures by Number of Rooms in Edie
| Number of Rooms | Owner-occupied | Renter-occupied |
| 1 Room | 0 (0.0%) | 0 (0.0%) |
| 2 or 3 Rooms | 0 (0.0%) | 0 (0.0%) |
| 4 or 5 Rooms | 7 (18.9%) | 0 (0.0%) |
| 6 or 7 Rooms | 24 (64.9%) | 0 (0.0%) |
| 8 or more Rooms | 6 (16.2%) | 0 (0.0%) |
| Total | 37 (100.0%) | 0 (0.0%) |
Housing Structure by Heating Type in Edie
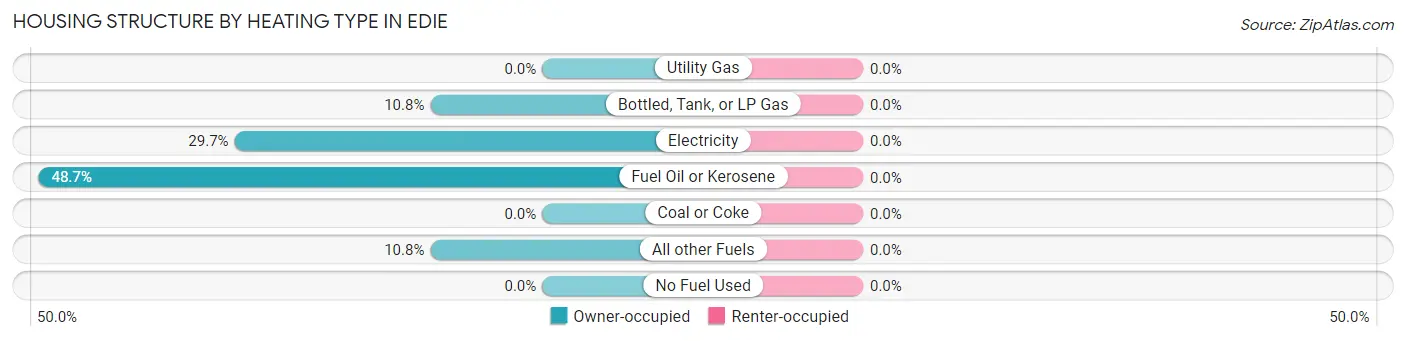
| Heating Type | Owner-occupied | Renter-occupied |
| Utility Gas | 0 (0.0%) | 0 (0.0%) |
| Bottled, Tank, or LP Gas | 4 (10.8%) | 0 (0.0%) |
| Electricity | 11 (29.7%) | 0 (0.0%) |
| Fuel Oil or Kerosene | 18 (48.6%) | 0 (0.0%) |
| Coal or Coke | 0 (0.0%) | 0 (0.0%) |
| All other Fuels | 4 (10.8%) | 0 (0.0%) |
| No Fuel Used | 0 (0.0%) | 0 (0.0%) |
| Total | 37 (100.0%) | 0 (0.0%) |
Household Vehicle Usage in Edie
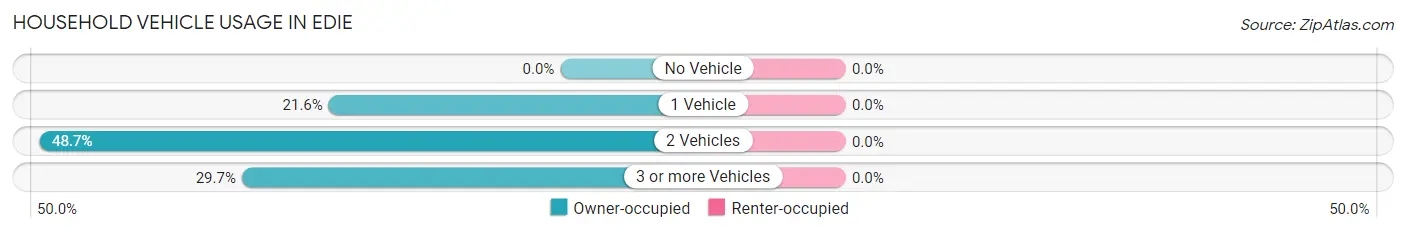
| Vehicles per Household | Owner-occupied | Renter-occupied |
| No Vehicle | 0 (0.0%) | 0 (0.0%) |
| 1 Vehicle | 8 (21.6%) | 0 (0.0%) |
| 2 Vehicles | 18 (48.6%) | 0 (0.0%) |
| 3 or more Vehicles | 11 (29.7%) | 0 (0.0%) |
| Total | 37 (100.0%) | 0 (0.0%) |
Real Estate & Mortgages in Edie
Real Estate and Mortgage Overview in Edie
| Characteristic | Without Mortgage | With Mortgage |
| Housing Units | 14 | 23 |
| Median Property Value | $88,800 | $143,800 |
| Median Household Income | - | - |
| Monthly Housing Costs | $450 | $0 |
| Real Estate Taxes | $2,500 | $4 |
Property Value by Mortgage Status in Edie
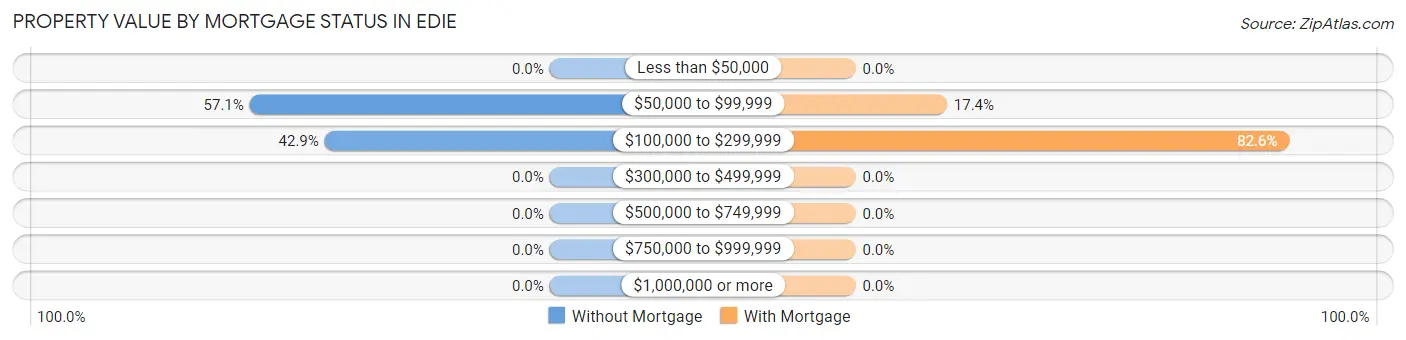
| Property Value | Without Mortgage | With Mortgage |
| Less than $50,000 | 0 (0.0%) | 0 (0.0%) |
| $50,000 to $99,999 | 8 (57.1%) | 4 (17.4%) |
| $100,000 to $299,999 | 6 (42.9%) | 19 (82.6%) |
| $300,000 to $499,999 | 0 (0.0%) | 0 (0.0%) |
| $500,000 to $749,999 | 0 (0.0%) | 0 (0.0%) |
| $750,000 to $999,999 | 0 (0.0%) | 0 (0.0%) |
| $1,000,000 or more | 0 (0.0%) | 0 (0.0%) |
| Total | 14 (100.0%) | 23 (100.0%) |
Household Income by Mortgage Status in Edie
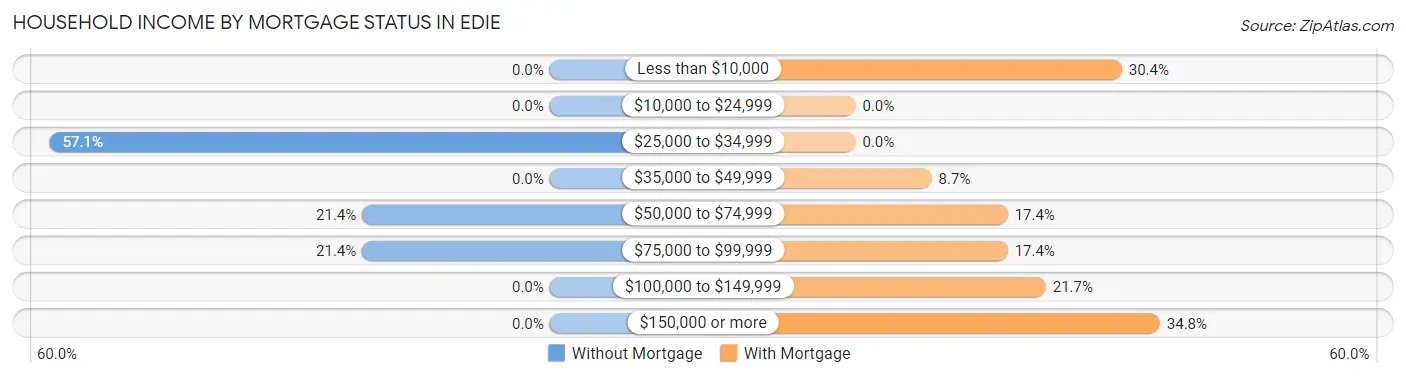
| Household Income | Without Mortgage | With Mortgage |
| Less than $10,000 | 0 (0.0%) | 7 (30.4%) |
| $10,000 to $24,999 | 0 (0.0%) | 0 (0.0%) |
| $25,000 to $34,999 | 8 (57.1%) | 0 (0.0%) |
| $35,000 to $49,999 | 0 (0.0%) | 2 (8.7%) |
| $50,000 to $74,999 | 3 (21.4%) | 4 (17.4%) |
| $75,000 to $99,999 | 3 (21.4%) | 4 (17.4%) |
| $100,000 to $149,999 | 0 (0.0%) | 5 (21.7%) |
| $150,000 or more | 0 (0.0%) | 8 (34.8%) |
| Total | 14 (100.0%) | 23 (100.0%) |
Property Value to Household Income Ratio in Edie
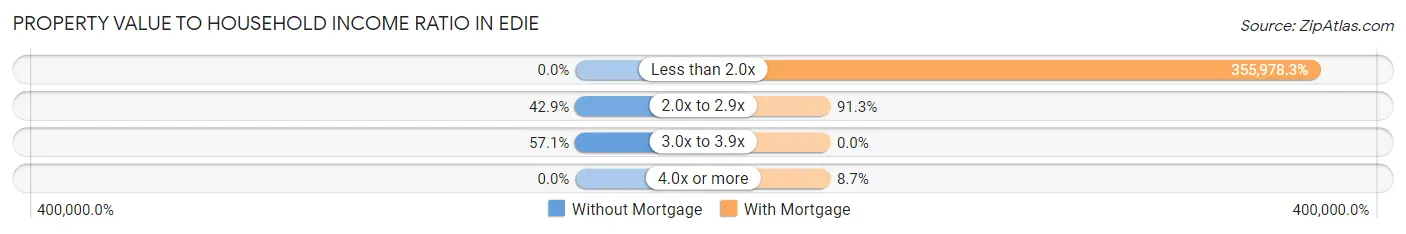
| Value-to-Income Ratio | Without Mortgage | With Mortgage |
| Less than 2.0x | 0 (0.0%) | 81,875 (355,978.3%) |
| 2.0x to 2.9x | 6 (42.9%) | 21 (91.3%) |
| 3.0x to 3.9x | 8 (57.1%) | 0 (0.0%) |
| 4.0x or more | 0 (0.0%) | 2 (8.7%) |
| Total | 14 (100.0%) | 23 (100.0%) |
Real Estate Taxes by Mortgage Status in Edie
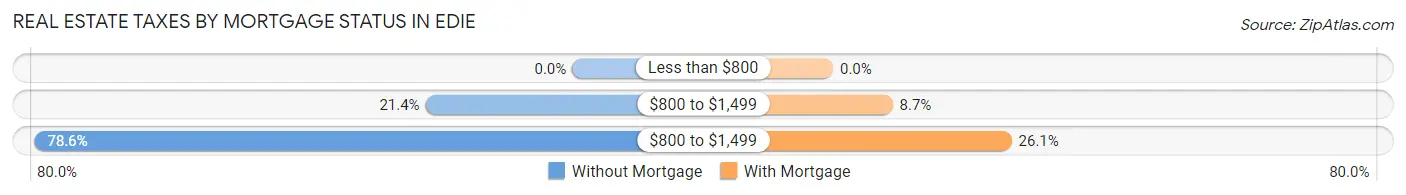
| Property Taxes | Without Mortgage | With Mortgage |
| Less than $800 | 0 (0.0%) | 0 (0.0%) |
| $800 to $1,499 | 3 (21.4%) | 2 (8.7%) |
| $800 to $1,499 | 11 (78.6%) | 6 (26.1%) |
| Total | 14 (100.0%) | 23 (100.0%) |
Health & Disability in Edie
Health Insurance Coverage by Age in Edie
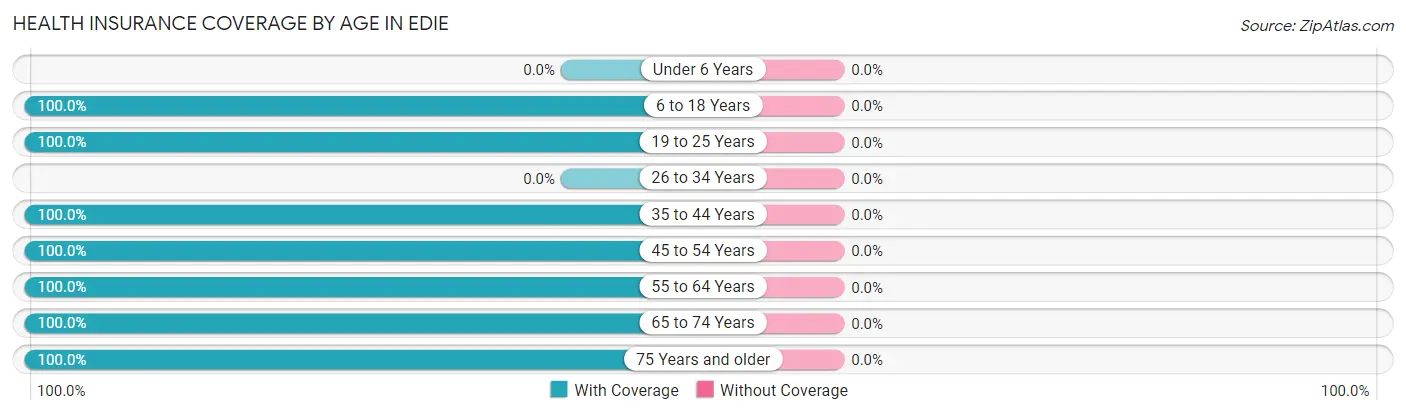
| Age Bracket | With Coverage | Without Coverage |
| Under 6 Years | 0 (0.0%) | 0 (0.0%) |
| 6 to 18 Years | 16 (100.0%) | 0 (0.0%) |
| 19 to 25 Years | 3 (100.0%) | 0 (0.0%) |
| 26 to 34 Years | 0 (0.0%) | 0 (0.0%) |
| 35 to 44 Years | 4 (100.0%) | 0 (0.0%) |
| 45 to 54 Years | 19 (100.0%) | 0 (0.0%) |
| 55 to 64 Years | 12 (100.0%) | 0 (0.0%) |
| 65 to 74 Years | 28 (100.0%) | 0 (0.0%) |
| 75 Years and older | 5 (100.0%) | 0 (0.0%) |
| Total | 87 (100.0%) | 0 (0.0%) |
Health Insurance Coverage by Citizenship Status in Edie
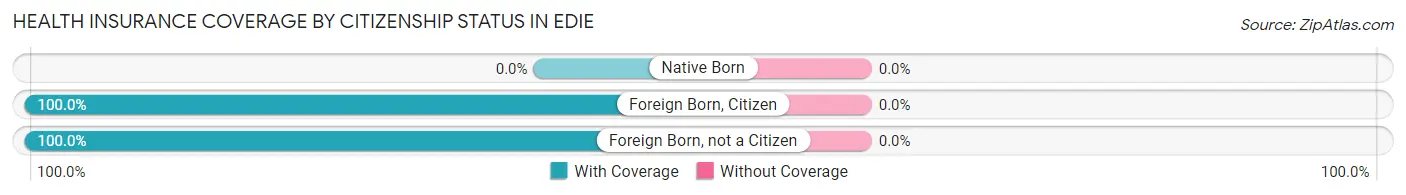
| Citizenship Status | With Coverage | Without Coverage |
| Native Born | 0 (0.0%) | 0 (0.0%) |
| Foreign Born, Citizen | 16 (100.0%) | 0 (0.0%) |
| Foreign Born, not a Citizen | 3 (100.0%) | 0 (0.0%) |
Health Insurance Coverage by Household Income in Edie
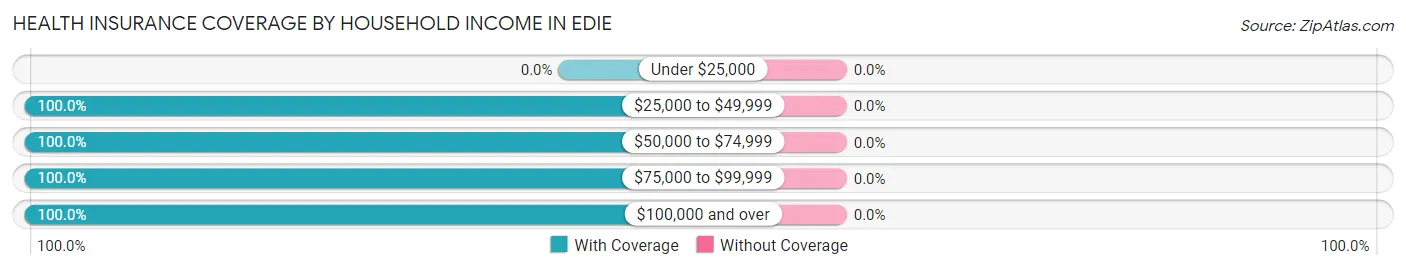
| Household Income | With Coverage | Without Coverage |
| Under $25,000 | 0 (0.0%) | 0 (0.0%) |
| $25,000 to $49,999 | 27 (100.0%) | 0 (0.0%) |
| $50,000 to $74,999 | 13 (100.0%) | 0 (0.0%) |
| $75,000 to $99,999 | 15 (100.0%) | 0 (0.0%) |
| $100,000 and over | 32 (100.0%) | 0 (0.0%) |
Public vs Private Health Insurance Coverage by Age in Edie
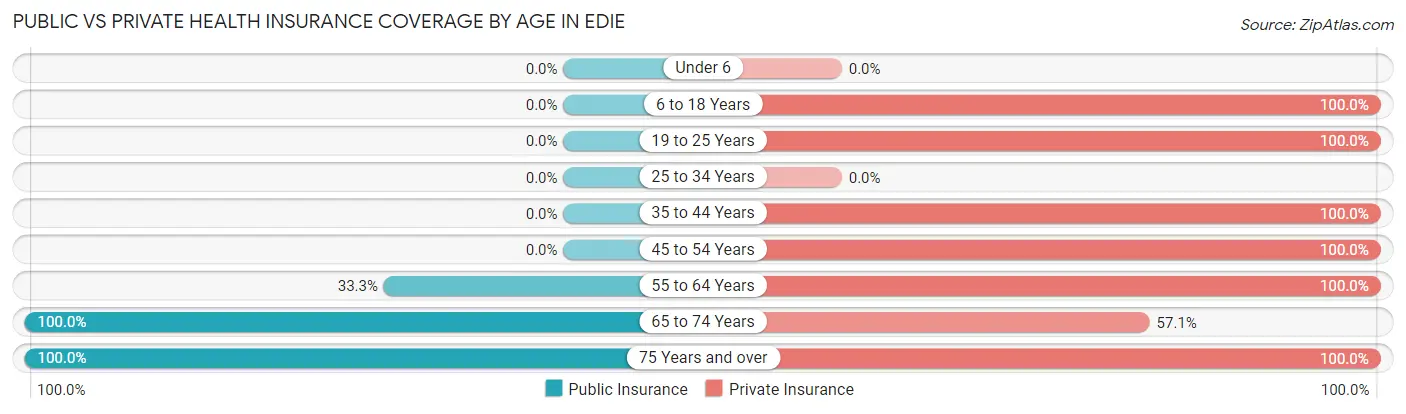
| Age Bracket | Public Insurance | Private Insurance |
| Under 6 | 0 (0.0%) | 0 (0.0%) |
| 6 to 18 Years | 0 (0.0%) | 16 (100.0%) |
| 19 to 25 Years | 0 (0.0%) | 3 (100.0%) |
| 25 to 34 Years | 0 (0.0%) | 0 (0.0%) |
| 35 to 44 Years | 0 (0.0%) | 4 (100.0%) |
| 45 to 54 Years | 0 (0.0%) | 19 (100.0%) |
| 55 to 64 Years | 4 (33.3%) | 12 (100.0%) |
| 65 to 74 Years | 28 (100.0%) | 16 (57.1%) |
| 75 Years and over | 5 (100.0%) | 5 (100.0%) |
| Total | 37 (42.5%) | 75 (86.2%) |
Disability Status by Sex by Age in Edie
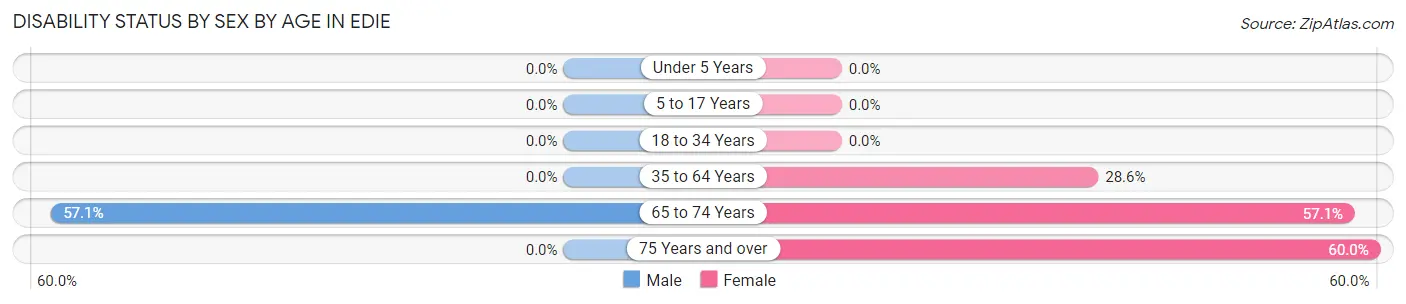
| Age Bracket | Male | Female |
| Under 5 Years | 0 (0.0%) | 0 (0.0%) |
| 5 to 17 Years | 0 (0.0%) | 0 (0.0%) |
| 18 to 34 Years | 0 (0.0%) | 0 (0.0%) |
| 35 to 64 Years | 0 (0.0%) | 4 (28.6%) |
| 65 to 74 Years | 8 (57.1%) | 8 (57.1%) |
| 75 Years and over | 0 (0.0%) | 3 (60.0%) |
Disability Class by Sex by Age in Edie
Disability Class: Hearing Difficulty
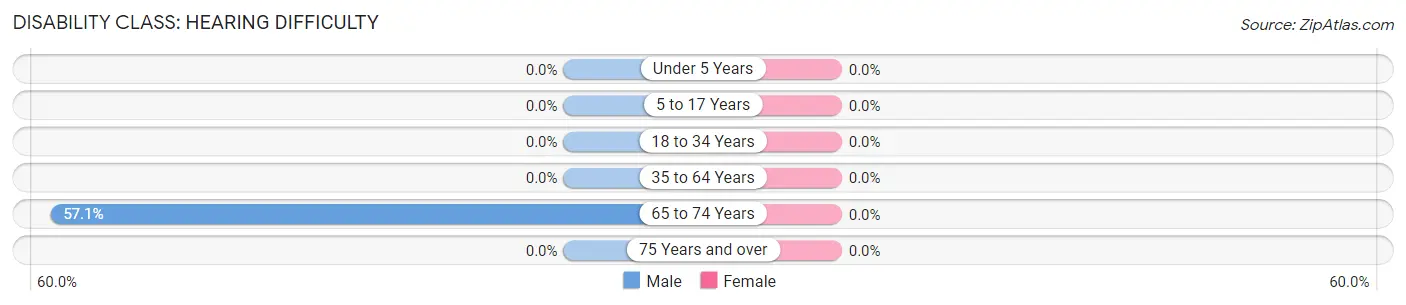
| Age Bracket | Male | Female |
| Under 5 Years | 0 (0.0%) | 0 (0.0%) |
| 5 to 17 Years | 0 (0.0%) | 0 (0.0%) |
| 18 to 34 Years | 0 (0.0%) | 0 (0.0%) |
| 35 to 64 Years | 0 (0.0%) | 0 (0.0%) |
| 65 to 74 Years | 8 (57.1%) | 0 (0.0%) |
| 75 Years and over | 0 (0.0%) | 0 (0.0%) |
Disability Class: Vision Difficulty
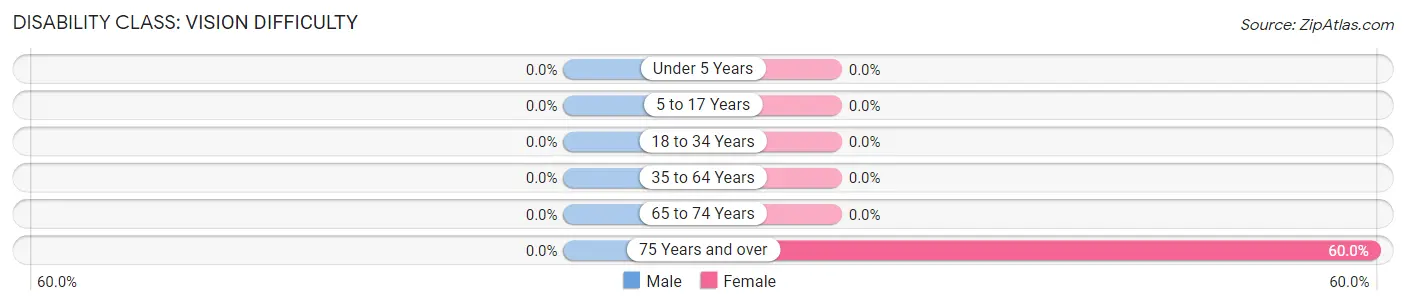
| Age Bracket | Male | Female |
| Under 5 Years | 0 (0.0%) | 0 (0.0%) |
| 5 to 17 Years | 0 (0.0%) | 0 (0.0%) |
| 18 to 34 Years | 0 (0.0%) | 0 (0.0%) |
| 35 to 64 Years | 0 (0.0%) | 0 (0.0%) |
| 65 to 74 Years | 0 (0.0%) | 0 (0.0%) |
| 75 Years and over | 0 (0.0%) | 3 (60.0%) |
Disability Class: Cognitive Difficulty
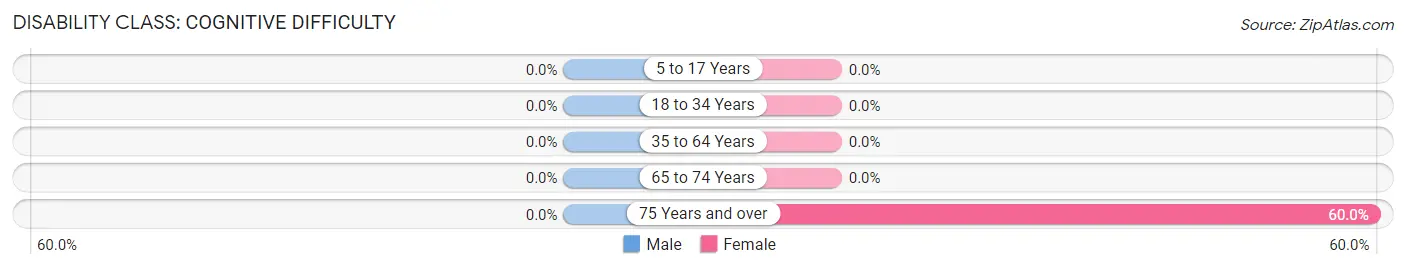
| Age Bracket | Male | Female |
| 5 to 17 Years | 0 (0.0%) | 0 (0.0%) |
| 18 to 34 Years | 0 (0.0%) | 0 (0.0%) |
| 35 to 64 Years | 0 (0.0%) | 0 (0.0%) |
| 65 to 74 Years | 0 (0.0%) | 0 (0.0%) |
| 75 Years and over | 0 (0.0%) | 3 (60.0%) |
Disability Class: Ambulatory Difficulty
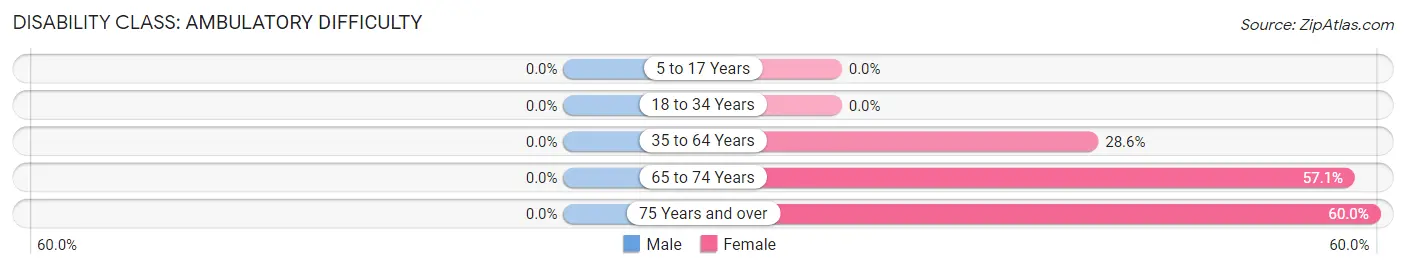
| Age Bracket | Male | Female |
| 5 to 17 Years | 0 (0.0%) | 0 (0.0%) |
| 18 to 34 Years | 0 (0.0%) | 0 (0.0%) |
| 35 to 64 Years | 0 (0.0%) | 4 (28.6%) |
| 65 to 74 Years | 0 (0.0%) | 8 (57.1%) |
| 75 Years and over | 0 (0.0%) | 3 (60.0%) |
Disability Class: Self-Care Difficulty
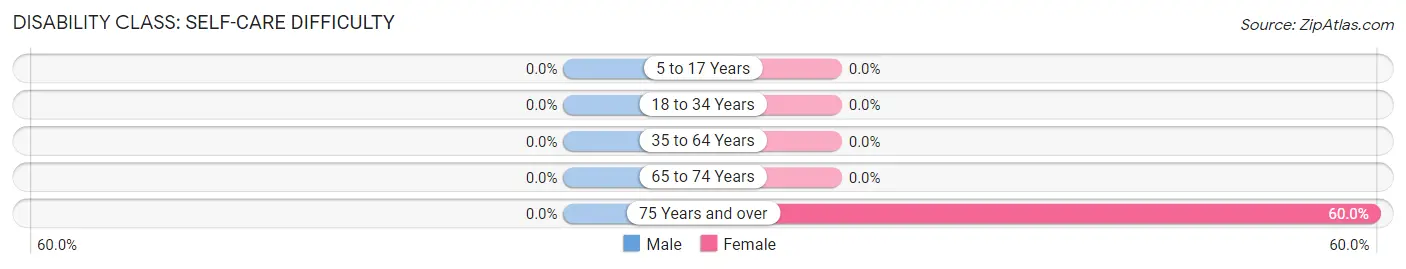
| Age Bracket | Male | Female |
| 5 to 17 Years | 0 (0.0%) | 0 (0.0%) |
| 18 to 34 Years | 0 (0.0%) | 0 (0.0%) |
| 35 to 64 Years | 0 (0.0%) | 0 (0.0%) |
| 65 to 74 Years | 0 (0.0%) | 0 (0.0%) |
| 75 Years and over | 0 (0.0%) | 3 (60.0%) |
Technology Access in Edie
Computing Device Access in Edie
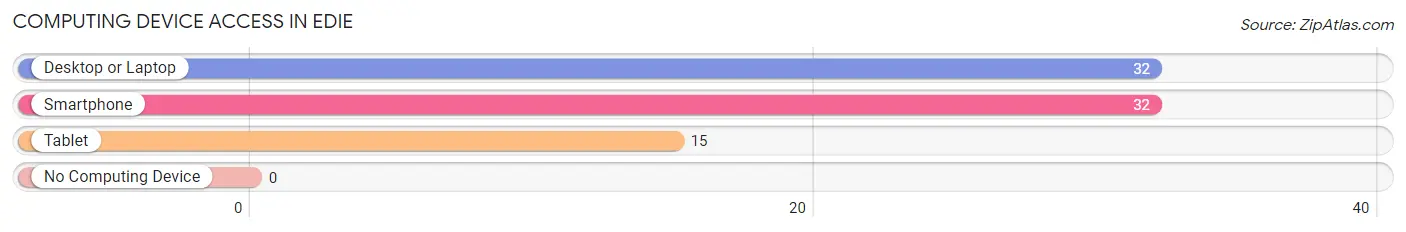
| Device Type | # Households | % Households |
| Desktop or Laptop | 32 | 86.5% |
| Smartphone | 32 | 86.5% |
| Tablet | 15 | 40.5% |
| No Computing Device | 0 | 0.0% |
| Total | 37 | 100.0% |
Internet Access in Edie
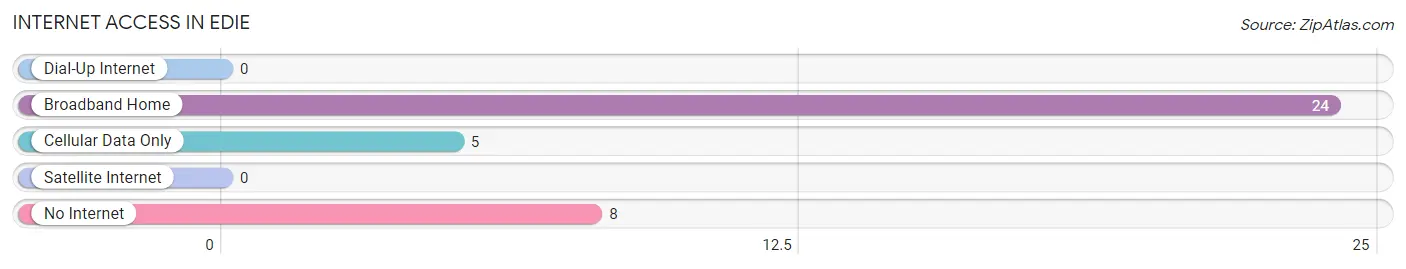
| Internet Type | # Households | % Households |
| Dial-Up Internet | 0 | 0.0% |
| Broadband Home | 24 | 64.9% |
| Cellular Data Only | 5 | 13.5% |
| Satellite Internet | 0 | 0.0% |
| No Internet | 8 | 21.6% |
| Total | 37 | 100.0% |
Edie Summary
Edie is a small borough located in Westmoreland County, Pennsylvania. It is situated in the foothills of the Allegheny Mountains, approximately 30 miles southeast of Pittsburgh. The borough has a population of 1,845 as of the 2010 census, and is part of the Greater Pittsburgh Metropolitan Area.
History
Edie was founded in 1845 by a group of settlers from the nearby town of Greensburg. The town was named after the daughter of one of the settlers, Edie Miller. The town was originally a farming community, but in the late 19th century, the town began to develop into a small industrial center. The first industry to be established in Edie was a sawmill, which was built in 1876. This was followed by a brickyard, a coal mine, and a glass factory.
Geography
Edie is located in the foothills of the Allegheny Mountains, approximately 30 miles southeast of Pittsburgh. The borough is situated on the banks of the Loyalhanna Creek, which flows through the town. The terrain of the borough is mostly hilly, with some flat areas in the center of town. The borough is surrounded by the townships of Hempfield, Unity, and Ligonier.
Climate
Edie has a humid continental climate, with cold winters and hot, humid summers. The average annual temperature is around 50°F (10°C). The average annual precipitation is around 40 inches (101 cm).
Demographics
As of the 2010 census, Edie had a population of 1,845. The racial makeup of the borough was 97.3% White, 0.7% African American, 0.3% Native American, 0.2% Asian, 0.1% from other races, and 1.4% from two or more races. Hispanic or Latino of any race were 0.7% of the population.
Economy
Edie’s economy is largely based on agriculture and light industry. The borough is home to several small businesses, including a sawmill, a brickyard, a coal mine, and a glass factory. The borough also has a few retail stores, restaurants, and other services. The borough is also home to a small airport, which serves the surrounding area.
Conclusion
Edie is a small borough located in Westmoreland County, Pennsylvania. It is situated in the foothills of the Allegheny Mountains, approximately 30 miles southeast of Pittsburgh. The borough has a population of 1,845 as of the 2010 census, and is part of the Greater Pittsburgh Metropolitan Area. Edie’s economy is largely based on agriculture and light industry, and the borough is home to several small businesses, including a sawmill, a brickyard, a coal mine, and a glass factory. The borough also has a few retail stores, restaurants, and other services. Edie has a humid continental climate, with cold winters and hot, humid summers. The racial makeup of the borough was 97.3% White, 0.7% African American, 0.3% Native American, 0.2% Asian, 0.1% from other races, and 1.4% from two or more races.
Common Questions
What is Per Capita Income in Edie?
Per Capita income in Edie is $30,005.
What is the Median Family Income in Edie?
Median Family Income in Edie is $63,438.
What is the Median Household income in Edie?
Median Household Income in Edie is $63,438.
What is Income or Wage Gap in Edie?
Income or Wage Gap in Edie is 39.7%.
Women in Edie earn 60.3 cents for every dollar earned by a man.
What is Inequality or Gini Index in Edie?
Inequality or Gini Index in Edie is 0.30.
What is the Total Population of Edie?
Total Population of Edie is 87.
What is the Total Male Population of Edie?
Total Male Population of Edie is 40.
What is the Total Female Population of Edie?
Total Female Population of Edie is 47.
What is the Ratio of Males per 100 Females in Edie?
There are 85.11 Males per 100 Females in Edie.
What is the Ratio of Females per 100 Males in Edie?
There are 117.50 Females per 100 Males in Edie.
What is the Median Population Age in Edie?
Median Population Age in Edie is 58.3 Years.
What is the Average Family Size in Edie
Average Family Size in Edie is 2.5 People.
What is the Average Household Size in Edie
Average Household Size in Edie is 2.4 People.
How Large is the Labor Force in Edie?
There are 37 People in the Labor Forcein in Edie.
What is the Percentage of People in the Labor Force in Edie?
52.1% of People are in the Labor Force in Edie.