Clay Springs, AZ Map & Demographics
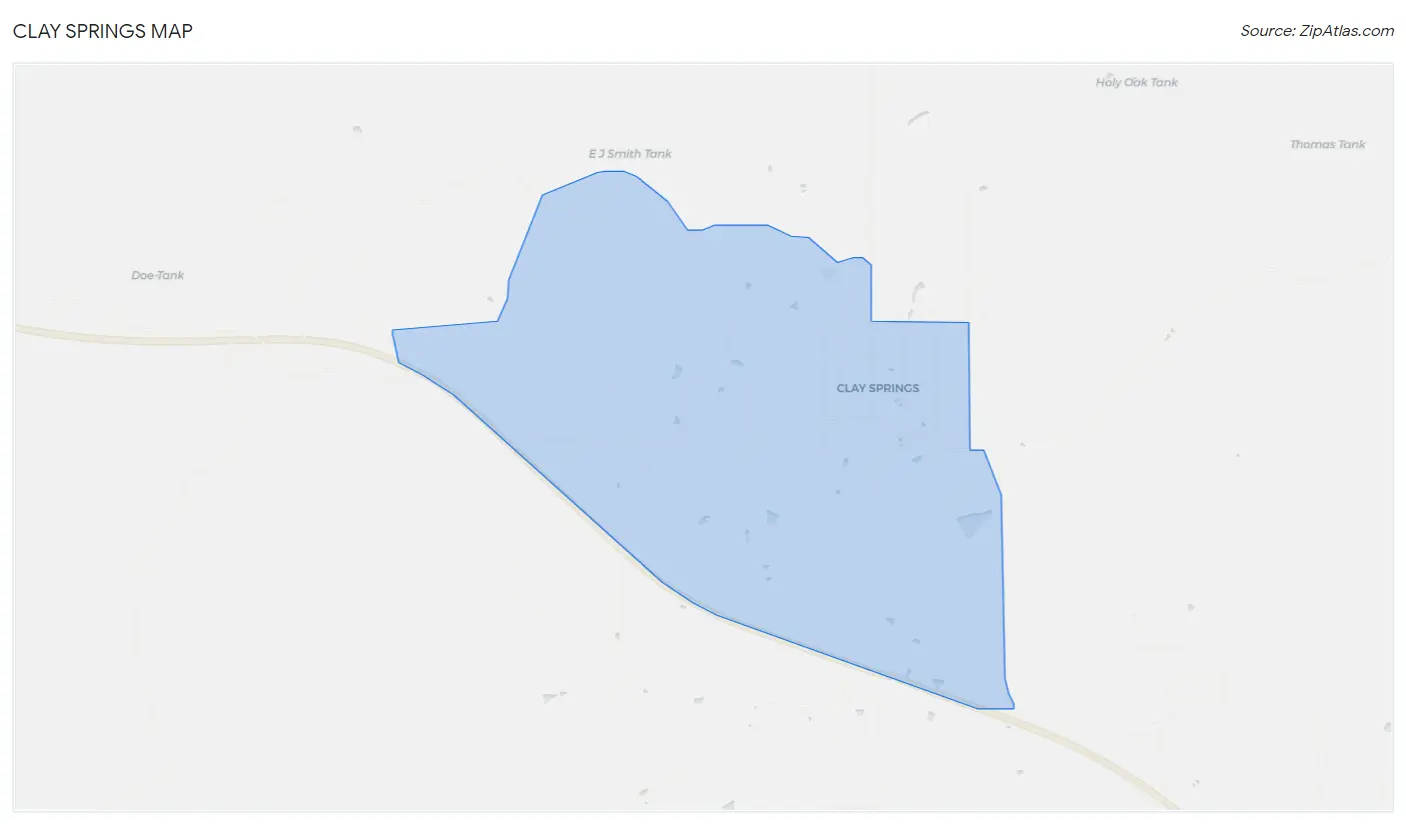
Clay Springs Map
Clay Springs Overview
$31,009
PER CAPITA INCOME
$74,750
AVG FAMILY INCOME
$50,724
AVG HOUSEHOLD INCOME
0.35
INEQUALITY / GINI INDEX
300
TOTAL POPULATION
167
MALE POPULATION
133
FEMALE POPULATION
125.56
MALES / 100 FEMALES
79.64
FEMALES / 100 MALES
63.1
MEDIAN AGE
2.5
AVG FAMILY SIZE
1.9
AVG HOUSEHOLD SIZE
104
LABOR FORCE [ PEOPLE ]
38.0%
PERCENT IN LABOR FORCE
15.4%
UNEMPLOYMENT RATE
Clay Springs Zip Codes
Clay Springs Area Codes
Income in Clay Springs
Income Overview in Clay Springs
Per Capita Income in Clay Springs is $31,009, while median incomes of families and households are $74,750 and $50,724 respectively.
| Characteristic | Number | Measure |
| Per Capita Income | 300 | $31,009 |
| Median Family Income | 83 | $74,750 |
| Mean Family Income | 83 | $83,993 |
| Median Household Income | 155 | $50,724 |
| Mean Household Income | 155 | $56,753 |
| Income Deficit | 83 | $0 |
| Wage / Income Gap (%) | 300 | 0.00% |
| Wage / Income Gap ($) | 300 | 100.00¢ per $1 |
| Gini / Inequality Index | 300 | 0.35 |
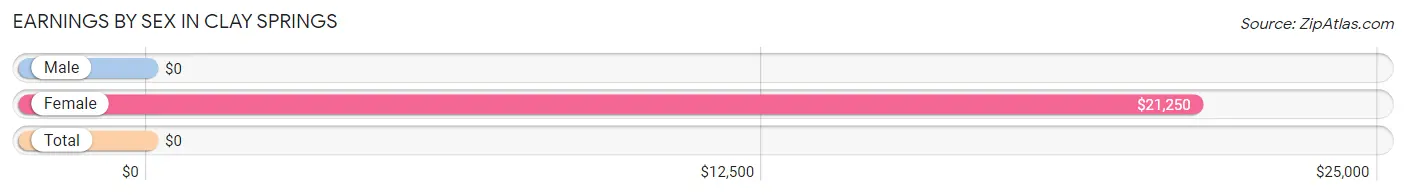
Earnings by Sex in Clay Springs
| Sex | Number | Average Earnings |
| Male | 37 (29.6%) | $0 |
| Female | 88 (70.4%) | $21,250 |
| Total | 125 (100.0%) | $0 |
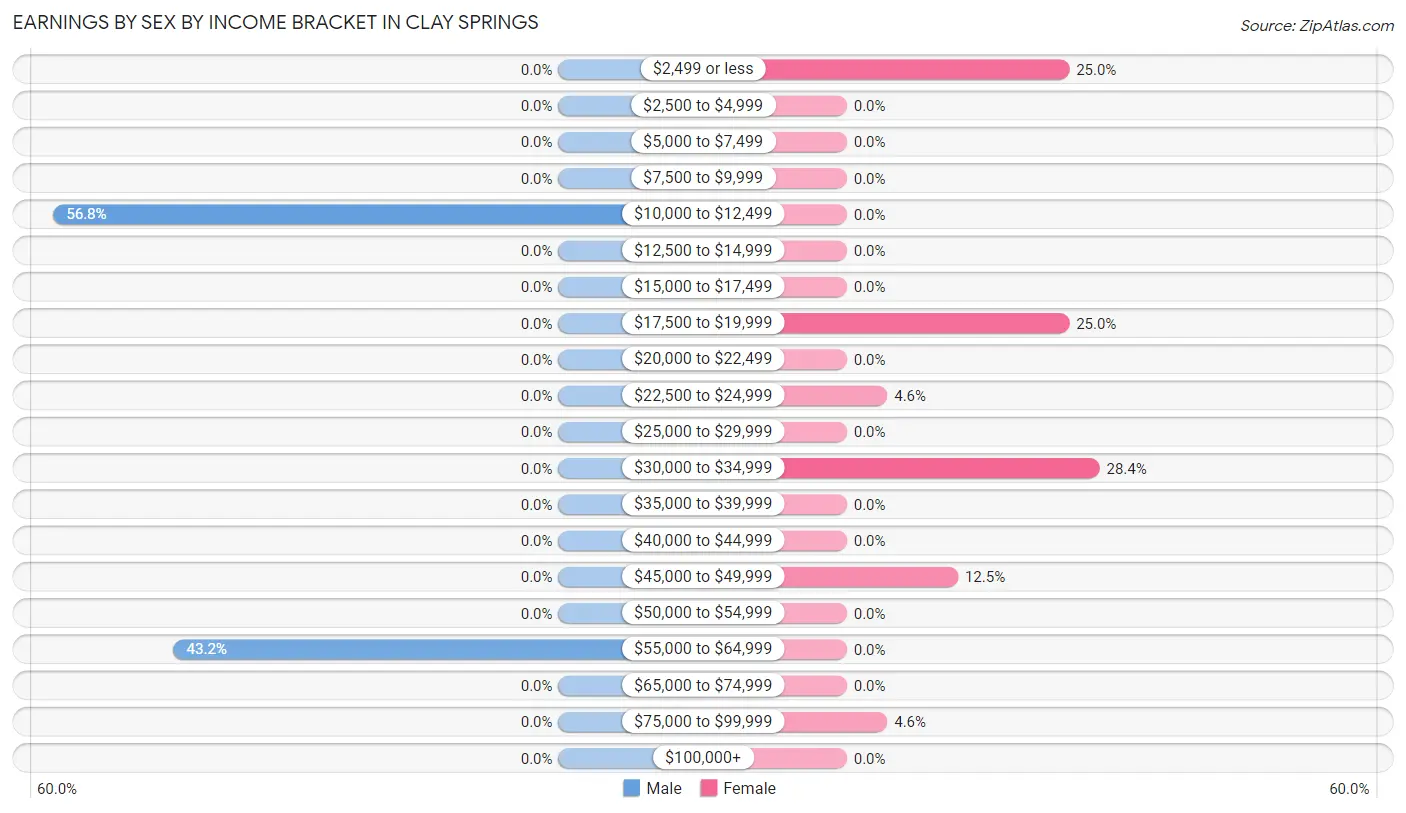
Earnings by Sex by Income Bracket in Clay Springs
The most common earnings brackets in Clay Springs are $10,000 to $12,499 for men (21 | 56.8%) and $30,000 to $34,999 for women (25 | 28.4%).
| Income | Male | Female |
| $2,499 or less | 0 (0.0%) | 22 (25.0%) |
| $2,500 to $4,999 | 0 (0.0%) | 0 (0.0%) |
| $5,000 to $7,499 | 0 (0.0%) | 0 (0.0%) |
| $7,500 to $9,999 | 0 (0.0%) | 0 (0.0%) |
| $10,000 to $12,499 | 21 (56.8%) | 0 (0.0%) |
| $12,500 to $14,999 | 0 (0.0%) | 0 (0.0%) |
| $15,000 to $17,499 | 0 (0.0%) | 0 (0.0%) |
| $17,500 to $19,999 | 0 (0.0%) | 22 (25.0%) |
| $20,000 to $22,499 | 0 (0.0%) | 0 (0.0%) |
| $22,500 to $24,999 | 0 (0.0%) | 4 (4.5%) |
| $25,000 to $29,999 | 0 (0.0%) | 0 (0.0%) |
| $30,000 to $34,999 | 0 (0.0%) | 25 (28.4%) |
| $35,000 to $39,999 | 0 (0.0%) | 0 (0.0%) |
| $40,000 to $44,999 | 0 (0.0%) | 0 (0.0%) |
| $45,000 to $49,999 | 0 (0.0%) | 11 (12.5%) |
| $50,000 to $54,999 | 0 (0.0%) | 0 (0.0%) |
| $55,000 to $64,999 | 16 (43.2%) | 0 (0.0%) |
| $65,000 to $74,999 | 0 (0.0%) | 0 (0.0%) |
| $75,000 to $99,999 | 0 (0.0%) | 4 (4.5%) |
| $100,000+ | 0 (0.0%) | 0 (0.0%) |
| Total | 37 (100.0%) | 88 (100.0%) |
Earnings by Sex by Educational Attainment in Clay Springs
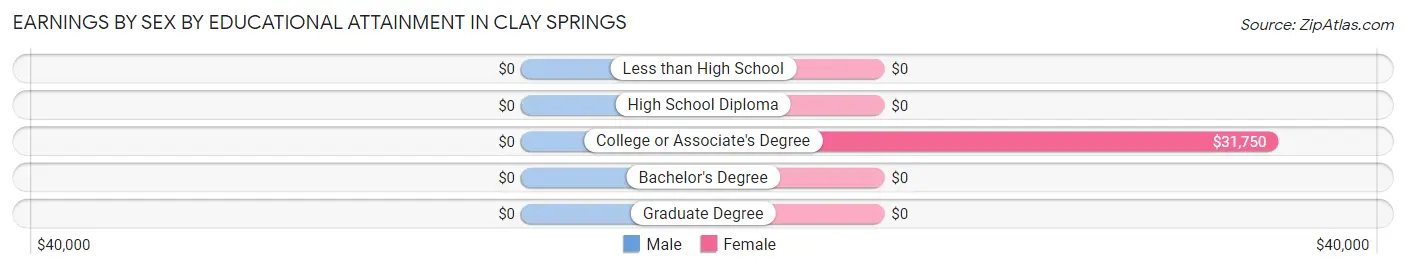
| Educational Attainment | Male Income | Female Income |
| Less than High School | - | - |
| High School Diploma | - | - |
| College or Associate's Degree | - | - |
| Bachelor's Degree | - | - |
| Graduate Degree | - | - |
| Total | - | - |
Family Income in Clay Springs
Family Income Brackets in Clay Springs
According to the Clay Springs family income data, there are 44 families falling into the $50,000 to $74,999 income range, which is the most common income bracket and makes up 53.0% of all families.
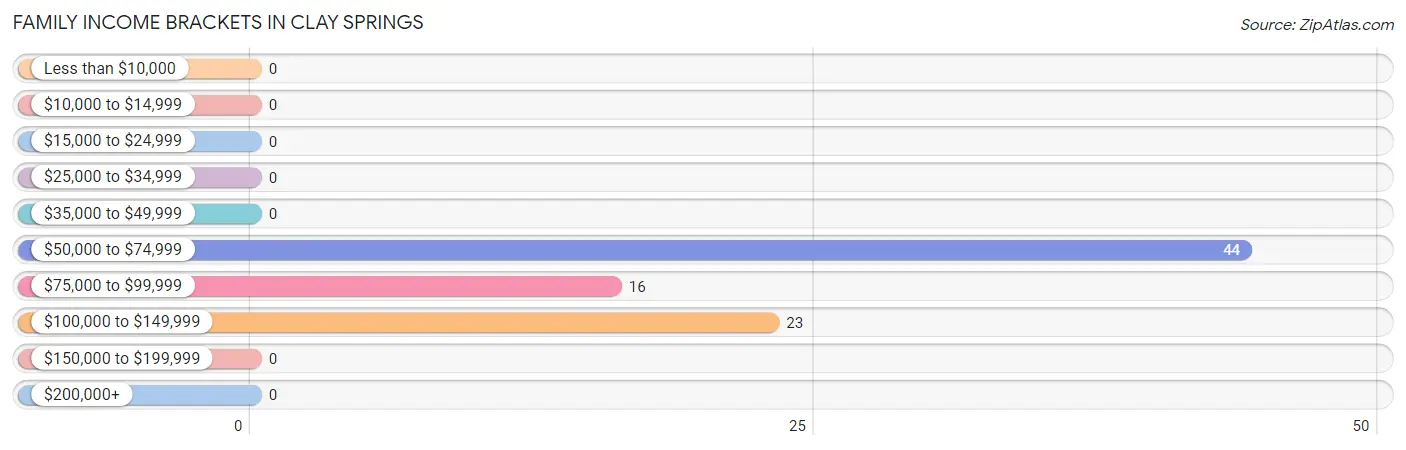
| Income Bracket | # Families | % Families |
| Less than $10,000 | 0 | 0.0% |
| $10,000 to $14,999 | 0 | 0.0% |
| $15,000 to $24,999 | 0 | 0.0% |
| $25,000 to $34,999 | 0 | 0.0% |
| $35,000 to $49,999 | 0 | 0.0% |
| $50,000 to $74,999 | 44 | 53.0% |
| $75,000 to $99,999 | 16 | 19.3% |
| $100,000 to $149,999 | 23 | 27.7% |
| $150,000 to $199,999 | 0 | 0.0% |
| $200,000+ | 0 | 0.0% |
Family Income by Famaliy Size in Clay Springs
2-person families (66 | 79.5%) account for the highest median family income in Clay Springs with $73,900 per family, while 2-person families (66 | 79.5%) have the highest median income of $36,950 per family member.
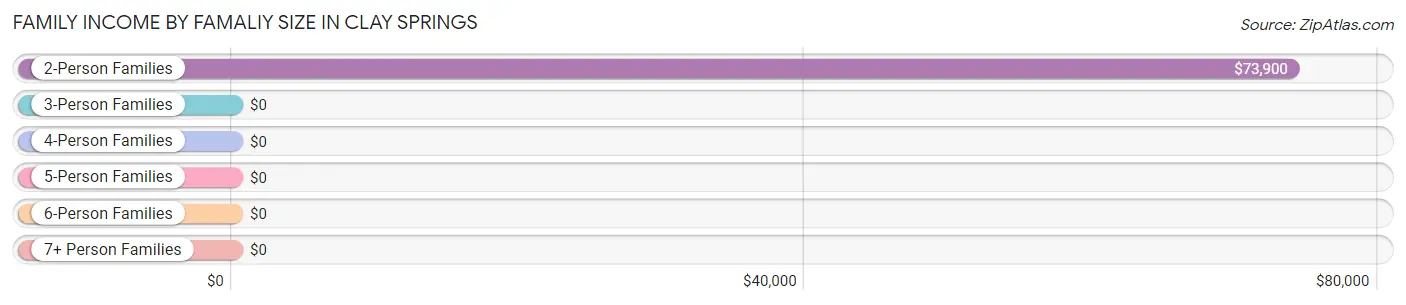
| Income Bracket | # Families | Median Income |
| 2-Person Families | 66 (79.5%) | $73,900 |
| 3-Person Families | 16 (19.3%) | $0 |
| 4-Person Families | 1 (1.2%) | $0 |
| 5-Person Families | 0 (0.0%) | $0 |
| 6-Person Families | 0 (0.0%) | $0 |
| 7+ Person Families | 0 (0.0%) | $0 |
| Total | 83 (100.0%) | $74,750 |
Family Income by Number of Earners in Clay Springs
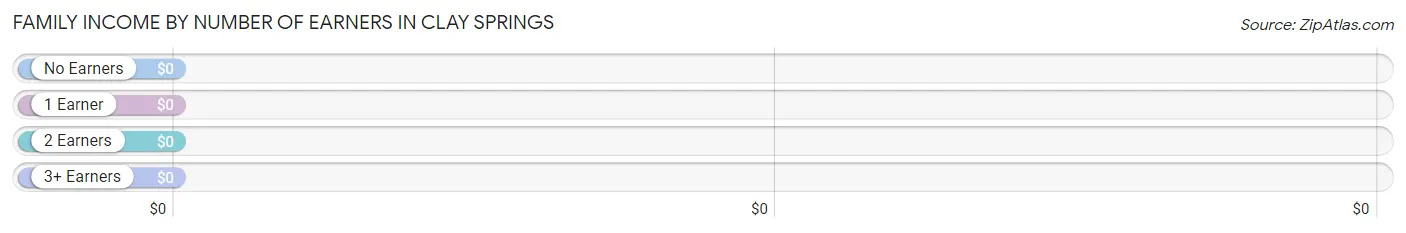
| Number of Earners | # Families | Median Income |
| No Earners | 19 (22.9%) | $0 |
| 1 Earner | 47 (56.6%) | $0 |
| 2 Earners | 16 (19.3%) | $0 |
| 3+ Earners | 1 (1.2%) | $0 |
| Total | 83 (100.0%) | $74,750 |
Household Income in Clay Springs
Household Income Brackets in Clay Springs
With 44 households falling in the category, the $50,000 to $74,999 income range is the most frequent in Clay Springs, accounting for 28.4% of all households.
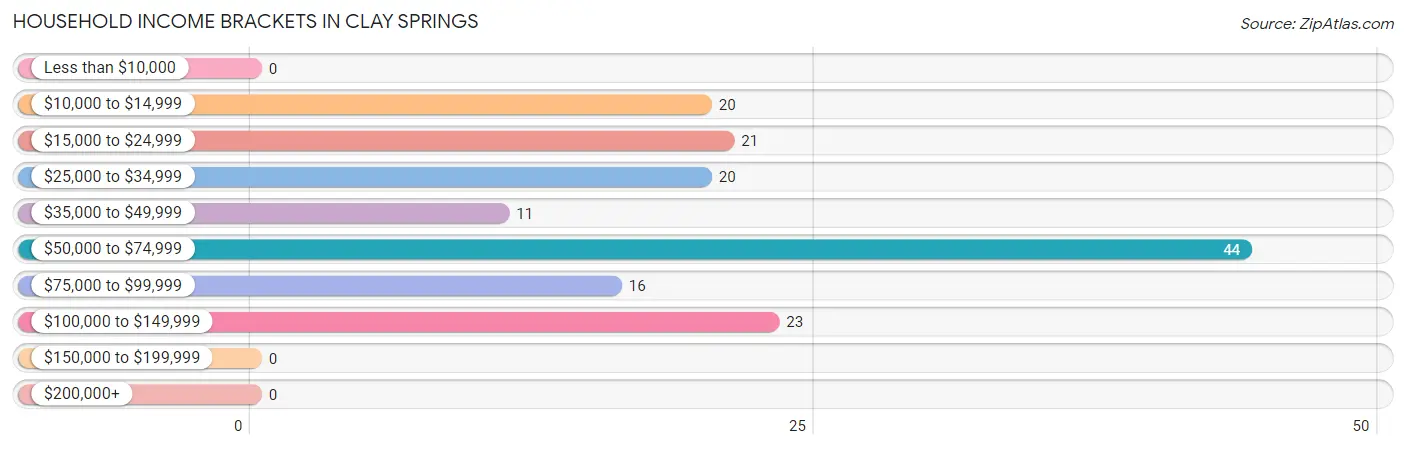
| Income Bracket | # Households | % Households |
| Less than $10,000 | 0 | 0.0% |
| $10,000 to $14,999 | 20 | 12.9% |
| $15,000 to $24,999 | 21 | 13.5% |
| $25,000 to $34,999 | 20 | 12.9% |
| $35,000 to $49,999 | 11 | 7.1% |
| $50,000 to $74,999 | 44 | 28.4% |
| $75,000 to $99,999 | 16 | 10.3% |
| $100,000 to $149,999 | 23 | 14.8% |
| $150,000 to $199,999 | 0 | 0.0% |
| $200,000+ | 0 | 0.0% |
Household Income by Householder Age in Clay Springs
| Income Bracket | # Households | Median Income |
| 15 to 24 Years | 0 (0.0%) | $0 |
| 25 to 44 Years | 16 (10.3%) | $0 |
| 45 to 64 Years | 77 (49.7%) | $0 |
| 65+ Years | 62 (40.0%) | $0 |
| Total | 155 (100.0%) | $50,724 |
Poverty in Clay Springs
Income Below Poverty by Sex and Age in Clay Springs
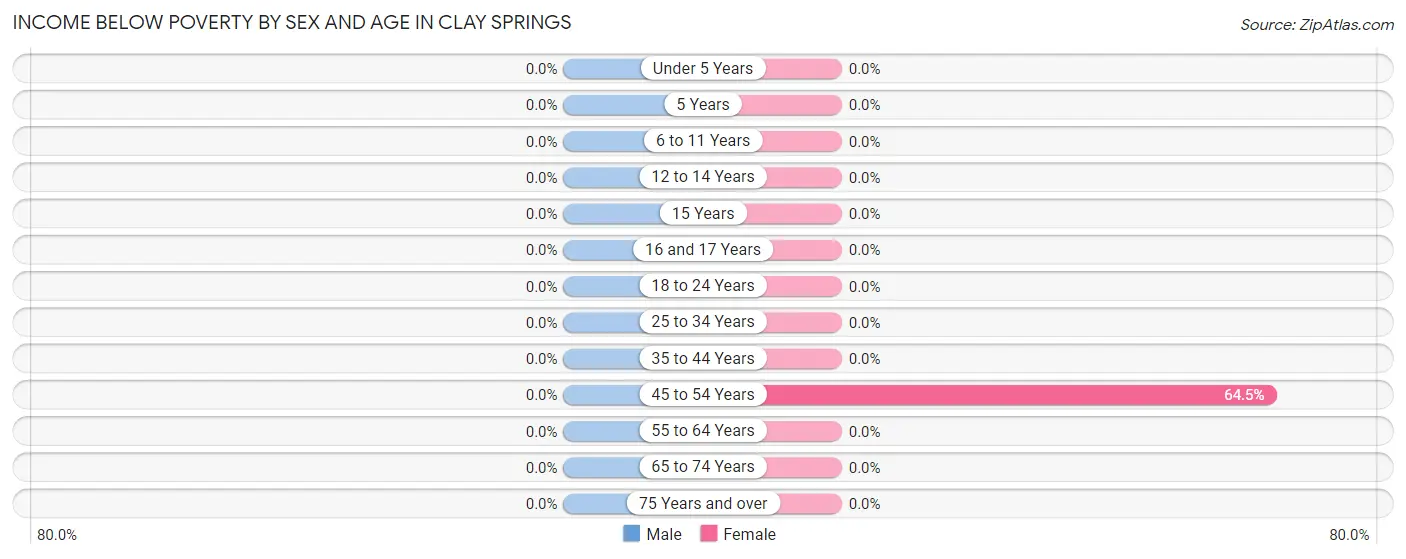
| Age Bracket | Male | Female |
| Under 5 Years | 0 (0.0%) | 0 (0.0%) |
| 5 Years | 0 (0.0%) | 0 (0.0%) |
| 6 to 11 Years | 0 (0.0%) | 0 (0.0%) |
| 12 to 14 Years | 0 (0.0%) | 0 (0.0%) |
| 15 Years | 0 (0.0%) | 0 (0.0%) |
| 16 and 17 Years | 0 (0.0%) | 0 (0.0%) |
| 18 to 24 Years | 0 (0.0%) | 0 (0.0%) |
| 25 to 34 Years | 0 (0.0%) | 0 (0.0%) |
| 35 to 44 Years | 0 (0.0%) | 0 (0.0%) |
| 45 to 54 Years | 0 (0.0%) | 20 (64.5%) |
| 55 to 64 Years | 0 (0.0%) | 0 (0.0%) |
| 65 to 74 Years | 0 (0.0%) | 0 (0.0%) |
| 75 Years and over | 0 (0.0%) | 0 (0.0%) |
| Total | 0 (0.0%) | 20 (15.0%) |
Income Above Poverty by Sex and Age in Clay Springs
According to the poverty statistics in Clay Springs, males aged under 5 years and females aged 15 years are the age groups that are most secure financially, with 100.0% of males and 100.0% of females in these age groups living above the poverty line.
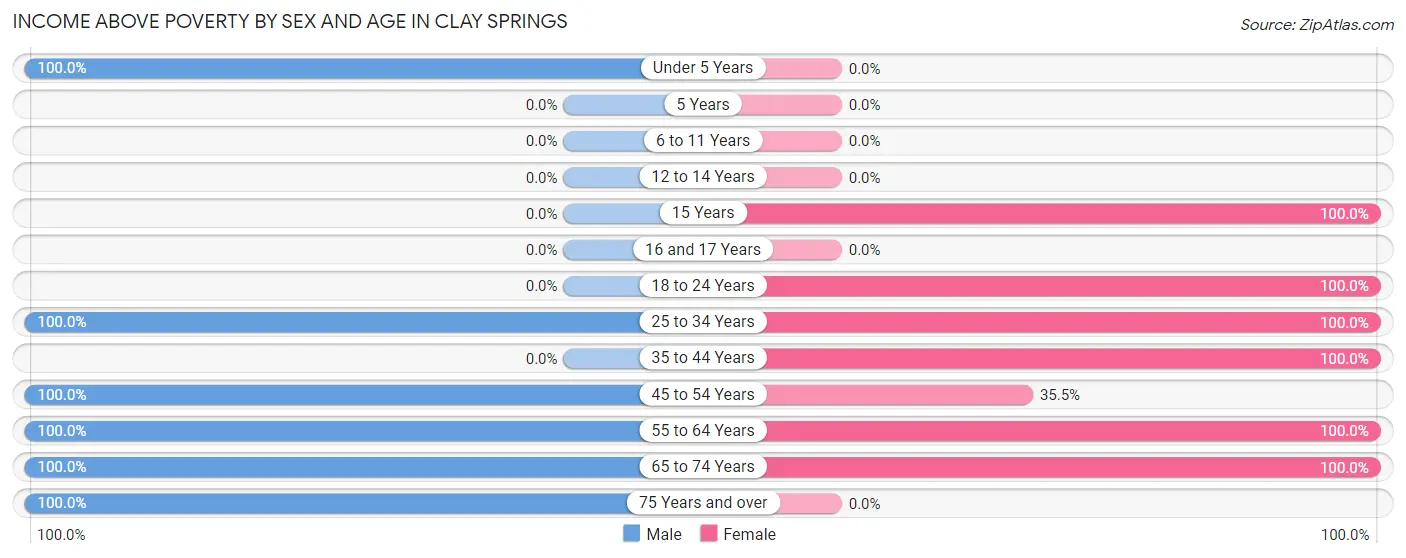
| Age Bracket | Male | Female |
| Under 5 Years | 20 (100.0%) | 0 (0.0%) |
| 5 Years | 0 (0.0%) | 0 (0.0%) |
| 6 to 11 Years | 0 (0.0%) | 0 (0.0%) |
| 12 to 14 Years | 0 (0.0%) | 0 (0.0%) |
| 15 Years | 0 (0.0%) | 6 (100.0%) |
| 16 and 17 Years | 0 (0.0%) | 0 (0.0%) |
| 18 to 24 Years | 0 (0.0%) | 4 (100.0%) |
| 25 to 34 Years | 16 (100.0%) | 22 (100.0%) |
| 35 to 44 Years | 0 (0.0%) | 4 (100.0%) |
| 45 to 54 Years | 23 (100.0%) | 11 (35.5%) |
| 55 to 64 Years | 21 (100.0%) | 46 (100.0%) |
| 65 to 74 Years | 67 (100.0%) | 20 (100.0%) |
| 75 Years and over | 20 (100.0%) | 0 (0.0%) |
| Total | 167 (100.0%) | 113 (85.0%) |
Income Below Poverty Among Married-Couple Families in Clay Springs
| Children | Above Poverty | Below Poverty |
| No Children | 66 (100.0%) | 0 (0.0%) |
| 1 or 2 Children | 16 (100.0%) | 0 (0.0%) |
| 3 or 4 Children | 0 (0.0%) | 0 (0.0%) |
| 5 or more Children | 0 (0.0%) | 0 (0.0%) |
| Total | 82 (100.0%) | 0 (0.0%) |
Income Below Poverty Among Single-Parent Households in Clay Springs
| Children | Single Father | Single Mother |
| No Children | 0 (0.0%) | 0 (0.0%) |
| 1 or 2 Children | 0 (0.0%) | 0 (0.0%) |
| 3 or 4 Children | 0 (0.0%) | 0 (0.0%) |
| 5 or more Children | 0 (0.0%) | 0 (0.0%) |
| Total | 0 (0.0%) | 0 (0.0%) |
Income Below Poverty Among Married-Couple vs Single-Parent Households in Clay Springs
| Children | Married-Couple Families | Single-Parent Households |
| No Children | 0 (0.0%) | 0 (0.0%) |
| 1 or 2 Children | 0 (0.0%) | 0 (0.0%) |
| 3 or 4 Children | 0 (0.0%) | 0 (0.0%) |
| 5 or more Children | 0 (0.0%) | 0 (0.0%) |
| Total | 0 (0.0%) | 0 (0.0%) |
Race in Clay Springs
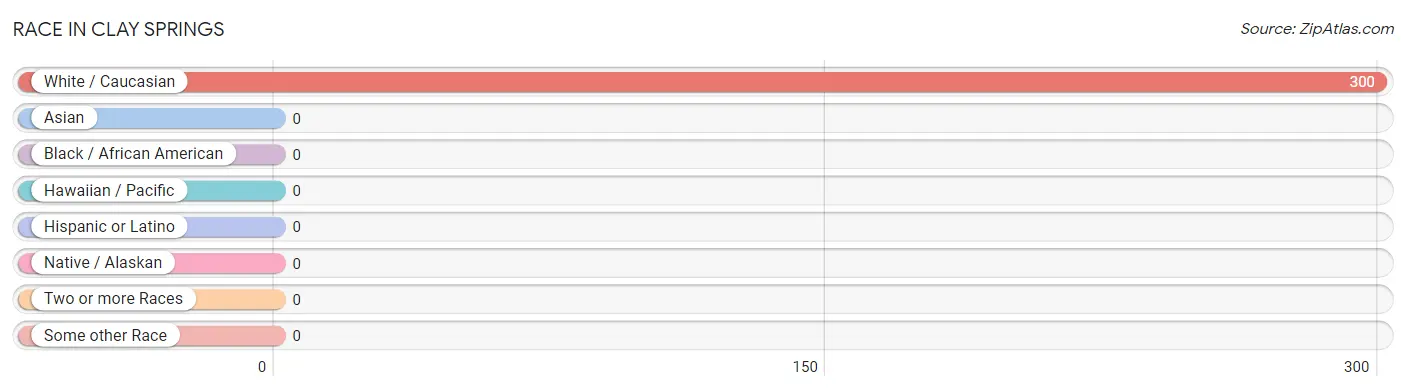
The most populous races in Clay Springs are , and White / Caucasian (300 | 100.0%).
| Race | # Population | % Population |
| Asian | 0 | 0.0% |
| Black / African American | 0 | 0.0% |
| Hawaiian / Pacific | 0 | 0.0% |
| Hispanic or Latino | 0 | 0.0% |
| Native / Alaskan | 0 | 0.0% |
| White / Caucasian | 300 | 100.0% |
| Two or more Races | 0 | 0.0% |
| Some other Race | 0 | 0.0% |
| Total | 300 | 100.0% |
Ancestry in Clay Springs
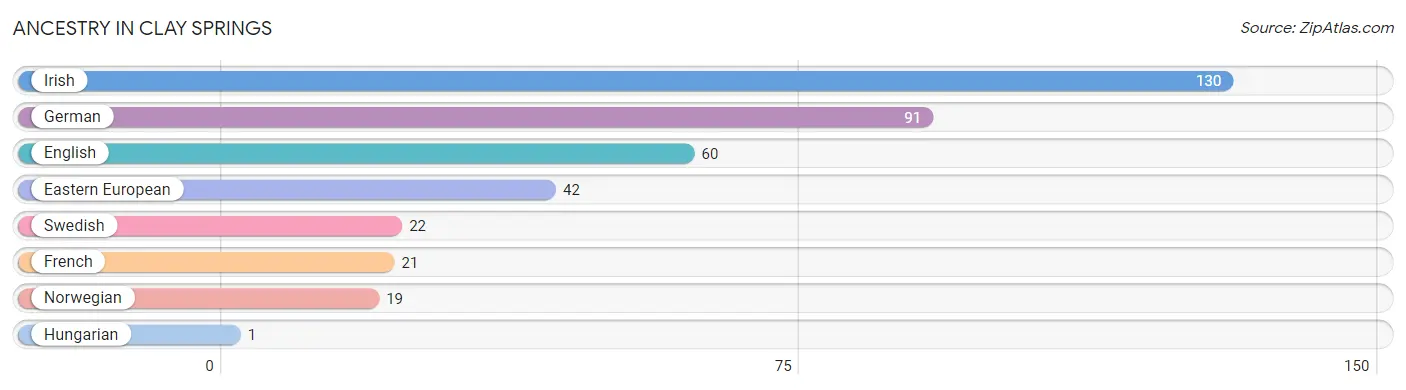
The most populous ancestries reported in Clay Springs are Irish (130 | 43.3%), German (91 | 30.3%), English (60 | 20.0%), Eastern European (42 | 14.0%), and Swedish (22 | 7.3%), together accounting for 115.0% of all Clay Springs residents.
| Ancestry | # Population | % Population |
| Eastern European | 42 | 14.0% |
| English | 60 | 20.0% |
| French | 21 | 7.0% |
| German | 91 | 30.3% |
| Hungarian | 1 | 0.3% |
| Irish | 130 | 43.3% |
| Norwegian | 19 | 6.3% |
| Swedish | 22 | 7.3% | View All 8 Rows |
Immigrants in Clay Springs

| Immigration Origin | # Population | % Population | View All 0 Rows |
Sex and Age in Clay Springs
Sex and Age in Clay Springs
The most populous age groups in Clay Springs are 65 to 69 Years (67 | 40.1%) for men and 60 to 64 Years (46 | 34.6%) for women.
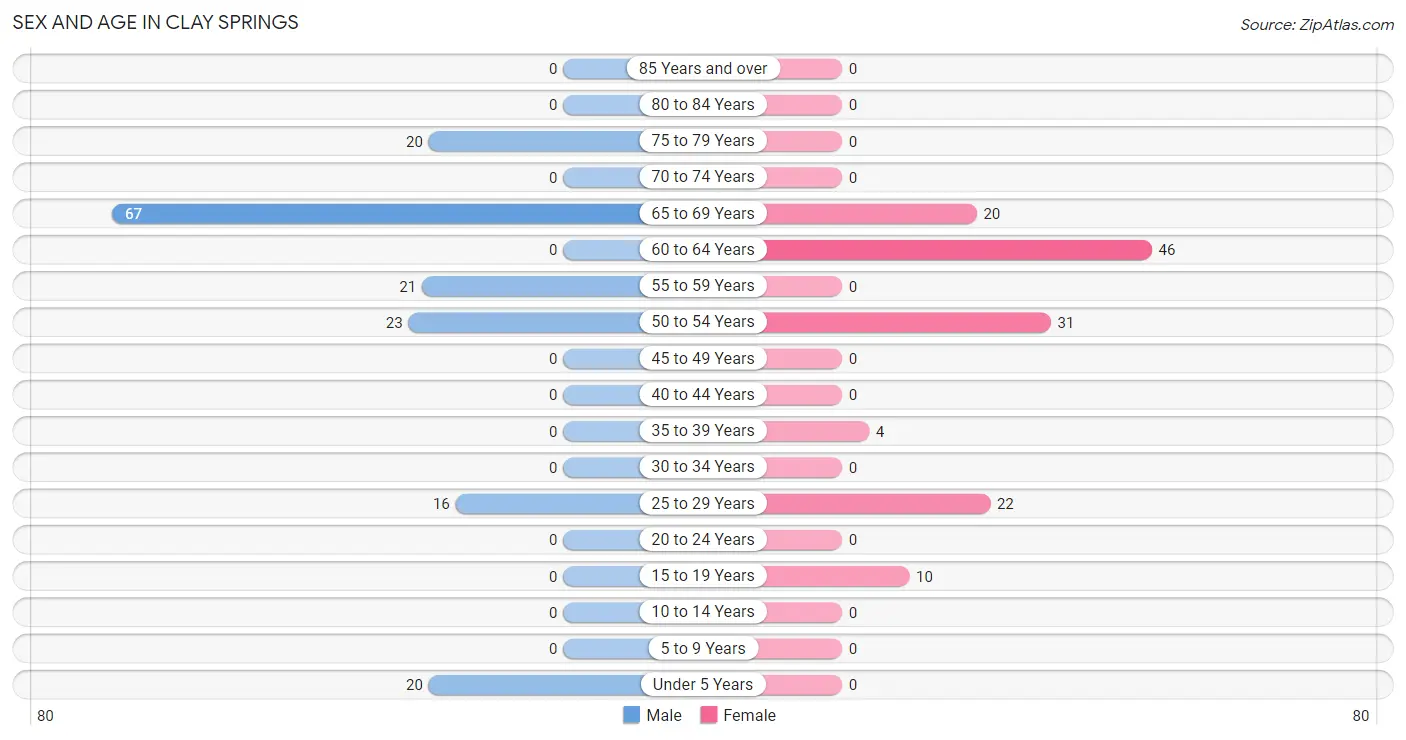
| Age Bracket | Male | Female |
| Under 5 Years | 20 (12.0%) | 0 (0.0%) |
| 5 to 9 Years | 0 (0.0%) | 0 (0.0%) |
| 10 to 14 Years | 0 (0.0%) | 0 (0.0%) |
| 15 to 19 Years | 0 (0.0%) | 10 (7.5%) |
| 20 to 24 Years | 0 (0.0%) | 0 (0.0%) |
| 25 to 29 Years | 16 (9.6%) | 22 (16.5%) |
| 30 to 34 Years | 0 (0.0%) | 0 (0.0%) |
| 35 to 39 Years | 0 (0.0%) | 4 (3.0%) |
| 40 to 44 Years | 0 (0.0%) | 0 (0.0%) |
| 45 to 49 Years | 0 (0.0%) | 0 (0.0%) |
| 50 to 54 Years | 23 (13.8%) | 31 (23.3%) |
| 55 to 59 Years | 21 (12.6%) | 0 (0.0%) |
| 60 to 64 Years | 0 (0.0%) | 46 (34.6%) |
| 65 to 69 Years | 67 (40.1%) | 20 (15.0%) |
| 70 to 74 Years | 0 (0.0%) | 0 (0.0%) |
| 75 to 79 Years | 20 (12.0%) | 0 (0.0%) |
| 80 to 84 Years | 0 (0.0%) | 0 (0.0%) |
| 85 Years and over | 0 (0.0%) | 0 (0.0%) |
| Total | 167 (100.0%) | 133 (100.0%) |
Families and Households in Clay Springs
Median Family Size in Clay Springs
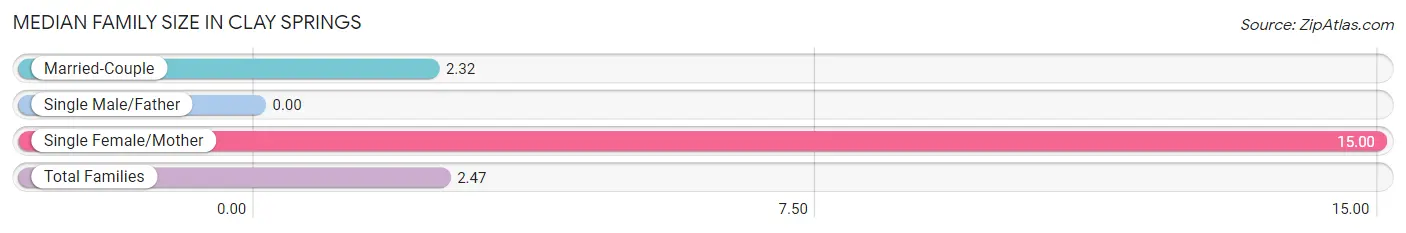
| Family Type | # Families | Family Size |
| Married-Couple | 82 (98.8%) | 2.32 |
| Single Male/Father | 0 (0.0%) | - |
| Single Female/Mother | 1 (1.2%) | 15.00 |
| Total Families | 83 (100.0%) | 2.47 |
Median Household Size in Clay Springs
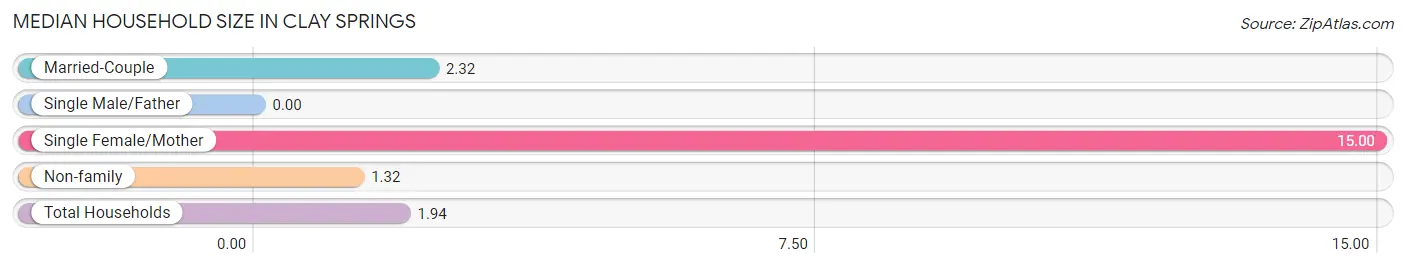
| Household Type | # Households | Household Size |
| Married-Couple | 82 (52.9%) | 2.32 |
| Single Male/Father | 0 (0.0%) | - |
| Single Female/Mother | 1 (0.6%) | 15.00 |
| Non-family | 72 (46.5%) | 1.32 |
| Total Households | 155 (100.0%) | 1.94 |
Household Size by Marriage Status in Clay Springs
Out of a total of 155 households in Clay Springs, 83 (53.5%) are family households, while 72 (46.5%) are nonfamily households. The most numerous type of family households are 2-person households, comprising 66, and the most common type of nonfamily households are 1-person households, comprising 52.
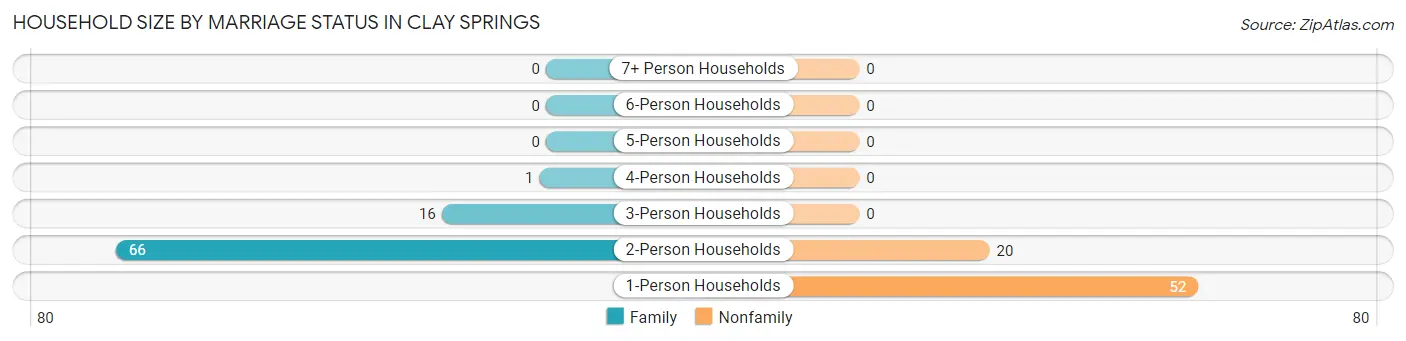
| Household Size | Family Households | Nonfamily Households |
| 1-Person Households | - | 52 (33.6%) |
| 2-Person Households | 66 (42.6%) | 20 (12.9%) |
| 3-Person Households | 16 (10.3%) | 0 (0.0%) |
| 4-Person Households | 1 (0.6%) | 0 (0.0%) |
| 5-Person Households | 0 (0.0%) | 0 (0.0%) |
| 6-Person Households | 0 (0.0%) | 0 (0.0%) |
| 7+ Person Households | 0 (0.0%) | 0 (0.0%) |
| Total | 83 (53.5%) | 72 (46.5%) |
Female Fertility in Clay Springs
Fertility by Age in Clay Springs
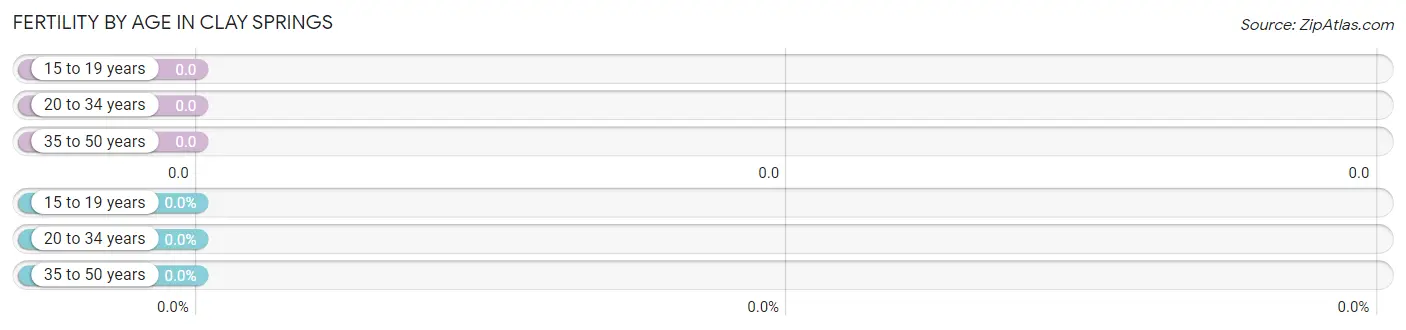
| Age Bracket | Women with Births | Births / 1,000 Women |
| 15 to 19 years | 0 (0.0%) | 0.0 |
| 20 to 34 years | 0 (0.0%) | 0.0 |
| 35 to 50 years | 0 (0.0%) | 0.0 |
| Total | 0 (0.0%) | 0.0 |
Fertility by Age by Marriage Status in Clay Springs
| Age Bracket | Married | Unmarried |
| 15 to 19 years | 0 (0.0%) | 0 (0.0%) |
| 20 to 34 years | 0 (0.0%) | 0 (0.0%) |
| 35 to 50 years | 0 (0.0%) | 0 (0.0%) |
| Total | 0 (0.0%) | 0 (0.0%) |
Fertility by Education in Clay Springs
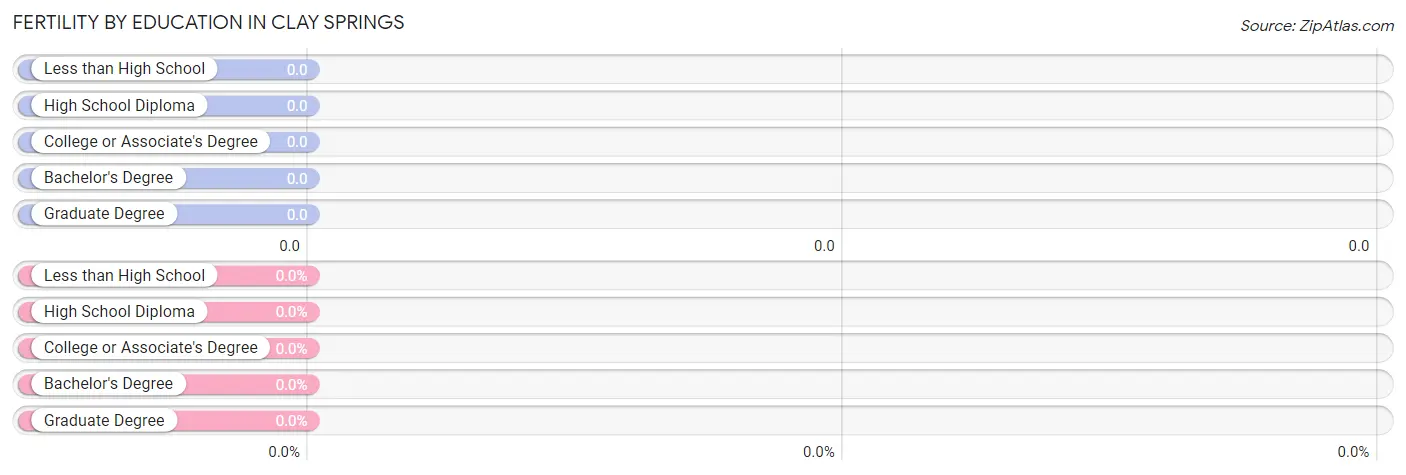
| Educational Attainment | Women with Births | Births / 1,000 Women |
| Less than High School | 0 (0.0%) | 0.0 |
| High School Diploma | 0 (0.0%) | 0.0 |
| College or Associate's Degree | 0 (0.0%) | 0.0 |
| Bachelor's Degree | 0 (0.0%) | 0.0 |
| Graduate Degree | 0 (0.0%) | 0.0 |
| Total | 0 (0.0%) | 0.0 |
Fertility by Education by Marriage Status in Clay Springs
| Educational Attainment | Married | Unmarried |
| Less than High School | 0 (0.0%) | 0 (0.0%) |
| High School Diploma | 0 (0.0%) | 0 (0.0%) |
| College or Associate's Degree | 0 (0.0%) | 0 (0.0%) |
| Bachelor's Degree | 0 (0.0%) | 0 (0.0%) |
| Graduate Degree | 0 (0.0%) | 0 (0.0%) |
| Total | 0 (0.0%) | 0 (0.0%) |
Employment Characteristics in Clay Springs
Employment by Class of Employer in Clay Springs
Among the 88 employed individuals in Clay Springs, local government employees (58 | 65.9%), private company employees (26 | 29.5%), and state government employees (4 | 4.5%) make up the most common classes of employment.
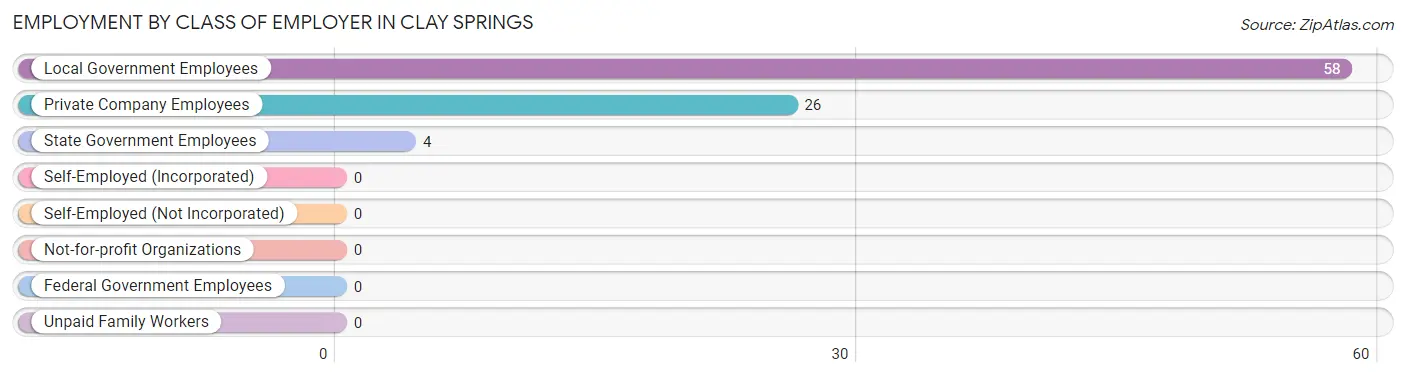
| Employer Class | # Employees | % Employees |
| Private Company Employees | 26 | 29.5% |
| Self-Employed (Incorporated) | 0 | 0.0% |
| Self-Employed (Not Incorporated) | 0 | 0.0% |
| Not-for-profit Organizations | 0 | 0.0% |
| Local Government Employees | 58 | 65.9% |
| State Government Employees | 4 | 4.5% |
| Federal Government Employees | 0 | 0.0% |
| Unpaid Family Workers | 0 | 0.0% |
| Total | 88 | 100.0% |
Employment Status by Age in Clay Springs
According to the labor force statistics for Clay Springs, out of the total population over 16 years of age (274), 38.0% or 104 individuals are in the labor force, with 15.4% or 16 of them unemployed. The age group with the highest labor force participation rate is 16 to 19 years, with 100.0% or 4 individuals in the labor force. Within the labor force, the 25 to 29 years age range has the highest percentage of unemployed individuals, with 42.1% or 16 of them being unemployed.
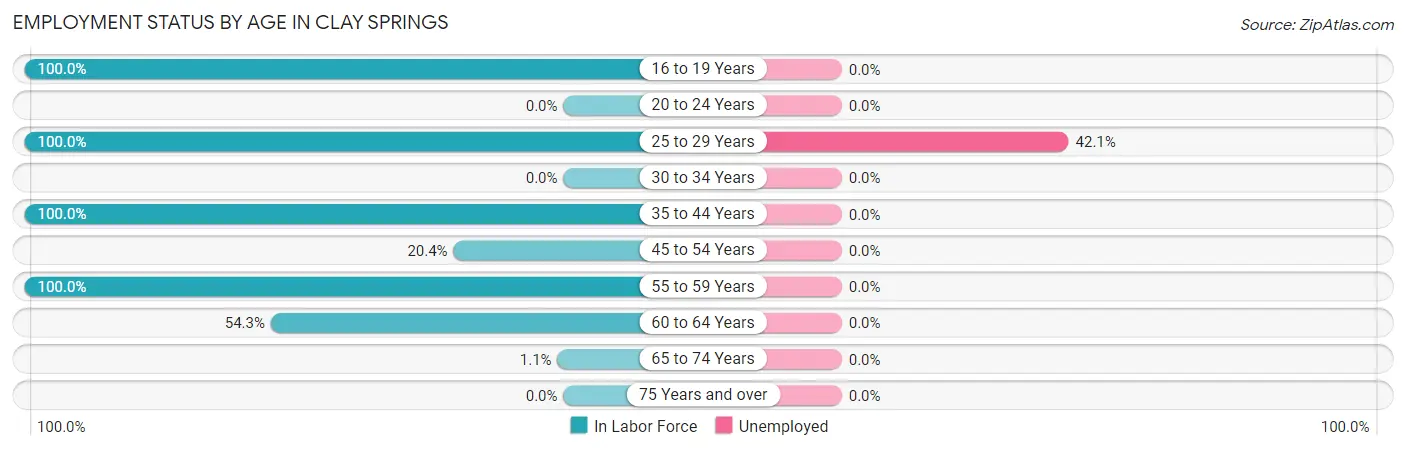
| Age Bracket | In Labor Force | Unemployed |
| 16 to 19 Years | 4 (100.0%) | 0 (0.0%) |
| 20 to 24 Years | 0 (0.0%) | 0 (0.0%) |
| 25 to 29 Years | 38 (100.0%) | 16 (42.1%) |
| 30 to 34 Years | 0 (0.0%) | 0 (0.0%) |
| 35 to 44 Years | 4 (100.0%) | 0 (0.0%) |
| 45 to 54 Years | 11 (20.4%) | 0 (0.0%) |
| 55 to 59 Years | 21 (100.0%) | 0 (0.0%) |
| 60 to 64 Years | 25 (54.3%) | 0 (0.0%) |
| 65 to 74 Years | 1 (1.1%) | 0 (0.0%) |
| 75 Years and over | 0 (0.0%) | 0 (0.0%) |
| Total | 104 (38.0%) | 16 (15.4%) |
Employment Status by Educational Attainment in Clay Springs
According to labor force statistics for Clay Springs, 60.7% of individuals (99) out of the total population between 25 and 64 years of age (163) are in the labor force, with 16.2% or 16 of them being unemployed. The group with the highest labor force participation rate are those with the educational attainment of college / associate degree, with 100.0% or 36 individuals in the labor force. Within the labor force, individuals with less than high school education have the highest percentage of unemployment, with 100.0% or 16 of them being unemployed.
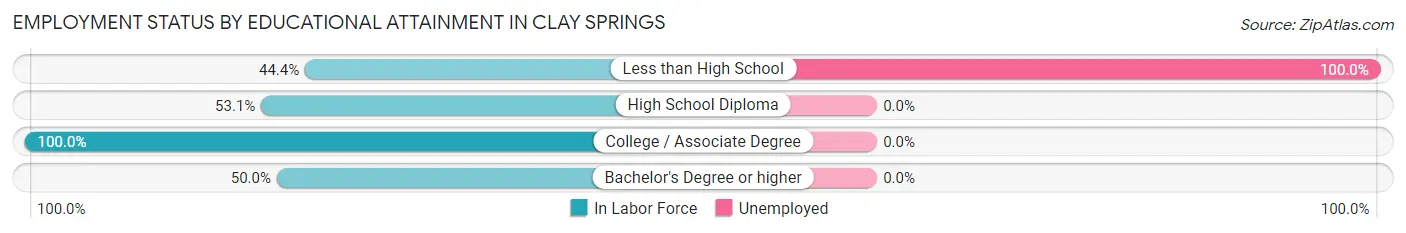
| Educational Attainment | In Labor Force | Unemployed |
| Less than High School | 16 (44.4%) | 36 (100.0%) |
| High School Diploma | 26 (53.1%) | 0 (0.0%) |
| College / Associate Degree | 36 (100.0%) | 0 (0.0%) |
| Bachelor's Degree or higher | 21 (50.0%) | 0 (0.0%) |
| Total | 99 (60.7%) | 26 (16.2%) |
Employment Occupations by Sex in Clay Springs
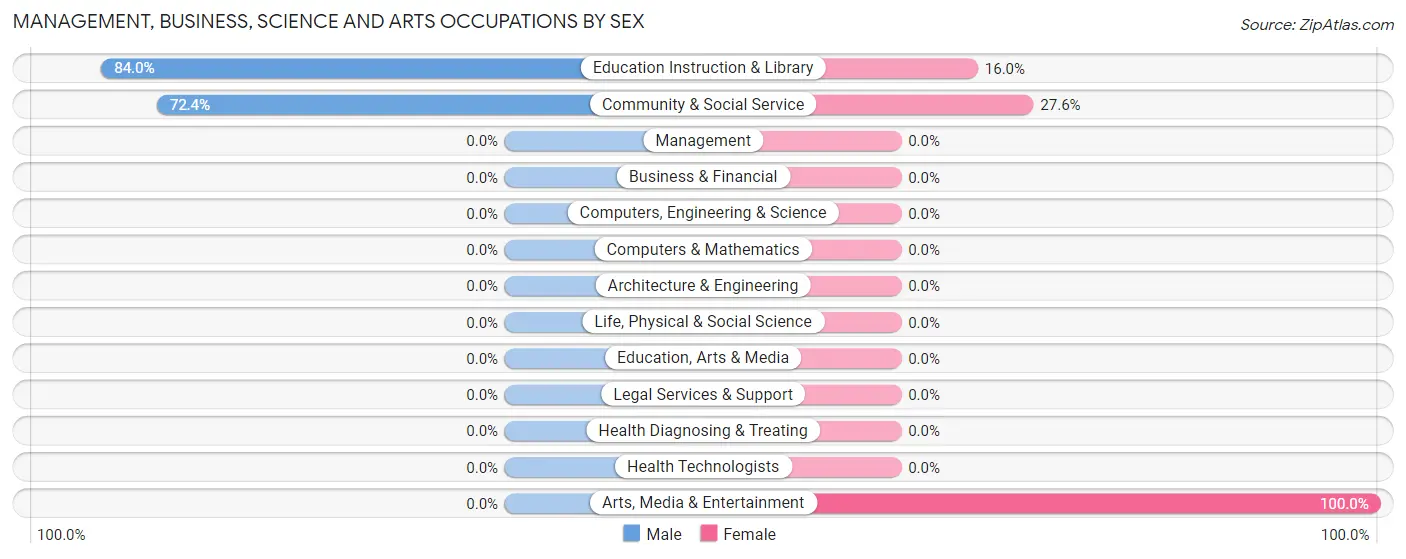
Management, Business, Science and Arts Occupations
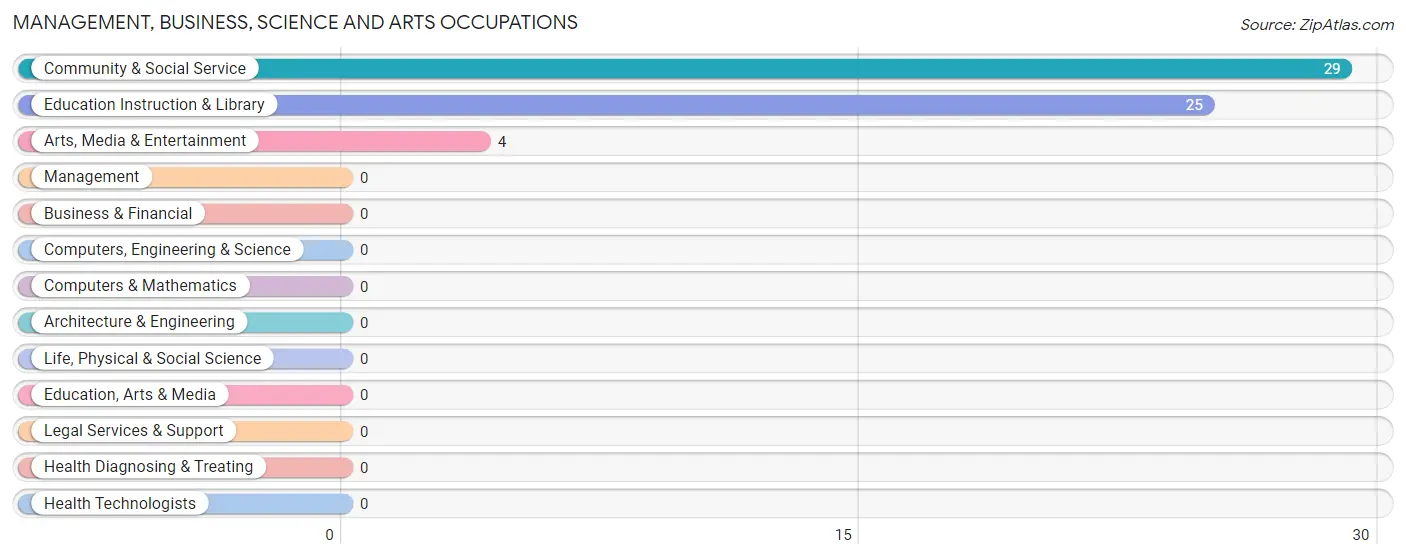
The most common Management, Business, Science and Arts occupations in Clay Springs are Community & Social Service (29 | 33.0%), Education Instruction & Library (25 | 28.4%), and Arts, Media & Entertainment (4 | 4.5%).
Management, Business, Science and Arts Occupations by Sex
Within the Management, Business, Science and Arts occupations in Clay Springs, the most male-oriented occupations are Education Instruction & Library (84.0%), and Community & Social Service (72.4%), while the most female-oriented occupations are Arts, Media & Entertainment (100.0%), Community & Social Service (27.6%), and Education Instruction & Library (16.0%).
| Occupation | Male | Female |
| Management | 0 (0.0%) | 0 (0.0%) |
| Business & Financial | 0 (0.0%) | 0 (0.0%) |
| Computers, Engineering & Science | 0 (0.0%) | 0 (0.0%) |
| Computers & Mathematics | 0 (0.0%) | 0 (0.0%) |
| Architecture & Engineering | 0 (0.0%) | 0 (0.0%) |
| Life, Physical & Social Science | 0 (0.0%) | 0 (0.0%) |
| Community & Social Service | 21 (72.4%) | 8 (27.6%) |
| Education, Arts & Media | 0 (0.0%) | 0 (0.0%) |
| Legal Services & Support | 0 (0.0%) | 0 (0.0%) |
| Education Instruction & Library | 21 (84.0%) | 4 (16.0%) |
| Arts, Media & Entertainment | 0 (0.0%) | 4 (100.0%) |
| Health Diagnosing & Treating | 0 (0.0%) | 0 (0.0%) |
| Health Technologists | 0 (0.0%) | 0 (0.0%) |
| Total (Category) | 21 (72.4%) | 8 (27.6%) |
| Total (Overall) | 21 (23.9%) | 67 (76.1%) |
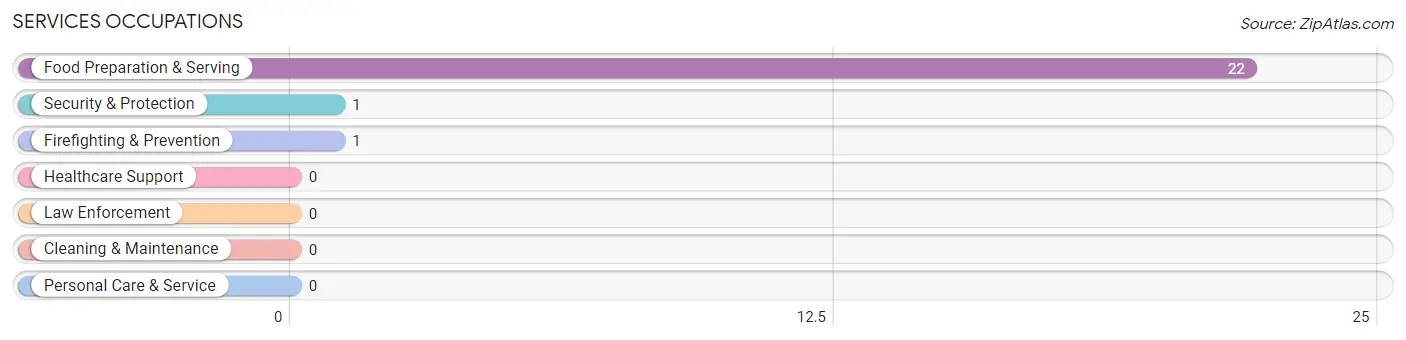
Services Occupations
The most common Services occupations in Clay Springs are Food Preparation & Serving (22 | 25.0%), Security & Protection (1 | 1.1%), and Firefighting & Prevention (1 | 1.1%).
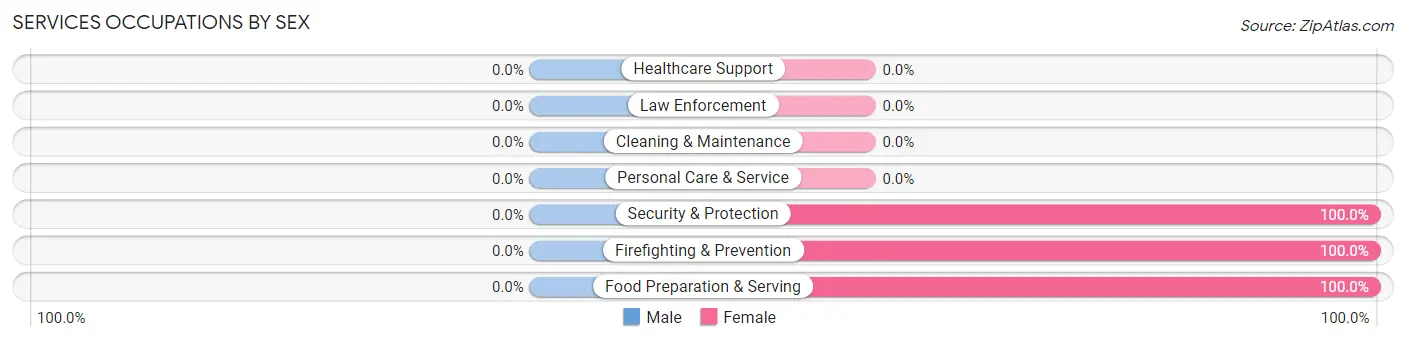
Services Occupations by Sex
| Occupation | Male | Female |
| Healthcare Support | 0 (0.0%) | 0 (0.0%) |
| Security & Protection | 0 (0.0%) | 1 (100.0%) |
| Firefighting & Prevention | 0 (0.0%) | 1 (100.0%) |
| Law Enforcement | 0 (0.0%) | 0 (0.0%) |
| Food Preparation & Serving | 0 (0.0%) | 22 (100.0%) |
| Cleaning & Maintenance | 0 (0.0%) | 0 (0.0%) |
| Personal Care & Service | 0 (0.0%) | 0 (0.0%) |
| Total (Category) | 0 (0.0%) | 23 (100.0%) |
| Total (Overall) | 21 (23.9%) | 67 (76.1%) |
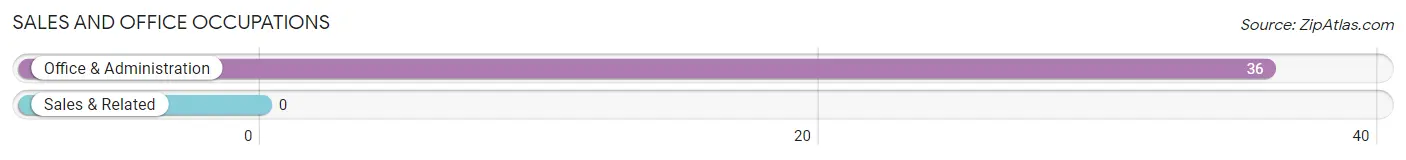
Sales and Office Occupations
The most common Sales and Office occupations in Clay Springs are , and Office & Administration (36 | 40.9%).
Sales and Office Occupations by Sex
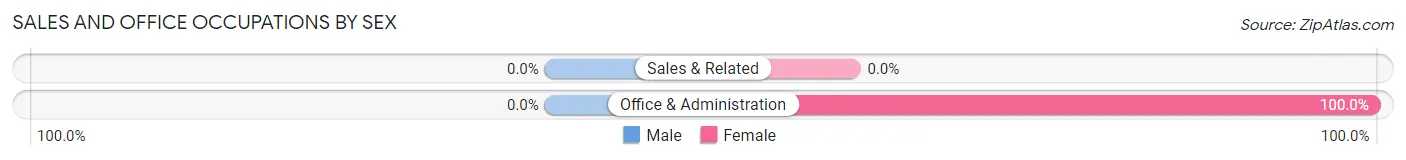
| Occupation | Male | Female |
| Sales & Related | 0 (0.0%) | 0 (0.0%) |
| Office & Administration | 0 (0.0%) | 36 (100.0%) |
| Total (Category) | 0 (0.0%) | 36 (100.0%) |
| Total (Overall) | 21 (23.9%) | 67 (76.1%) |
Natural Resources, Construction and Maintenance Occupations
Natural Resources, Construction and Maintenance Occupations by Sex
| Occupation | Male | Female |
| Farming, Fishing & Forestry | 0 (0.0%) | 0 (0.0%) |
| Construction & Extraction | 0 (0.0%) | 0 (0.0%) |
| Installation, Maintenance & Repair | 0 (0.0%) | 0 (0.0%) |
| Total (Category) | 0 (0.0%) | 0 (0.0%) |
| Total (Overall) | 21 (23.9%) | 67 (76.1%) |
Production, Transportation and Moving Occupations
Production, Transportation and Moving Occupations by Sex
| Occupation | Male | Female |
| Production | 0 (0.0%) | 0 (0.0%) |
| Transportation | 0 (0.0%) | 0 (0.0%) |
| Material Moving | 0 (0.0%) | 0 (0.0%) |
| Total (Category) | 0 (0.0%) | 0 (0.0%) |
| Total (Overall) | 21 (23.9%) | 67 (76.1%) |
Employment Industries by Sex in Clay Springs
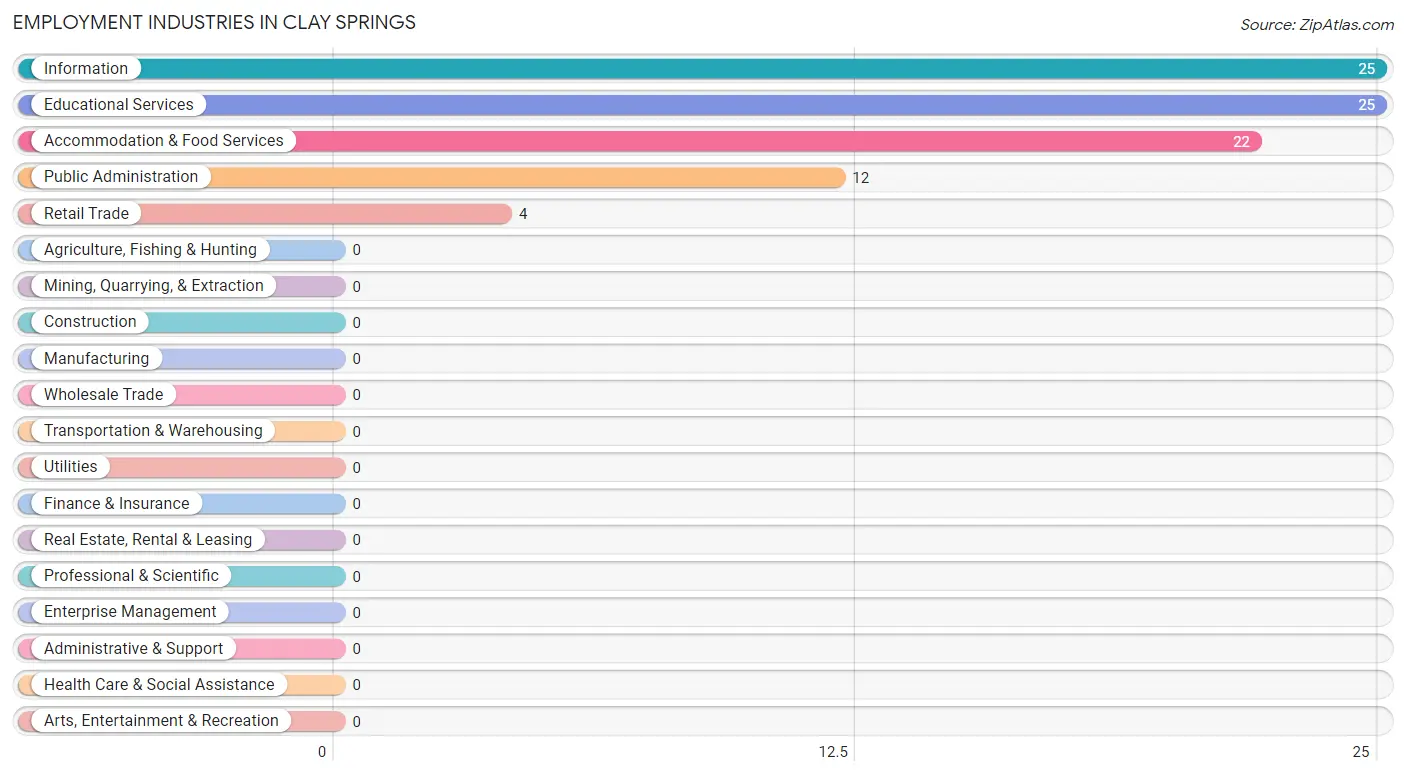
Employment Industries in Clay Springs
The major employment industries in Clay Springs include Information (25 | 28.4%), Educational Services (25 | 28.4%), Accommodation & Food Services (22 | 25.0%), Public Administration (12 | 13.6%), and Retail Trade (4 | 4.5%).
Employment Industries by Sex in Clay Springs
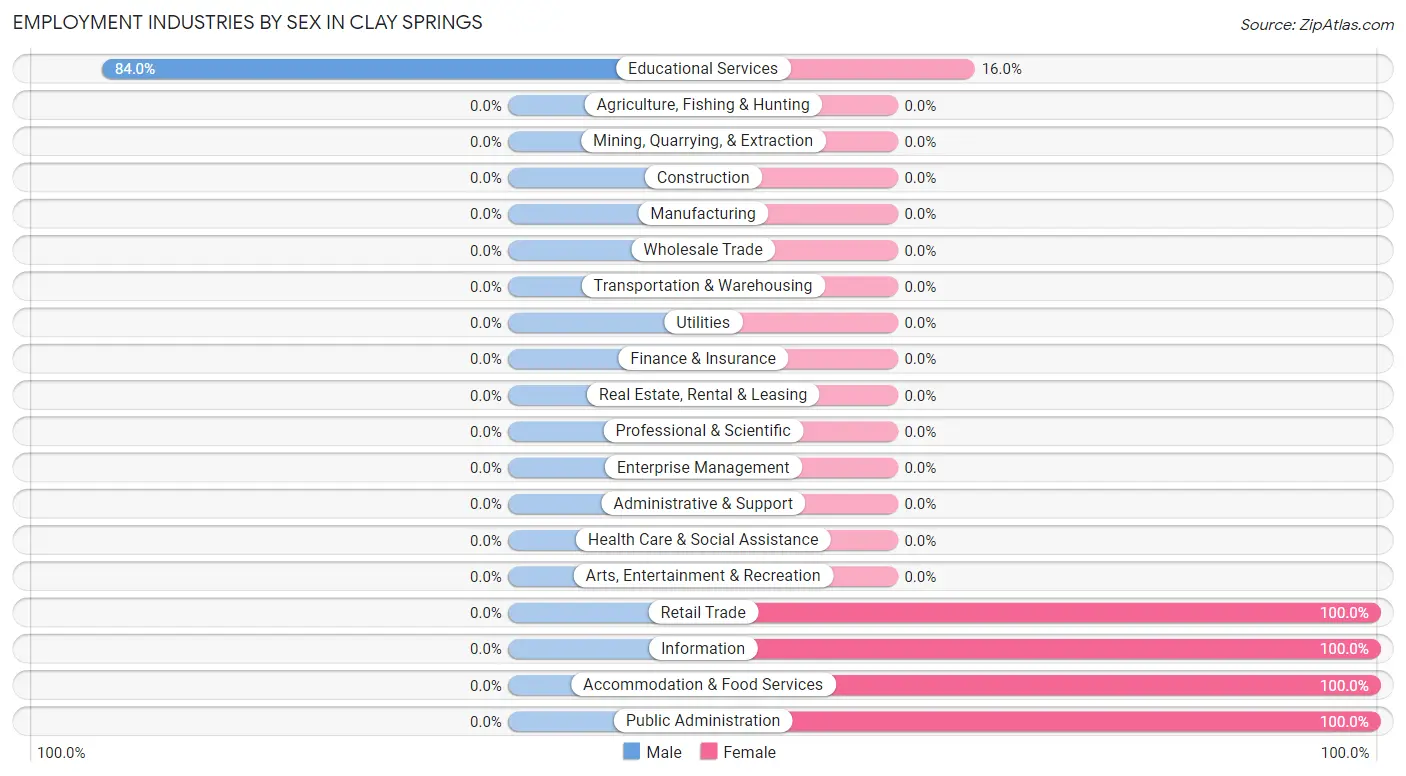
| Industry | Male | Female |
| Agriculture, Fishing & Hunting | 0 (0.0%) | 0 (0.0%) |
| Mining, Quarrying, & Extraction | 0 (0.0%) | 0 (0.0%) |
| Construction | 0 (0.0%) | 0 (0.0%) |
| Manufacturing | 0 (0.0%) | 0 (0.0%) |
| Wholesale Trade | 0 (0.0%) | 0 (0.0%) |
| Retail Trade | 0 (0.0%) | 4 (100.0%) |
| Transportation & Warehousing | 0 (0.0%) | 0 (0.0%) |
| Utilities | 0 (0.0%) | 0 (0.0%) |
| Information | 0 (0.0%) | 25 (100.0%) |
| Finance & Insurance | 0 (0.0%) | 0 (0.0%) |
| Real Estate, Rental & Leasing | 0 (0.0%) | 0 (0.0%) |
| Professional & Scientific | 0 (0.0%) | 0 (0.0%) |
| Enterprise Management | 0 (0.0%) | 0 (0.0%) |
| Administrative & Support | 0 (0.0%) | 0 (0.0%) |
| Educational Services | 21 (84.0%) | 4 (16.0%) |
| Health Care & Social Assistance | 0 (0.0%) | 0 (0.0%) |
| Arts, Entertainment & Recreation | 0 (0.0%) | 0 (0.0%) |
| Accommodation & Food Services | 0 (0.0%) | 22 (100.0%) |
| Public Administration | 0 (0.0%) | 12 (100.0%) |
| Total | 21 (23.9%) | 67 (76.1%) |
Education in Clay Springs
School Enrollment in Clay Springs
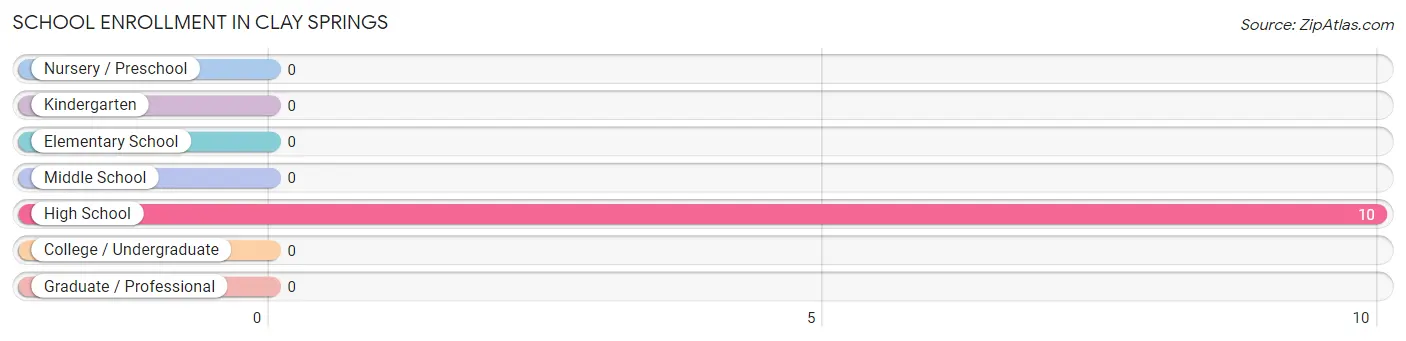
| School Level | # Students | % Students |
| Nursery / Preschool | 0 | 0.0% |
| Kindergarten | 0 | 0.0% |
| Elementary School | 0 | 0.0% |
| Middle School | 0 | 0.0% |
| High School | 10 | 100.0% |
| College / Undergraduate | 0 | 0.0% |
| Graduate / Professional | 0 | 0.0% |
| Total | 10 | 100.0% |
School Enrollment by Age by Funding Source in Clay Springs
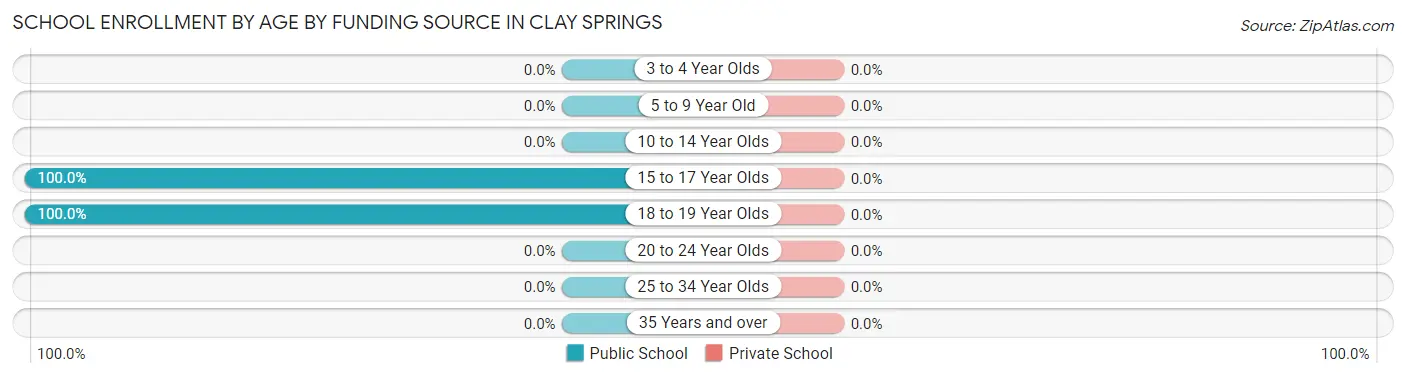
| Age Bracket | Public School | Private School |
| 3 to 4 Year Olds | 0 (0.0%) | 0 (0.0%) |
| 5 to 9 Year Old | 0 (0.0%) | 0 (0.0%) |
| 10 to 14 Year Olds | 0 (0.0%) | 0 (0.0%) |
| 15 to 17 Year Olds | 6 (100.0%) | 0 (0.0%) |
| 18 to 19 Year Olds | 4 (100.0%) | 0 (0.0%) |
| 20 to 24 Year Olds | 0 (0.0%) | 0 (0.0%) |
| 25 to 34 Year Olds | 0 (0.0%) | 0 (0.0%) |
| 35 Years and over | 0 (0.0%) | 0 (0.0%) |
| Total | 10 (100.0%) | 0 (0.0%) |
Educational Attainment by Field of Study in Clay Springs
Engineering (22 | 34.4%), education (21 | 32.8%), and arts & humanities (21 | 32.8%) are the most common fields of study among 64 individuals in Clay Springs who have obtained a bachelor's degree or higher.
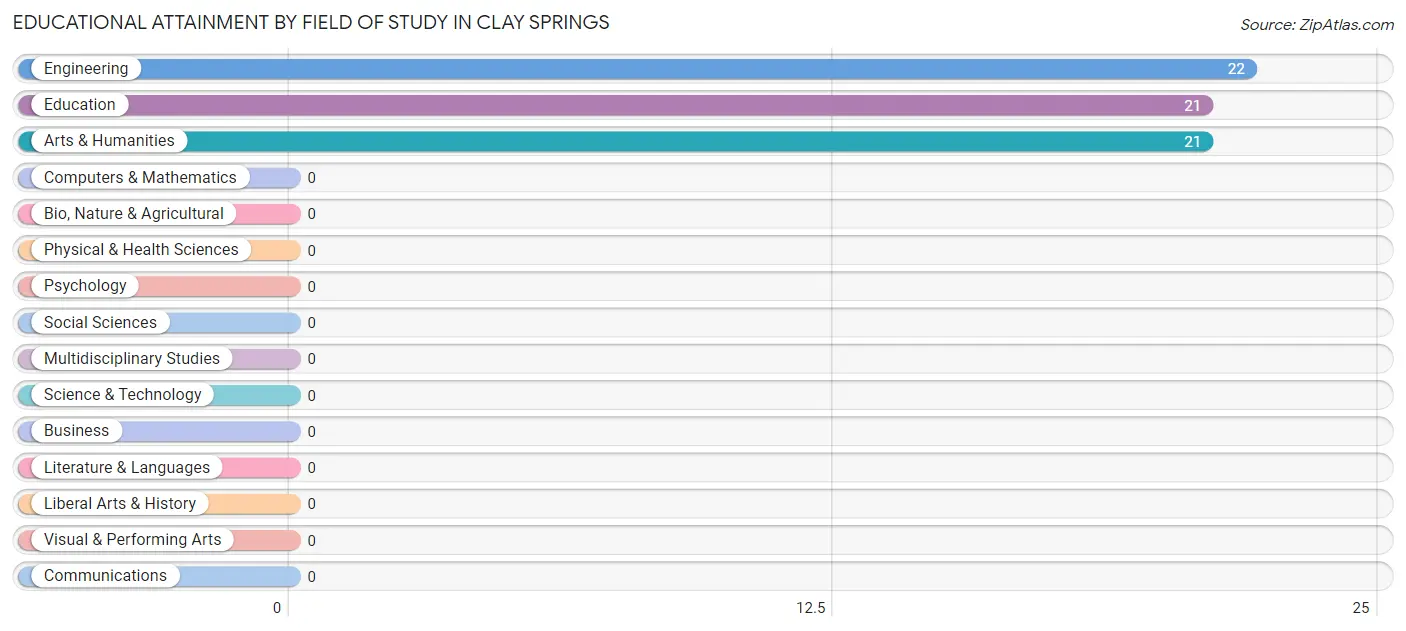
| Field of Study | # Graduates | % Graduates |
| Computers & Mathematics | 0 | 0.0% |
| Bio, Nature & Agricultural | 0 | 0.0% |
| Physical & Health Sciences | 0 | 0.0% |
| Psychology | 0 | 0.0% |
| Social Sciences | 0 | 0.0% |
| Engineering | 22 | 34.4% |
| Multidisciplinary Studies | 0 | 0.0% |
| Science & Technology | 0 | 0.0% |
| Business | 0 | 0.0% |
| Education | 21 | 32.8% |
| Literature & Languages | 0 | 0.0% |
| Liberal Arts & History | 0 | 0.0% |
| Visual & Performing Arts | 0 | 0.0% |
| Communications | 0 | 0.0% |
| Arts & Humanities | 21 | 32.8% |
| Total | 64 | 100.0% |
Transportation & Commute in Clay Springs
Vehicle Availability by Sex in Clay Springs
The most prevalent vehicle ownership categories in Clay Springs are males with 1 vehicle (21, accounting for 100.0%) and females with 1 vehicle (0, making up 31.3%).
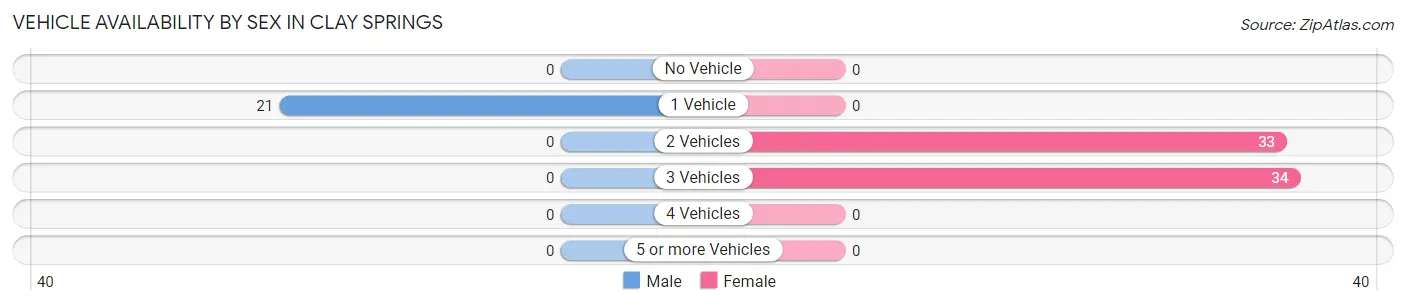
| Vehicles Available | Male | Female |
| No Vehicle | 0 (0.0%) | 0 (0.0%) |
| 1 Vehicle | 21 (100.0%) | 0 (0.0%) |
| 2 Vehicles | 0 (0.0%) | 33 (49.2%) |
| 3 Vehicles | 0 (0.0%) | 34 (50.7%) |
| 4 Vehicles | 0 (0.0%) | 0 (0.0%) |
| 5 or more Vehicles | 0 (0.0%) | 0 (0.0%) |
| Total | 21 (100.0%) | 67 (100.0%) |
Commute Time in Clay Springs
The most frequently occuring commute durations in Clay Springs are 20 to 24 minutes (58 commuters, 69.1%), 30 to 34 minutes (21 commuters, 25.0%), and 5 to 9 minutes (4 commuters, 4.8%).
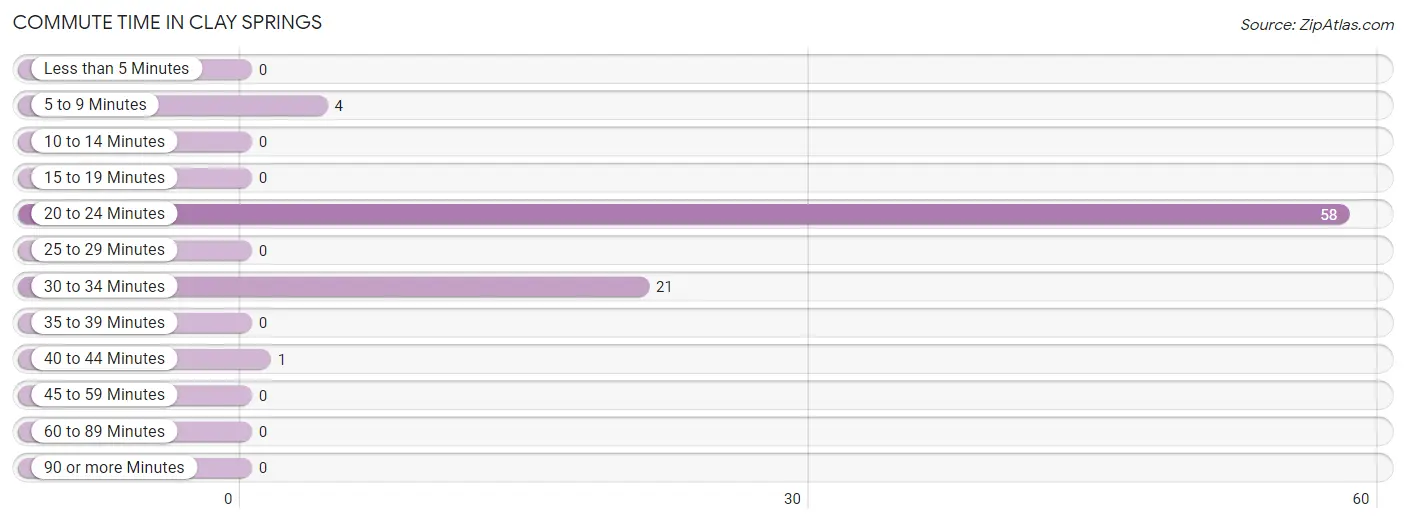
| Commute Time | # Commuters | % Commuters |
| Less than 5 Minutes | 0 | 0.0% |
| 5 to 9 Minutes | 4 | 4.8% |
| 10 to 14 Minutes | 0 | 0.0% |
| 15 to 19 Minutes | 0 | 0.0% |
| 20 to 24 Minutes | 58 | 69.1% |
| 25 to 29 Minutes | 0 | 0.0% |
| 30 to 34 Minutes | 21 | 25.0% |
| 35 to 39 Minutes | 0 | 0.0% |
| 40 to 44 Minutes | 1 | 1.2% |
| 45 to 59 Minutes | 0 | 0.0% |
| 60 to 89 Minutes | 0 | 0.0% |
| 90 or more Minutes | 0 | 0.0% |
Commute Time by Sex in Clay Springs
The most common commute times in Clay Springs are 30 to 34 minutes (21 commuters, 100.0%) for males and 20 to 24 minutes (58 commuters, 92.1%) for females.
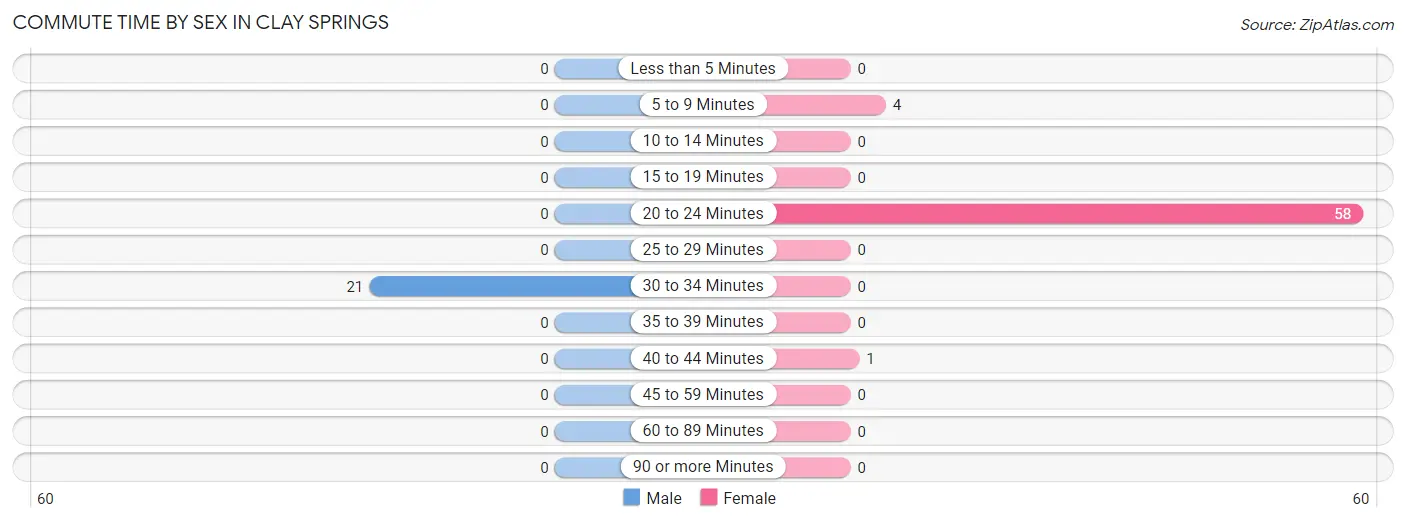
| Commute Time | Male | Female |
| Less than 5 Minutes | 0 (0.0%) | 0 (0.0%) |
| 5 to 9 Minutes | 0 (0.0%) | 4 (6.4%) |
| 10 to 14 Minutes | 0 (0.0%) | 0 (0.0%) |
| 15 to 19 Minutes | 0 (0.0%) | 0 (0.0%) |
| 20 to 24 Minutes | 0 (0.0%) | 58 (92.1%) |
| 25 to 29 Minutes | 0 (0.0%) | 0 (0.0%) |
| 30 to 34 Minutes | 21 (100.0%) | 0 (0.0%) |
| 35 to 39 Minutes | 0 (0.0%) | 0 (0.0%) |
| 40 to 44 Minutes | 0 (0.0%) | 1 (1.6%) |
| 45 to 59 Minutes | 0 (0.0%) | 0 (0.0%) |
| 60 to 89 Minutes | 0 (0.0%) | 0 (0.0%) |
| 90 or more Minutes | 0 (0.0%) | 0 (0.0%) |
Time of Departure to Work by Sex in Clay Springs
The most frequent times of departure to work in Clay Springs are 5:00 AM to 5:29 AM (21, 100.0%) for males and 8:00 AM to 8:29 AM (26, 41.3%) for females.
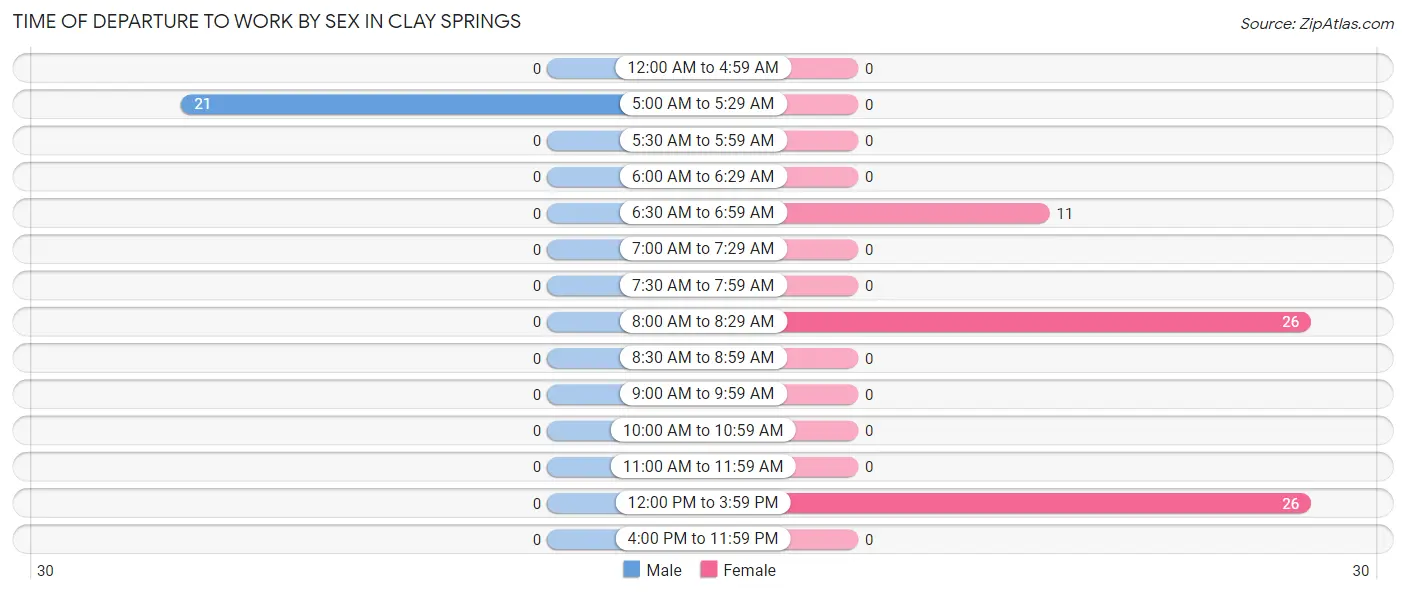
| Time of Departure | Male | Female |
| 12:00 AM to 4:59 AM | 0 (0.0%) | 0 (0.0%) |
| 5:00 AM to 5:29 AM | 21 (100.0%) | 0 (0.0%) |
| 5:30 AM to 5:59 AM | 0 (0.0%) | 0 (0.0%) |
| 6:00 AM to 6:29 AM | 0 (0.0%) | 0 (0.0%) |
| 6:30 AM to 6:59 AM | 0 (0.0%) | 11 (17.5%) |
| 7:00 AM to 7:29 AM | 0 (0.0%) | 0 (0.0%) |
| 7:30 AM to 7:59 AM | 0 (0.0%) | 0 (0.0%) |
| 8:00 AM to 8:29 AM | 0 (0.0%) | 26 (41.3%) |
| 8:30 AM to 8:59 AM | 0 (0.0%) | 0 (0.0%) |
| 9:00 AM to 9:59 AM | 0 (0.0%) | 0 (0.0%) |
| 10:00 AM to 10:59 AM | 0 (0.0%) | 0 (0.0%) |
| 11:00 AM to 11:59 AM | 0 (0.0%) | 0 (0.0%) |
| 12:00 PM to 3:59 PM | 0 (0.0%) | 26 (41.3%) |
| 4:00 PM to 11:59 PM | 0 (0.0%) | 0 (0.0%) |
| Total | 21 (100.0%) | 63 (100.0%) |
Housing Occupancy in Clay Springs
Occupancy by Ownership in Clay Springs
Of the total 155 dwellings in Clay Springs, owner-occupied units account for 155 (100.0%), while renter-occupied units make up 0 (0.0%).
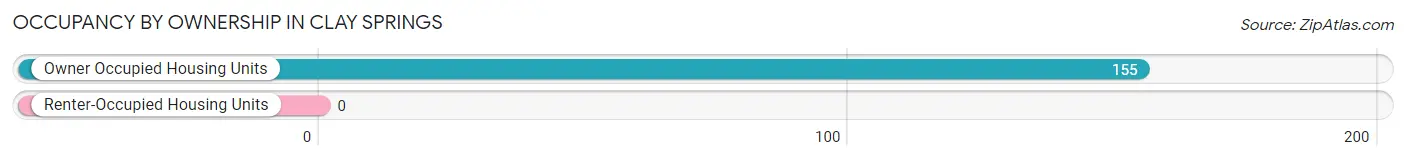
| Occupancy | # Housing Units | % Housing Units |
| Owner Occupied Housing Units | 155 | 100.0% |
| Renter-Occupied Housing Units | 0 | 0.0% |
| Total Occupied Housing Units | 155 | 100.0% |
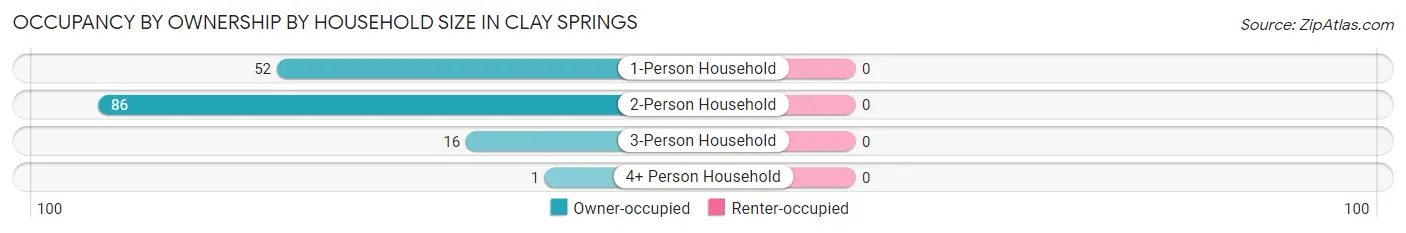
Occupancy by Household Size in Clay Springs
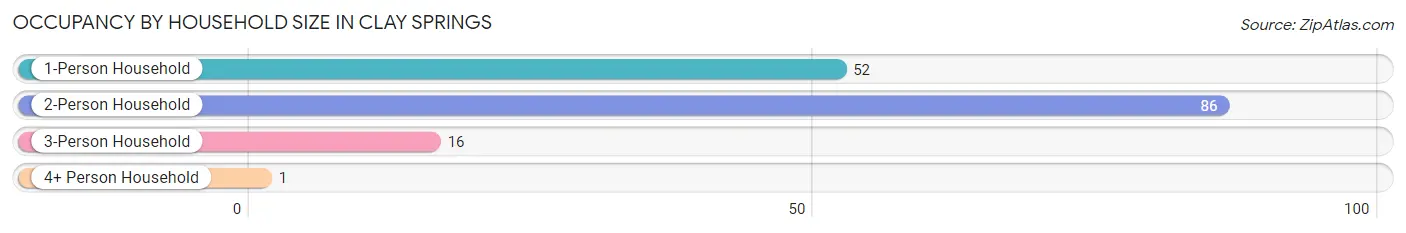
| Household Size | # Housing Units | % Housing Units |
| 1-Person Household | 52 | 33.6% |
| 2-Person Household | 86 | 55.5% |
| 3-Person Household | 16 | 10.3% |
| 4+ Person Household | 1 | 0.6% |
| Total Housing Units | 155 | 100.0% |
Occupancy by Ownership by Household Size in Clay Springs
| Household Size | Owner-occupied | Renter-occupied |
| 1-Person Household | 52 (100.0%) | 0 (0.0%) |
| 2-Person Household | 86 (100.0%) | 0 (0.0%) |
| 3-Person Household | 16 (100.0%) | 0 (0.0%) |
| 4+ Person Household | 1 (100.0%) | 0 (0.0%) |
| Total Housing Units | 155 (100.0%) | 0 (0.0%) |
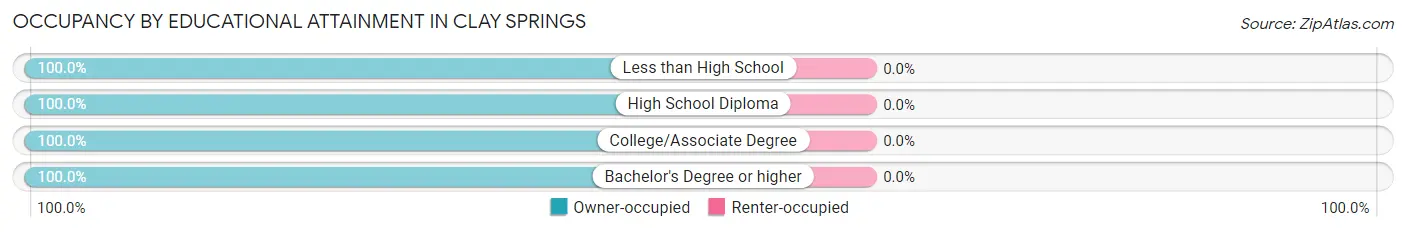
Occupancy by Educational Attainment in Clay Springs
| Household Size | Owner-occupied | Renter-occupied |
| Less than High School | 36 (100.0%) | 0 (0.0%) |
| High School Diploma | 20 (100.0%) | 0 (0.0%) |
| College/Associate Degree | 56 (100.0%) | 0 (0.0%) |
| Bachelor's Degree or higher | 43 (100.0%) | 0 (0.0%) |
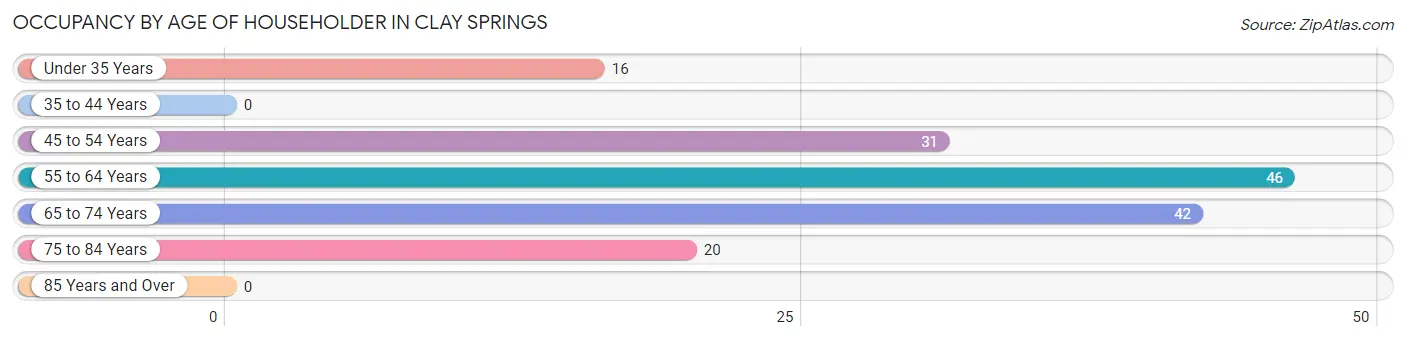
Occupancy by Age of Householder in Clay Springs
| Age Bracket | # Households | % Households |
| Under 35 Years | 16 | 10.3% |
| 35 to 44 Years | 0 | 0.0% |
| 45 to 54 Years | 31 | 20.0% |
| 55 to 64 Years | 46 | 29.7% |
| 65 to 74 Years | 42 | 27.1% |
| 75 to 84 Years | 20 | 12.9% |
| 85 Years and Over | 0 | 0.0% |
| Total | 155 | 100.0% |
Housing Finances in Clay Springs
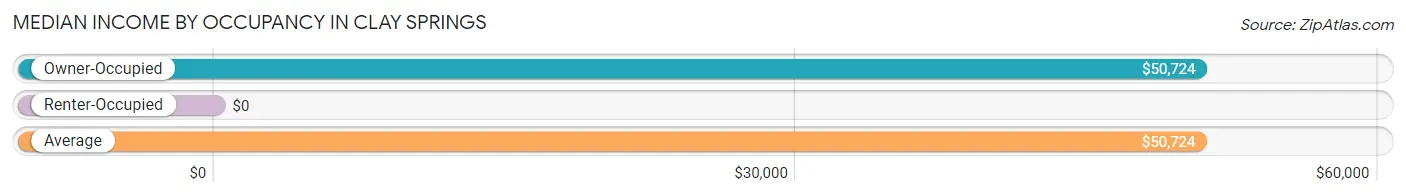
Median Income by Occupancy in Clay Springs
| Occupancy Type | # Households | Median Income |
| Owner-Occupied | 155 (100.0%) | $50,724 |
| Renter-Occupied | 0 (0.0%) | $0 |
| Average | 155 (100.0%) | $50,724 |
Occupancy by Householder Income Bracket in Clay Springs
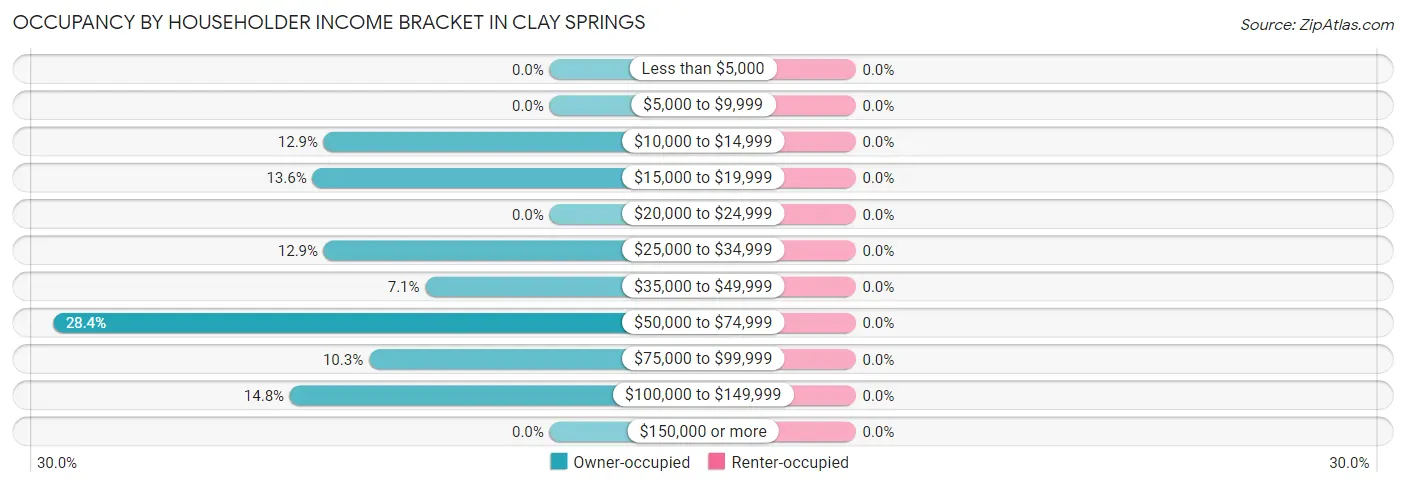
| Income Bracket | Owner-occupied | Renter-occupied |
| Less than $5,000 | 0 (0.0%) | 0 (0.0%) |
| $5,000 to $9,999 | 0 (0.0%) | 0 (0.0%) |
| $10,000 to $14,999 | 20 (12.9%) | 0 (0.0%) |
| $15,000 to $19,999 | 21 (13.6%) | 0 (0.0%) |
| $20,000 to $24,999 | 0 (0.0%) | 0 (0.0%) |
| $25,000 to $34,999 | 20 (12.9%) | 0 (0.0%) |
| $35,000 to $49,999 | 11 (7.1%) | 0 (0.0%) |
| $50,000 to $74,999 | 44 (28.4%) | 0 (0.0%) |
| $75,000 to $99,999 | 16 (10.3%) | 0 (0.0%) |
| $100,000 to $149,999 | 23 (14.8%) | 0 (0.0%) |
| $150,000 or more | 0 (0.0%) | 0 (0.0%) |
| Total | 155 (100.0%) | 0 (0.0%) |
Monthly Housing Cost Tiers in Clay Springs
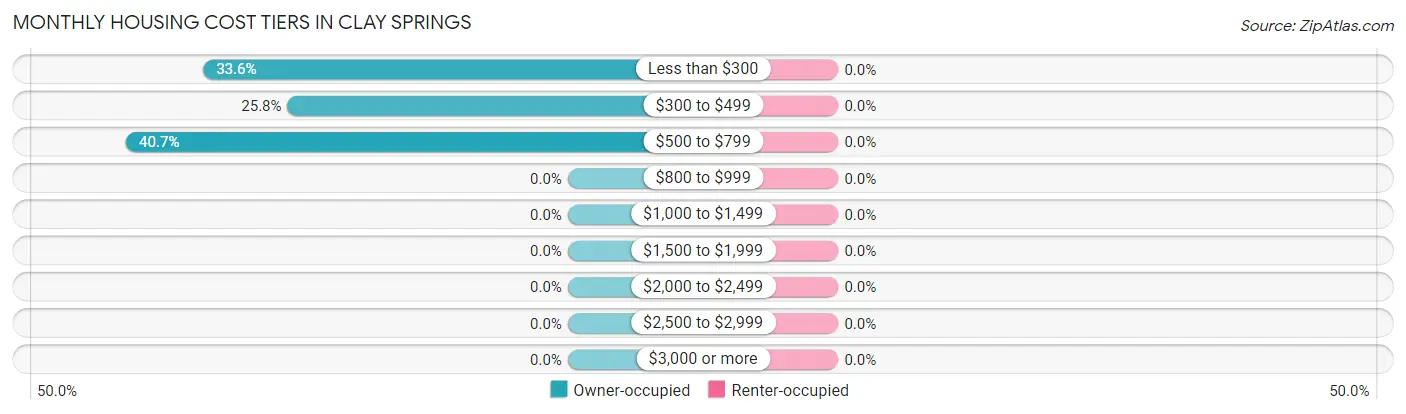
| Monthly Cost | Owner-occupied | Renter-occupied |
| Less than $300 | 52 (33.6%) | 0 (0.0%) |
| $300 to $499 | 40 (25.8%) | 0 (0.0%) |
| $500 to $799 | 63 (40.6%) | 0 (0.0%) |
| $800 to $999 | 0 (0.0%) | 0 (0.0%) |
| $1,000 to $1,499 | 0 (0.0%) | 0 (0.0%) |
| $1,500 to $1,999 | 0 (0.0%) | 0 (0.0%) |
| $2,000 to $2,499 | 0 (0.0%) | 0 (0.0%) |
| $2,500 to $2,999 | 0 (0.0%) | 0 (0.0%) |
| $3,000 or more | 0 (0.0%) | 0 (0.0%) |
| Total | 155 (100.0%) | 0 (0.0%) |
Physical Housing Characteristics in Clay Springs
Housing Structures in Clay Springs
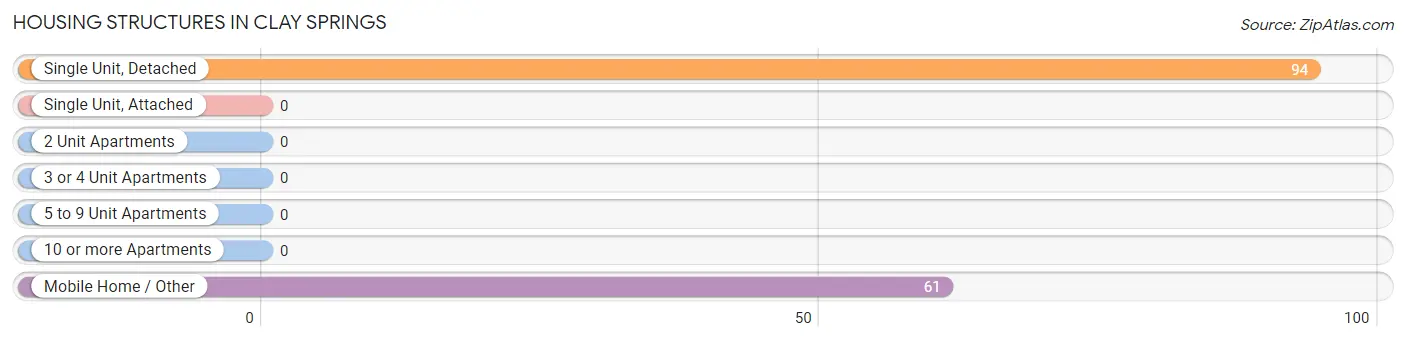
| Structure Type | # Housing Units | % Housing Units |
| Single Unit, Detached | 94 | 60.7% |
| Single Unit, Attached | 0 | 0.0% |
| 2 Unit Apartments | 0 | 0.0% |
| 3 or 4 Unit Apartments | 0 | 0.0% |
| 5 to 9 Unit Apartments | 0 | 0.0% |
| 10 or more Apartments | 0 | 0.0% |
| Mobile Home / Other | 61 | 39.4% |
| Total | 155 | 100.0% |
Housing Structures by Occupancy in Clay Springs
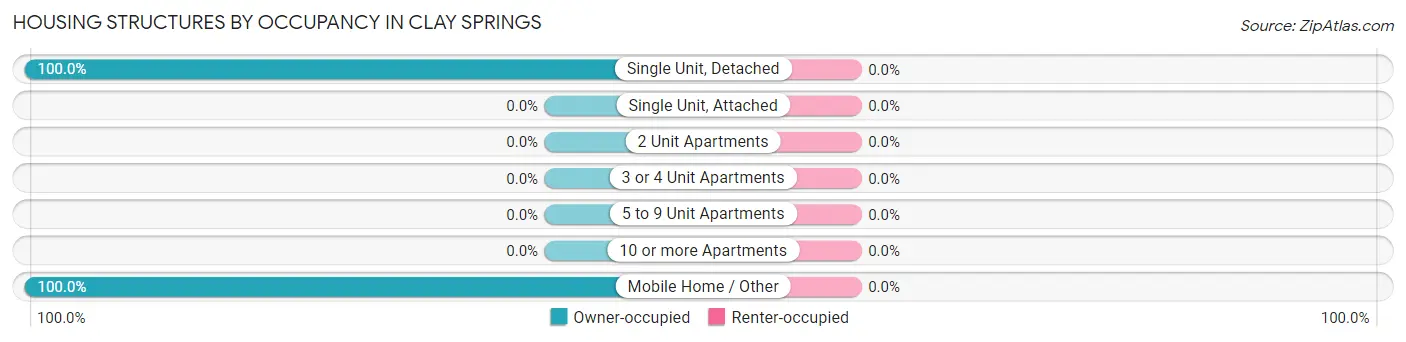
| Structure Type | Owner-occupied | Renter-occupied |
| Single Unit, Detached | 94 (100.0%) | 0 (0.0%) |
| Single Unit, Attached | 0 (0.0%) | 0 (0.0%) |
| 2 Unit Apartments | 0 (0.0%) | 0 (0.0%) |
| 3 or 4 Unit Apartments | 0 (0.0%) | 0 (0.0%) |
| 5 to 9 Unit Apartments | 0 (0.0%) | 0 (0.0%) |
| 10 or more Apartments | 0 (0.0%) | 0 (0.0%) |
| Mobile Home / Other | 61 (100.0%) | 0 (0.0%) |
| Total | 155 (100.0%) | 0 (0.0%) |
Housing Structures by Number of Rooms in Clay Springs
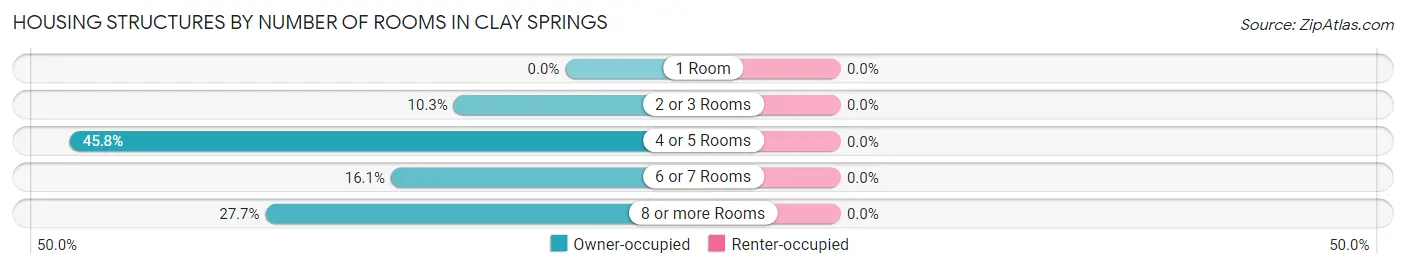
| Number of Rooms | Owner-occupied | Renter-occupied |
| 1 Room | 0 (0.0%) | 0 (0.0%) |
| 2 or 3 Rooms | 16 (10.3%) | 0 (0.0%) |
| 4 or 5 Rooms | 71 (45.8%) | 0 (0.0%) |
| 6 or 7 Rooms | 25 (16.1%) | 0 (0.0%) |
| 8 or more Rooms | 43 (27.7%) | 0 (0.0%) |
| Total | 155 (100.0%) | 0 (0.0%) |
Housing Structure by Heating Type in Clay Springs
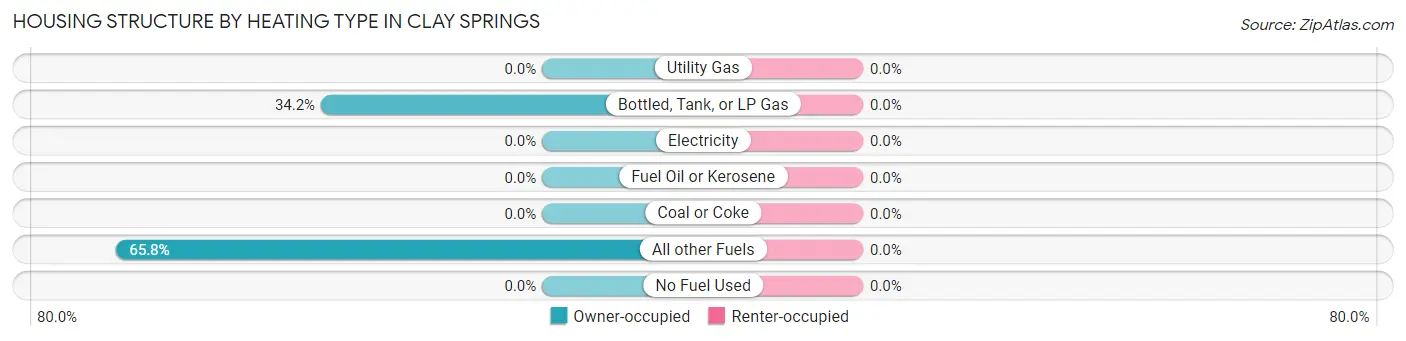
| Heating Type | Owner-occupied | Renter-occupied |
| Utility Gas | 0 (0.0%) | 0 (0.0%) |
| Bottled, Tank, or LP Gas | 53 (34.2%) | 0 (0.0%) |
| Electricity | 0 (0.0%) | 0 (0.0%) |
| Fuel Oil or Kerosene | 0 (0.0%) | 0 (0.0%) |
| Coal or Coke | 0 (0.0%) | 0 (0.0%) |
| All other Fuels | 102 (65.8%) | 0 (0.0%) |
| No Fuel Used | 0 (0.0%) | 0 (0.0%) |
| Total | 155 (100.0%) | 0 (0.0%) |
Household Vehicle Usage in Clay Springs
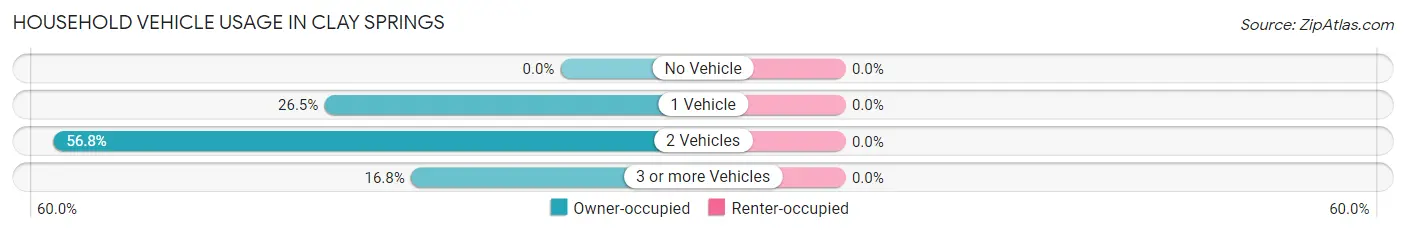
| Vehicles per Household | Owner-occupied | Renter-occupied |
| No Vehicle | 0 (0.0%) | 0 (0.0%) |
| 1 Vehicle | 41 (26.5%) | 0 (0.0%) |
| 2 Vehicles | 88 (56.8%) | 0 (0.0%) |
| 3 or more Vehicles | 26 (16.8%) | 0 (0.0%) |
| Total | 155 (100.0%) | 0 (0.0%) |
Real Estate & Mortgages in Clay Springs
Real Estate and Mortgage Overview in Clay Springs
| Characteristic | Without Mortgage | With Mortgage |
| Housing Units | 136 | 19 |
| Median Property Value | - | - |
| Median Household Income | - | - |
| Monthly Housing Costs | - | - |
| Real Estate Taxes | $481 | $0 |
Property Value by Mortgage Status in Clay Springs
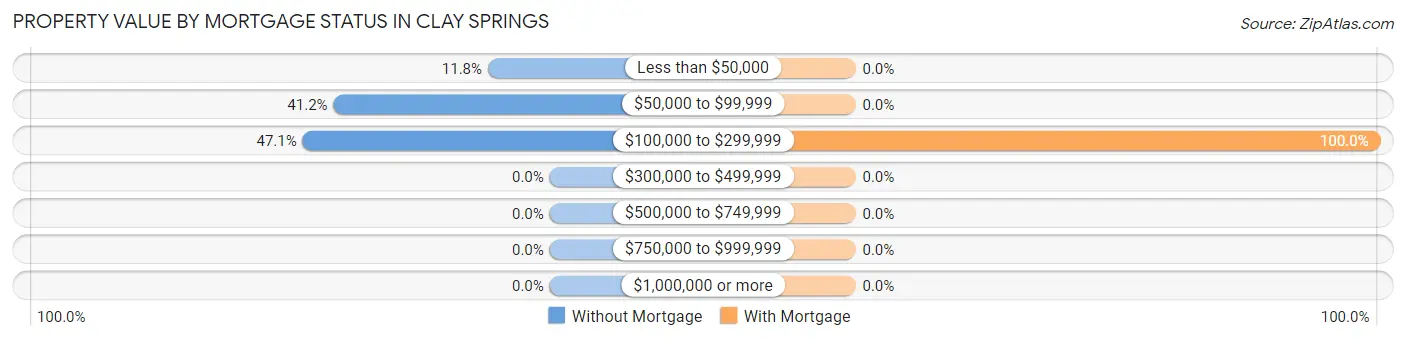
| Property Value | Without Mortgage | With Mortgage |
| Less than $50,000 | 16 (11.8%) | 0 (0.0%) |
| $50,000 to $99,999 | 56 (41.2%) | 0 (0.0%) |
| $100,000 to $299,999 | 64 (47.1%) | 19 (100.0%) |
| $300,000 to $499,999 | 0 (0.0%) | 0 (0.0%) |
| $500,000 to $749,999 | 0 (0.0%) | 0 (0.0%) |
| $750,000 to $999,999 | 0 (0.0%) | 0 (0.0%) |
| $1,000,000 or more | 0 (0.0%) | 0 (0.0%) |
| Total | 136 (100.0%) | 19 (100.0%) |
Household Income by Mortgage Status in Clay Springs
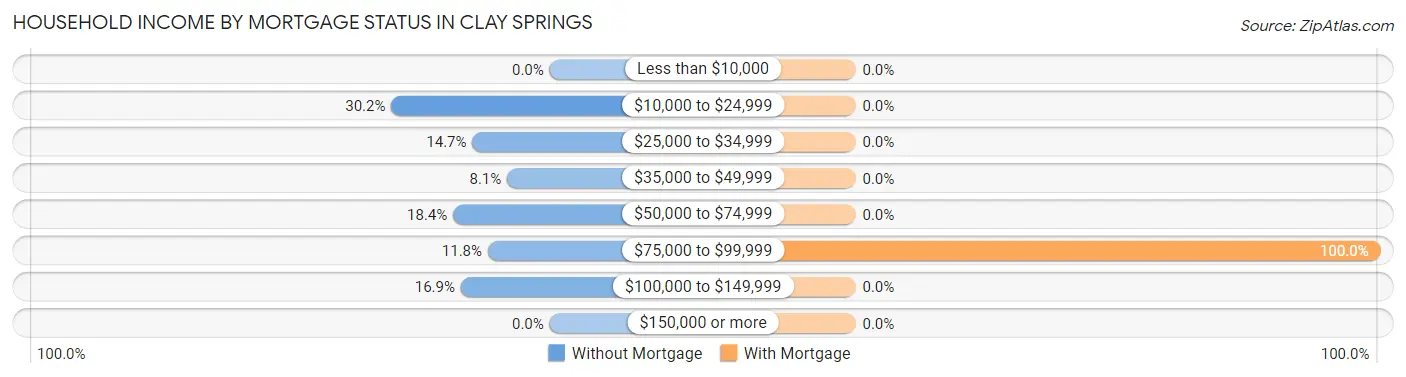
| Household Income | Without Mortgage | With Mortgage |
| Less than $10,000 | 0 (0.0%) | 0 (0.0%) |
| $10,000 to $24,999 | 41 (30.1%) | 0 (0.0%) |
| $25,000 to $34,999 | 20 (14.7%) | 0 (0.0%) |
| $35,000 to $49,999 | 11 (8.1%) | 0 (0.0%) |
| $50,000 to $74,999 | 25 (18.4%) | 0 (0.0%) |
| $75,000 to $99,999 | 16 (11.8%) | 19 (100.0%) |
| $100,000 to $149,999 | 23 (16.9%) | 0 (0.0%) |
| $150,000 or more | 0 (0.0%) | 0 (0.0%) |
| Total | 136 (100.0%) | 19 (100.0%) |
Property Value to Household Income Ratio in Clay Springs
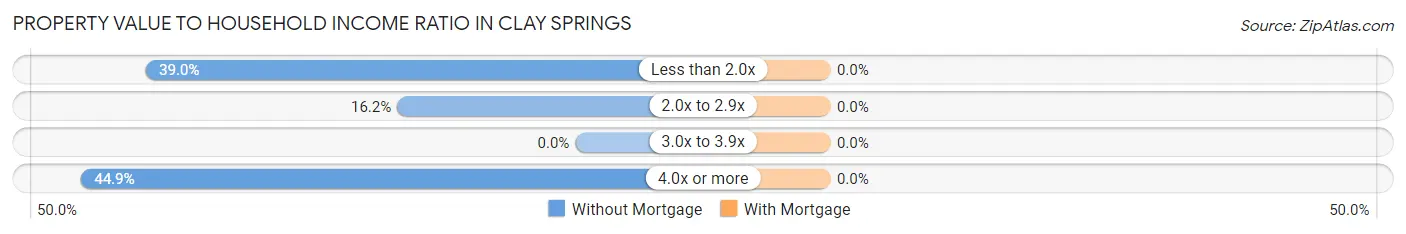
| Value-to-Income Ratio | Without Mortgage | With Mortgage |
| Less than 2.0x | 53 (39.0%) | 0 (0.0%) |
| 2.0x to 2.9x | 22 (16.2%) | 0 (0.0%) |
| 3.0x to 3.9x | 0 (0.0%) | 0 (0.0%) |
| 4.0x or more | 61 (44.9%) | 0 (0.0%) |
| Total | 136 (100.0%) | 19 (100.0%) |
Real Estate Taxes by Mortgage Status in Clay Springs
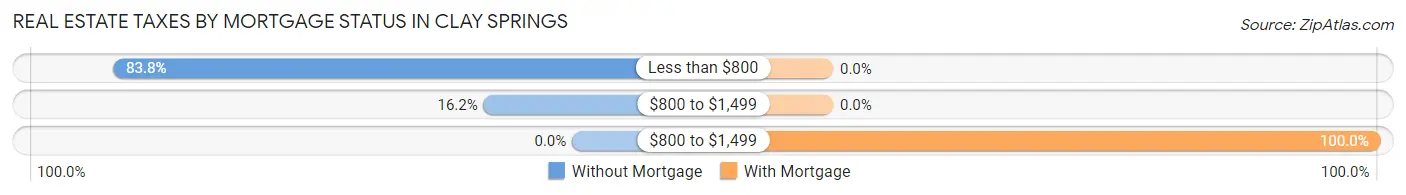
| Property Taxes | Without Mortgage | With Mortgage |
| Less than $800 | 114 (83.8%) | 0 (0.0%) |
| $800 to $1,499 | 22 (16.2%) | 0 (0.0%) |
| $800 to $1,499 | 0 (0.0%) | 19 (100.0%) |
| Total | 136 (100.0%) | 19 (100.0%) |
Health & Disability in Clay Springs
Health Insurance Coverage by Age in Clay Springs
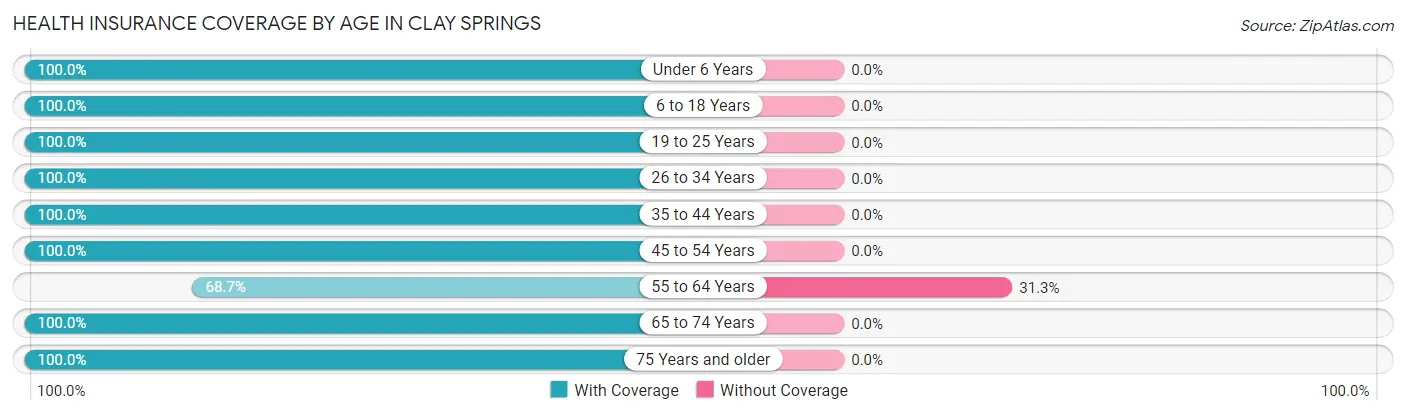
| Age Bracket | With Coverage | Without Coverage |
| Under 6 Years | 20 (100.0%) | 0 (0.0%) |
| 6 to 18 Years | 10 (100.0%) | 0 (0.0%) |
| 19 to 25 Years | 16 (100.0%) | 0 (0.0%) |
| 26 to 34 Years | 22 (100.0%) | 0 (0.0%) |
| 35 to 44 Years | 4 (100.0%) | 0 (0.0%) |
| 45 to 54 Years | 54 (100.0%) | 0 (0.0%) |
| 55 to 64 Years | 46 (68.7%) | 21 (31.3%) |
| 65 to 74 Years | 87 (100.0%) | 0 (0.0%) |
| 75 Years and older | 20 (100.0%) | 0 (0.0%) |
| Total | 279 (93.0%) | 21 (7.0%) |
Health Insurance Coverage by Citizenship Status in Clay Springs
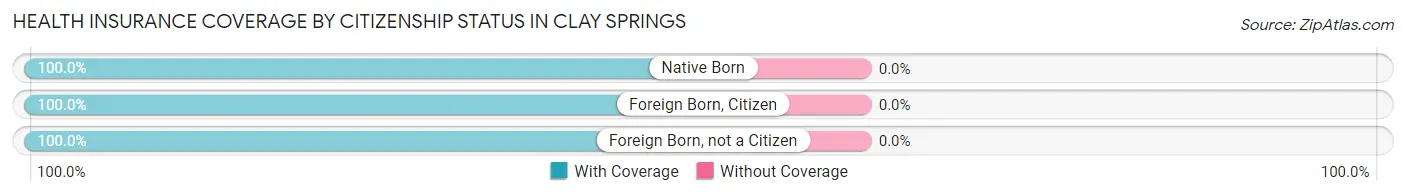
| Citizenship Status | With Coverage | Without Coverage |
| Native Born | 20 (100.0%) | 0 (0.0%) |
| Foreign Born, Citizen | 10 (100.0%) | 0 (0.0%) |
| Foreign Born, not a Citizen | 16 (100.0%) | 0 (0.0%) |
Health Insurance Coverage by Household Income in Clay Springs
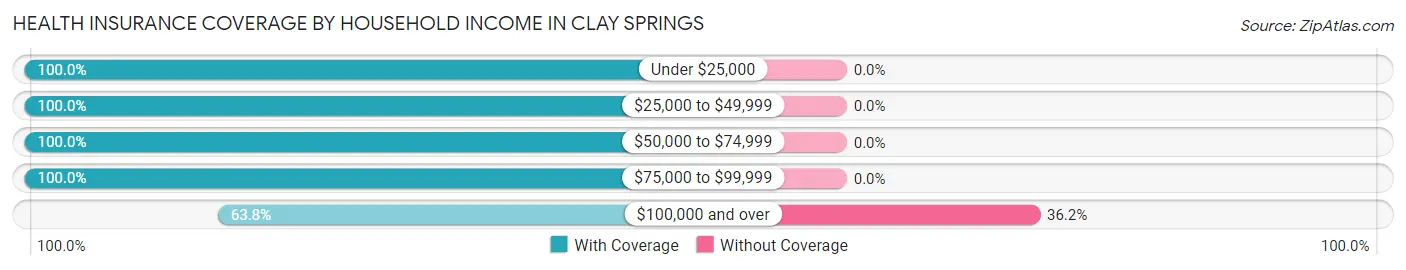
| Household Income | With Coverage | Without Coverage |
| Under $25,000 | 41 (100.0%) | 0 (0.0%) |
| $25,000 to $49,999 | 54 (100.0%) | 0 (0.0%) |
| $50,000 to $74,999 | 89 (100.0%) | 0 (0.0%) |
| $75,000 to $99,999 | 58 (100.0%) | 0 (0.0%) |
| $100,000 and over | 37 (63.8%) | 21 (36.2%) |
Public vs Private Health Insurance Coverage by Age in Clay Springs
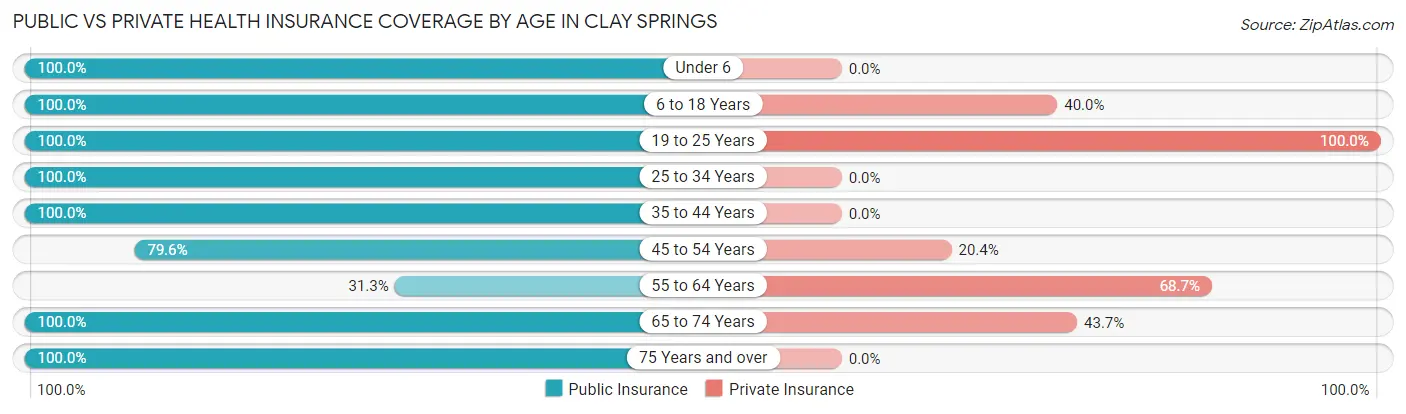
| Age Bracket | Public Insurance | Private Insurance |
| Under 6 | 20 (100.0%) | 0 (0.0%) |
| 6 to 18 Years | 10 (100.0%) | 4 (40.0%) |
| 19 to 25 Years | 16 (100.0%) | 16 (100.0%) |
| 25 to 34 Years | 22 (100.0%) | 0 (0.0%) |
| 35 to 44 Years | 4 (100.0%) | 0 (0.0%) |
| 45 to 54 Years | 43 (79.6%) | 11 (20.4%) |
| 55 to 64 Years | 21 (31.3%) | 46 (68.7%) |
| 65 to 74 Years | 87 (100.0%) | 38 (43.7%) |
| 75 Years and over | 20 (100.0%) | 0 (0.0%) |
| Total | 243 (81.0%) | 115 (38.3%) |
Disability Status by Sex by Age in Clay Springs
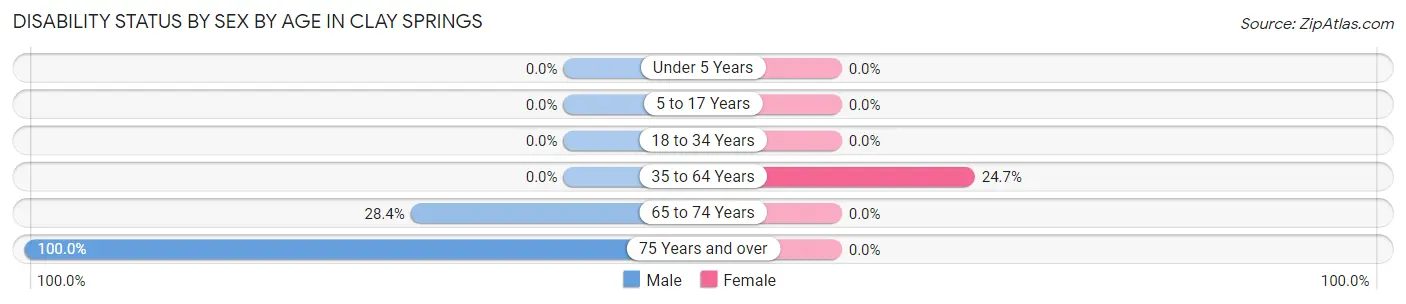
| Age Bracket | Male | Female |
| Under 5 Years | 0 (0.0%) | 0 (0.0%) |
| 5 to 17 Years | 0 (0.0%) | 0 (0.0%) |
| 18 to 34 Years | 0 (0.0%) | 0 (0.0%) |
| 35 to 64 Years | 0 (0.0%) | 20 (24.7%) |
| 65 to 74 Years | 19 (28.4%) | 0 (0.0%) |
| 75 Years and over | 20 (100.0%) | 0 (0.0%) |
Disability Class by Sex by Age in Clay Springs
Disability Class: Hearing Difficulty
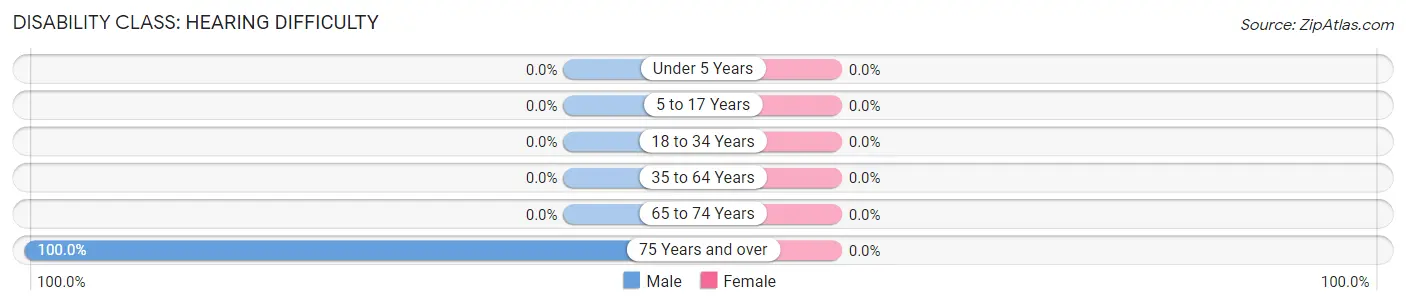
| Age Bracket | Male | Female |
| Under 5 Years | 0 (0.0%) | 0 (0.0%) |
| 5 to 17 Years | 0 (0.0%) | 0 (0.0%) |
| 18 to 34 Years | 0 (0.0%) | 0 (0.0%) |
| 35 to 64 Years | 0 (0.0%) | 0 (0.0%) |
| 65 to 74 Years | 0 (0.0%) | 0 (0.0%) |
| 75 Years and over | 20 (100.0%) | 0 (0.0%) |
Disability Class: Vision Difficulty
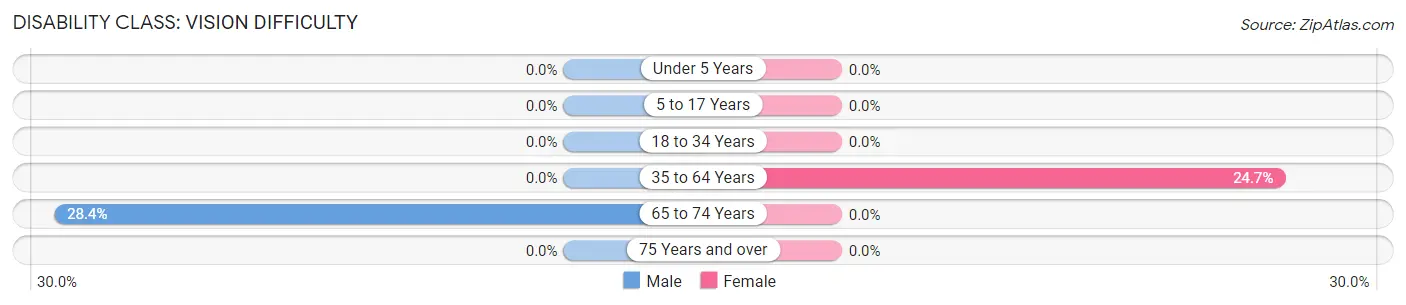
| Age Bracket | Male | Female |
| Under 5 Years | 0 (0.0%) | 0 (0.0%) |
| 5 to 17 Years | 0 (0.0%) | 0 (0.0%) |
| 18 to 34 Years | 0 (0.0%) | 0 (0.0%) |
| 35 to 64 Years | 0 (0.0%) | 20 (24.7%) |
| 65 to 74 Years | 19 (28.4%) | 0 (0.0%) |
| 75 Years and over | 0 (0.0%) | 0 (0.0%) |
Disability Class: Cognitive Difficulty
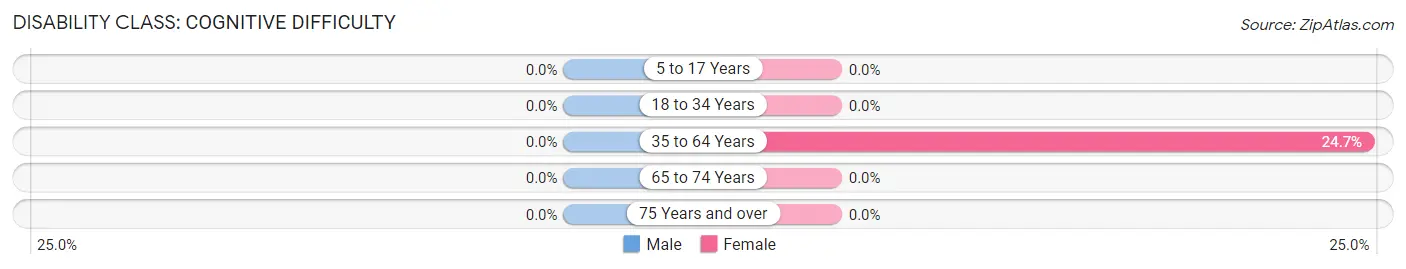
| Age Bracket | Male | Female |
| 5 to 17 Years | 0 (0.0%) | 0 (0.0%) |
| 18 to 34 Years | 0 (0.0%) | 0 (0.0%) |
| 35 to 64 Years | 0 (0.0%) | 20 (24.7%) |
| 65 to 74 Years | 0 (0.0%) | 0 (0.0%) |
| 75 Years and over | 0 (0.0%) | 0 (0.0%) |
Disability Class: Ambulatory Difficulty
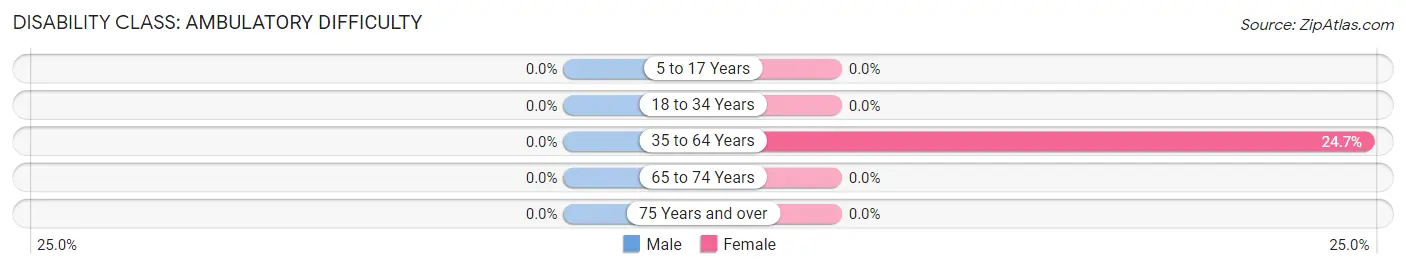
| Age Bracket | Male | Female |
| 5 to 17 Years | 0 (0.0%) | 0 (0.0%) |
| 18 to 34 Years | 0 (0.0%) | 0 (0.0%) |
| 35 to 64 Years | 0 (0.0%) | 20 (24.7%) |
| 65 to 74 Years | 0 (0.0%) | 0 (0.0%) |
| 75 Years and over | 0 (0.0%) | 0 (0.0%) |
Disability Class: Self-Care Difficulty
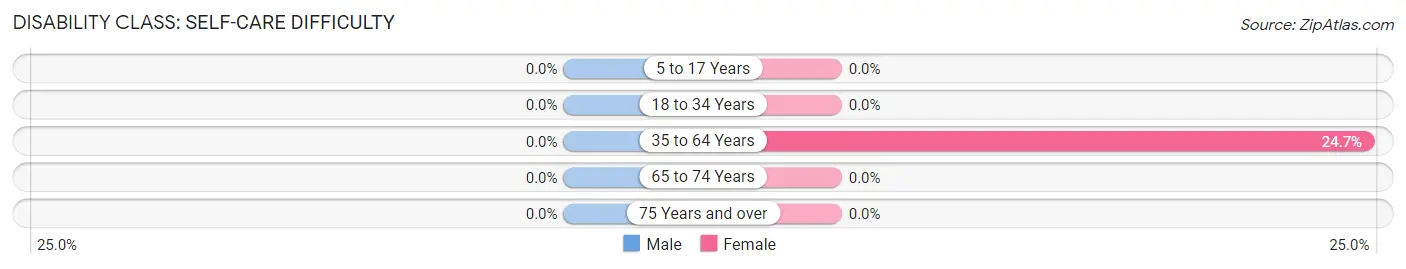
| Age Bracket | Male | Female |
| 5 to 17 Years | 0 (0.0%) | 0 (0.0%) |
| 18 to 34 Years | 0 (0.0%) | 0 (0.0%) |
| 35 to 64 Years | 0 (0.0%) | 20 (24.7%) |
| 65 to 74 Years | 0 (0.0%) | 0 (0.0%) |
| 75 Years and over | 0 (0.0%) | 0 (0.0%) |
Technology Access in Clay Springs
Computing Device Access in Clay Springs
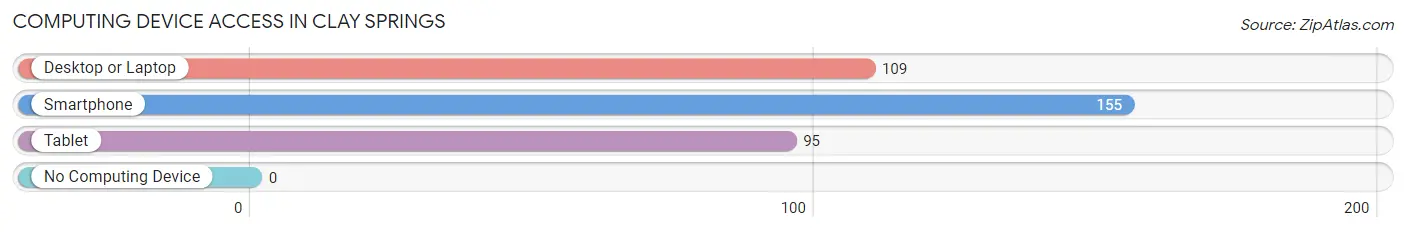
| Device Type | # Households | % Households |
| Desktop or Laptop | 109 | 70.3% |
| Smartphone | 155 | 100.0% |
| Tablet | 95 | 61.3% |
| No Computing Device | 0 | 0.0% |
| Total | 155 | 100.0% |
Internet Access in Clay Springs
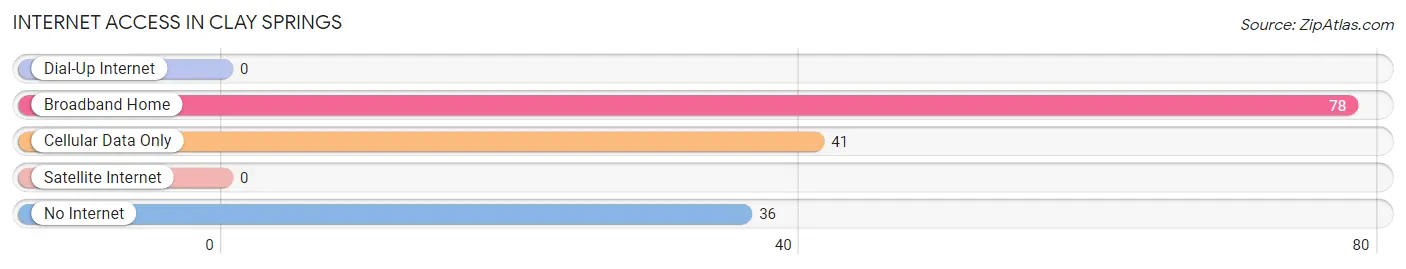
| Internet Type | # Households | % Households |
| Dial-Up Internet | 0 | 0.0% |
| Broadband Home | 78 | 50.3% |
| Cellular Data Only | 41 | 26.5% |
| Satellite Internet | 0 | 0.0% |
| No Internet | 36 | 23.2% |
| Total | 155 | 100.0% |
Clay Springs Summary
Clay Springs is a small unincorporated community located in Navajo County, Arizona. It is situated in the White Mountains of Arizona, approximately 30 miles east of Show Low. The town is located at an elevation of 6,400 feet and has a population of approximately 500 people.
History
Clay Springs was established in 1881 by a group of Mormon settlers who were looking for a place to settle and raise their families. The town was named after the nearby clay springs, which provided a source of water for the settlers. The town was originally a farming community, but it soon became a trading post for the local Native American tribes. The town also served as a stop on the stagecoach line between Show Low and St. Johns.
In the early 1900s, Clay Springs became a popular tourist destination due to its proximity to the White Mountains. The town was home to several resorts, including the Clay Springs Hotel, which was built in 1910. The hotel was a popular destination for tourists and was known for its mineral baths.
In the 1950s, Clay Springs began to decline as a tourist destination. The hotel closed in the 1960s and the town's population began to decline. In the 1970s, the town was revitalized by the construction of a ski resort, which brought new life to the area.
Geography
Clay Springs is located in the White Mountains of Arizona, approximately 30 miles east of Show Low. The town is situated at an elevation of 6,400 feet and is surrounded by the Apache-Sitgreaves National Forest. The town is located in a valley surrounded by mountains, including the White Mountains, the San Francisco Peaks, and the Mogollon Rim.
The climate in Clay Springs is semi-arid, with hot summers and cold winters. The average annual temperature is approximately 50 degrees Fahrenheit. The town receives an average of 12 inches of precipitation per year, with most of it falling in the summer months.
Economy
The economy of Clay Springs is largely based on tourism. The town is home to several resorts, including the Clay Springs Hotel, which was built in 1910. The hotel is a popular destination for tourists and is known for its mineral baths. The town is also home to several restaurants, shops, and other businesses.
The town is also home to several outdoor recreation activities, including hiking, camping, fishing, and skiing. The nearby Apache-Sitgreaves National Forest provides a variety of recreational opportunities, including camping, hiking, and fishing.
Demographics
As of the 2010 census, Clay Springs had a population of 500 people. The racial makeup of the town was 95.2% White, 0.6% Native American, 0.2% Asian, 0.2% from other races, and 3.8% from two or more races. The median household income was $31,250 and the median family income was $35,000. The per capita income was $14,818.
Conclusion
Clay Springs is a small unincorporated community located in Navajo County, Arizona. It is situated in the White Mountains of Arizona, approximately 30 miles east of Show Low. The town is located at an elevation of 6,400 feet and has a population of approximately 500 people. The economy of Clay Springs is largely based on tourism, with several resorts, restaurants, and other businesses located in the town. The town is also home to several outdoor recreation activities, including hiking, camping, fishing, and skiing. As of the 2010 census, Clay Springs had a population of 500 people, with a median household income of $31,250 and a median family income of $35,000.
Common Questions
What is Per Capita Income in Clay Springs?
Per Capita income in Clay Springs is $31,009.
What is the Median Family Income in Clay Springs?
Median Family Income in Clay Springs is $74,750.
What is the Median Household income in Clay Springs?
Median Household Income in Clay Springs is $50,724.
What is Inequality or Gini Index in Clay Springs?
Inequality or Gini Index in Clay Springs is 0.35.
What is the Total Population of Clay Springs?
Total Population of Clay Springs is 300.
What is the Total Male Population of Clay Springs?
Total Male Population of Clay Springs is 167.
What is the Total Female Population of Clay Springs?
Total Female Population of Clay Springs is 133.
What is the Ratio of Males per 100 Females in Clay Springs?
There are 125.56 Males per 100 Females in Clay Springs.
What is the Ratio of Females per 100 Males in Clay Springs?
There are 79.64 Females per 100 Males in Clay Springs.
What is the Median Population Age in Clay Springs?
Median Population Age in Clay Springs is 63.1 Years.
What is the Average Family Size in Clay Springs
Average Family Size in Clay Springs is 2.5 People.
What is the Average Household Size in Clay Springs
Average Household Size in Clay Springs is 1.9 People.
How Large is the Labor Force in Clay Springs?
There are 104 People in the Labor Forcein in Clay Springs.
What is the Percentage of People in the Labor Force in Clay Springs?
38.0% of People are in the Labor Force in Clay Springs.
What is the Unemployment Rate in Clay Springs?
Unemployment Rate in Clay Springs is 15.4%.