Little River, CA Map & Demographics
Little River Map
Little River Overview
$17,750
PER CAPITA INCOME
$2,499
AVG FAMILY INCOME
64.4%
WAGE / INCOME GAP [ % ]
35.6¢/ $1
WAGE / INCOME GAP [ $ ]
0.62
INEQUALITY / GINI INDEX
223
TOTAL POPULATION
49
MALE POPULATION
174
FEMALE POPULATION
28.16
MALES / 100 FEMALES
355.10
FEMALES / 100 MALES
30.6
MEDIAN AGE
2.5
AVG FAMILY SIZE
2.2
AVG HOUSEHOLD SIZE
98
LABOR FORCE [ PEOPLE ]
49.5%
PERCENT IN LABOR FORCE
Little River Zip Codes
Little River Area Codes
Income in Little River
Income Overview in Little River
| Characteristic | Number | Measure |
| Per Capita Income | 223 | $17,750 |
| Median Family Income | 58 | $2,499 |
| Mean Family Income | 58 | $27,803 |
| Median Household Income | 101 | $0 |
| Mean Household Income | 101 | $36,797 |
| Income Deficit | 58 | $0 |
| Wage / Income Gap (%) | 223 | 64.35% |
| Wage / Income Gap ($) | 223 | 35.65¢ per $1 |
| Gini / Inequality Index | 223 | 0.62 |
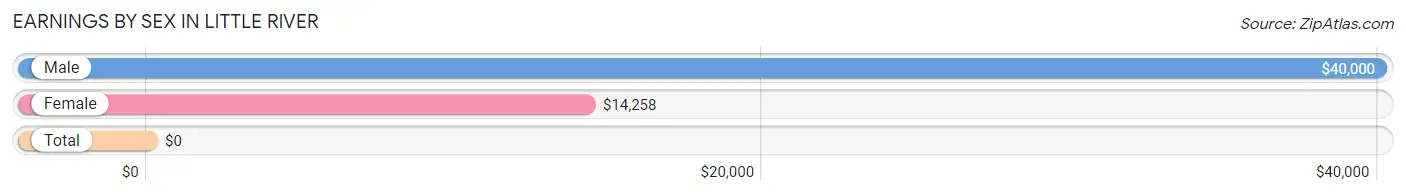
Earnings by Sex in Little River
| Sex | Number | Average Earnings |
| Male | 32 (29.4%) | $40,000 |
| Female | 77 (70.6%) | $14,258 |
| Total | 109 (100.0%) | $0 |
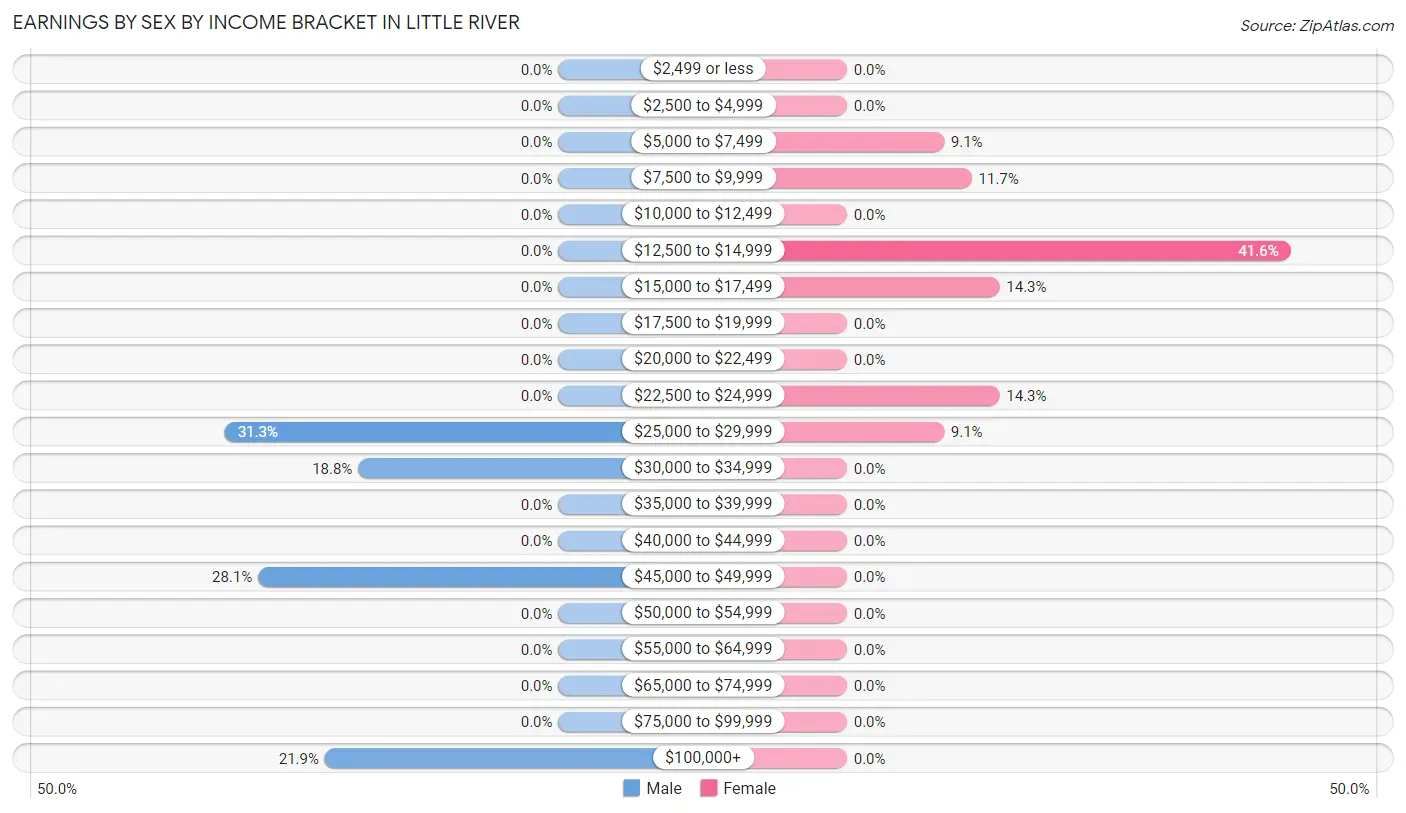
Earnings by Sex by Income Bracket in Little River
The most common earnings brackets in Little River are $25,000 to $29,999 for men (10 | 31.2%) and $12,500 to $14,999 for women (32 | 41.6%).
| Income | Male | Female |
| $2,499 or less | 0 (0.0%) | 0 (0.0%) |
| $2,500 to $4,999 | 0 (0.0%) | 0 (0.0%) |
| $5,000 to $7,499 | 0 (0.0%) | 7 (9.1%) |
| $7,500 to $9,999 | 0 (0.0%) | 9 (11.7%) |
| $10,000 to $12,499 | 0 (0.0%) | 0 (0.0%) |
| $12,500 to $14,999 | 0 (0.0%) | 32 (41.6%) |
| $15,000 to $17,499 | 0 (0.0%) | 11 (14.3%) |
| $17,500 to $19,999 | 0 (0.0%) | 0 (0.0%) |
| $20,000 to $22,499 | 0 (0.0%) | 0 (0.0%) |
| $22,500 to $24,999 | 0 (0.0%) | 11 (14.3%) |
| $25,000 to $29,999 | 10 (31.2%) | 7 (9.1%) |
| $30,000 to $34,999 | 6 (18.8%) | 0 (0.0%) |
| $35,000 to $39,999 | 0 (0.0%) | 0 (0.0%) |
| $40,000 to $44,999 | 0 (0.0%) | 0 (0.0%) |
| $45,000 to $49,999 | 9 (28.1%) | 0 (0.0%) |
| $50,000 to $54,999 | 0 (0.0%) | 0 (0.0%) |
| $55,000 to $64,999 | 0 (0.0%) | 0 (0.0%) |
| $65,000 to $74,999 | 0 (0.0%) | 0 (0.0%) |
| $75,000 to $99,999 | 0 (0.0%) | 0 (0.0%) |
| $100,000+ | 7 (21.9%) | 0 (0.0%) |
| Total | 32 (100.0%) | 77 (100.0%) |
Earnings by Sex by Educational Attainment in Little River
| Educational Attainment | Male Income | Female Income |
| Less than High School | - | - |
| High School Diploma | - | - |
| College or Associate's Degree | - | - |
| Bachelor's Degree | - | - |
| Graduate Degree | - | - |
| Total | $46,389 | $13,828 |
Family Income in Little River
Family Income Brackets in Little River
According to the Little River family income data, there are 35 families falling into the less than $10,000 income range, which is the most common income bracket and makes up 60.3% of all families.
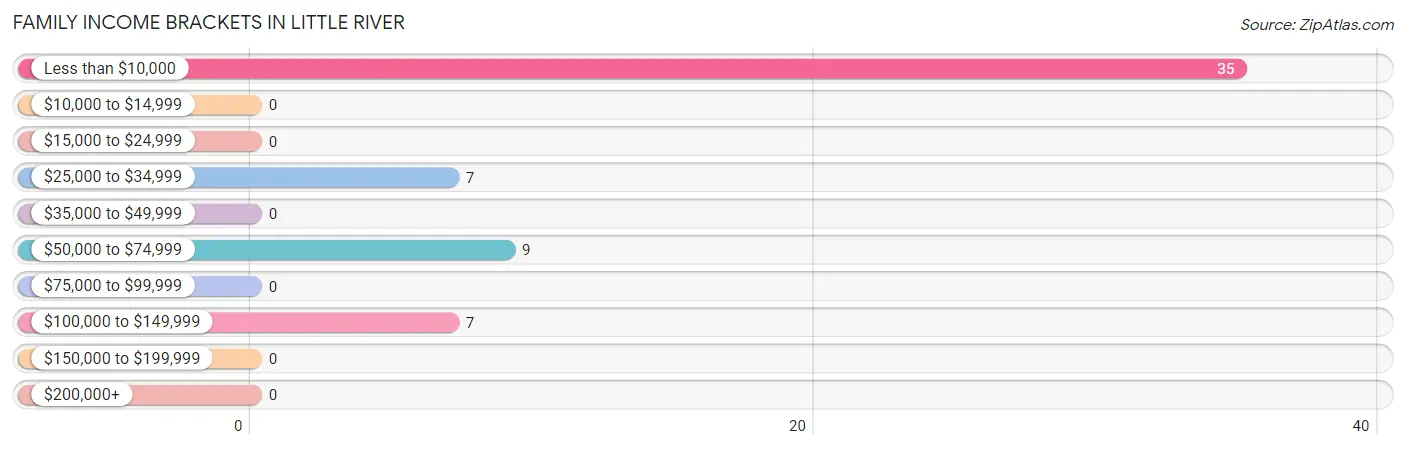
| Income Bracket | # Families | % Families |
| Less than $10,000 | 35 | 60.3% |
| $10,000 to $14,999 | 0 | 0.0% |
| $15,000 to $24,999 | 0 | 0.0% |
| $25,000 to $34,999 | 7 | 12.1% |
| $35,000 to $49,999 | 0 | 0.0% |
| $50,000 to $74,999 | 9 | 15.5% |
| $75,000 to $99,999 | 0 | 0.0% |
| $100,000 to $149,999 | 7 | 12.1% |
| $150,000 to $199,999 | 0 | 0.0% |
| $200,000+ | 0 | 0.0% |
Family Income by Famaliy Size in Little River
2-person families (51 | 87.9%) account for the highest median family income in Little River with $2,499 per family, while 2-person families (51 | 87.9%) have the highest median income of $1,250 per family member.
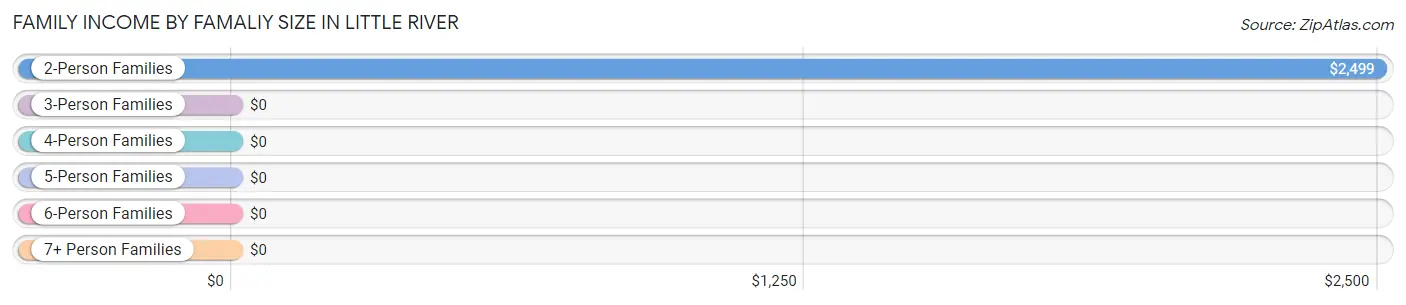
| Income Bracket | # Families | Median Income |
| 2-Person Families | 51 (87.9%) | $2,499 |
| 3-Person Families | 7 (12.1%) | $0 |
| 4-Person Families | 0 (0.0%) | $0 |
| 5-Person Families | 0 (0.0%) | $0 |
| 6-Person Families | 0 (0.0%) | $0 |
| 7+ Person Families | 0 (0.0%) | $0 |
| Total | 58 (100.0%) | $2,499 |
Family Income by Number of Earners in Little River
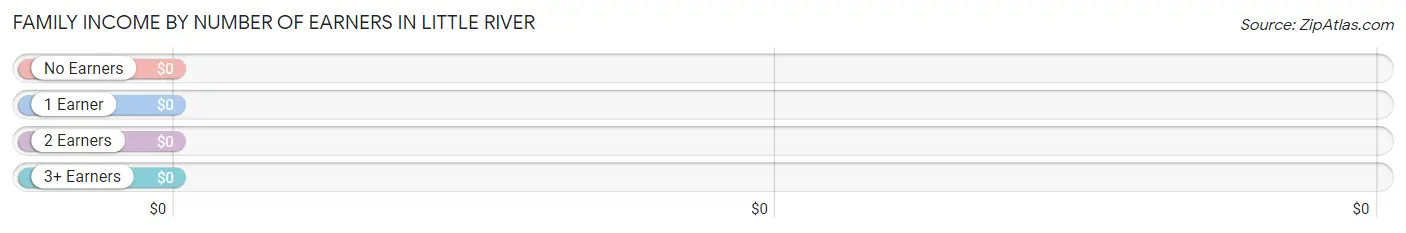
| Number of Earners | # Families | Median Income |
| No Earners | 35 (60.3%) | $0 |
| 1 Earner | 16 (27.6%) | $0 |
| 2 Earners | 7 (12.1%) | $0 |
| 3+ Earners | 0 (0.0%) | $0 |
| Total | 58 (100.0%) | $2,499 |
Household Income in Little River
Household Income Brackets in Little River
With 35 households falling in the category, the less than $10,000 income range is the most frequent in Little River, accounting for 34.6% of all households.
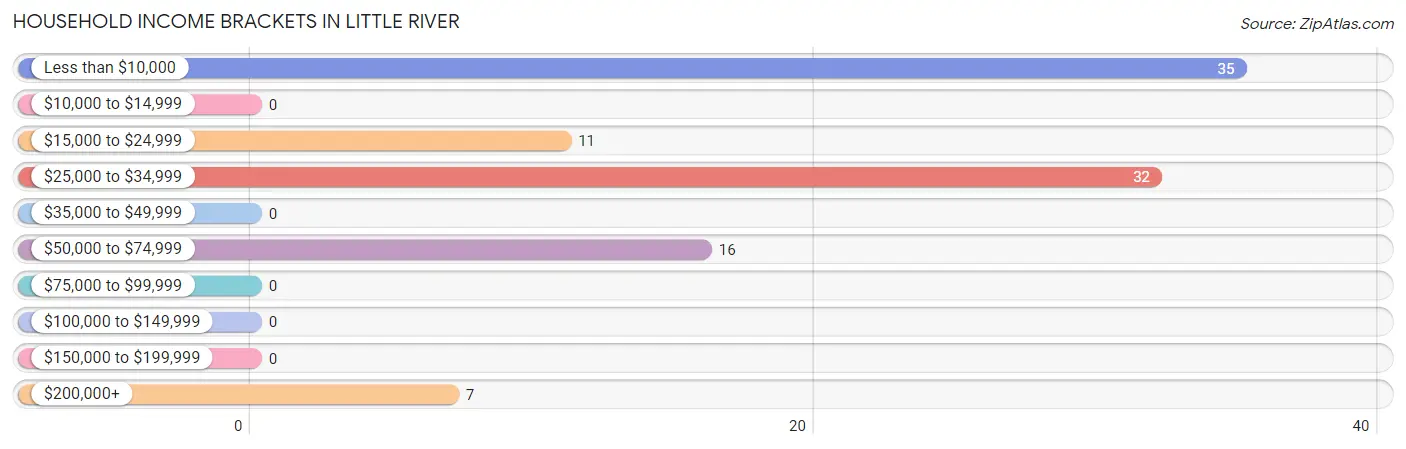
| Income Bracket | # Households | % Households |
| Less than $10,000 | 35 | 34.7% |
| $10,000 to $14,999 | 0 | 0.0% |
| $15,000 to $24,999 | 11 | 10.9% |
| $25,000 to $34,999 | 32 | 31.7% |
| $35,000 to $49,999 | 0 | 0.0% |
| $50,000 to $74,999 | 16 | 15.8% |
| $75,000 to $99,999 | 0 | 0.0% |
| $100,000 to $149,999 | 0 | 0.0% |
| $150,000 to $199,999 | 0 | 0.0% |
| $200,000+ | 7 | 6.9% |
Household Income by Householder Age in Little River
| Income Bracket | # Households | Median Income |
| 15 to 24 Years | 0 (0.0%) | $0 |
| 25 to 44 Years | 14 (13.9%) | $0 |
| 45 to 64 Years | 44 (43.6%) | $0 |
| 65+ Years | 43 (42.6%) | $0 |
| Total | 101 (100.0%) | $0 |
Poverty in Little River
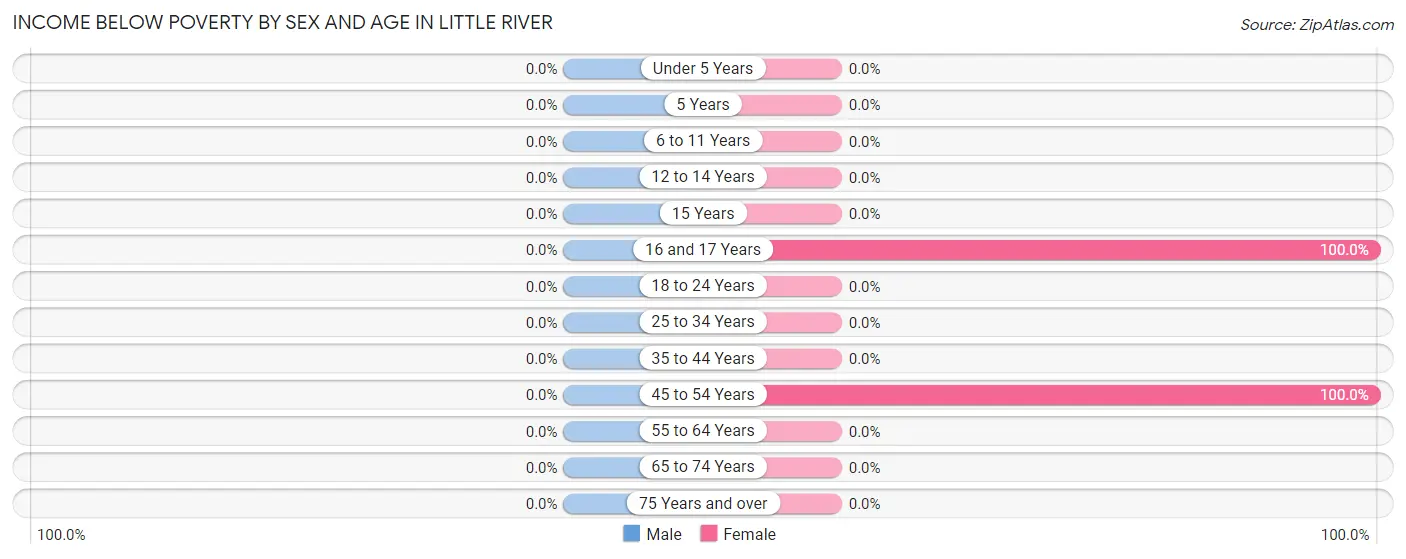
Income Below Poverty by Sex and Age in Little River
| Age Bracket | Male | Female |
| Under 5 Years | 0 (0.0%) | 0 (0.0%) |
| 5 Years | 0 (0.0%) | 0 (0.0%) |
| 6 to 11 Years | 0 (0.0%) | 0 (0.0%) |
| 12 to 14 Years | 0 (0.0%) | 0 (0.0%) |
| 15 Years | 0 (0.0%) | 0 (0.0%) |
| 16 and 17 Years | 0 (0.0%) | 54 (100.0%) |
| 18 to 24 Years | 0 (0.0%) | 0 (0.0%) |
| 25 to 34 Years | 0 (0.0%) | 0 (0.0%) |
| 35 to 44 Years | 0 (0.0%) | 0 (0.0%) |
| 45 to 54 Years | 0 (0.0%) | 35 (100.0%) |
| 55 to 64 Years | 0 (0.0%) | 0 (0.0%) |
| 65 to 74 Years | 0 (0.0%) | 0 (0.0%) |
| 75 Years and over | 0 (0.0%) | 0 (0.0%) |
| Total | 0 (0.0%) | 89 (51.1%) |
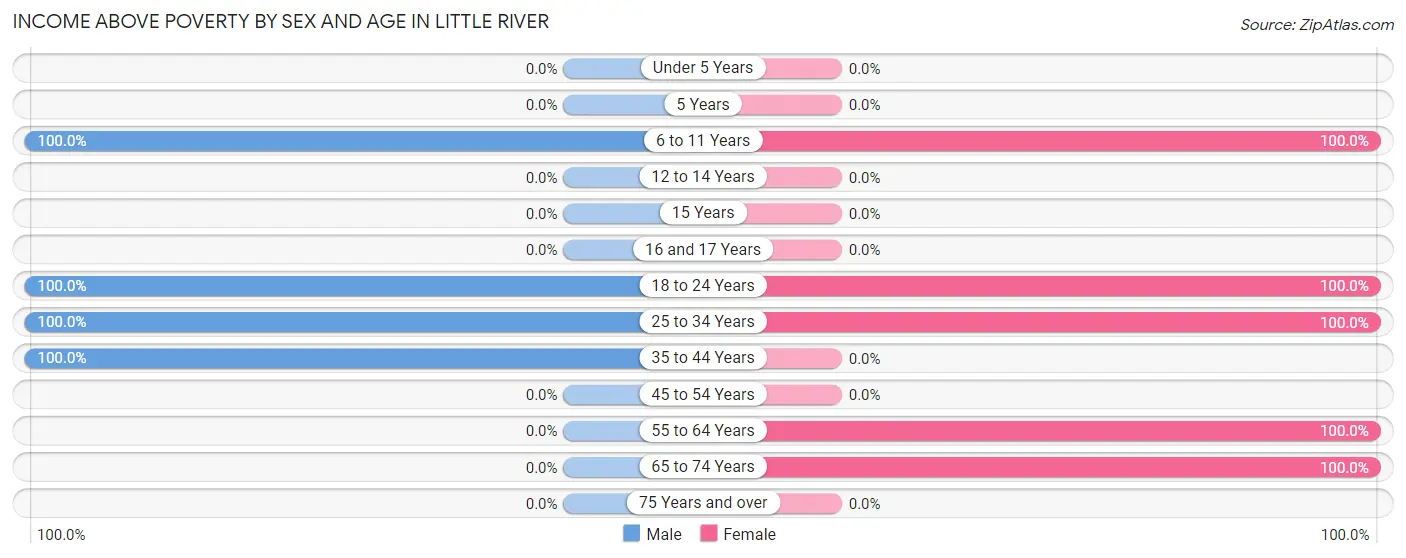
Income Above Poverty by Sex and Age in Little River
According to the poverty statistics in Little River, males aged 6 to 11 years and females aged 6 to 11 years are the age groups that are most secure financially, with 100.0% of males and 100.0% of females in these age groups living above the poverty line.
| Age Bracket | Male | Female |
| Under 5 Years | 0 (0.0%) | 0 (0.0%) |
| 5 Years | 0 (0.0%) | 0 (0.0%) |
| 6 to 11 Years | 17 (100.0%) | 8 (100.0%) |
| 12 to 14 Years | 0 (0.0%) | 0 (0.0%) |
| 15 Years | 0 (0.0%) | 0 (0.0%) |
| 16 and 17 Years | 0 (0.0%) | 0 (0.0%) |
| 18 to 24 Years | 10 (100.0%) | 11 (100.0%) |
| 25 to 34 Years | 13 (100.0%) | 14 (100.0%) |
| 35 to 44 Years | 9 (100.0%) | 0 (0.0%) |
| 45 to 54 Years | 0 (0.0%) | 0 (0.0%) |
| 55 to 64 Years | 0 (0.0%) | 9 (100.0%) |
| 65 to 74 Years | 0 (0.0%) | 43 (100.0%) |
| 75 Years and over | 0 (0.0%) | 0 (0.0%) |
| Total | 49 (100.0%) | 85 (48.8%) |
Income Below Poverty Among Married-Couple Families in Little River
| Children | Above Poverty | Below Poverty |
| No Children | 0 (0.0%) | 0 (0.0%) |
| 1 or 2 Children | 0 (0.0%) | 0 (0.0%) |
| 3 or 4 Children | 0 (0.0%) | 0 (0.0%) |
| 5 or more Children | 0 (0.0%) | 0 (0.0%) |
| Total | 0 (0.0%) | 0 (0.0%) |
Income Below Poverty Among Single-Parent Households in Little River
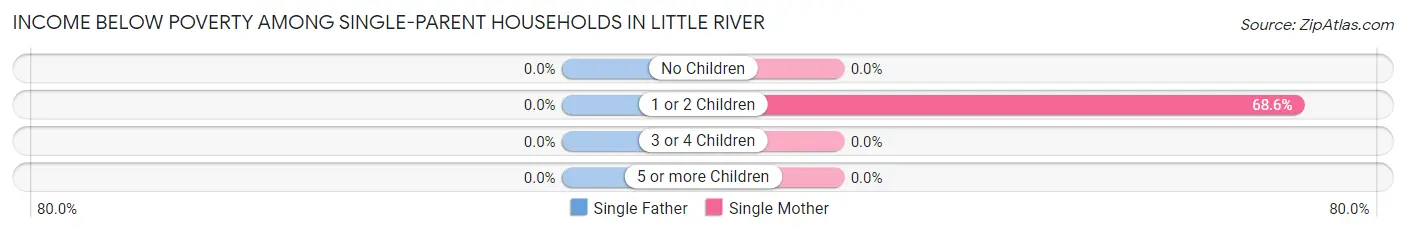
| Children | Single Father | Single Mother |
| No Children | 0 (0.0%) | 0 (0.0%) |
| 1 or 2 Children | 0 (0.0%) | 35 (68.6%) |
| 3 or 4 Children | 0 (0.0%) | 0 (0.0%) |
| 5 or more Children | 0 (0.0%) | 0 (0.0%) |
| Total | 0 (0.0%) | 35 (60.3%) |
Income Below Poverty Among Married-Couple vs Single-Parent Households in Little River
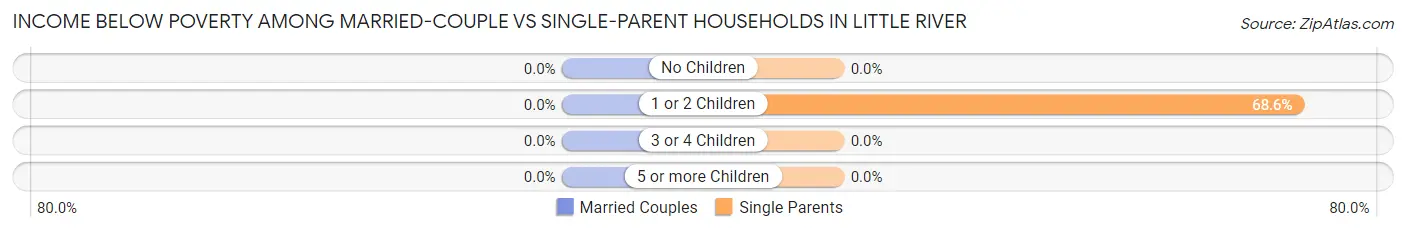
| Children | Married-Couple Families | Single-Parent Households |
| No Children | 0 (0.0%) | 0 (0.0%) |
| 1 or 2 Children | 0 (0.0%) | 35 (68.6%) |
| 3 or 4 Children | 0 (0.0%) | 0 (0.0%) |
| 5 or more Children | 0 (0.0%) | 0 (0.0%) |
| Total | 0 (0.0%) | 35 (60.3%) |
Race in Little River
The most populous races in Little River are White / Caucasian (179 | 80.3%), Hispanic or Latino (82 | 36.8%), and Two or more Races (44 | 19.7%).
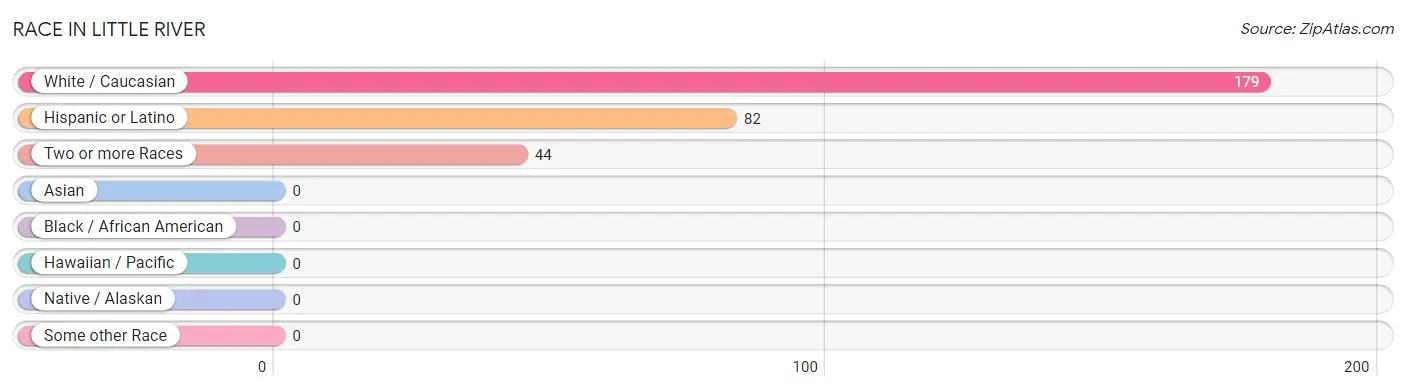
| Race | # Population | % Population |
| Asian | 0 | 0.0% |
| Black / African American | 0 | 0.0% |
| Hawaiian / Pacific | 0 | 0.0% |
| Hispanic or Latino | 82 | 36.8% |
| Native / Alaskan | 0 | 0.0% |
| White / Caucasian | 179 | 80.3% |
| Two or more Races | 44 | 19.7% |
| Some other Race | 0 | 0.0% |
| Total | 223 | 100.0% |
Ancestry in Little River
The most populous ancestries reported in Little River are Eastern European (100 | 44.8%), Mexican (72 | 32.3%), English (41 | 18.4%), Central American (10 | 4.5%), and Guatemalan (10 | 4.5%), together accounting for 104.5% of all Little River residents.
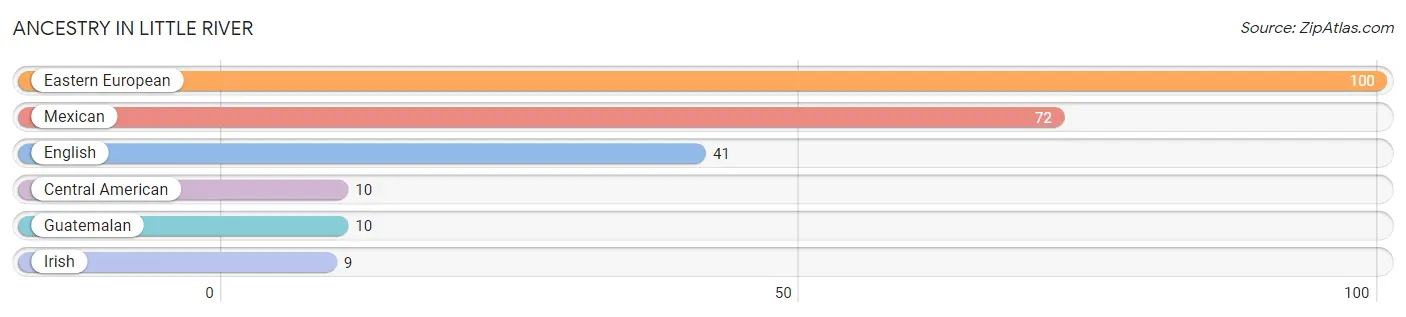
| Ancestry | # Population | % Population |
| Central American | 10 | 4.5% |
| Eastern European | 100 | 44.8% |
| English | 41 | 18.4% |
| Guatemalan | 10 | 4.5% |
| Irish | 9 | 4.0% |
| Mexican | 72 | 32.3% | View All 6 Rows |
Immigrants in Little River
The most numerous immigrant groups reported in Little River came from Central America (10 | 4.5%), Guatemala (10 | 4.5%), and Latin America (10 | 4.5%), together accounting for 13.4% of all Little River residents.
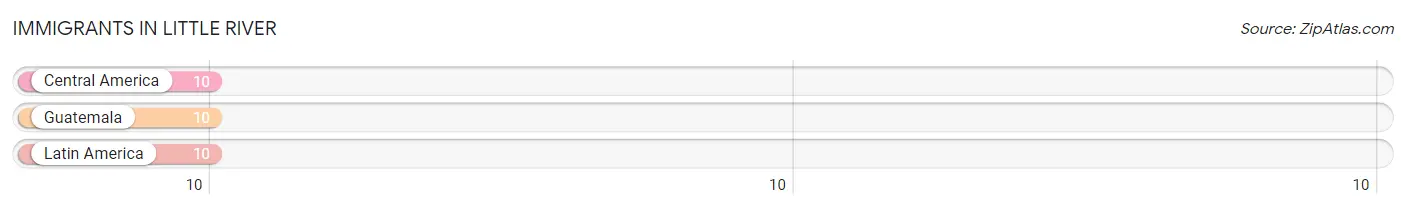
| Immigration Origin | # Population | % Population |
| Central America | 10 | 4.5% |
| Guatemala | 10 | 4.5% |
| Latin America | 10 | 4.5% | View All 3 Rows |
Sex and Age in Little River
Sex and Age in Little River
The most populous age groups in Little River are 10 to 14 Years (17 | 34.7%) for men and 15 to 19 Years (54 | 31.0%) for women.
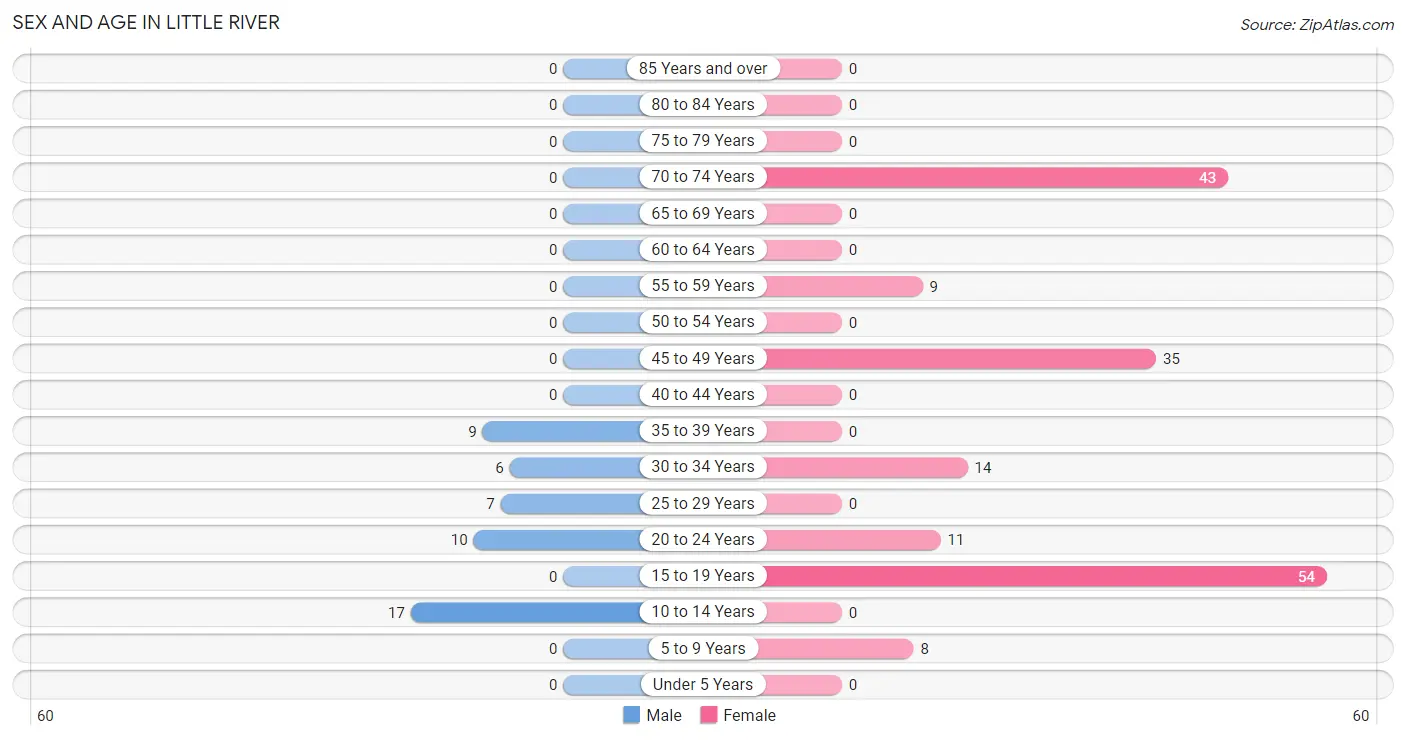
| Age Bracket | Male | Female |
| Under 5 Years | 0 (0.0%) | 0 (0.0%) |
| 5 to 9 Years | 0 (0.0%) | 8 (4.6%) |
| 10 to 14 Years | 17 (34.7%) | 0 (0.0%) |
| 15 to 19 Years | 0 (0.0%) | 54 (31.0%) |
| 20 to 24 Years | 10 (20.4%) | 11 (6.3%) |
| 25 to 29 Years | 7 (14.3%) | 0 (0.0%) |
| 30 to 34 Years | 6 (12.2%) | 14 (8.1%) |
| 35 to 39 Years | 9 (18.4%) | 0 (0.0%) |
| 40 to 44 Years | 0 (0.0%) | 0 (0.0%) |
| 45 to 49 Years | 0 (0.0%) | 35 (20.1%) |
| 50 to 54 Years | 0 (0.0%) | 0 (0.0%) |
| 55 to 59 Years | 0 (0.0%) | 9 (5.2%) |
| 60 to 64 Years | 0 (0.0%) | 0 (0.0%) |
| 65 to 69 Years | 0 (0.0%) | 0 (0.0%) |
| 70 to 74 Years | 0 (0.0%) | 43 (24.7%) |
| 75 to 79 Years | 0 (0.0%) | 0 (0.0%) |
| 80 to 84 Years | 0 (0.0%) | 0 (0.0%) |
| 85 Years and over | 0 (0.0%) | 0 (0.0%) |
| Total | 49 (100.0%) | 174 (100.0%) |
Families and Households in Little River
Median Family Size in Little River
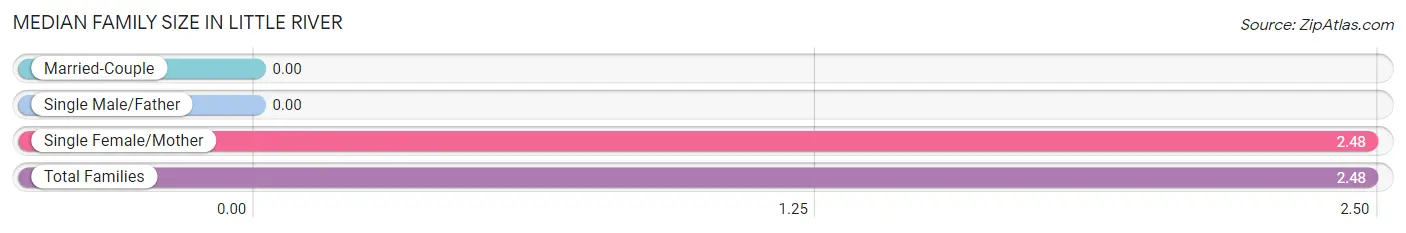
| Family Type | # Families | Family Size |
| Married-Couple | 0 (0.0%) | - |
| Single Male/Father | 0 (0.0%) | - |
| Single Female/Mother | 58 (100.0%) | 2.48 |
| Total Families | 58 (100.0%) | 2.48 |
Median Household Size in Little River
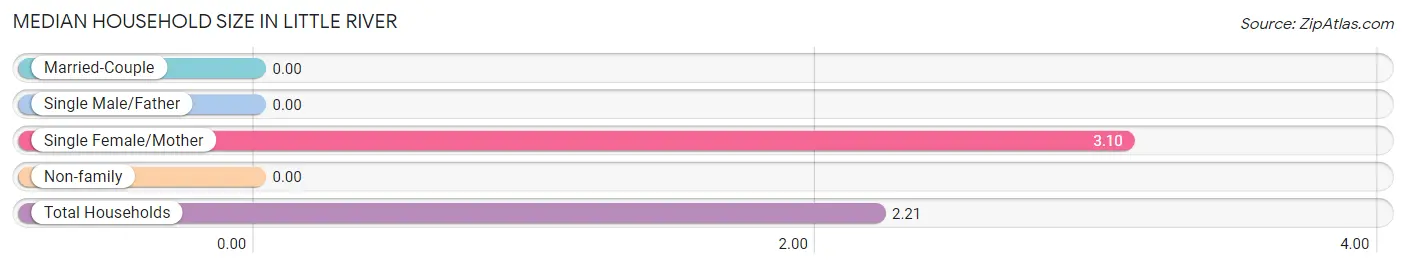
| Household Type | # Households | Household Size |
| Married-Couple | 0 (0.0%) | - |
| Single Male/Father | 0 (0.0%) | - |
| Single Female/Mother | 58 (57.4%) | 3.10 |
| Non-family | 43 (42.6%) | - |
| Total Households | 101 (100.0%) | 2.21 |
Household Size by Marriage Status in Little River
Out of a total of 101 households in Little River, 58 (57.4%) are family households, while 43 (42.6%) are nonfamily households. The most numerous type of family households are 2-person households, comprising 44, and the most common type of nonfamily households are 1-person households, comprising 43.
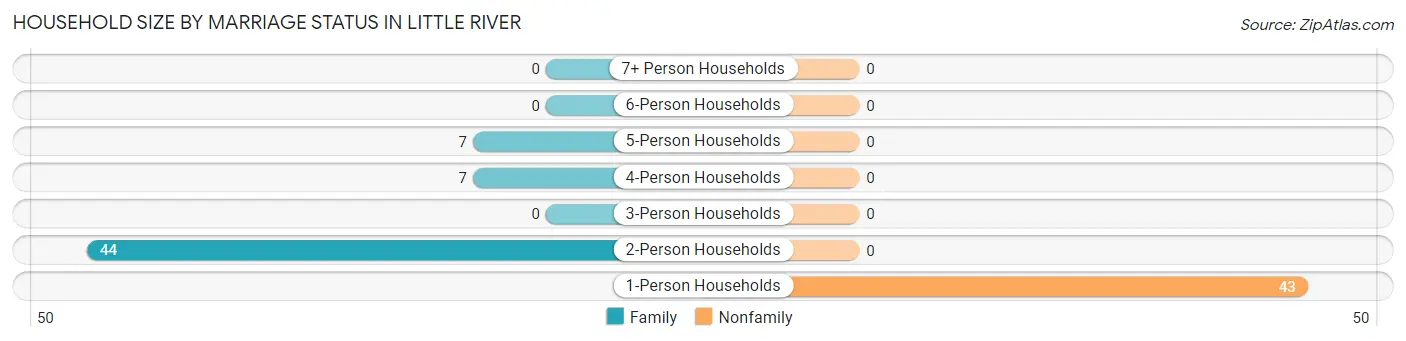
| Household Size | Family Households | Nonfamily Households |
| 1-Person Households | - | 43 (42.6%) |
| 2-Person Households | 44 (43.6%) | 0 (0.0%) |
| 3-Person Households | 0 (0.0%) | 0 (0.0%) |
| 4-Person Households | 7 (6.9%) | 0 (0.0%) |
| 5-Person Households | 7 (6.9%) | 0 (0.0%) |
| 6-Person Households | 0 (0.0%) | 0 (0.0%) |
| 7+ Person Households | 0 (0.0%) | 0 (0.0%) |
| Total | 58 (57.4%) | 43 (42.6%) |
Female Fertility in Little River
Fertility by Age in Little River
| Age Bracket | Women with Births | Births / 1,000 Women |
| 15 to 19 years | 0 (0.0%) | 0.0 |
| 20 to 34 years | 0 (0.0%) | 0.0 |
| 35 to 50 years | 0 (0.0%) | 0.0 |
| Total | 0 (0.0%) | 0.0 |
Fertility by Age by Marriage Status in Little River
| Age Bracket | Married | Unmarried |
| 15 to 19 years | 0 (0.0%) | 0 (0.0%) |
| 20 to 34 years | 0 (0.0%) | 0 (0.0%) |
| 35 to 50 years | 0 (0.0%) | 0 (0.0%) |
| Total | 0 (0.0%) | 0 (0.0%) |
Fertility by Education in Little River
| Educational Attainment | Women with Births | Births / 1,000 Women |
| Less than High School | 0 (0.0%) | 0.0 |
| High School Diploma | 0 (0.0%) | 0.0 |
| College or Associate's Degree | 0 (0.0%) | 0.0 |
| Bachelor's Degree | 0 (0.0%) | 0.0 |
| Graduate Degree | 0 (0.0%) | 0.0 |
| Total | 0 (0.0%) | 0.0 |
Fertility by Education by Marriage Status in Little River
| Educational Attainment | Married | Unmarried |
| Less than High School | 0 (0.0%) | 0 (0.0%) |
| High School Diploma | 0 (0.0%) | 0 (0.0%) |
| College or Associate's Degree | 0 (0.0%) | 0 (0.0%) |
| Bachelor's Degree | 0 (0.0%) | 0 (0.0%) |
| Graduate Degree | 0 (0.0%) | 0 (0.0%) |
| Total | 0 (0.0%) | 0 (0.0%) |
Employment Characteristics in Little River
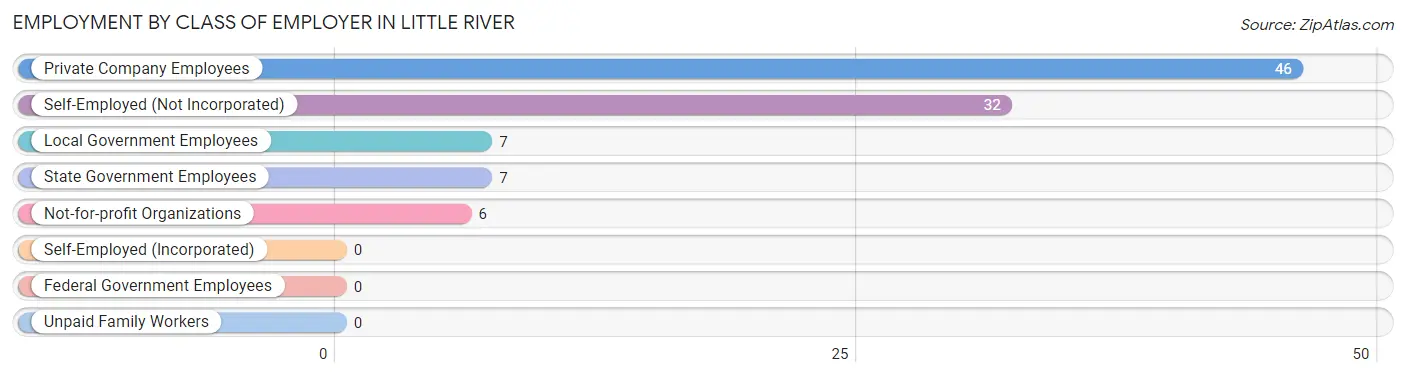
Employment by Class of Employer in Little River
Among the 98 employed individuals in Little River, private company employees (46 | 46.9%), self-employed (not incorporated) (32 | 32.7%), and local government employees (7 | 7.1%) make up the most common classes of employment.
| Employer Class | # Employees | % Employees |
| Private Company Employees | 46 | 46.9% |
| Self-Employed (Incorporated) | 0 | 0.0% |
| Self-Employed (Not Incorporated) | 32 | 32.7% |
| Not-for-profit Organizations | 6 | 6.1% |
| Local Government Employees | 7 | 7.1% |
| State Government Employees | 7 | 7.1% |
| Federal Government Employees | 0 | 0.0% |
| Unpaid Family Workers | 0 | 0.0% |
| Total | 98 | 100.0% |
Employment Status by Age in Little River
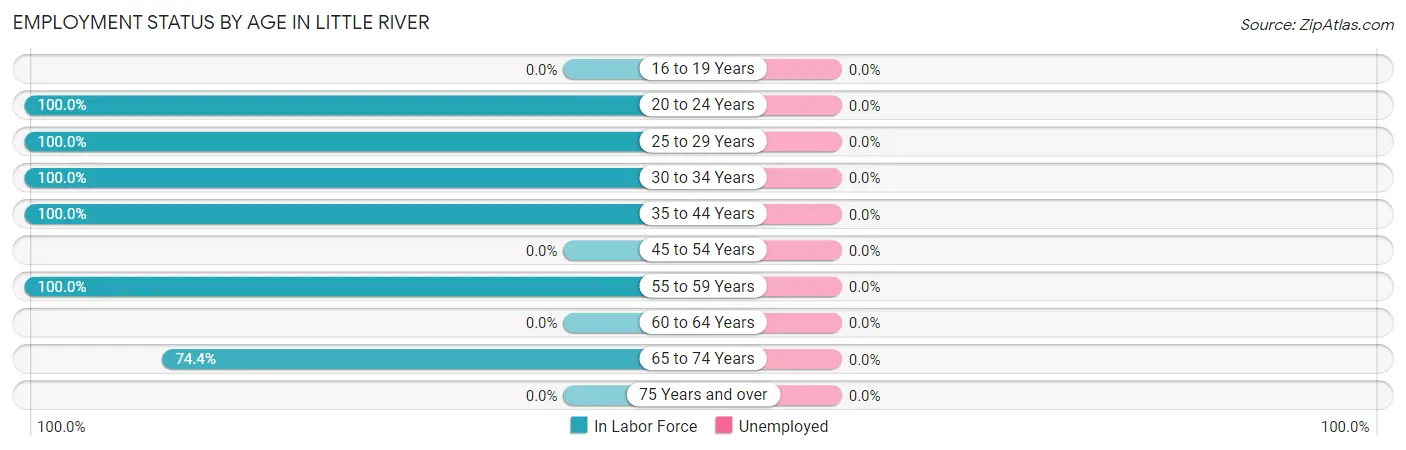
| Age Bracket | In Labor Force | Unemployed |
| 16 to 19 Years | 0 (0.0%) | 0 (0.0%) |
| 20 to 24 Years | 21 (100.0%) | 0 (0.0%) |
| 25 to 29 Years | 7 (100.0%) | 0 (0.0%) |
| 30 to 34 Years | 20 (100.0%) | 0 (0.0%) |
| 35 to 44 Years | 9 (100.0%) | 0 (0.0%) |
| 45 to 54 Years | 0 (0.0%) | 0 (0.0%) |
| 55 to 59 Years | 9 (100.0%) | 0 (0.0%) |
| 60 to 64 Years | 0 (0.0%) | 0 (0.0%) |
| 65 to 74 Years | 32 (74.4%) | 0 (0.0%) |
| 75 Years and over | 0 (0.0%) | 0 (0.0%) |
| Total | 98 (49.5%) | 0 (0.0%) |
Employment Status by Educational Attainment in Little River
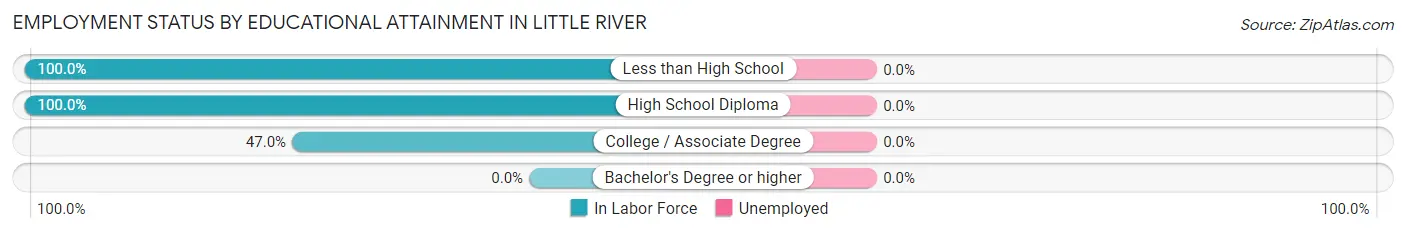
| Educational Attainment | In Labor Force | Unemployed |
| Less than High School | 7 (100.0%) | 0 (0.0%) |
| High School Diploma | 7 (100.0%) | 0 (0.0%) |
| College / Associate Degree | 31 (47.0%) | 0 (0.0%) |
| Bachelor's Degree or higher | 0 (0.0%) | 0 (0.0%) |
| Total | 45 (56.3%) | 0 (0.0%) |
Employment Occupations by Sex in Little River
Management, Business, Science and Arts Occupations
The most common Management, Business, Science and Arts occupations in Little River are Community & Social Service (7 | 7.1%), and Education Instruction & Library (7 | 7.1%).
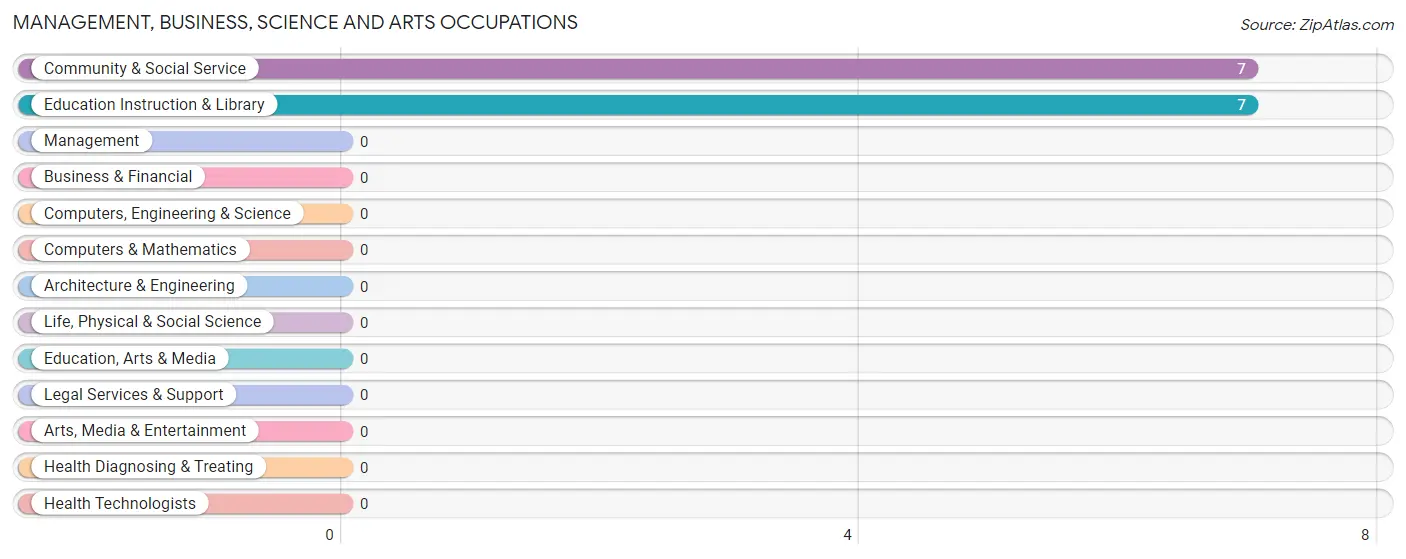
Management, Business, Science and Arts Occupations by Sex
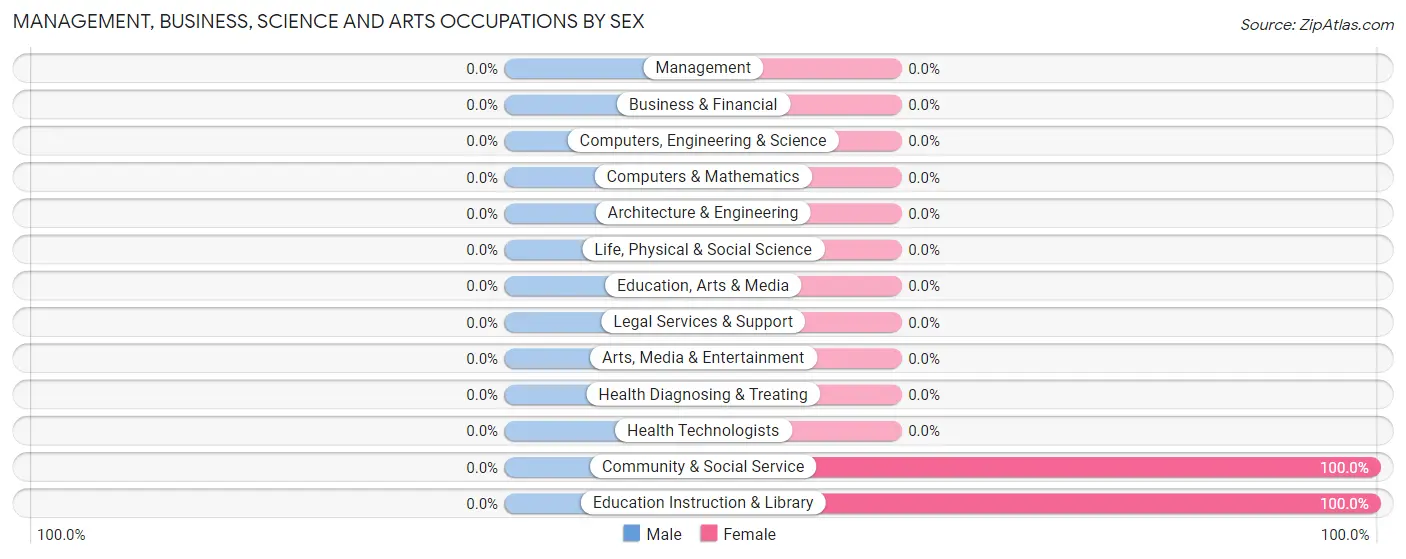
| Occupation | Male | Female |
| Management | 0 (0.0%) | 0 (0.0%) |
| Business & Financial | 0 (0.0%) | 0 (0.0%) |
| Computers, Engineering & Science | 0 (0.0%) | 0 (0.0%) |
| Computers & Mathematics | 0 (0.0%) | 0 (0.0%) |
| Architecture & Engineering | 0 (0.0%) | 0 (0.0%) |
| Life, Physical & Social Science | 0 (0.0%) | 0 (0.0%) |
| Community & Social Service | 0 (0.0%) | 7 (100.0%) |
| Education, Arts & Media | 0 (0.0%) | 0 (0.0%) |
| Legal Services & Support | 0 (0.0%) | 0 (0.0%) |
| Education Instruction & Library | 0 (0.0%) | 7 (100.0%) |
| Arts, Media & Entertainment | 0 (0.0%) | 0 (0.0%) |
| Health Diagnosing & Treating | 0 (0.0%) | 0 (0.0%) |
| Health Technologists | 0 (0.0%) | 0 (0.0%) |
| Total (Category) | 0 (0.0%) | 7 (100.0%) |
| Total (Overall) | 32 (32.7%) | 66 (67.3%) |
Services Occupations
The most common Services occupations in Little River are Personal Care & Service (9 | 9.2%), Security & Protection (7 | 7.1%), and Law Enforcement (7 | 7.1%).
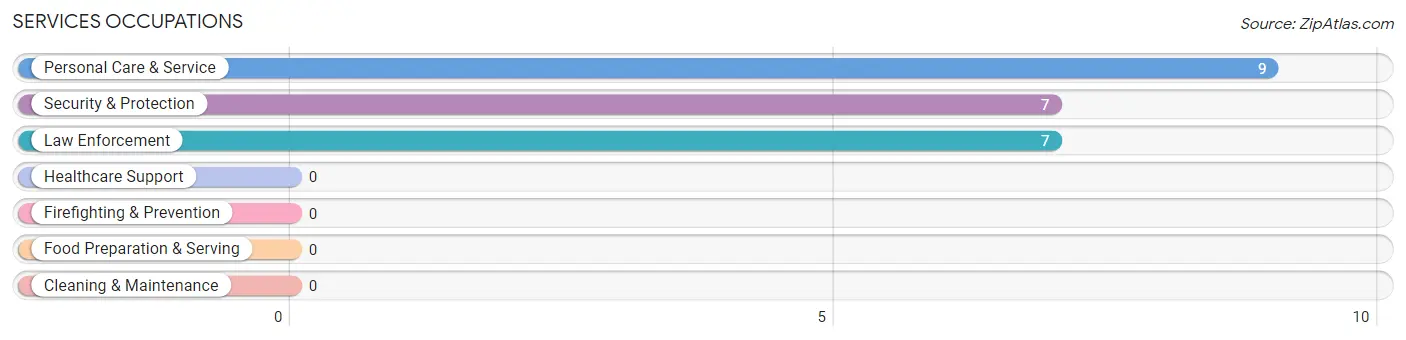
Services Occupations by Sex
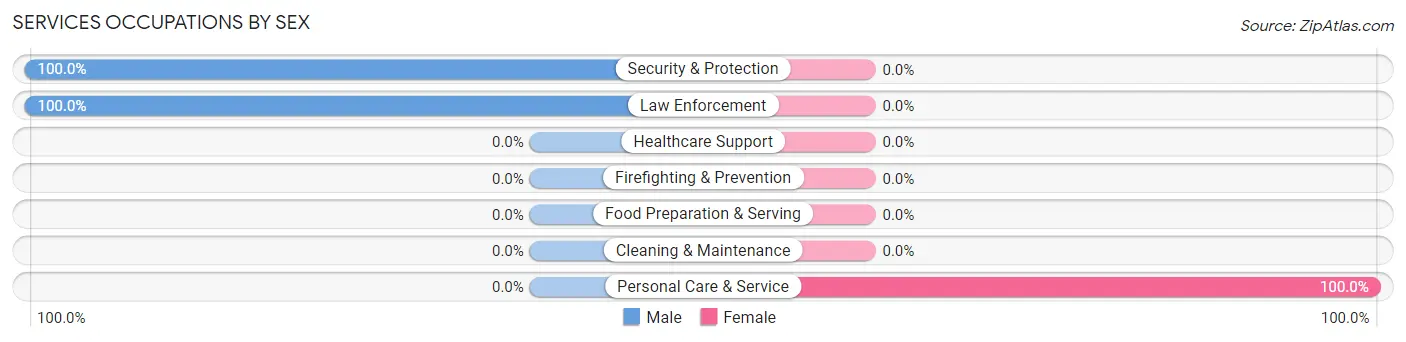
| Occupation | Male | Female |
| Healthcare Support | 0 (0.0%) | 0 (0.0%) |
| Security & Protection | 7 (100.0%) | 0 (0.0%) |
| Firefighting & Prevention | 0 (0.0%) | 0 (0.0%) |
| Law Enforcement | 7 (100.0%) | 0 (0.0%) |
| Food Preparation & Serving | 0 (0.0%) | 0 (0.0%) |
| Cleaning & Maintenance | 0 (0.0%) | 0 (0.0%) |
| Personal Care & Service | 0 (0.0%) | 9 (100.0%) |
| Total (Category) | 7 (43.8%) | 9 (56.2%) |
| Total (Overall) | 32 (32.7%) | 66 (67.3%) |
Sales and Office Occupations
The most common Sales and Office occupations in Little River are Sales & Related (60 | 61.2%), and Office & Administration (6 | 6.1%).
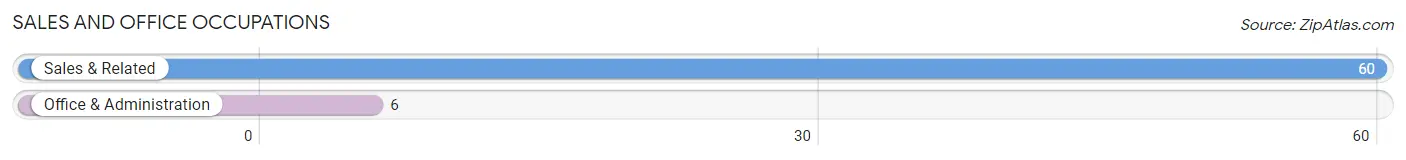
Sales and Office Occupations by Sex

| Occupation | Male | Female |
| Sales & Related | 10 (16.7%) | 50 (83.3%) |
| Office & Administration | 6 (100.0%) | 0 (0.0%) |
| Total (Category) | 16 (24.2%) | 50 (75.8%) |
| Total (Overall) | 32 (32.7%) | 66 (67.3%) |
Natural Resources, Construction and Maintenance Occupations
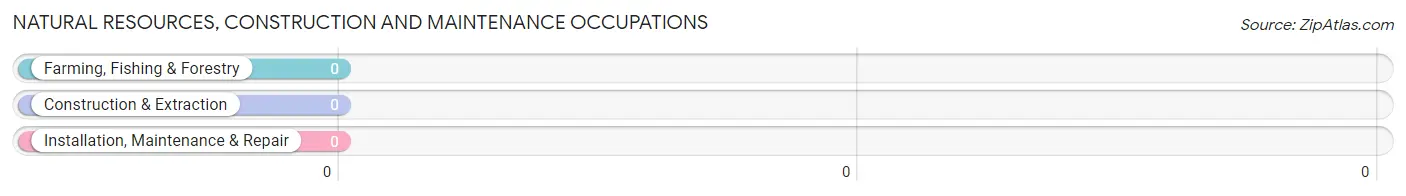
Natural Resources, Construction and Maintenance Occupations by Sex
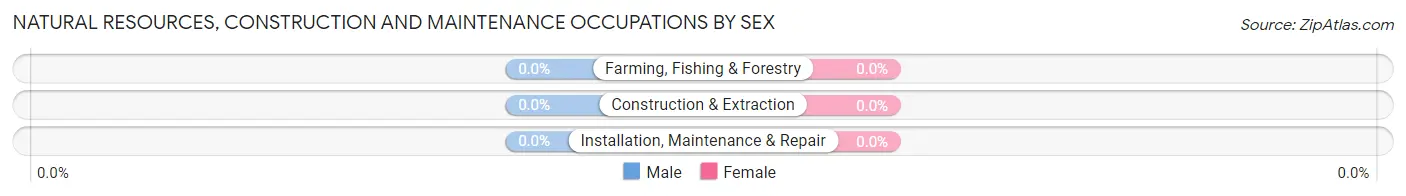
| Occupation | Male | Female |
| Farming, Fishing & Forestry | 0 (0.0%) | 0 (0.0%) |
| Construction & Extraction | 0 (0.0%) | 0 (0.0%) |
| Installation, Maintenance & Repair | 0 (0.0%) | 0 (0.0%) |
| Total (Category) | 0 (0.0%) | 0 (0.0%) |
| Total (Overall) | 32 (32.7%) | 66 (67.3%) |
Production, Transportation and Moving Occupations
The most common Production, Transportation and Moving occupations in Little River are , and Transportation (9 | 9.2%).
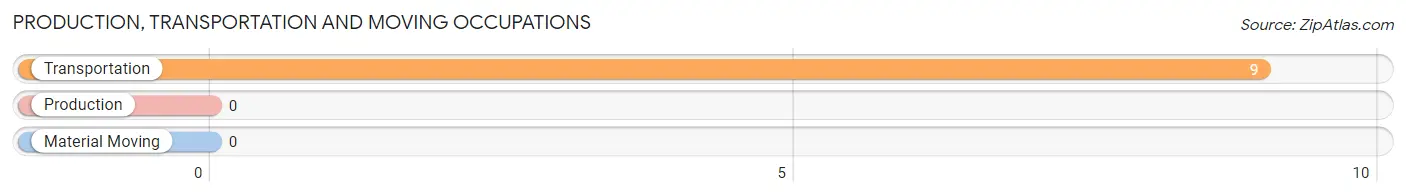
Production, Transportation and Moving Occupations by Sex
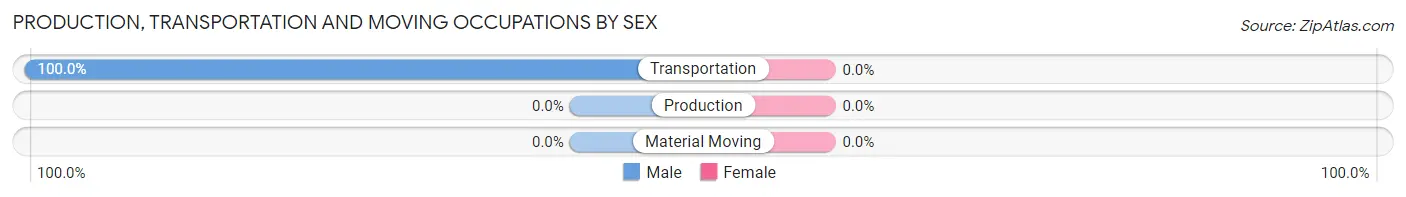
| Occupation | Male | Female |
| Production | 0 (0.0%) | 0 (0.0%) |
| Transportation | 9 (100.0%) | 0 (0.0%) |
| Material Moving | 0 (0.0%) | 0 (0.0%) |
| Total (Category) | 9 (100.0%) | 0 (0.0%) |
| Total (Overall) | 32 (32.7%) | 66 (67.3%) |
Employment Industries by Sex in Little River
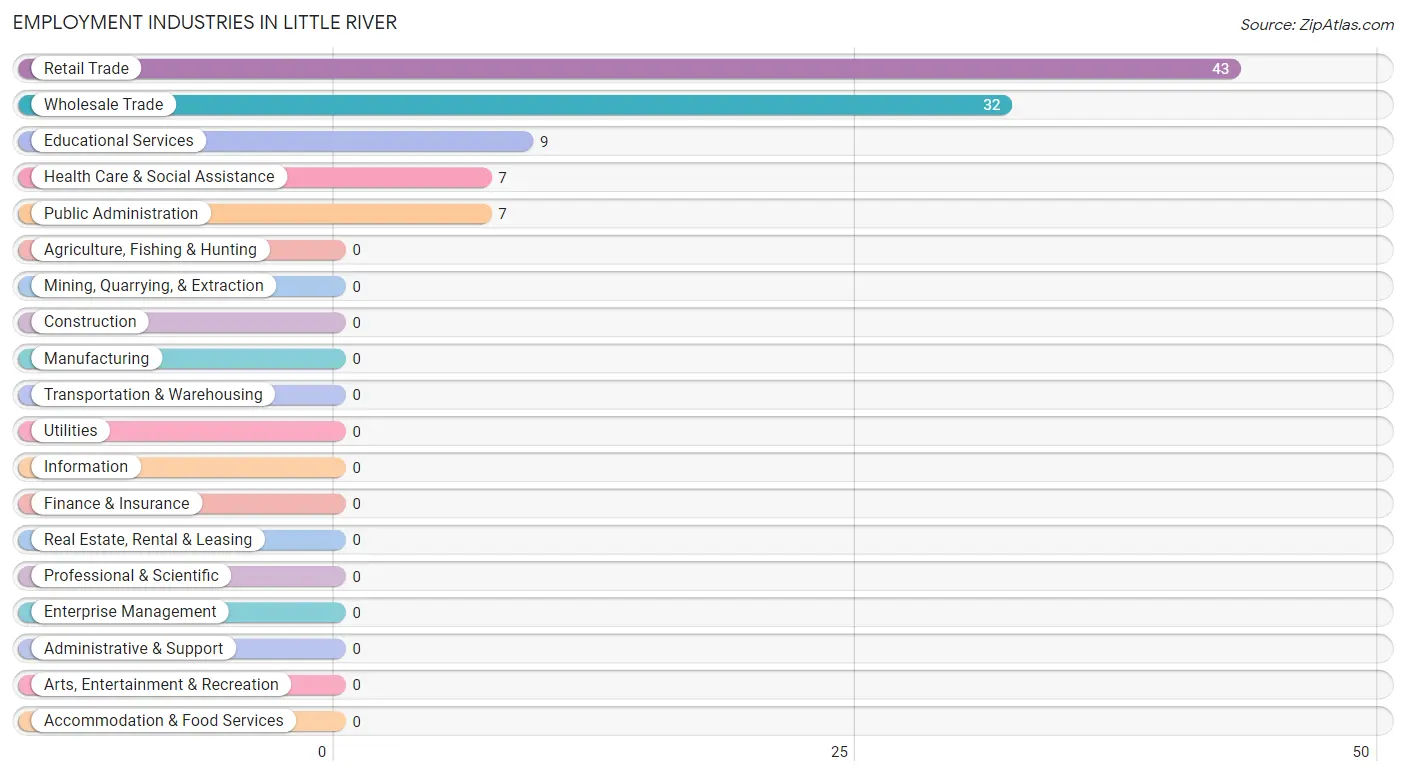
Employment Industries in Little River
The major employment industries in Little River include Retail Trade (43 | 43.9%), Wholesale Trade (32 | 32.7%), Educational Services (9 | 9.2%), Health Care & Social Assistance (7 | 7.1%), and Public Administration (7 | 7.1%).
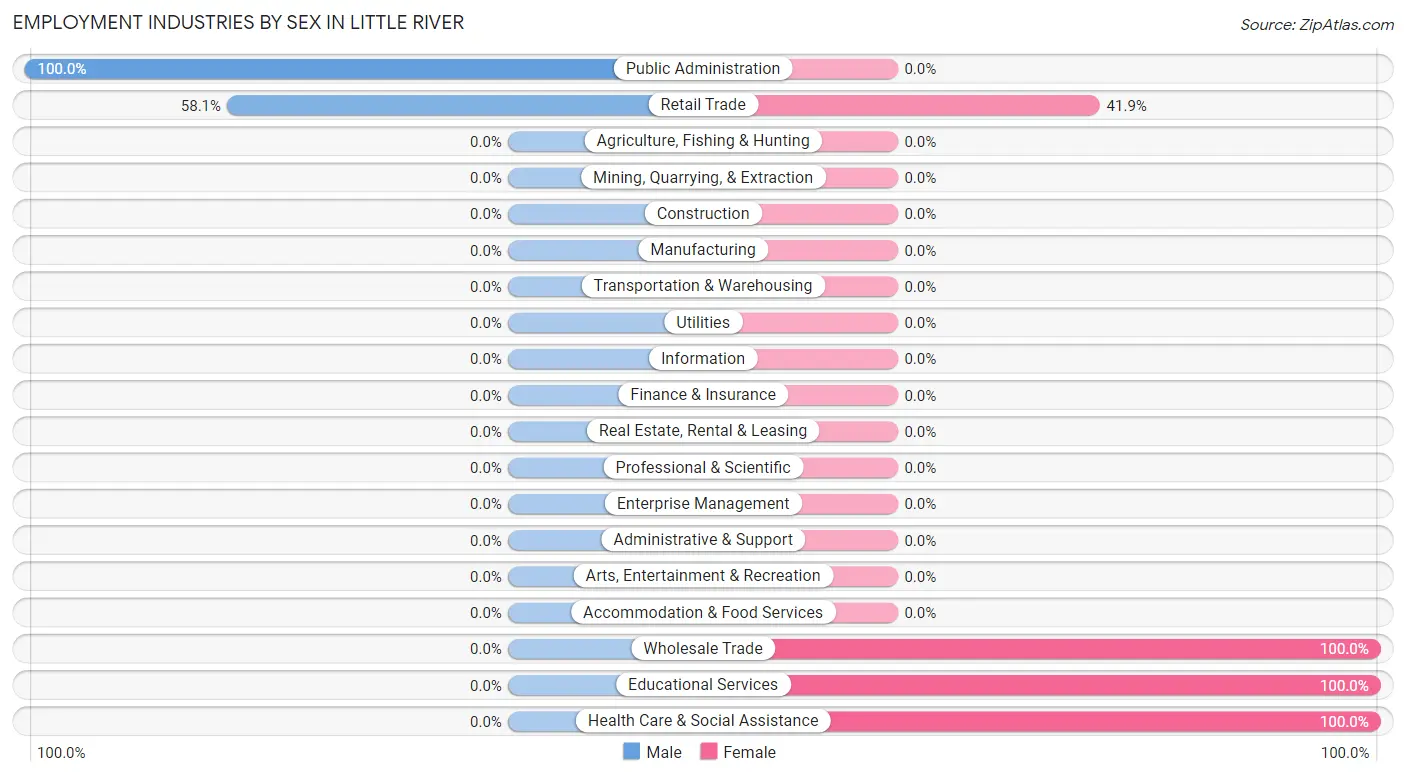
Employment Industries by Sex in Little River
The Little River industries that see more men than women are Public Administration (100.0%), and Retail Trade (58.1%), whereas the industries that tend to have a higher number of women are Wholesale Trade (100.0%), Educational Services (100.0%), and Health Care & Social Assistance (100.0%).
| Industry | Male | Female |
| Agriculture, Fishing & Hunting | 0 (0.0%) | 0 (0.0%) |
| Mining, Quarrying, & Extraction | 0 (0.0%) | 0 (0.0%) |
| Construction | 0 (0.0%) | 0 (0.0%) |
| Manufacturing | 0 (0.0%) | 0 (0.0%) |
| Wholesale Trade | 0 (0.0%) | 32 (100.0%) |
| Retail Trade | 25 (58.1%) | 18 (41.9%) |
| Transportation & Warehousing | 0 (0.0%) | 0 (0.0%) |
| Utilities | 0 (0.0%) | 0 (0.0%) |
| Information | 0 (0.0%) | 0 (0.0%) |
| Finance & Insurance | 0 (0.0%) | 0 (0.0%) |
| Real Estate, Rental & Leasing | 0 (0.0%) | 0 (0.0%) |
| Professional & Scientific | 0 (0.0%) | 0 (0.0%) |
| Enterprise Management | 0 (0.0%) | 0 (0.0%) |
| Administrative & Support | 0 (0.0%) | 0 (0.0%) |
| Educational Services | 0 (0.0%) | 9 (100.0%) |
| Health Care & Social Assistance | 0 (0.0%) | 7 (100.0%) |
| Arts, Entertainment & Recreation | 0 (0.0%) | 0 (0.0%) |
| Accommodation & Food Services | 0 (0.0%) | 0 (0.0%) |
| Public Administration | 7 (100.0%) | 0 (0.0%) |
| Total | 32 (32.7%) | 66 (67.3%) |
Education in Little River
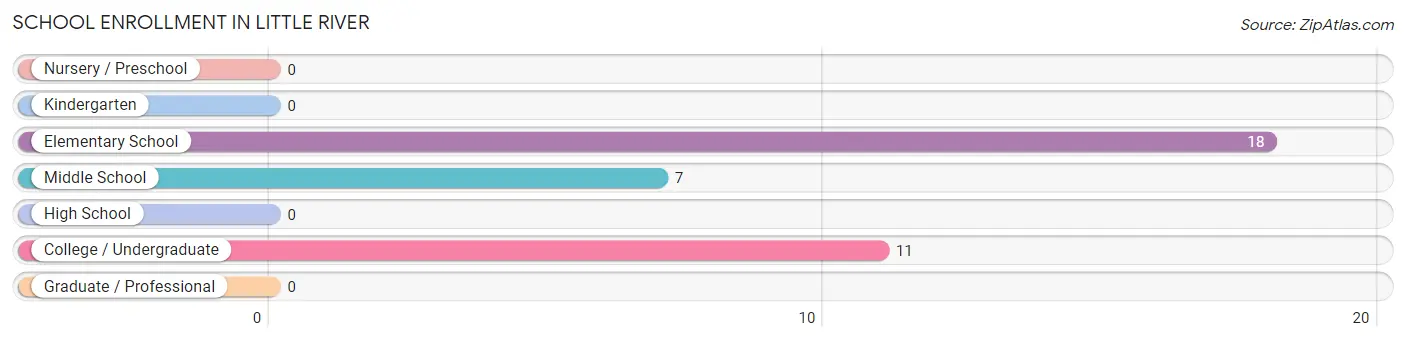
School Enrollment in Little River
The most common levels of schooling among the 36 students in Little River are elementary school (18 | 50.0%), college / undergraduate (11 | 30.6%), and middle school (7 | 19.4%).
| School Level | # Students | % Students |
| Nursery / Preschool | 0 | 0.0% |
| Kindergarten | 0 | 0.0% |
| Elementary School | 18 | 50.0% |
| Middle School | 7 | 19.4% |
| High School | 0 | 0.0% |
| College / Undergraduate | 11 | 30.6% |
| Graduate / Professional | 0 | 0.0% |
| Total | 36 | 100.0% |
School Enrollment by Age by Funding Source in Little River
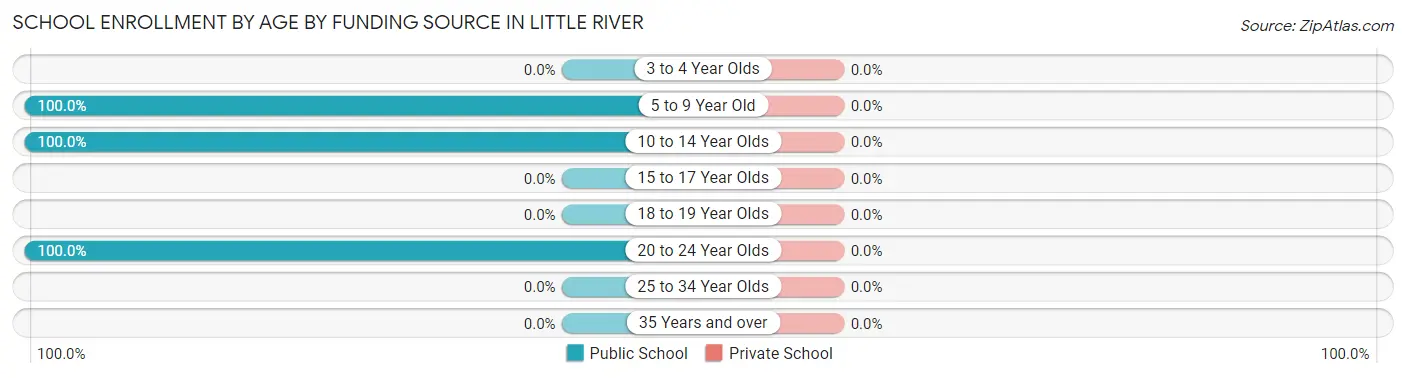
| Age Bracket | Public School | Private School |
| 3 to 4 Year Olds | 0 (0.0%) | 0 (0.0%) |
| 5 to 9 Year Old | 8 (100.0%) | 0 (0.0%) |
| 10 to 14 Year Olds | 17 (100.0%) | 0 (0.0%) |
| 15 to 17 Year Olds | 0 (0.0%) | 0 (0.0%) |
| 18 to 19 Year Olds | 0 (0.0%) | 0 (0.0%) |
| 20 to 24 Year Olds | 11 (100.0%) | 0 (0.0%) |
| 25 to 34 Year Olds | 0 (0.0%) | 0 (0.0%) |
| 35 Years and over | 0 (0.0%) | 0 (0.0%) |
| Total | 36 (100.0%) | 0 (0.0%) |
Educational Attainment by Field of Study in Little River
Education (32 | 74.4%), and social sciences (11 | 25.6%) are the most common fields of study among 43 individuals in Little River who have obtained a bachelor's degree or higher.
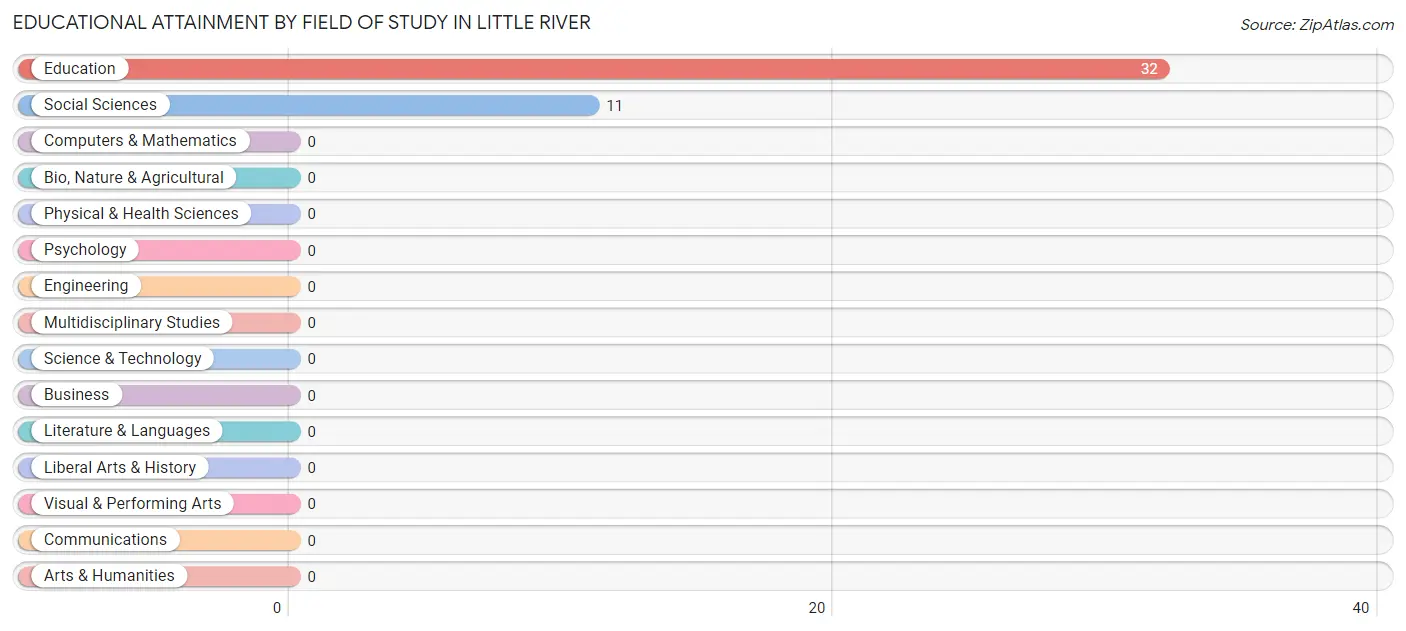
| Field of Study | # Graduates | % Graduates |
| Computers & Mathematics | 0 | 0.0% |
| Bio, Nature & Agricultural | 0 | 0.0% |
| Physical & Health Sciences | 0 | 0.0% |
| Psychology | 0 | 0.0% |
| Social Sciences | 11 | 25.6% |
| Engineering | 0 | 0.0% |
| Multidisciplinary Studies | 0 | 0.0% |
| Science & Technology | 0 | 0.0% |
| Business | 0 | 0.0% |
| Education | 32 | 74.4% |
| Literature & Languages | 0 | 0.0% |
| Liberal Arts & History | 0 | 0.0% |
| Visual & Performing Arts | 0 | 0.0% |
| Communications | 0 | 0.0% |
| Arts & Humanities | 0 | 0.0% |
| Total | 43 | 100.0% |
Transportation & Commute in Little River
Vehicle Availability by Sex in Little River
The most prevalent vehicle ownership categories in Little River are males with 2 vehicles (26, accounting for 81.2%) and females with 2 vehicles (59, making up 39.4%).
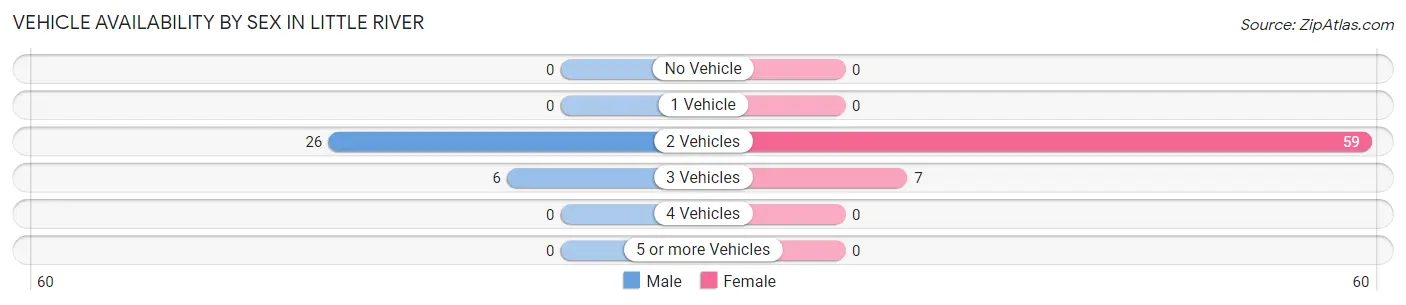
| Vehicles Available | Male | Female |
| No Vehicle | 0 (0.0%) | 0 (0.0%) |
| 1 Vehicle | 0 (0.0%) | 0 (0.0%) |
| 2 Vehicles | 26 (81.2%) | 59 (89.4%) |
| 3 Vehicles | 6 (18.8%) | 7 (10.6%) |
| 4 Vehicles | 0 (0.0%) | 0 (0.0%) |
| 5 or more Vehicles | 0 (0.0%) | 0 (0.0%) |
| Total | 32 (100.0%) | 66 (100.0%) |
Commute Time in Little River
The most frequently occuring commute durations in Little River are 25 to 29 minutes (32 commuters, 45.7%), 5 to 9 minutes (18 commuters, 25.7%), and 20 to 24 minutes (13 commuters, 18.6%).
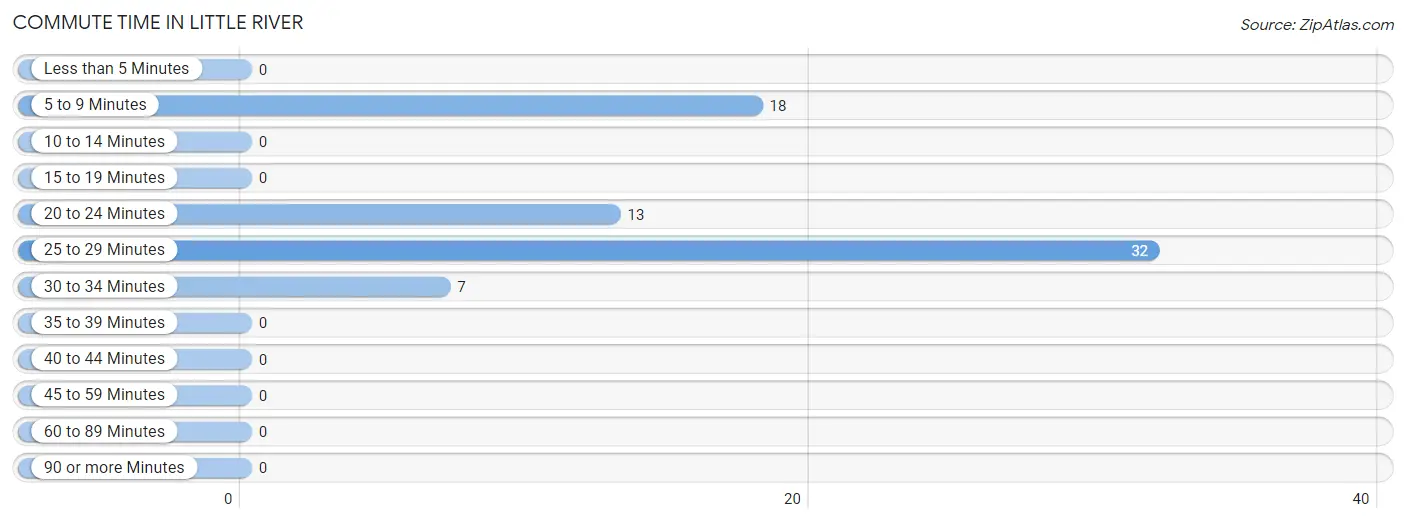
| Commute Time | # Commuters | % Commuters |
| Less than 5 Minutes | 0 | 0.0% |
| 5 to 9 Minutes | 18 | 25.7% |
| 10 to 14 Minutes | 0 | 0.0% |
| 15 to 19 Minutes | 0 | 0.0% |
| 20 to 24 Minutes | 13 | 18.6% |
| 25 to 29 Minutes | 32 | 45.7% |
| 30 to 34 Minutes | 7 | 10.0% |
| 35 to 39 Minutes | 0 | 0.0% |
| 40 to 44 Minutes | 0 | 0.0% |
| 45 to 59 Minutes | 0 | 0.0% |
| 60 to 89 Minutes | 0 | 0.0% |
| 90 or more Minutes | 0 | 0.0% |
Commute Time by Sex in Little River
The most common commute times in Little River are 5 to 9 minutes (9 commuters, 40.9%) for males and 25 to 29 minutes (32 commuters, 66.7%) for females.
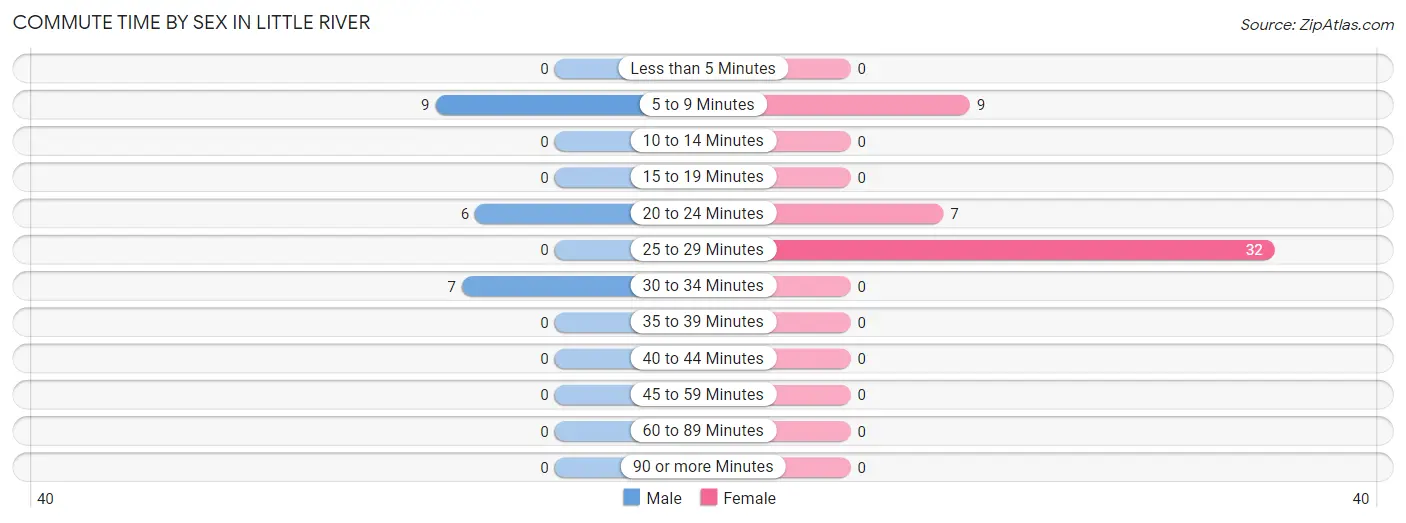
| Commute Time | Male | Female |
| Less than 5 Minutes | 0 (0.0%) | 0 (0.0%) |
| 5 to 9 Minutes | 9 (40.9%) | 9 (18.8%) |
| 10 to 14 Minutes | 0 (0.0%) | 0 (0.0%) |
| 15 to 19 Minutes | 0 (0.0%) | 0 (0.0%) |
| 20 to 24 Minutes | 6 (27.3%) | 7 (14.6%) |
| 25 to 29 Minutes | 0 (0.0%) | 32 (66.7%) |
| 30 to 34 Minutes | 7 (31.8%) | 0 (0.0%) |
| 35 to 39 Minutes | 0 (0.0%) | 0 (0.0%) |
| 40 to 44 Minutes | 0 (0.0%) | 0 (0.0%) |
| 45 to 59 Minutes | 0 (0.0%) | 0 (0.0%) |
| 60 to 89 Minutes | 0 (0.0%) | 0 (0.0%) |
| 90 or more Minutes | 0 (0.0%) | 0 (0.0%) |
Time of Departure to Work by Sex in Little River
The most frequent times of departure to work in Little River are 9:00 AM to 9:59 AM (22, 100.0%) for males and 12:00 PM to 3:59 PM (32, 66.7%) for females.
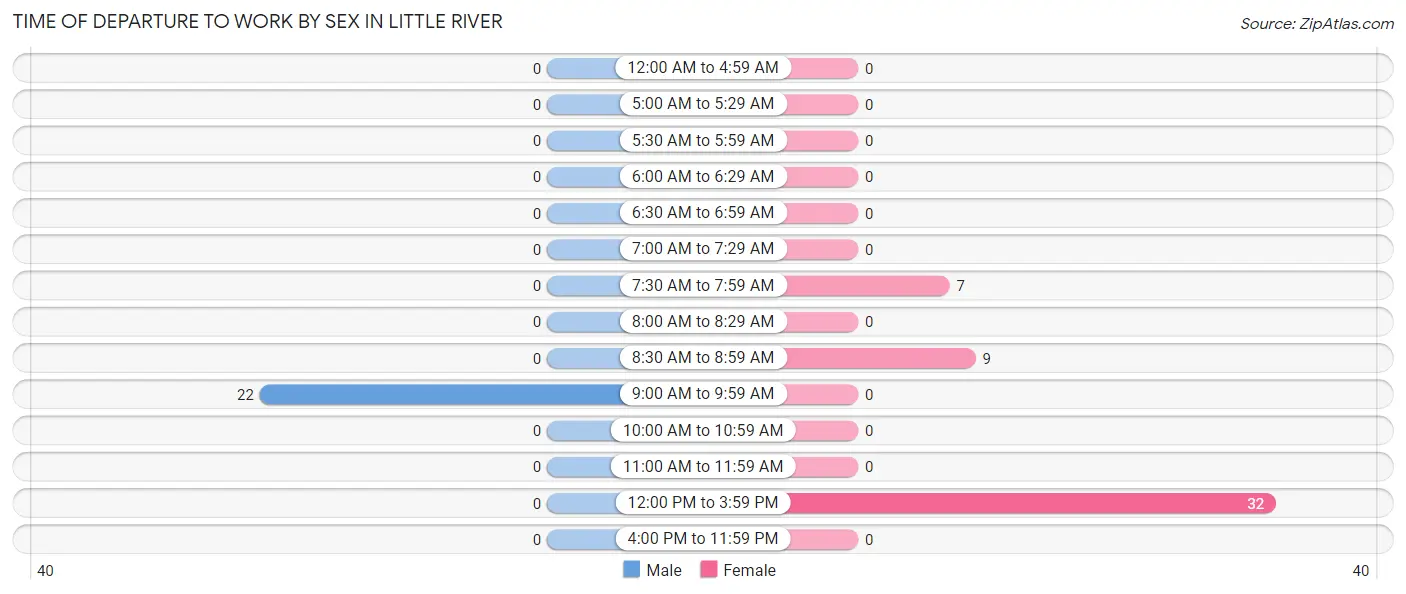
| Time of Departure | Male | Female |
| 12:00 AM to 4:59 AM | 0 (0.0%) | 0 (0.0%) |
| 5:00 AM to 5:29 AM | 0 (0.0%) | 0 (0.0%) |
| 5:30 AM to 5:59 AM | 0 (0.0%) | 0 (0.0%) |
| 6:00 AM to 6:29 AM | 0 (0.0%) | 0 (0.0%) |
| 6:30 AM to 6:59 AM | 0 (0.0%) | 0 (0.0%) |
| 7:00 AM to 7:29 AM | 0 (0.0%) | 0 (0.0%) |
| 7:30 AM to 7:59 AM | 0 (0.0%) | 7 (14.6%) |
| 8:00 AM to 8:29 AM | 0 (0.0%) | 0 (0.0%) |
| 8:30 AM to 8:59 AM | 0 (0.0%) | 9 (18.8%) |
| 9:00 AM to 9:59 AM | 22 (100.0%) | 0 (0.0%) |
| 10:00 AM to 10:59 AM | 0 (0.0%) | 0 (0.0%) |
| 11:00 AM to 11:59 AM | 0 (0.0%) | 0 (0.0%) |
| 12:00 PM to 3:59 PM | 0 (0.0%) | 32 (66.7%) |
| 4:00 PM to 11:59 PM | 0 (0.0%) | 0 (0.0%) |
| Total | 22 (100.0%) | 48 (100.0%) |
Housing Occupancy in Little River
Occupancy by Ownership in Little River
Of the total 101 dwellings in Little River, owner-occupied units account for 59 (58.4%), while renter-occupied units make up 42 (41.6%).
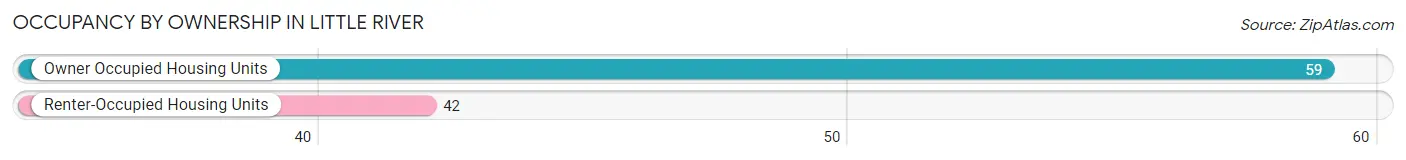
| Occupancy | # Housing Units | % Housing Units |
| Owner Occupied Housing Units | 59 | 58.4% |
| Renter-Occupied Housing Units | 42 | 41.6% |
| Total Occupied Housing Units | 101 | 100.0% |
Occupancy by Household Size in Little River
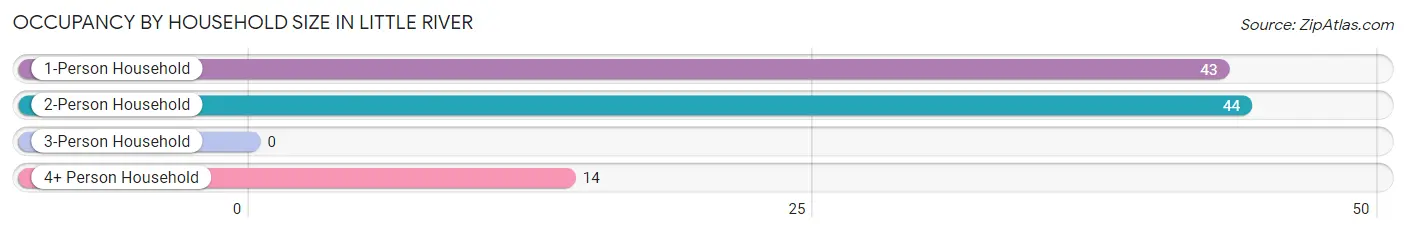
| Household Size | # Housing Units | % Housing Units |
| 1-Person Household | 43 | 42.6% |
| 2-Person Household | 44 | 43.6% |
| 3-Person Household | 0 | 0.0% |
| 4+ Person Household | 14 | 13.9% |
| Total Housing Units | 101 | 100.0% |
Occupancy by Ownership by Household Size in Little River
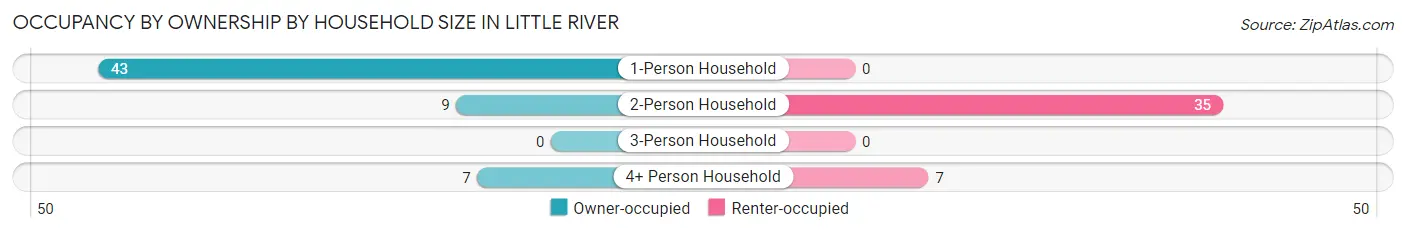
| Household Size | Owner-occupied | Renter-occupied |
| 1-Person Household | 43 (100.0%) | 0 (0.0%) |
| 2-Person Household | 9 (20.4%) | 35 (79.5%) |
| 3-Person Household | 0 (0.0%) | 0 (0.0%) |
| 4+ Person Household | 7 (50.0%) | 7 (50.0%) |
| Total Housing Units | 59 (58.4%) | 42 (41.6%) |
Occupancy by Educational Attainment in Little River
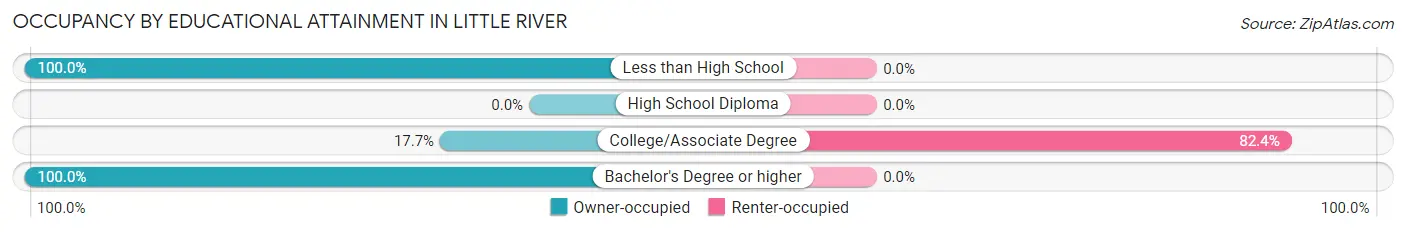
| Household Size | Owner-occupied | Renter-occupied |
| Less than High School | 7 (100.0%) | 0 (0.0%) |
| High School Diploma | 0 (0.0%) | 0 (0.0%) |
| College/Associate Degree | 9 (17.6%) | 42 (82.4%) |
| Bachelor's Degree or higher | 43 (100.0%) | 0 (0.0%) |
Occupancy by Age of Householder in Little River
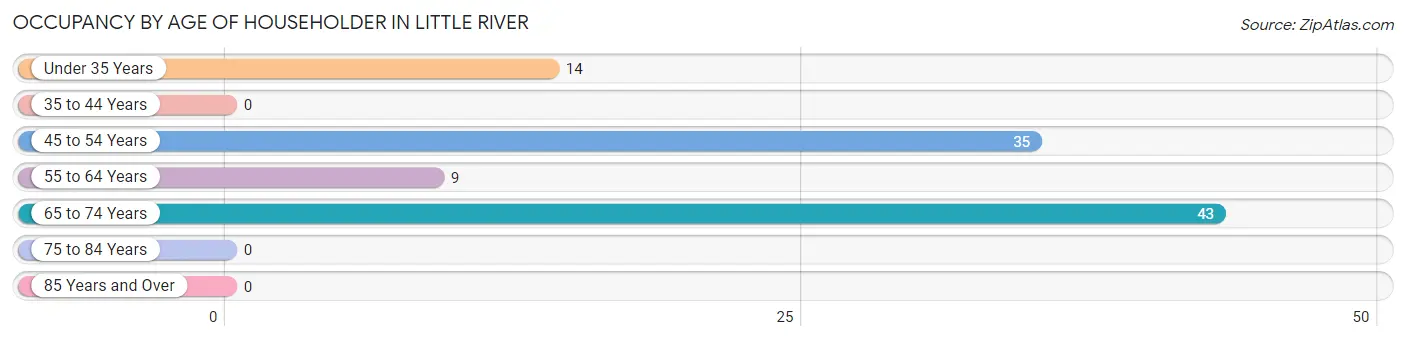
| Age Bracket | # Households | % Households |
| Under 35 Years | 14 | 13.9% |
| 35 to 44 Years | 0 | 0.0% |
| 45 to 54 Years | 35 | 34.6% |
| 55 to 64 Years | 9 | 8.9% |
| 65 to 74 Years | 43 | 42.6% |
| 75 to 84 Years | 0 | 0.0% |
| 85 Years and Over | 0 | 0.0% |
| Total | 101 | 100.0% |
Housing Finances in Little River
Median Income by Occupancy in Little River
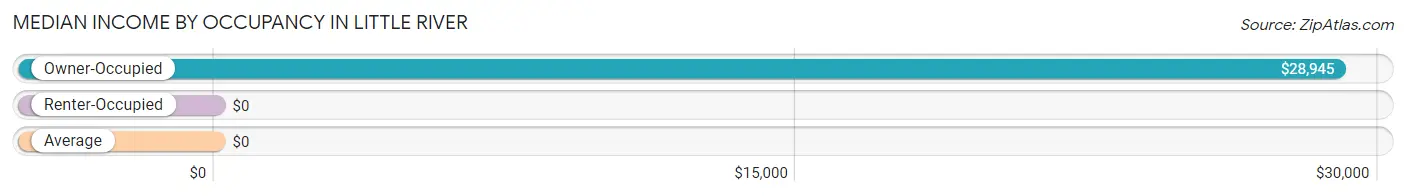
| Occupancy Type | # Households | Median Income |
| Owner-Occupied | 59 (58.4%) | $28,945 |
| Renter-Occupied | 42 (41.6%) | $0 |
| Average | 101 (100.0%) | $0 |
Occupancy by Householder Income Bracket in Little River
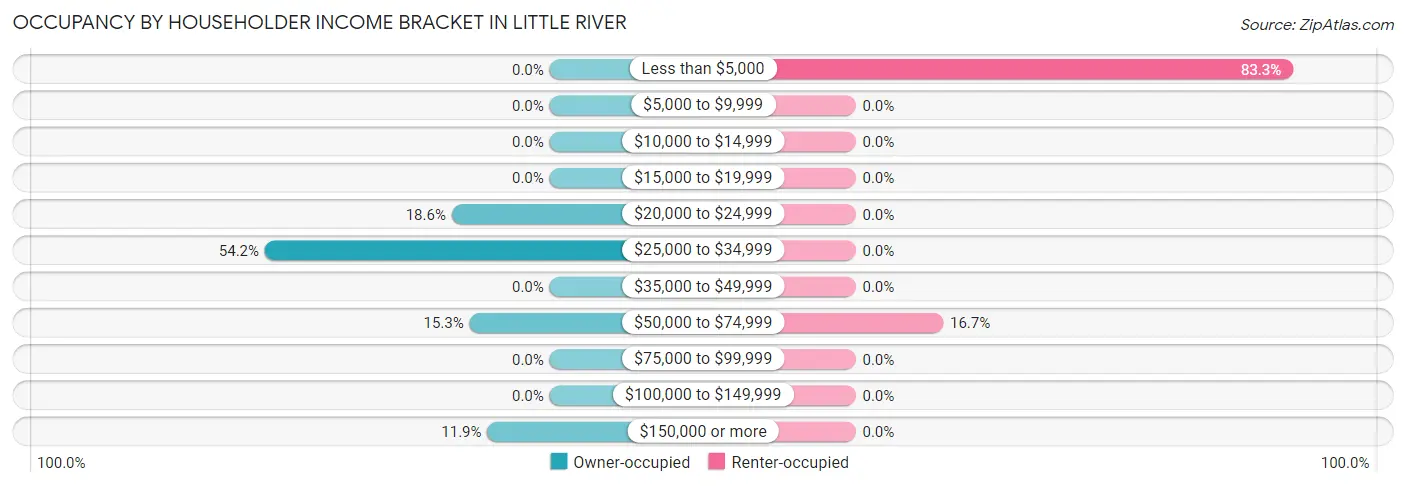
| Income Bracket | Owner-occupied | Renter-occupied |
| Less than $5,000 | 0 (0.0%) | 35 (83.3%) |
| $5,000 to $9,999 | 0 (0.0%) | 0 (0.0%) |
| $10,000 to $14,999 | 0 (0.0%) | 0 (0.0%) |
| $15,000 to $19,999 | 0 (0.0%) | 0 (0.0%) |
| $20,000 to $24,999 | 11 (18.6%) | 0 (0.0%) |
| $25,000 to $34,999 | 32 (54.2%) | 0 (0.0%) |
| $35,000 to $49,999 | 0 (0.0%) | 0 (0.0%) |
| $50,000 to $74,999 | 9 (15.2%) | 7 (16.7%) |
| $75,000 to $99,999 | 0 (0.0%) | 0 (0.0%) |
| $100,000 to $149,999 | 0 (0.0%) | 0 (0.0%) |
| $150,000 or more | 7 (11.9%) | 0 (0.0%) |
| Total | 59 (100.0%) | 42 (100.0%) |
Monthly Housing Cost Tiers in Little River
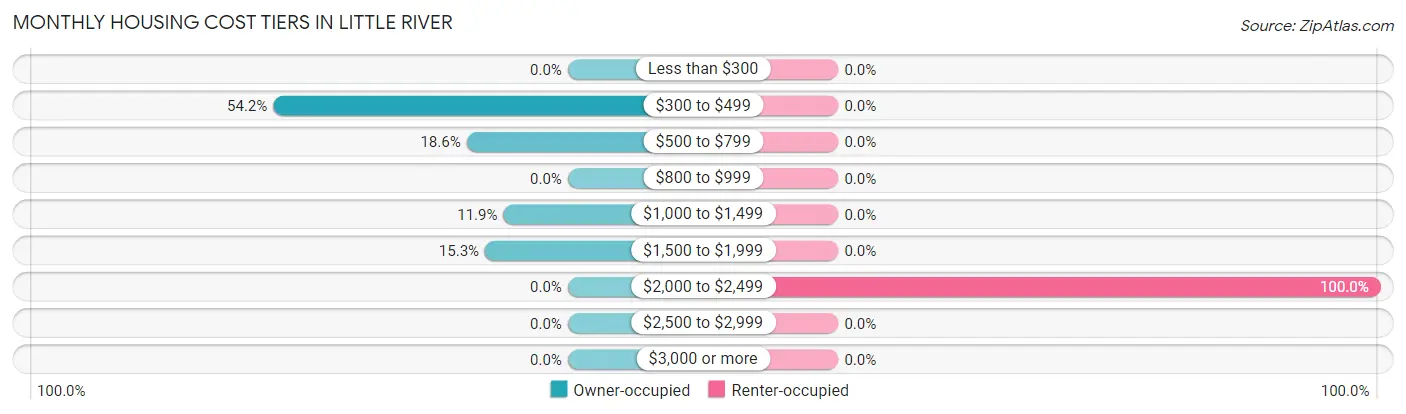
| Monthly Cost | Owner-occupied | Renter-occupied |
| Less than $300 | 0 (0.0%) | 0 (0.0%) |
| $300 to $499 | 32 (54.2%) | 0 (0.0%) |
| $500 to $799 | 11 (18.6%) | 0 (0.0%) |
| $800 to $999 | 0 (0.0%) | 0 (0.0%) |
| $1,000 to $1,499 | 7 (11.9%) | 0 (0.0%) |
| $1,500 to $1,999 | 9 (15.2%) | 0 (0.0%) |
| $2,000 to $2,499 | 0 (0.0%) | 42 (100.0%) |
| $2,500 to $2,999 | 0 (0.0%) | 0 (0.0%) |
| $3,000 or more | 0 (0.0%) | 0 (0.0%) |
| Total | 59 (100.0%) | 42 (100.0%) |
Physical Housing Characteristics in Little River
Housing Structures in Little River
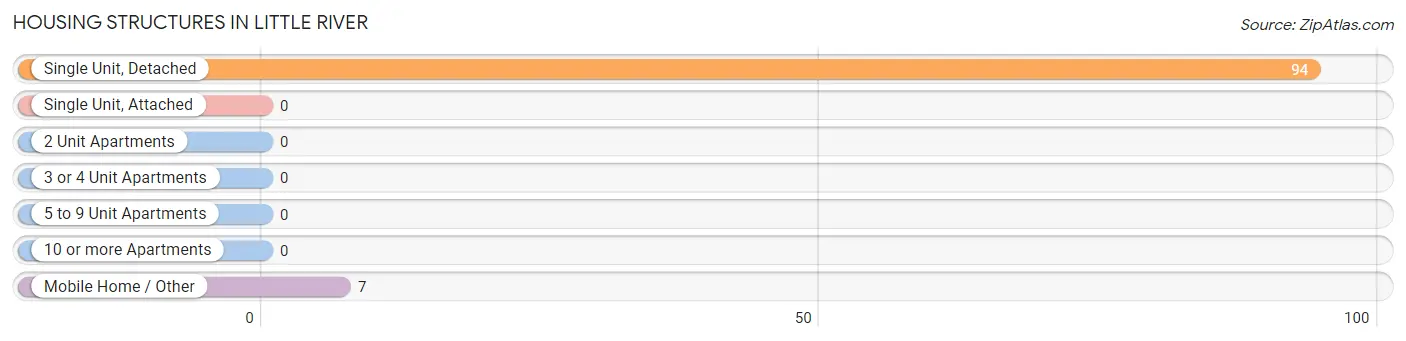
| Structure Type | # Housing Units | % Housing Units |
| Single Unit, Detached | 94 | 93.1% |
| Single Unit, Attached | 0 | 0.0% |
| 2 Unit Apartments | 0 | 0.0% |
| 3 or 4 Unit Apartments | 0 | 0.0% |
| 5 to 9 Unit Apartments | 0 | 0.0% |
| 10 or more Apartments | 0 | 0.0% |
| Mobile Home / Other | 7 | 6.9% |
| Total | 101 | 100.0% |
Housing Structures by Occupancy in Little River
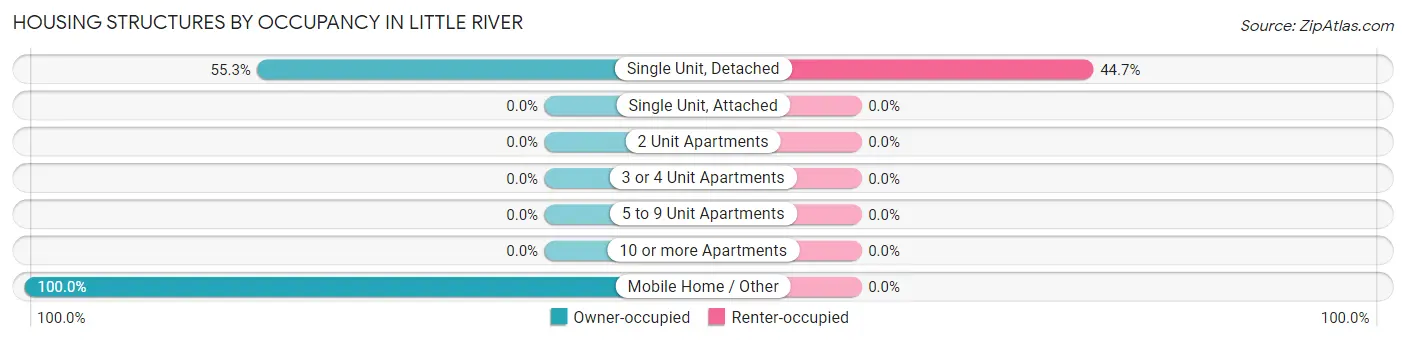
| Structure Type | Owner-occupied | Renter-occupied |
| Single Unit, Detached | 52 (55.3%) | 42 (44.7%) |
| Single Unit, Attached | 0 (0.0%) | 0 (0.0%) |
| 2 Unit Apartments | 0 (0.0%) | 0 (0.0%) |
| 3 or 4 Unit Apartments | 0 (0.0%) | 0 (0.0%) |
| 5 to 9 Unit Apartments | 0 (0.0%) | 0 (0.0%) |
| 10 or more Apartments | 0 (0.0%) | 0 (0.0%) |
| Mobile Home / Other | 7 (100.0%) | 0 (0.0%) |
| Total | 59 (58.4%) | 42 (41.6%) |
Housing Structures by Number of Rooms in Little River
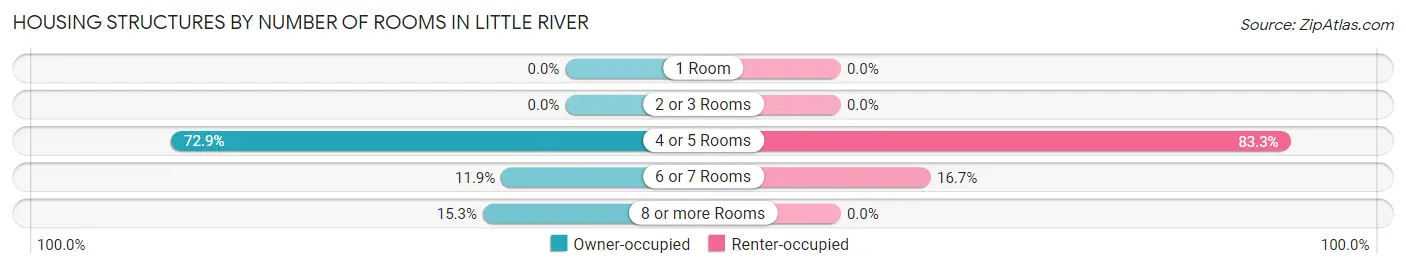
| Number of Rooms | Owner-occupied | Renter-occupied |
| 1 Room | 0 (0.0%) | 0 (0.0%) |
| 2 or 3 Rooms | 0 (0.0%) | 0 (0.0%) |
| 4 or 5 Rooms | 43 (72.9%) | 35 (83.3%) |
| 6 or 7 Rooms | 7 (11.9%) | 7 (16.7%) |
| 8 or more Rooms | 9 (15.2%) | 0 (0.0%) |
| Total | 59 (100.0%) | 42 (100.0%) |
Housing Structure by Heating Type in Little River
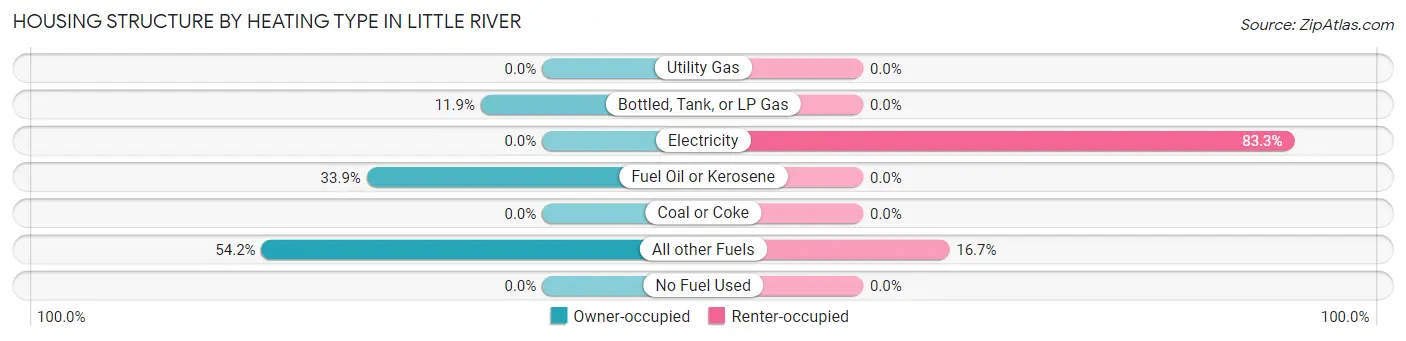
| Heating Type | Owner-occupied | Renter-occupied |
| Utility Gas | 0 (0.0%) | 0 (0.0%) |
| Bottled, Tank, or LP Gas | 7 (11.9%) | 0 (0.0%) |
| Electricity | 0 (0.0%) | 35 (83.3%) |
| Fuel Oil or Kerosene | 20 (33.9%) | 0 (0.0%) |
| Coal or Coke | 0 (0.0%) | 0 (0.0%) |
| All other Fuels | 32 (54.2%) | 7 (16.7%) |
| No Fuel Used | 0 (0.0%) | 0 (0.0%) |
| Total | 59 (100.0%) | 42 (100.0%) |
Household Vehicle Usage in Little River
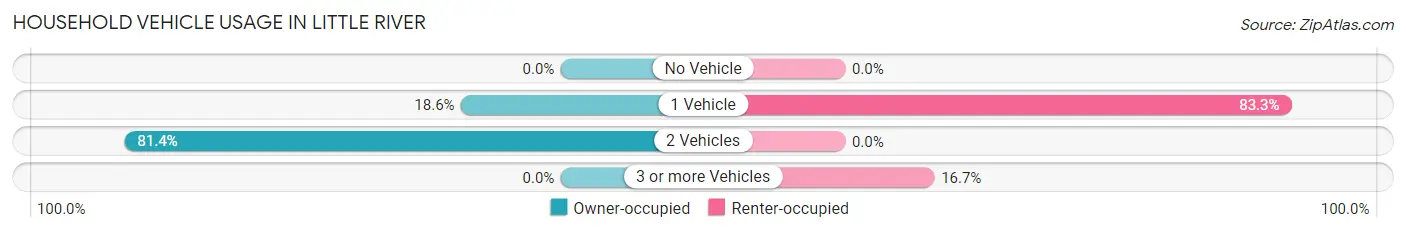
| Vehicles per Household | Owner-occupied | Renter-occupied |
| No Vehicle | 0 (0.0%) | 0 (0.0%) |
| 1 Vehicle | 11 (18.6%) | 35 (83.3%) |
| 2 Vehicles | 48 (81.4%) | 0 (0.0%) |
| 3 or more Vehicles | 0 (0.0%) | 7 (16.7%) |
| Total | 59 (100.0%) | 42 (100.0%) |
Real Estate & Mortgages in Little River
Real Estate and Mortgage Overview in Little River
| Characteristic | Without Mortgage | With Mortgage |
| Housing Units | 59 | 0 |
| Median Property Value | $452,300 | $0 |
| Median Household Income | $28,945 | $0 |
| Monthly Housing Costs | - | - |
| Real Estate Taxes | $1,852 | $0 |
Property Value by Mortgage Status in Little River
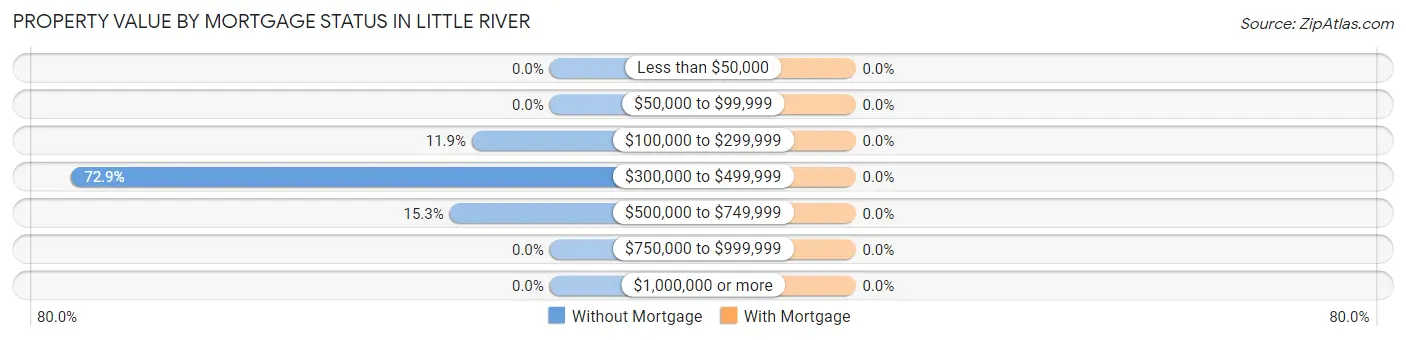
| Property Value | Without Mortgage | With Mortgage |
| Less than $50,000 | 0 (0.0%) | 0 (0.0%) |
| $50,000 to $99,999 | 0 (0.0%) | 0 (0.0%) |
| $100,000 to $299,999 | 7 (11.9%) | 0 (0.0%) |
| $300,000 to $499,999 | 43 (72.9%) | 0 (0.0%) |
| $500,000 to $749,999 | 9 (15.2%) | 0 (0.0%) |
| $750,000 to $999,999 | 0 (0.0%) | 0 (0.0%) |
| $1,000,000 or more | 0 (0.0%) | 0 (0.0%) |
| Total | 59 (100.0%) | 0 (0.0%) |
Household Income by Mortgage Status in Little River
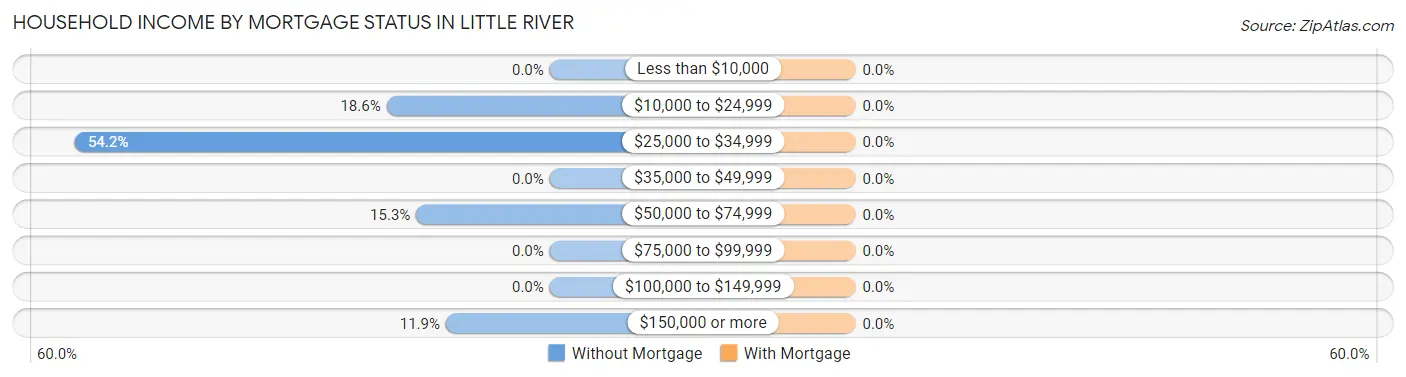
| Household Income | Without Mortgage | With Mortgage |
| Less than $10,000 | 0 (0.0%) | 0 (0.0%) |
| $10,000 to $24,999 | 11 (18.6%) | 0 (0.0%) |
| $25,000 to $34,999 | 32 (54.2%) | 0 (0.0%) |
| $35,000 to $49,999 | 0 (0.0%) | 0 (0.0%) |
| $50,000 to $74,999 | 9 (15.2%) | 0 (0.0%) |
| $75,000 to $99,999 | 0 (0.0%) | 0 (0.0%) |
| $100,000 to $149,999 | 0 (0.0%) | 0 (0.0%) |
| $150,000 or more | 7 (11.9%) | 0 (0.0%) |
| Total | 59 (100.0%) | 0 (0.0%) |
Property Value to Household Income Ratio in Little River
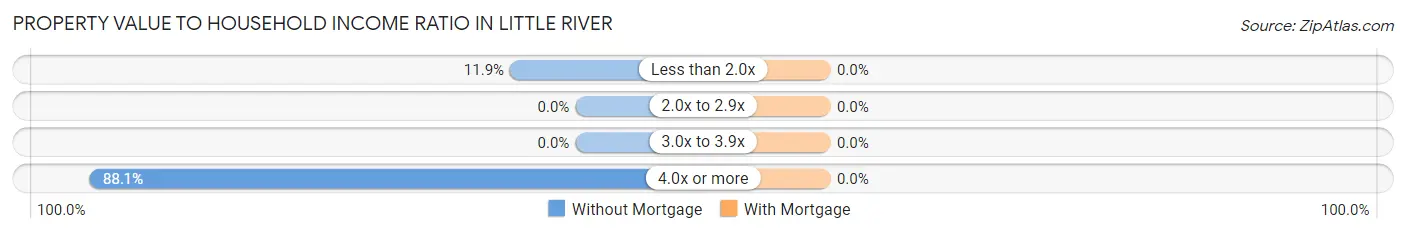
| Value-to-Income Ratio | Without Mortgage | With Mortgage |
| Less than 2.0x | 7 (11.9%) | 0 (0.0%) |
| 2.0x to 2.9x | 0 (0.0%) | 0 (0.0%) |
| 3.0x to 3.9x | 0 (0.0%) | 0 (0.0%) |
| 4.0x or more | 52 (88.1%) | 0 (0.0%) |
| Total | 59 (100.0%) | 0 (0.0%) |
Real Estate Taxes by Mortgage Status in Little River
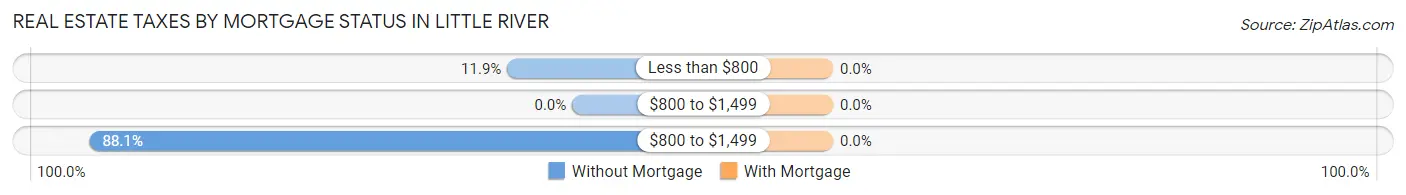
| Property Taxes | Without Mortgage | With Mortgage |
| Less than $800 | 7 (11.9%) | 0 (0.0%) |
| $800 to $1,499 | 0 (0.0%) | 0 (0.0%) |
| $800 to $1,499 | 52 (88.1%) | 0 (0.0%) |
| Total | 59 (100.0%) | 0 (0.0%) |
Health & Disability in Little River
Health Insurance Coverage by Age in Little River
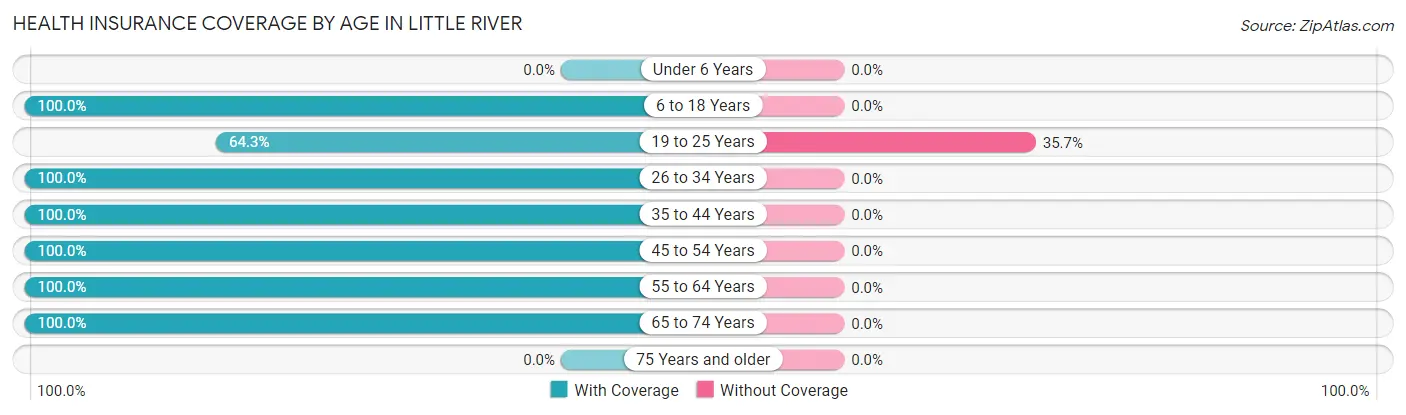
| Age Bracket | With Coverage | Without Coverage |
| Under 6 Years | 0 (0.0%) | 0 (0.0%) |
| 6 to 18 Years | 79 (100.0%) | 0 (0.0%) |
| 19 to 25 Years | 18 (64.3%) | 10 (35.7%) |
| 26 to 34 Years | 20 (100.0%) | 0 (0.0%) |
| 35 to 44 Years | 9 (100.0%) | 0 (0.0%) |
| 45 to 54 Years | 35 (100.0%) | 0 (0.0%) |
| 55 to 64 Years | 9 (100.0%) | 0 (0.0%) |
| 65 to 74 Years | 43 (100.0%) | 0 (0.0%) |
| 75 Years and older | 0 (0.0%) | 0 (0.0%) |
| Total | 213 (95.5%) | 10 (4.5%) |
Health Insurance Coverage by Citizenship Status in Little River
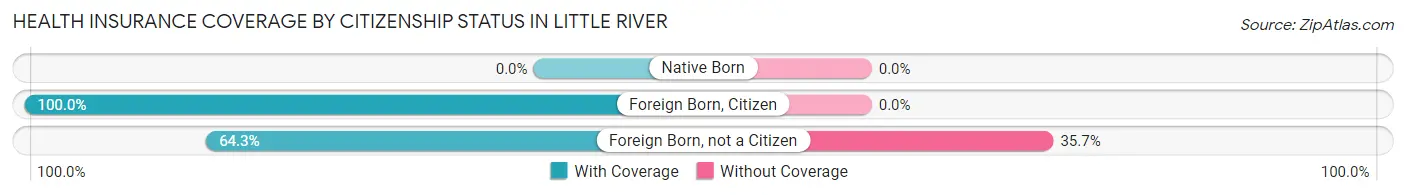
| Citizenship Status | With Coverage | Without Coverage |
| Native Born | 0 (0.0%) | 0 (0.0%) |
| Foreign Born, Citizen | 79 (100.0%) | 0 (0.0%) |
| Foreign Born, not a Citizen | 18 (64.3%) | 10 (35.7%) |
Health Insurance Coverage by Household Income in Little River
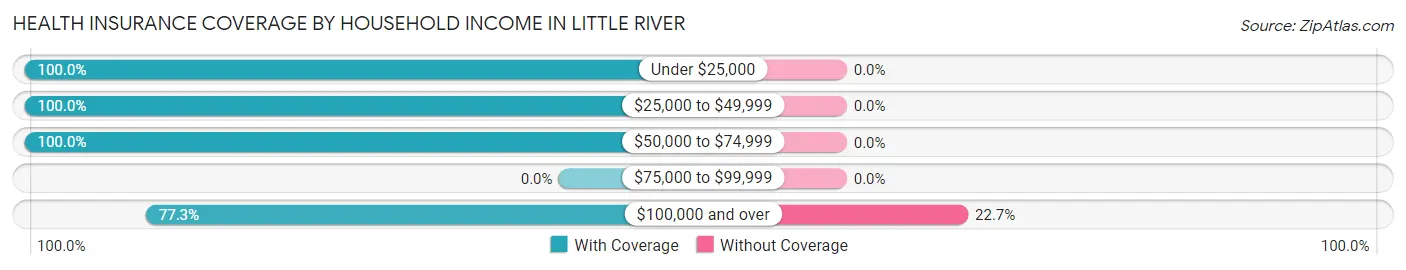
| Household Income | With Coverage | Without Coverage |
| Under $25,000 | 100 (100.0%) | 0 (0.0%) |
| $25,000 to $49,999 | 32 (100.0%) | 0 (0.0%) |
| $50,000 to $74,999 | 47 (100.0%) | 0 (0.0%) |
| $75,000 to $99,999 | 0 (0.0%) | 0 (0.0%) |
| $100,000 and over | 34 (77.3%) | 10 (22.7%) |
Public vs Private Health Insurance Coverage by Age in Little River
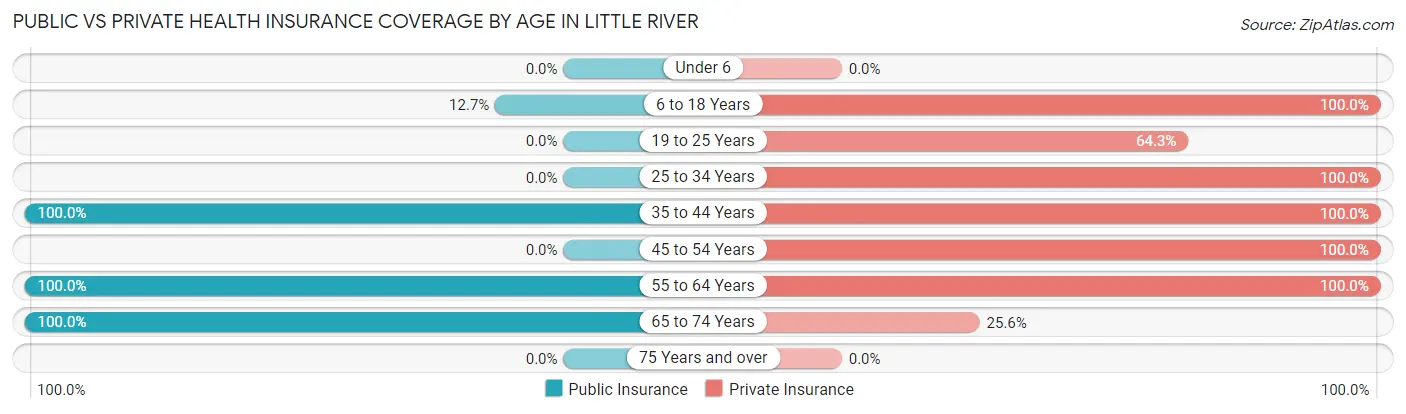
| Age Bracket | Public Insurance | Private Insurance |
| Under 6 | 0 (0.0%) | 0 (0.0%) |
| 6 to 18 Years | 10 (12.7%) | 79 (100.0%) |
| 19 to 25 Years | 0 (0.0%) | 18 (64.3%) |
| 25 to 34 Years | 0 (0.0%) | 20 (100.0%) |
| 35 to 44 Years | 9 (100.0%) | 9 (100.0%) |
| 45 to 54 Years | 0 (0.0%) | 35 (100.0%) |
| 55 to 64 Years | 9 (100.0%) | 9 (100.0%) |
| 65 to 74 Years | 43 (100.0%) | 11 (25.6%) |
| 75 Years and over | 0 (0.0%) | 0 (0.0%) |
| Total | 71 (31.8%) | 181 (81.2%) |
Disability Status by Sex by Age in Little River
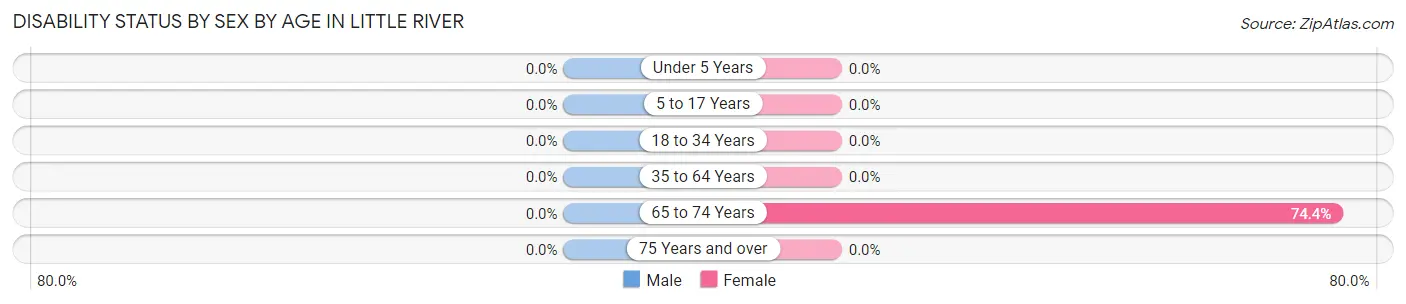
| Age Bracket | Male | Female |
| Under 5 Years | 0 (0.0%) | 0 (0.0%) |
| 5 to 17 Years | 0 (0.0%) | 0 (0.0%) |
| 18 to 34 Years | 0 (0.0%) | 0 (0.0%) |
| 35 to 64 Years | 0 (0.0%) | 0 (0.0%) |
| 65 to 74 Years | 0 (0.0%) | 32 (74.4%) |
| 75 Years and over | 0 (0.0%) | 0 (0.0%) |
Disability Class by Sex by Age in Little River
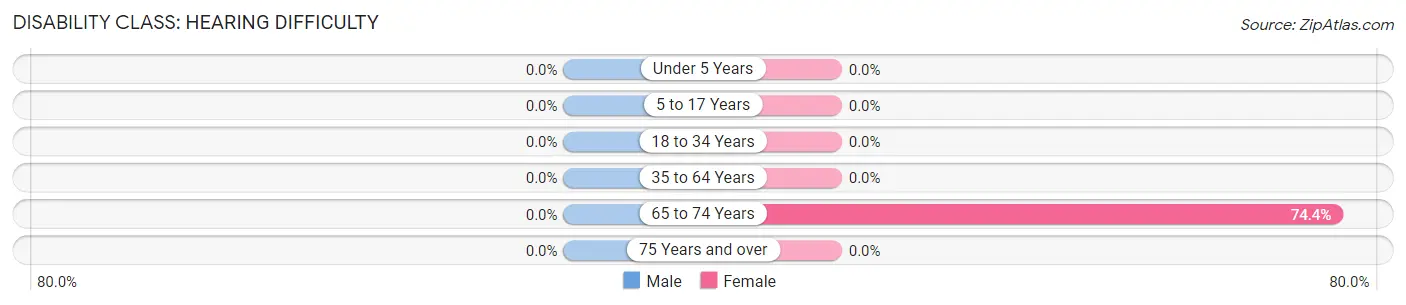
Disability Class: Hearing Difficulty
| Age Bracket | Male | Female |
| Under 5 Years | 0 (0.0%) | 0 (0.0%) |
| 5 to 17 Years | 0 (0.0%) | 0 (0.0%) |
| 18 to 34 Years | 0 (0.0%) | 0 (0.0%) |
| 35 to 64 Years | 0 (0.0%) | 0 (0.0%) |
| 65 to 74 Years | 0 (0.0%) | 32 (74.4%) |
| 75 Years and over | 0 (0.0%) | 0 (0.0%) |
Disability Class: Vision Difficulty
| Age Bracket | Male | Female |
| Under 5 Years | 0 (0.0%) | 0 (0.0%) |
| 5 to 17 Years | 0 (0.0%) | 0 (0.0%) |
| 18 to 34 Years | 0 (0.0%) | 0 (0.0%) |
| 35 to 64 Years | 0 (0.0%) | 0 (0.0%) |
| 65 to 74 Years | 0 (0.0%) | 0 (0.0%) |
| 75 Years and over | 0 (0.0%) | 0 (0.0%) |
Disability Class: Cognitive Difficulty
| Age Bracket | Male | Female |
| 5 to 17 Years | 0 (0.0%) | 0 (0.0%) |
| 18 to 34 Years | 0 (0.0%) | 0 (0.0%) |
| 35 to 64 Years | 0 (0.0%) | 0 (0.0%) |
| 65 to 74 Years | 0 (0.0%) | 0 (0.0%) |
| 75 Years and over | 0 (0.0%) | 0 (0.0%) |
Disability Class: Ambulatory Difficulty
| Age Bracket | Male | Female |
| 5 to 17 Years | 0 (0.0%) | 0 (0.0%) |
| 18 to 34 Years | 0 (0.0%) | 0 (0.0%) |
| 35 to 64 Years | 0 (0.0%) | 0 (0.0%) |
| 65 to 74 Years | 0 (0.0%) | 0 (0.0%) |
| 75 Years and over | 0 (0.0%) | 0 (0.0%) |
Disability Class: Self-Care Difficulty
| Age Bracket | Male | Female |
| 5 to 17 Years | 0 (0.0%) | 0 (0.0%) |
| 18 to 34 Years | 0 (0.0%) | 0 (0.0%) |
| 35 to 64 Years | 0 (0.0%) | 0 (0.0%) |
| 65 to 74 Years | 0 (0.0%) | 0 (0.0%) |
| 75 Years and over | 0 (0.0%) | 0 (0.0%) |
Technology Access in Little River
Computing Device Access in Little River
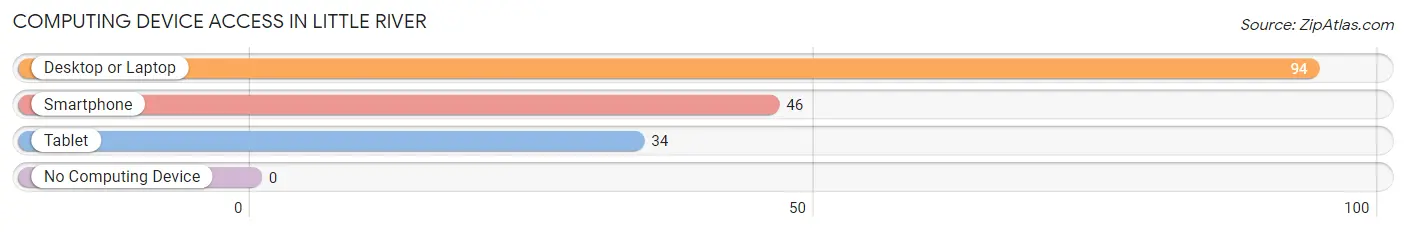
| Device Type | # Households | % Households |
| Desktop or Laptop | 94 | 93.1% |
| Smartphone | 46 | 45.5% |
| Tablet | 34 | 33.7% |
| No Computing Device | 0 | 0.0% |
| Total | 101 | 100.0% |
Internet Access in Little River
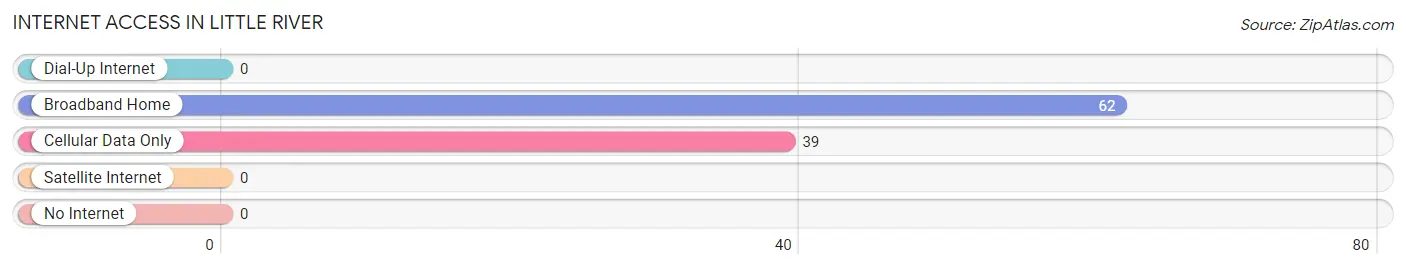
| Internet Type | # Households | % Households |
| Dial-Up Internet | 0 | 0.0% |
| Broadband Home | 62 | 61.4% |
| Cellular Data Only | 39 | 38.6% |
| Satellite Internet | 0 | 0.0% |
| No Internet | 0 | 0.0% |
| Total | 101 | 100.0% |
Little River Summary
River, CA is a small unincorporated community located in Mendocino County, California. It is situated on the banks of the Little River, a tributary of the Eel River. The town is located approximately 10 miles south of the city of Fort Bragg and is home to a population of approximately 500 people.
History
The area around Little River was first inhabited by the Pomo people, who lived in the area for thousands of years before the arrival of Europeans. The first Europeans to settle in the area were Russian fur traders, who established a trading post in the area in the early 19th century. The area was later settled by American settlers in the 1850s, who established a small fishing village. The town was officially founded in 1867 and was named after the Little River.
Geography
Little River is located in Mendocino County, California, on the banks of the Little River. The town is situated on a small peninsula, surrounded by the Pacific Ocean to the west and the Eel River to the east. The town is located approximately 10 miles south of the city of Fort Bragg and is home to a population of approximately 500 people. The town is located in a temperate climate, with mild winters and warm summers.
Economy
The economy of Little River is largely based on tourism and fishing. The town is home to a number of small businesses, including restaurants, shops, and lodging. The town is also home to a number of art galleries and studios, as well as a number of wineries. The town is also home to a number of charter fishing boats, which offer deep sea fishing trips.
Demographics
As of the 2010 census, the population of Little River was 498. The racial makeup of the town was 94.2% White, 0.2% African American, 0.8% Native American, 0.6% Asian, 0.2% Pacific Islander, 0.8% from other races, and 3.2% from two or more races. The median household income in Little River was $45,000, and the median family income was $50,000. The per capita income in Little River was $20,000. The town has a high rate of poverty, with 24.2% of the population living below the poverty line.
Common Questions
What is Per Capita Income in Little River?
Per Capita income in Little River is $17,750.
What is the Median Family Income in Little River?
Median Family Income in Little River is $2,499.
What is Income or Wage Gap in Little River?
Income or Wage Gap in Little River is 64.4%.
Women in Little River earn 35.6 cents for every dollar earned by a man.
What is Inequality or Gini Index in Little River?
Inequality or Gini Index in Little River is 0.62.
What is the Total Population of Little River?
Total Population of Little River is 223.
What is the Total Male Population of Little River?
Total Male Population of Little River is 49.
What is the Total Female Population of Little River?
Total Female Population of Little River is 174.
What is the Ratio of Males per 100 Females in Little River?
There are 28.16 Males per 100 Females in Little River.
What is the Ratio of Females per 100 Males in Little River?
There are 355.10 Females per 100 Males in Little River.
What is the Median Population Age in Little River?
Median Population Age in Little River is 30.6 Years.
What is the Average Family Size in Little River
Average Family Size in Little River is 2.5 People.
What is the Average Household Size in Little River
Average Household Size in Little River is 2.2 People.
How Large is the Labor Force in Little River?
There are 98 People in the Labor Forcein in Little River.
What is the Percentage of People in the Labor Force in Little River?
49.5% of People are in the Labor Force in Little River.