Benton, CA Map & Demographics
Benton Map
Benton Overview
$27,467
PER CAPITA INCOME
$50,313
AVG FAMILY INCOME
$62,760
AVG HOUSEHOLD INCOME
0.38
INEQUALITY / GINI INDEX
393
TOTAL POPULATION
209
MALE POPULATION
184
FEMALE POPULATION
113.59
MALES / 100 FEMALES
88.04
FEMALES / 100 MALES
49.4
MEDIAN AGE
2.5
AVG FAMILY SIZE
2.3
AVG HOUSEHOLD SIZE
158
LABOR FORCE [ PEOPLE ]
46.9%
PERCENT IN LABOR FORCE
1.3%
UNEMPLOYMENT RATE
Benton Zip Codes
Income in Benton
Income Overview in Benton
Per Capita Income in Benton is $27,467, while median incomes of families and households are $50,313 and $62,760 respectively.
| Characteristic | Number | Measure |
| Per Capita Income | 393 | $27,467 |
| Median Family Income | 141 | $50,313 |
| Mean Family Income | 141 | $56,632 |
| Median Household Income | 172 | $62,760 |
| Mean Household Income | 172 | $57,449 |
| Income Deficit | 141 | $0 |
| Wage / Income Gap (%) | 393 | 0.00% |
| Wage / Income Gap ($) | 393 | 100.00¢ per $1 |
| Gini / Inequality Index | 393 | 0.38 |
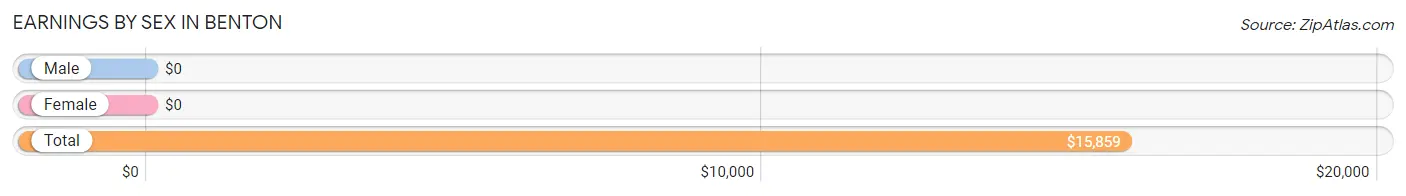
Earnings by Sex in Benton
| Sex | Number | Average Earnings |
| Male | 128 (61.8%) | $0 |
| Female | 79 (38.2%) | $0 |
| Total | 207 (100.0%) | $15,859 |
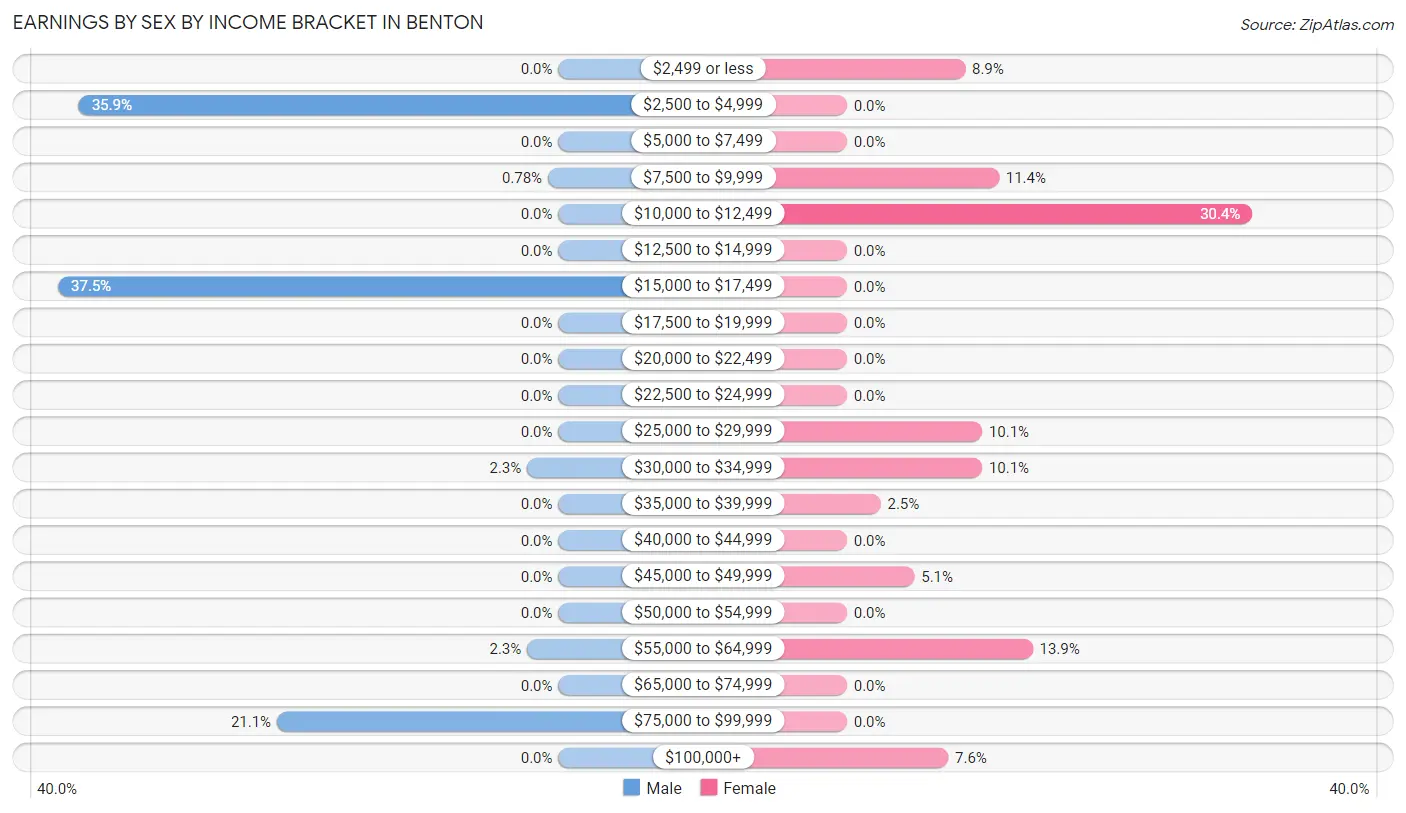
Earnings by Sex by Income Bracket in Benton
The most common earnings brackets in Benton are $15,000 to $17,499 for men (48 | 37.5%) and $10,000 to $12,499 for women (24 | 30.4%).
| Income | Male | Female |
| $2,499 or less | 0 (0.0%) | 7 (8.9%) |
| $2,500 to $4,999 | 46 (35.9%) | 0 (0.0%) |
| $5,000 to $7,499 | 0 (0.0%) | 0 (0.0%) |
| $7,500 to $9,999 | 1 (0.8%) | 9 (11.4%) |
| $10,000 to $12,499 | 0 (0.0%) | 24 (30.4%) |
| $12,500 to $14,999 | 0 (0.0%) | 0 (0.0%) |
| $15,000 to $17,499 | 48 (37.5%) | 0 (0.0%) |
| $17,500 to $19,999 | 0 (0.0%) | 0 (0.0%) |
| $20,000 to $22,499 | 0 (0.0%) | 0 (0.0%) |
| $22,500 to $24,999 | 0 (0.0%) | 0 (0.0%) |
| $25,000 to $29,999 | 0 (0.0%) | 8 (10.1%) |
| $30,000 to $34,999 | 3 (2.3%) | 8 (10.1%) |
| $35,000 to $39,999 | 0 (0.0%) | 2 (2.5%) |
| $40,000 to $44,999 | 0 (0.0%) | 0 (0.0%) |
| $45,000 to $49,999 | 0 (0.0%) | 4 (5.1%) |
| $50,000 to $54,999 | 0 (0.0%) | 0 (0.0%) |
| $55,000 to $64,999 | 3 (2.3%) | 11 (13.9%) |
| $65,000 to $74,999 | 0 (0.0%) | 0 (0.0%) |
| $75,000 to $99,999 | 27 (21.1%) | 0 (0.0%) |
| $100,000+ | 0 (0.0%) | 6 (7.6%) |
| Total | 128 (100.0%) | 79 (100.0%) |
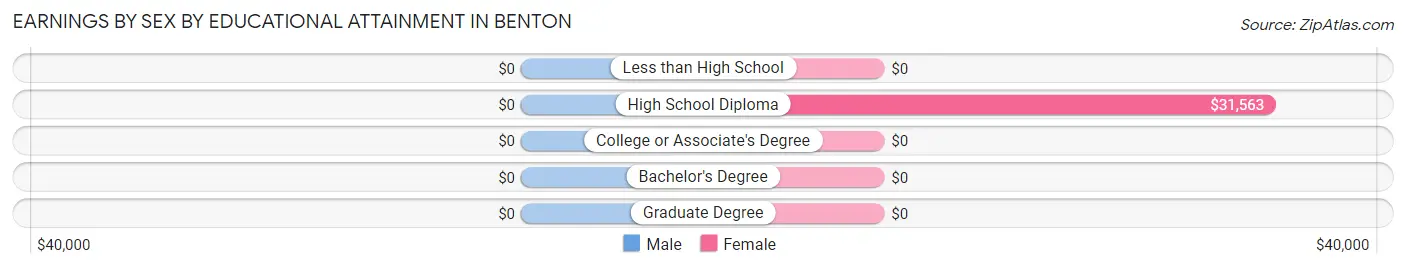
Earnings by Sex by Educational Attainment in Benton
| Educational Attainment | Male Income | Female Income |
| Less than High School | - | - |
| High School Diploma | - | - |
| College or Associate's Degree | - | - |
| Bachelor's Degree | - | - |
| Graduate Degree | - | - |
| Total | - | - |
Family Income in Benton
Family Income Brackets in Benton
According to the Benton family income data, there are 57 families falling into the $50,000 to $74,999 income range, which is the most common income bracket and makes up 40.4% of all families.
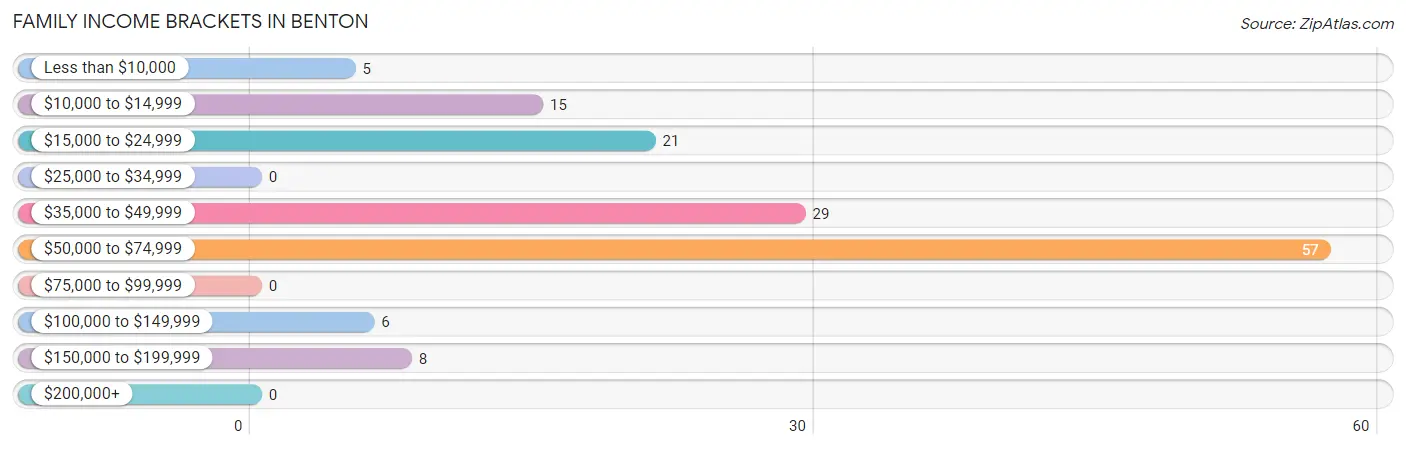
| Income Bracket | # Families | % Families |
| Less than $10,000 | 5 | 3.5% |
| $10,000 to $14,999 | 15 | 10.6% |
| $15,000 to $24,999 | 21 | 14.9% |
| $25,000 to $34,999 | 0 | 0.0% |
| $35,000 to $49,999 | 29 | 20.6% |
| $50,000 to $74,999 | 57 | 40.4% |
| $75,000 to $99,999 | 0 | 0.0% |
| $100,000 to $149,999 | 6 | 4.3% |
| $150,000 to $199,999 | 8 | 5.7% |
| $200,000+ | 0 | 0.0% |
Family Income by Famaliy Size in Benton
2-person families (105 | 74.5%) account for the highest median family income in Benton with $62,578 per family, while 2-person families (105 | 74.5%) have the highest median income of $31,289 per family member.
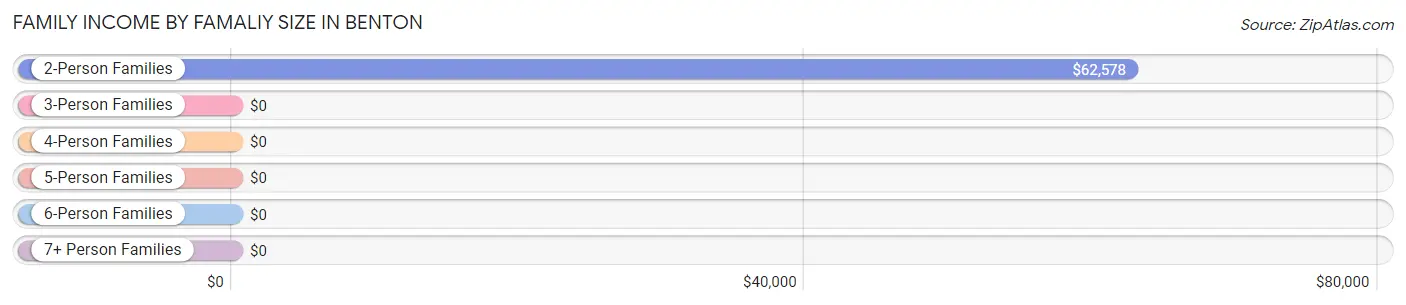
| Income Bracket | # Families | Median Income |
| 2-Person Families | 105 (74.5%) | $62,578 |
| 3-Person Families | 17 (12.1%) | $0 |
| 4-Person Families | 8 (5.7%) | $0 |
| 5-Person Families | 11 (7.8%) | $0 |
| 6-Person Families | 0 (0.0%) | $0 |
| 7+ Person Families | 0 (0.0%) | $0 |
| Total | 141 (100.0%) | $50,313 |
Family Income by Number of Earners in Benton
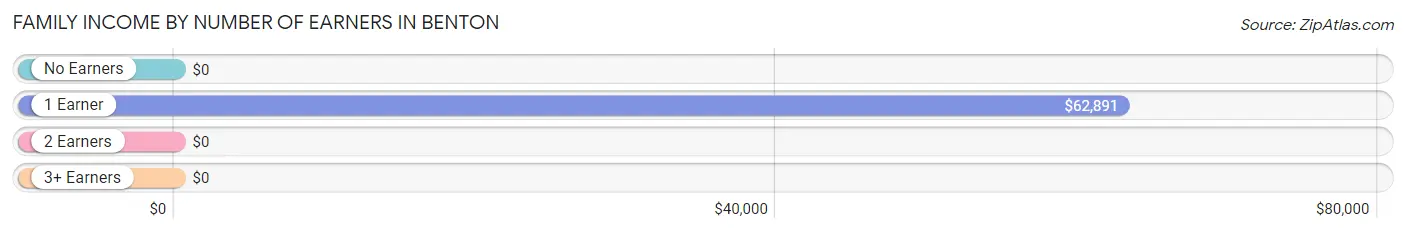
| Number of Earners | # Families | Median Income |
| No Earners | 9 (6.4%) | $0 |
| 1 Earner | 103 (73.1%) | $62,891 |
| 2 Earners | 29 (20.6%) | $0 |
| 3+ Earners | 0 (0.0%) | $0 |
| Total | 141 (100.0%) | $50,313 |
Household Income in Benton
Household Income Brackets in Benton
With 68 households falling in the category, the $50,000 to $74,999 income range is the most frequent in Benton, accounting for 39.5% of all households.
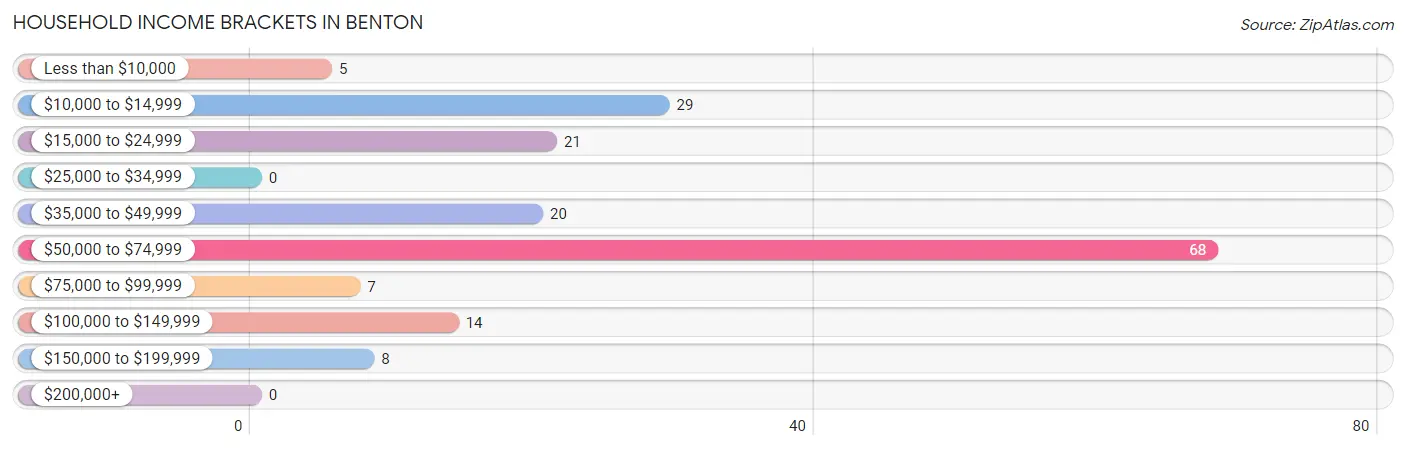
| Income Bracket | # Households | % Households |
| Less than $10,000 | 5 | 2.9% |
| $10,000 to $14,999 | 29 | 16.9% |
| $15,000 to $24,999 | 21 | 12.2% |
| $25,000 to $34,999 | 0 | 0.0% |
| $35,000 to $49,999 | 20 | 11.6% |
| $50,000 to $74,999 | 68 | 39.5% |
| $75,000 to $99,999 | 7 | 4.1% |
| $100,000 to $149,999 | 14 | 8.1% |
| $150,000 to $199,999 | 8 | 4.7% |
| $200,000+ | 0 | 0.0% |
Household Income by Householder Age in Benton
The median household income in Benton is $62,760, with the highest median household income of $105,781 found in the 45 to 64 years age bracket for the primary householder. A total of 39 households (22.7%) fall into this category.
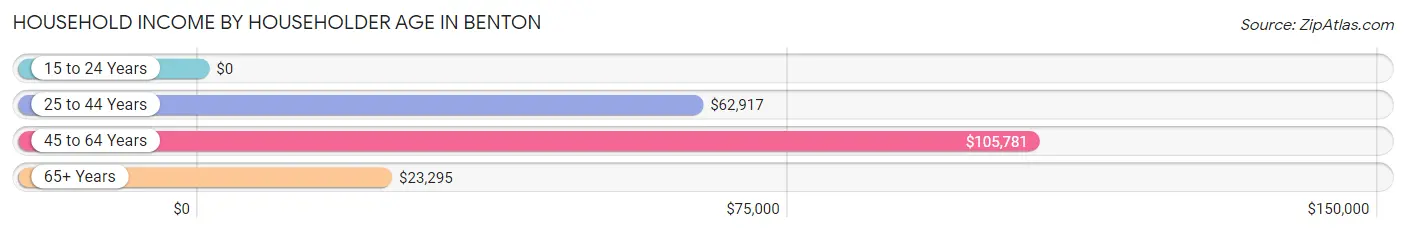
| Income Bracket | # Households | Median Income |
| 15 to 24 Years | 0 (0.0%) | $0 |
| 25 to 44 Years | 80 (46.5%) | $62,917 |
| 45 to 64 Years | 39 (22.7%) | $105,781 |
| 65+ Years | 53 (30.8%) | $23,295 |
| Total | 172 (100.0%) | $62,760 |
Poverty in Benton
Income Below Poverty by Sex and Age in Benton
With 29.7% poverty level for males and 17.9% for females among the residents of Benton, under 5 year old males and 25 to 34 year old females are the most vulnerable to poverty, with 36 males (100.0%) and 11 females (100.0%) in their respective age groups living below the poverty level.
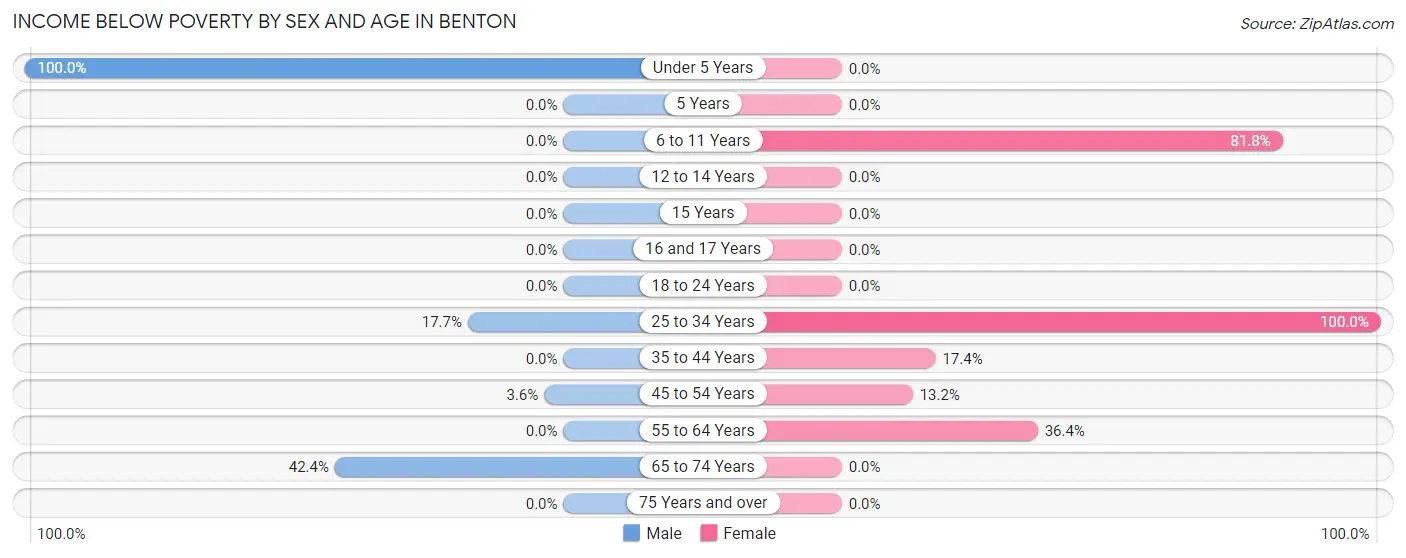
| Age Bracket | Male | Female |
| Under 5 Years | 36 (100.0%) | 0 (0.0%) |
| 5 Years | 0 (0.0%) | 0 (0.0%) |
| 6 to 11 Years | 0 (0.0%) | 9 (81.8%) |
| 12 to 14 Years | 0 (0.0%) | 0 (0.0%) |
| 15 Years | 0 (0.0%) | 0 (0.0%) |
| 16 and 17 Years | 0 (0.0%) | 0 (0.0%) |
| 18 to 24 Years | 0 (0.0%) | 0 (0.0%) |
| 25 to 34 Years | 11 (17.7%) | 11 (100.0%) |
| 35 to 44 Years | 0 (0.0%) | 4 (17.4%) |
| 45 to 54 Years | 1 (3.6%) | 5 (13.2%) |
| 55 to 64 Years | 0 (0.0%) | 4 (36.4%) |
| 65 to 74 Years | 14 (42.4%) | 0 (0.0%) |
| 75 Years and over | 0 (0.0%) | 0 (0.0%) |
| Total | 62 (29.7%) | 33 (17.9%) |
Income Above Poverty by Sex and Age in Benton
According to the poverty statistics in Benton, males aged 6 to 11 years and females aged 16 and 17 years are the age groups that are most secure financially, with 100.0% of males and 100.0% of females in these age groups living above the poverty line.
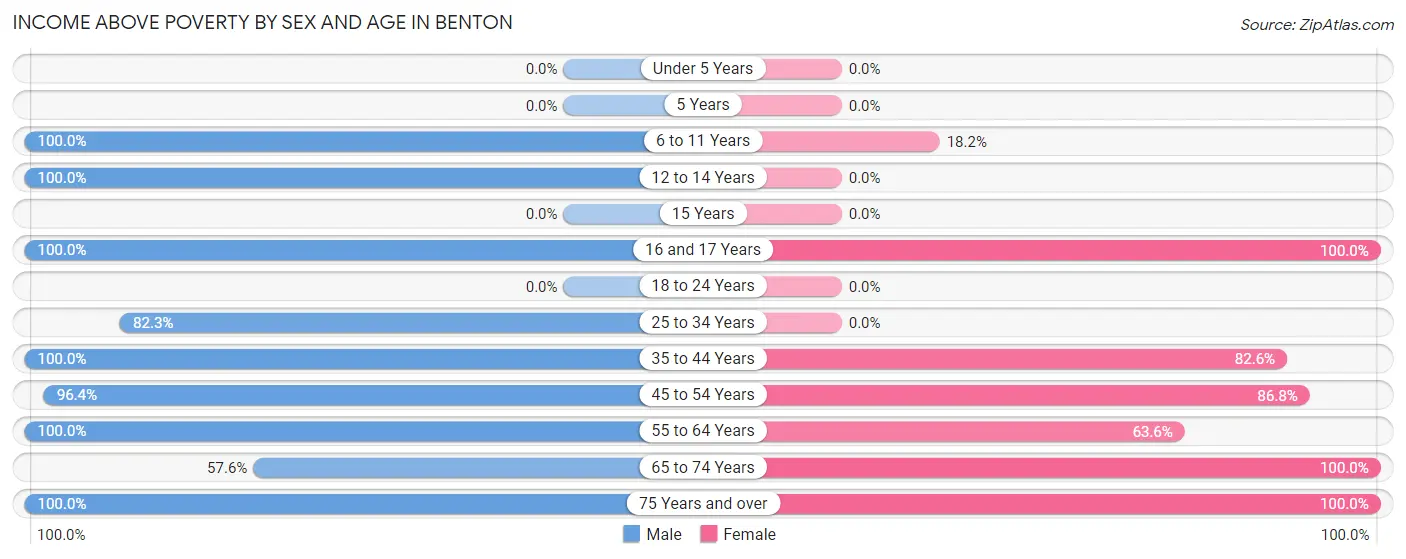
| Age Bracket | Male | Female |
| Under 5 Years | 0 (0.0%) | 0 (0.0%) |
| 5 Years | 0 (0.0%) | 0 (0.0%) |
| 6 to 11 Years | 6 (100.0%) | 2 (18.2%) |
| 12 to 14 Years | 3 (100.0%) | 0 (0.0%) |
| 15 Years | 0 (0.0%) | 0 (0.0%) |
| 16 and 17 Years | 3 (100.0%) | 1 (100.0%) |
| 18 to 24 Years | 0 (0.0%) | 0 (0.0%) |
| 25 to 34 Years | 51 (82.3%) | 0 (0.0%) |
| 35 to 44 Years | 19 (100.0%) | 19 (82.6%) |
| 45 to 54 Years | 27 (96.4%) | 33 (86.8%) |
| 55 to 64 Years | 15 (100.0%) | 7 (63.6%) |
| 65 to 74 Years | 19 (57.6%) | 61 (100.0%) |
| 75 Years and over | 4 (100.0%) | 28 (100.0%) |
| Total | 147 (70.3%) | 151 (82.1%) |
Income Below Poverty Among Married-Couple Families in Benton
The poverty statistics for married-couple families in Benton show that 4.5% or 1 of the total 22 families live below the poverty line. Families with no children have the highest poverty rate of 4.5%, comprising of 1 families. On the other hand, families with no children have the lowest poverty rate of 4.5%, which includes 1 families.
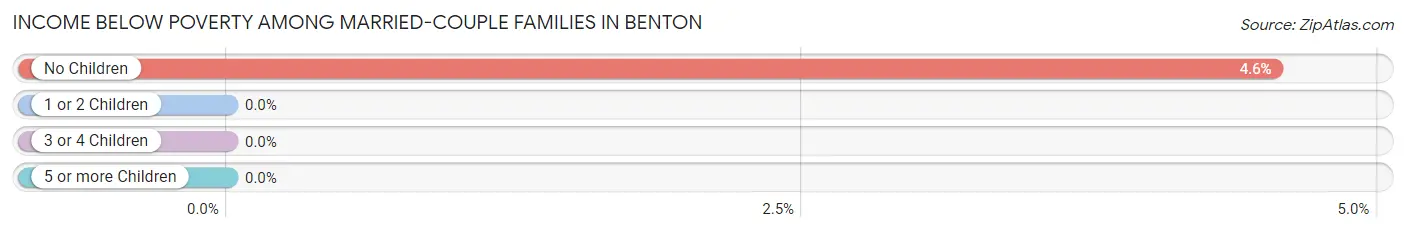
| Children | Above Poverty | Below Poverty |
| No Children | 21 (95.5%) | 1 (4.5%) |
| 1 or 2 Children | 0 (0.0%) | 0 (0.0%) |
| 3 or 4 Children | 0 (0.0%) | 0 (0.0%) |
| 5 or more Children | 0 (0.0%) | 0 (0.0%) |
| Total | 21 (95.5%) | 1 (4.5%) |
Income Below Poverty Among Single-Parent Households in Benton
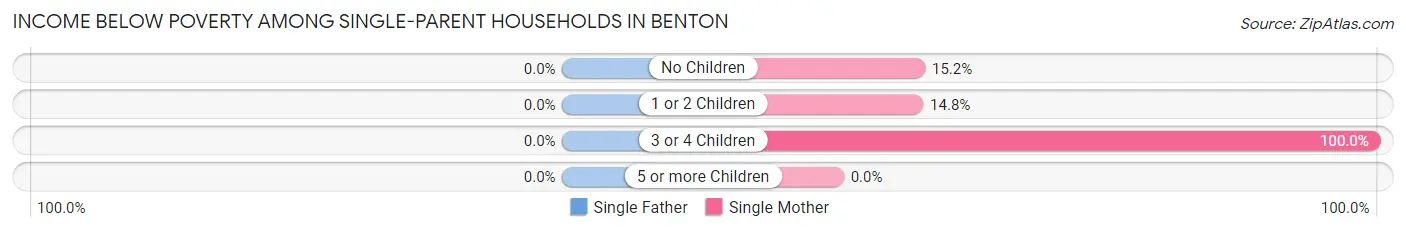
| Children | Single Father | Single Mother |
| No Children | 0 (0.0%) | 5 (15.1%) |
| 1 or 2 Children | 0 (0.0%) | 4 (14.8%) |
| 3 or 4 Children | 0 (0.0%) | 11 (100.0%) |
| 5 or more Children | 0 (0.0%) | 0 (0.0%) |
| Total | 0 (0.0%) | 20 (28.2%) |
Income Below Poverty Among Married-Couple vs Single-Parent Households in Benton
The poverty data for Benton shows that 1 of the married-couple family households (4.5%) and 20 of the single-parent households (16.8%) are living below the poverty level. Within the married-couple family households, those with no children have the highest poverty rate, with 1 households (4.5%) falling below the poverty line. Among the single-parent households, those with 3 or 4 children have the highest poverty rate, with 11 household (100.0%) living below poverty.
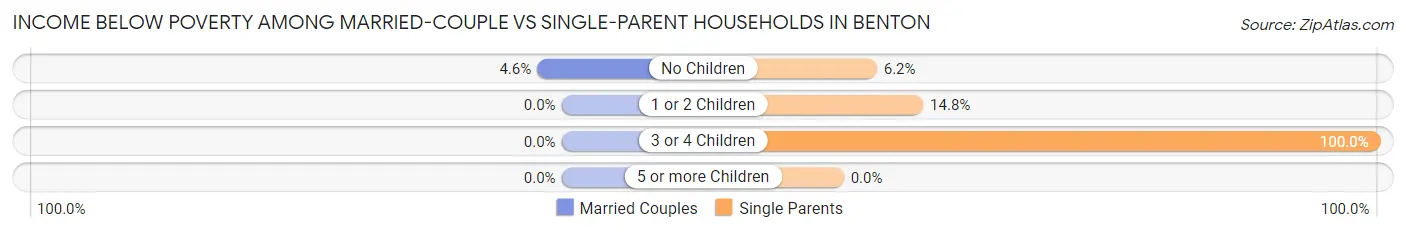
| Children | Married-Couple Families | Single-Parent Households |
| No Children | 1 (4.5%) | 5 (6.2%) |
| 1 or 2 Children | 0 (0.0%) | 4 (14.8%) |
| 3 or 4 Children | 0 (0.0%) | 11 (100.0%) |
| 5 or more Children | 0 (0.0%) | 0 (0.0%) |
| Total | 1 (4.5%) | 20 (16.8%) |
Race in Benton
The most populous races in Benton are White / Caucasian (238 | 60.6%), Native / Alaskan (79 | 20.1%), and Two or more Races (62 | 15.8%).
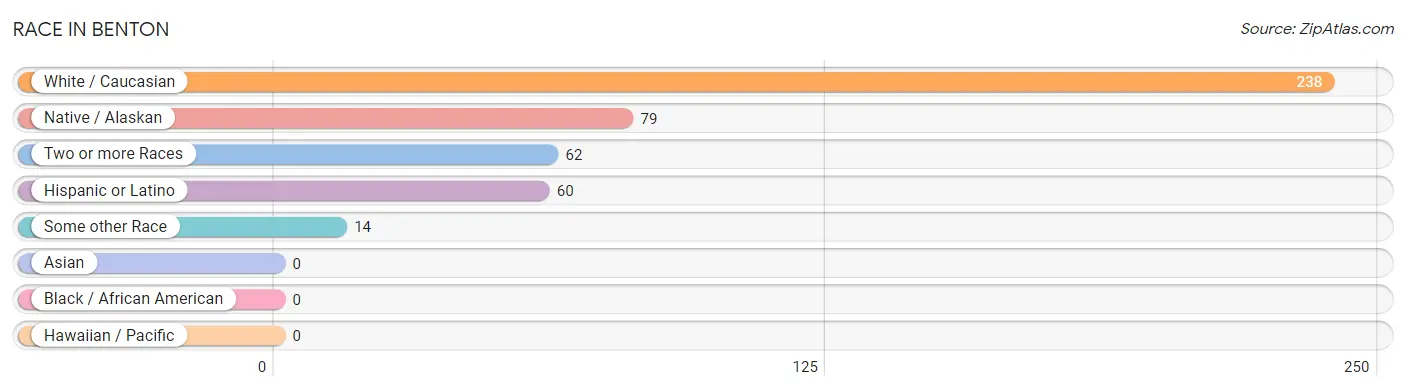
| Race | # Population | % Population |
| Asian | 0 | 0.0% |
| Black / African American | 0 | 0.0% |
| Hawaiian / Pacific | 0 | 0.0% |
| Hispanic or Latino | 60 | 15.3% |
| Native / Alaskan | 79 | 20.1% |
| White / Caucasian | 238 | 60.6% |
| Two or more Races | 62 | 15.8% |
| Some other Race | 14 | 3.6% |
| Total | 393 | 100.0% |
Ancestry in Benton
The most populous ancestries reported in Benton are Paiute (136 | 34.6%), Mexican (60 | 15.3%), Irish (52 | 13.2%), Scandinavian (37 | 9.4%), and Eastern European (27 | 6.9%), together accounting for 79.4% of all Benton residents.
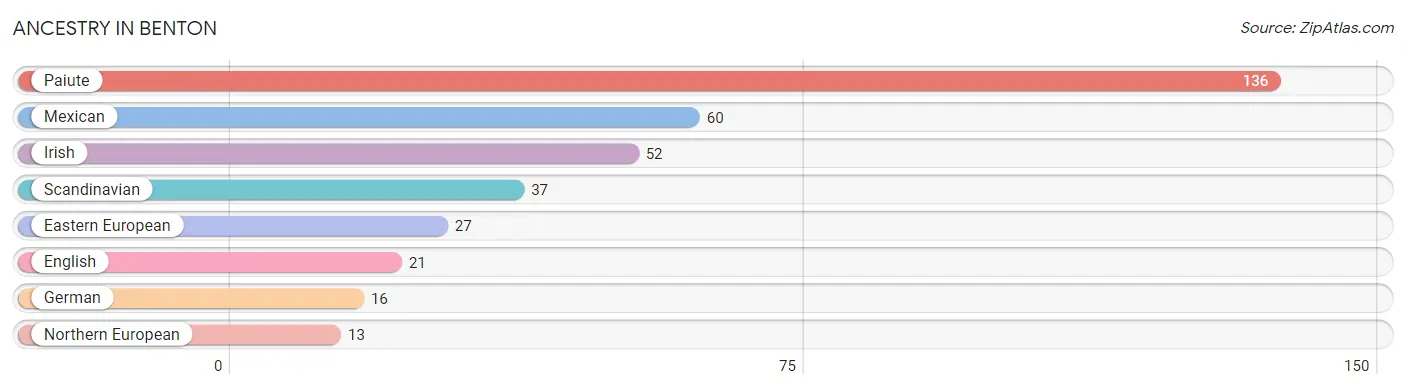
| Ancestry | # Population | % Population |
| Eastern European | 27 | 6.9% |
| English | 21 | 5.3% |
| German | 16 | 4.1% |
| Irish | 52 | 13.2% |
| Mexican | 60 | 15.3% |
| Northern European | 13 | 3.3% |
| Paiute | 136 | 34.6% |
| Scandinavian | 37 | 9.4% | View All 8 Rows |
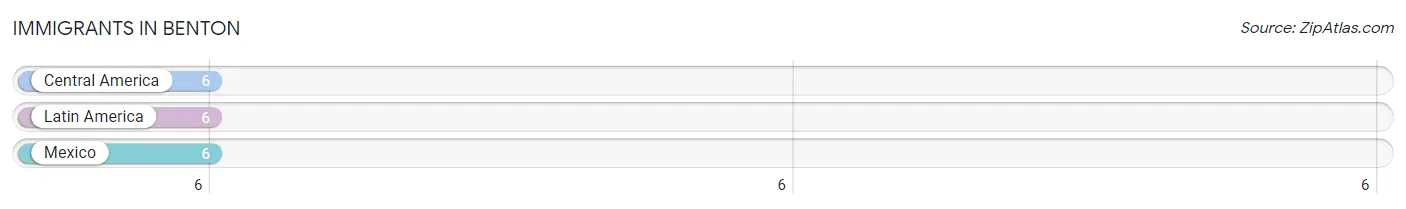
Immigrants in Benton
The most numerous immigrant groups reported in Benton came from Central America (6 | 1.5%), Latin America (6 | 1.5%), and Mexico (6 | 1.5%), together accounting for 4.6% of all Benton residents.
| Immigration Origin | # Population | % Population |
| Central America | 6 | 1.5% |
| Latin America | 6 | 1.5% |
| Mexico | 6 | 1.5% | View All 3 Rows |
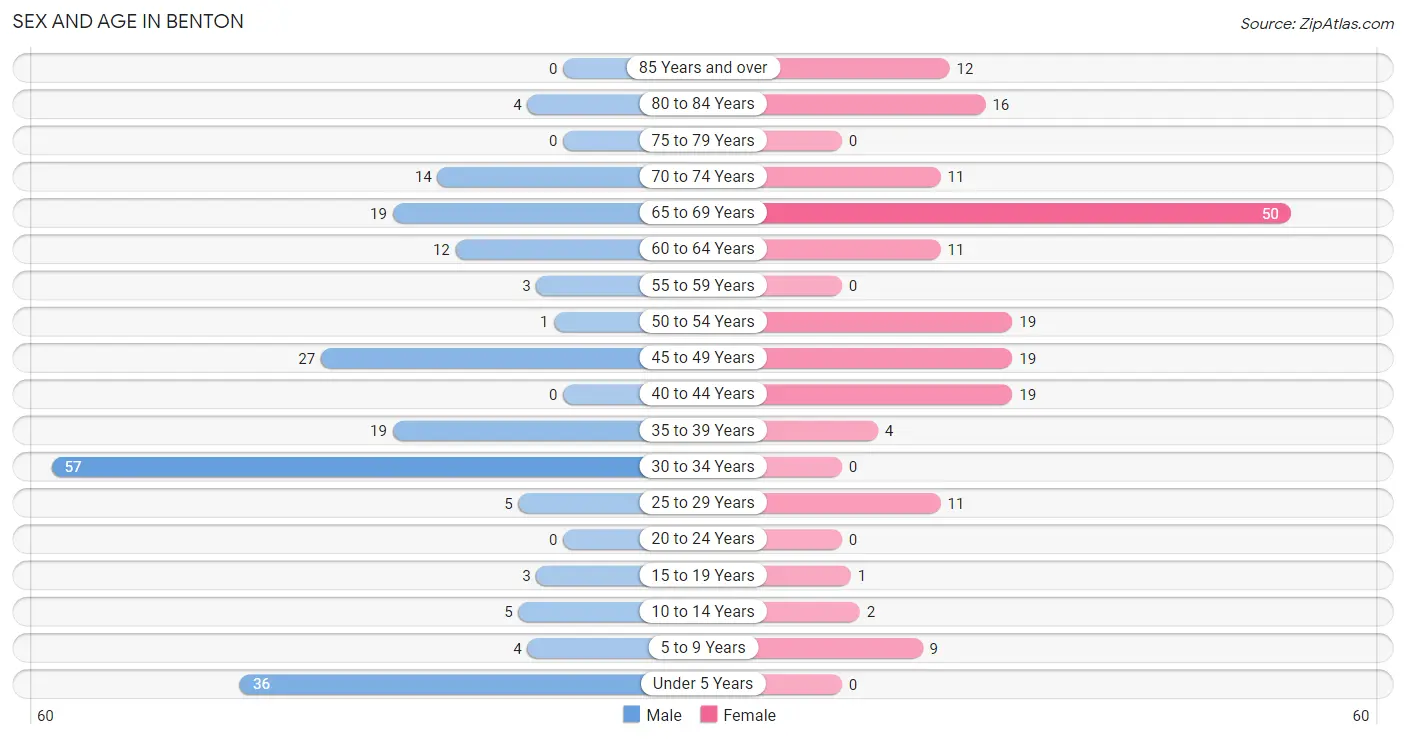
Sex and Age in Benton
Sex and Age in Benton
The most populous age groups in Benton are 30 to 34 Years (57 | 27.3%) for men and 65 to 69 Years (50 | 27.2%) for women.
| Age Bracket | Male | Female |
| Under 5 Years | 36 (17.2%) | 0 (0.0%) |
| 5 to 9 Years | 4 (1.9%) | 9 (4.9%) |
| 10 to 14 Years | 5 (2.4%) | 2 (1.1%) |
| 15 to 19 Years | 3 (1.4%) | 1 (0.5%) |
| 20 to 24 Years | 0 (0.0%) | 0 (0.0%) |
| 25 to 29 Years | 5 (2.4%) | 11 (6.0%) |
| 30 to 34 Years | 57 (27.3%) | 0 (0.0%) |
| 35 to 39 Years | 19 (9.1%) | 4 (2.2%) |
| 40 to 44 Years | 0 (0.0%) | 19 (10.3%) |
| 45 to 49 Years | 27 (12.9%) | 19 (10.3%) |
| 50 to 54 Years | 1 (0.5%) | 19 (10.3%) |
| 55 to 59 Years | 3 (1.4%) | 0 (0.0%) |
| 60 to 64 Years | 12 (5.7%) | 11 (6.0%) |
| 65 to 69 Years | 19 (9.1%) | 50 (27.2%) |
| 70 to 74 Years | 14 (6.7%) | 11 (6.0%) |
| 75 to 79 Years | 0 (0.0%) | 0 (0.0%) |
| 80 to 84 Years | 4 (1.9%) | 16 (8.7%) |
| 85 Years and over | 0 (0.0%) | 12 (6.5%) |
| Total | 209 (100.0%) | 184 (100.0%) |
Families and Households in Benton
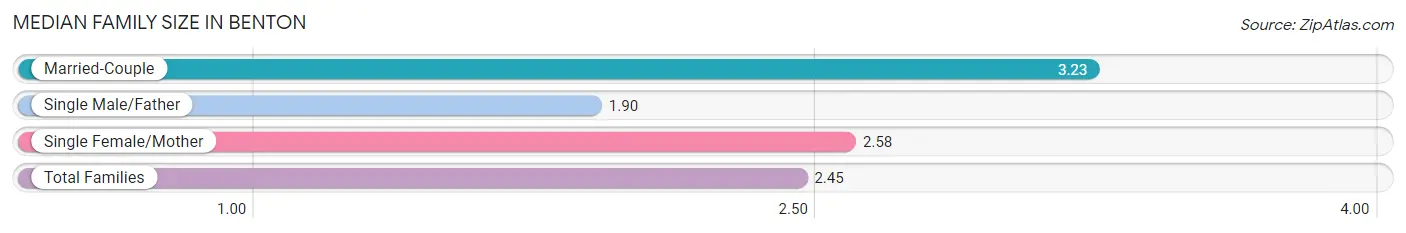
Median Family Size in Benton
The median family size in Benton is 2.45 persons per family, with married-couple families (22 | 15.6%) accounting for the largest median family size of 3.23 persons per family. On the other hand, single male/father families (48 | 34.0%) represent the smallest median family size with 1.90 persons per family.
| Family Type | # Families | Family Size |
| Married-Couple | 22 (15.6%) | 3.23 |
| Single Male/Father | 48 (34.0%) | 1.90 |
| Single Female/Mother | 71 (50.3%) | 2.58 |
| Total Families | 141 (100.0%) | 2.45 |
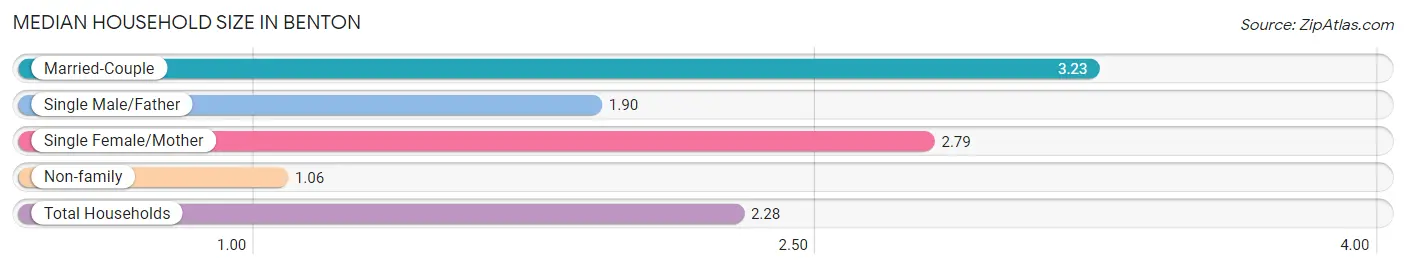
Median Household Size in Benton
The median household size in Benton is 2.28 persons per household, with married-couple households (22 | 12.8%) accounting for the largest median household size of 3.23 persons per household. non-family households (31 | 18.0%) represent the smallest median household size with 1.06 persons per household.
| Household Type | # Households | Household Size |
| Married-Couple | 22 (12.8%) | 3.23 |
| Single Male/Father | 48 (27.9%) | 1.90 |
| Single Female/Mother | 71 (41.3%) | 2.79 |
| Non-family | 31 (18.0%) | 1.06 |
| Total Households | 172 (100.0%) | 2.28 |
Household Size by Marriage Status in Benton
Out of a total of 172 households in Benton, 141 (82.0%) are family households, while 31 (18.0%) are nonfamily households. The most numerous type of family households are 2-person households, comprising 97, and the most common type of nonfamily households are 1-person households, comprising 30.
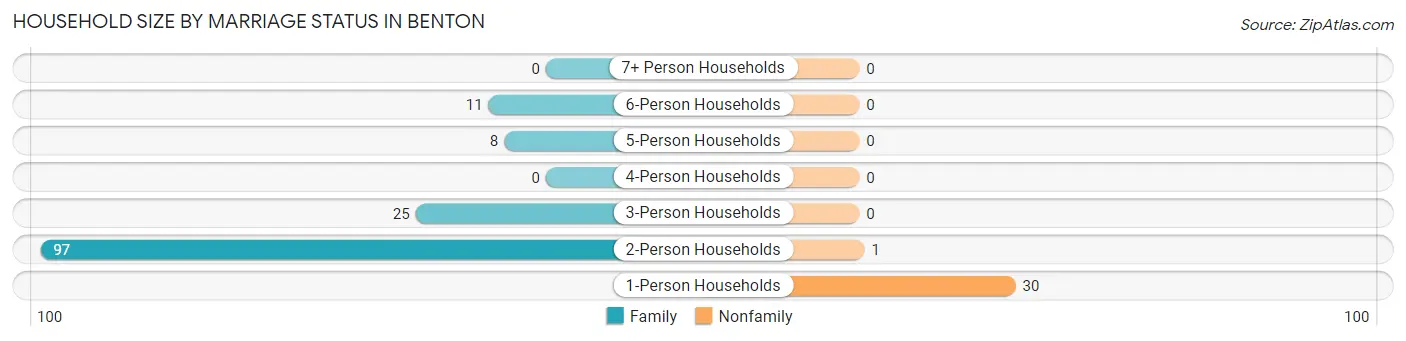
| Household Size | Family Households | Nonfamily Households |
| 1-Person Households | - | 30 (17.4%) |
| 2-Person Households | 97 (56.4%) | 1 (0.6%) |
| 3-Person Households | 25 (14.5%) | 0 (0.0%) |
| 4-Person Households | 0 (0.0%) | 0 (0.0%) |
| 5-Person Households | 8 (4.6%) | 0 (0.0%) |
| 6-Person Households | 11 (6.4%) | 0 (0.0%) |
| 7+ Person Households | 0 (0.0%) | 0 (0.0%) |
| Total | 141 (82.0%) | 31 (18.0%) |
Female Fertility in Benton
Fertility by Age in Benton
| Age Bracket | Women with Births | Births / 1,000 Women |
| 15 to 19 years | 0 (0.0%) | 0.0 |
| 20 to 34 years | 0 (0.0%) | 0.0 |
| 35 to 50 years | 0 (0.0%) | 0.0 |
| Total | 0 (0.0%) | 0.0 |
Fertility by Age by Marriage Status in Benton
| Age Bracket | Married | Unmarried |
| 15 to 19 years | 0 (0.0%) | 0 (0.0%) |
| 20 to 34 years | 0 (0.0%) | 0 (0.0%) |
| 35 to 50 years | 0 (0.0%) | 0 (0.0%) |
| Total | 0 (0.0%) | 0 (0.0%) |
Fertility by Education in Benton
| Educational Attainment | Women with Births | Births / 1,000 Women |
| Less than High School | 0 (0.0%) | 0.0 |
| High School Diploma | 0 (0.0%) | 0.0 |
| College or Associate's Degree | 0 (0.0%) | 0.0 |
| Bachelor's Degree | 0 (0.0%) | 0.0 |
| Graduate Degree | 0 (0.0%) | 0.0 |
| Total | 0 (0.0%) | 0.0 |
Fertility by Education by Marriage Status in Benton
| Educational Attainment | Married | Unmarried |
| Less than High School | 0 (0.0%) | 0 (0.0%) |
| High School Diploma | 0 (0.0%) | 0 (0.0%) |
| College or Associate's Degree | 0 (0.0%) | 0 (0.0%) |
| Bachelor's Degree | 0 (0.0%) | 0 (0.0%) |
| Graduate Degree | 0 (0.0%) | 0 (0.0%) |
| Total | 0 (0.0%) | 0 (0.0%) |
Employment Characteristics in Benton
Employment by Class of Employer in Benton
Among the 146 employed individuals in Benton, private company employees (78 | 53.4%), local government employees (27 | 18.5%), and not-for-profit organizations (14 | 9.6%) make up the most common classes of employment.
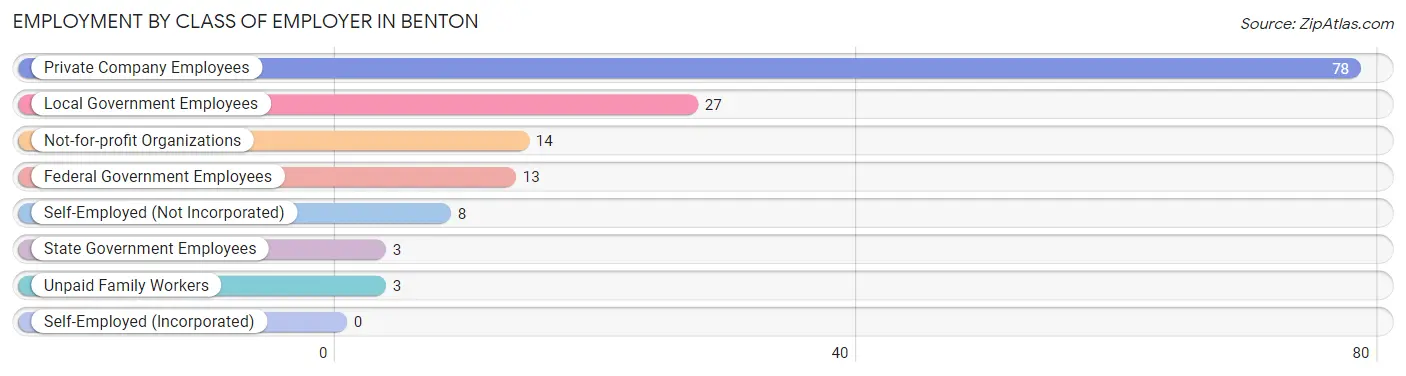
| Employer Class | # Employees | % Employees |
| Private Company Employees | 78 | 53.4% |
| Self-Employed (Incorporated) | 0 | 0.0% |
| Self-Employed (Not Incorporated) | 8 | 5.5% |
| Not-for-profit Organizations | 14 | 9.6% |
| Local Government Employees | 27 | 18.5% |
| State Government Employees | 3 | 2.1% |
| Federal Government Employees | 13 | 8.9% |
| Unpaid Family Workers | 3 | 2.1% |
| Total | 146 | 100.0% |
Employment Status by Age in Benton
According to the labor force statistics for Benton, out of the total population over 16 years of age (337), 46.9% or 158 individuals are in the labor force, with 1.3% or 2 of them unemployed. The age group with the highest labor force participation rate is 35 to 44 years, with 100.0% or 42 individuals in the labor force. Within the labor force, the 45 to 54 years age range has the highest percentage of unemployed individuals, with 4.9% or 2 of them being unemployed.
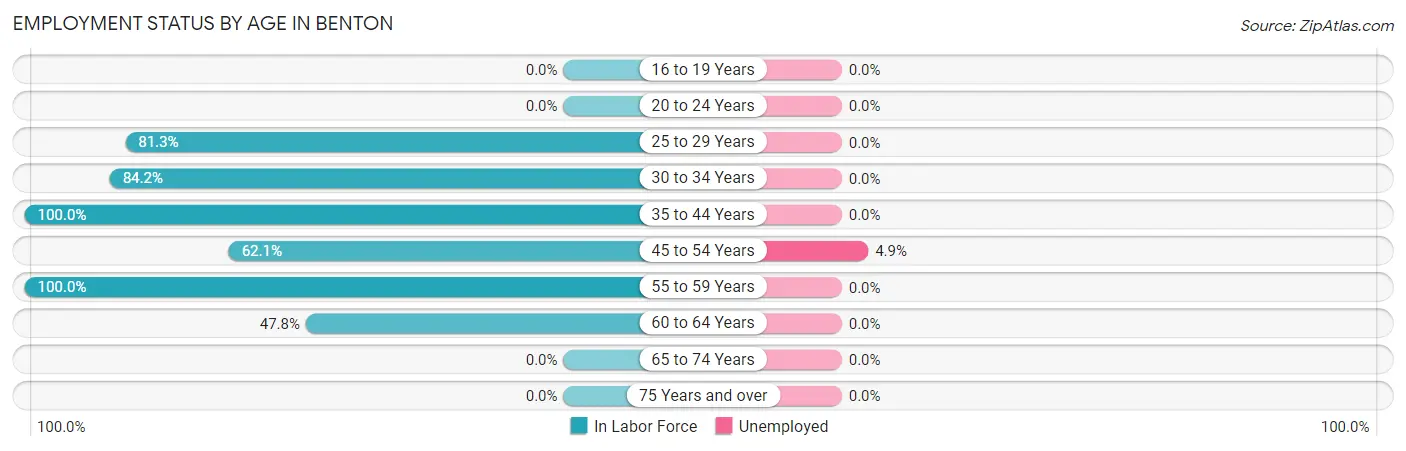
| Age Bracket | In Labor Force | Unemployed |
| 16 to 19 Years | 0 (0.0%) | 0 (0.0%) |
| 20 to 24 Years | 0 (0.0%) | 0 (0.0%) |
| 25 to 29 Years | 13 (81.3%) | 0 (0.0%) |
| 30 to 34 Years | 48 (84.2%) | 0 (0.0%) |
| 35 to 44 Years | 42 (100.0%) | 0 (0.0%) |
| 45 to 54 Years | 41 (62.1%) | 2 (4.9%) |
| 55 to 59 Years | 3 (100.0%) | 0 (0.0%) |
| 60 to 64 Years | 11 (47.8%) | 0 (0.0%) |
| 65 to 74 Years | 0 (0.0%) | 0 (0.0%) |
| 75 Years and over | 0 (0.0%) | 0 (0.0%) |
| Total | 158 (46.9%) | 2 (1.3%) |
Employment Status by Educational Attainment in Benton
According to labor force statistics for Benton, 76.3% of individuals (158) out of the total population between 25 and 64 years of age (207) are in the labor force, with 1.3% or 2 of them being unemployed. The group with the highest labor force participation rate are those with the educational attainment of college / associate degree, with 93.8% or 105 individuals in the labor force. Within the labor force, individuals with college / associate degree education have the highest percentage of unemployment, with 1.9% or 2 of them being unemployed.
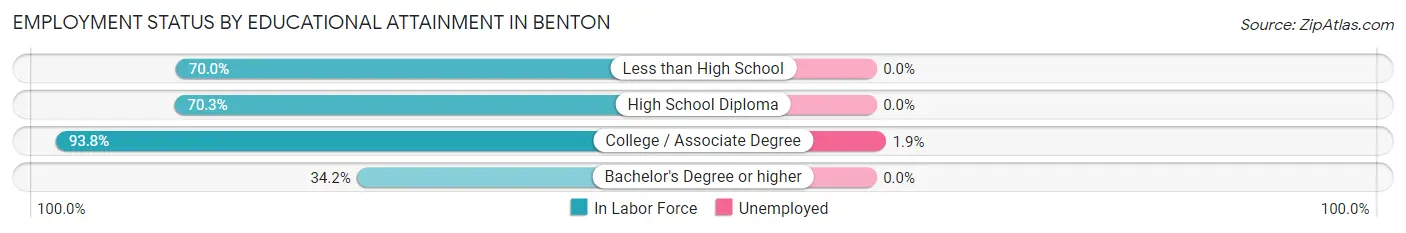
| Educational Attainment | In Labor Force | Unemployed |
| Less than High School | 14 (70.0%) | 0 (0.0%) |
| High School Diploma | 26 (70.3%) | 0 (0.0%) |
| College / Associate Degree | 105 (93.8%) | 2 (1.9%) |
| Bachelor's Degree or higher | 13 (34.2%) | 0 (0.0%) |
| Total | 158 (76.3%) | 3 (1.3%) |
Employment Occupations by Sex in Benton
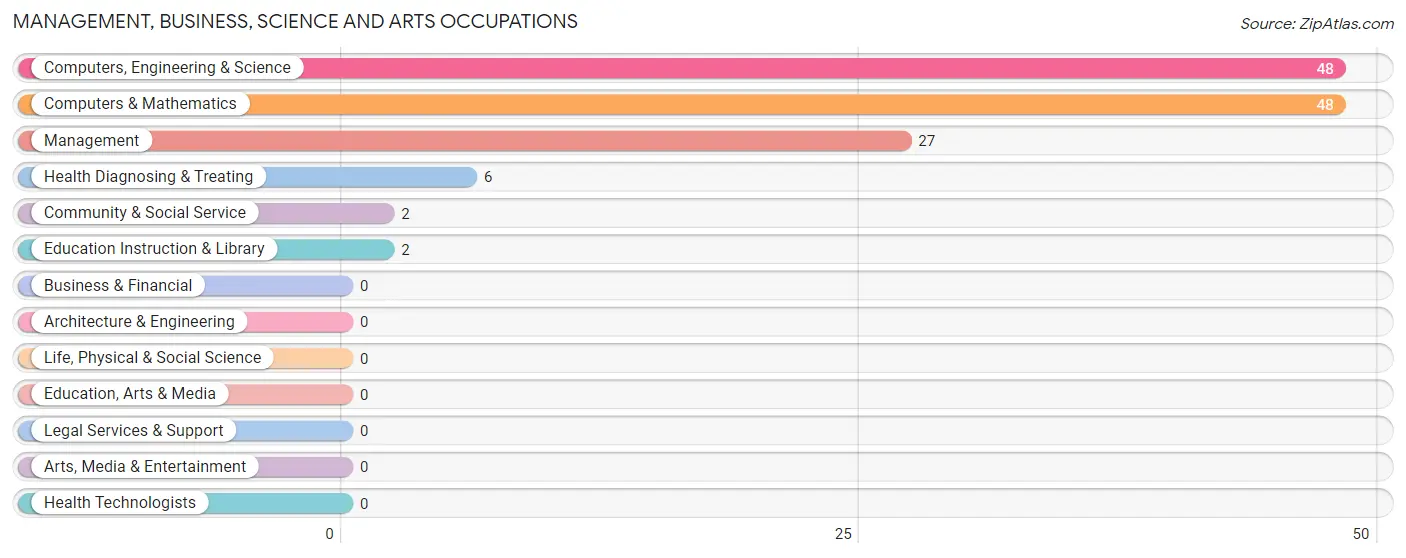
Management, Business, Science and Arts Occupations
The most common Management, Business, Science and Arts occupations in Benton are Computers, Engineering & Science (48 | 30.8%), Computers & Mathematics (48 | 30.8%), Management (27 | 17.3%), Health Diagnosing & Treating (6 | 3.8%), and Community & Social Service (2 | 1.3%).
Management, Business, Science and Arts Occupations by Sex
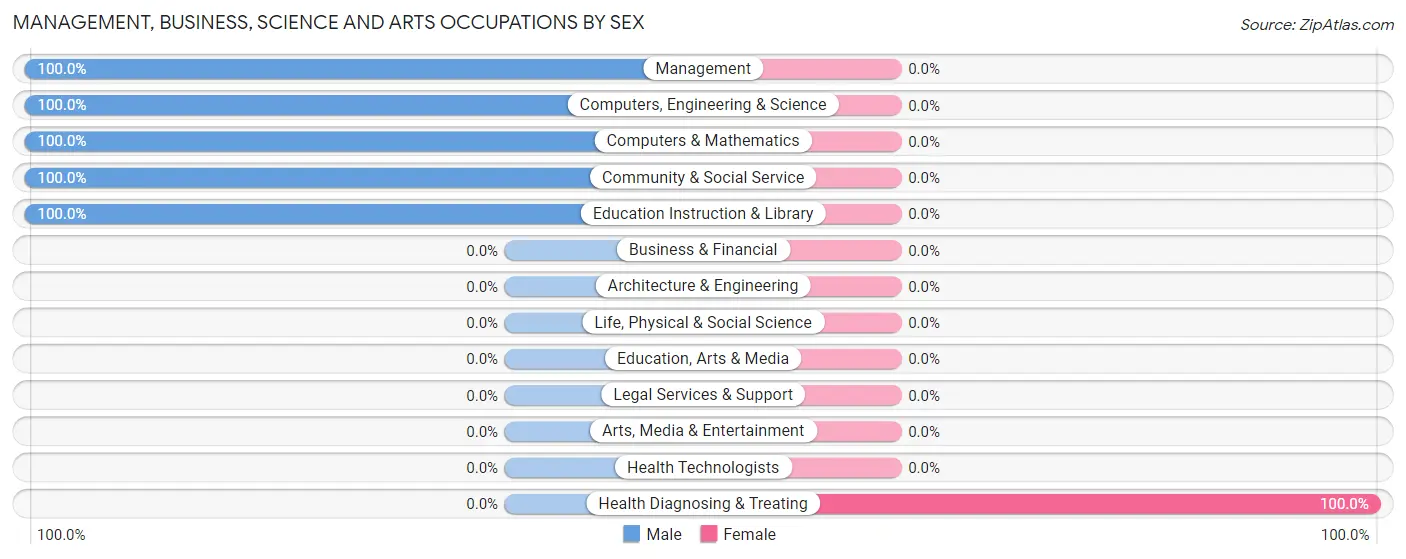
| Occupation | Male | Female |
| Management | 27 (100.0%) | 0 (0.0%) |
| Business & Financial | 0 (0.0%) | 0 (0.0%) |
| Computers, Engineering & Science | 48 (100.0%) | 0 (0.0%) |
| Computers & Mathematics | 48 (100.0%) | 0 (0.0%) |
| Architecture & Engineering | 0 (0.0%) | 0 (0.0%) |
| Life, Physical & Social Science | 0 (0.0%) | 0 (0.0%) |
| Community & Social Service | 2 (100.0%) | 0 (0.0%) |
| Education, Arts & Media | 0 (0.0%) | 0 (0.0%) |
| Legal Services & Support | 0 (0.0%) | 0 (0.0%) |
| Education Instruction & Library | 2 (100.0%) | 0 (0.0%) |
| Arts, Media & Entertainment | 0 (0.0%) | 0 (0.0%) |
| Health Diagnosing & Treating | 0 (0.0%) | 6 (100.0%) |
| Health Technologists | 0 (0.0%) | 0 (0.0%) |
| Total (Category) | 77 (92.8%) | 6 (7.2%) |
| Total (Overall) | 84 (53.8%) | 72 (46.2%) |
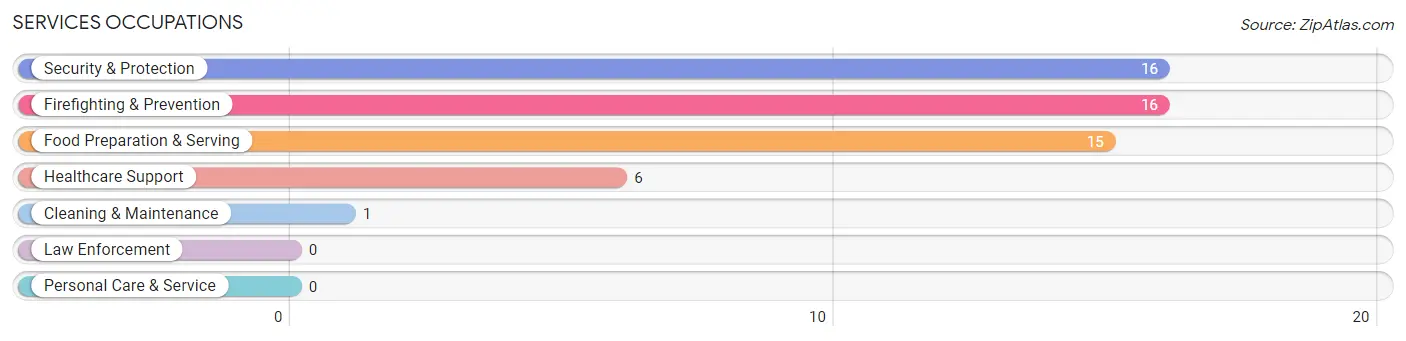
Services Occupations
The most common Services occupations in Benton are Security & Protection (16 | 10.3%), Firefighting & Prevention (16 | 10.3%), Food Preparation & Serving (15 | 9.6%), Healthcare Support (6 | 3.8%), and Cleaning & Maintenance (1 | 0.6%).
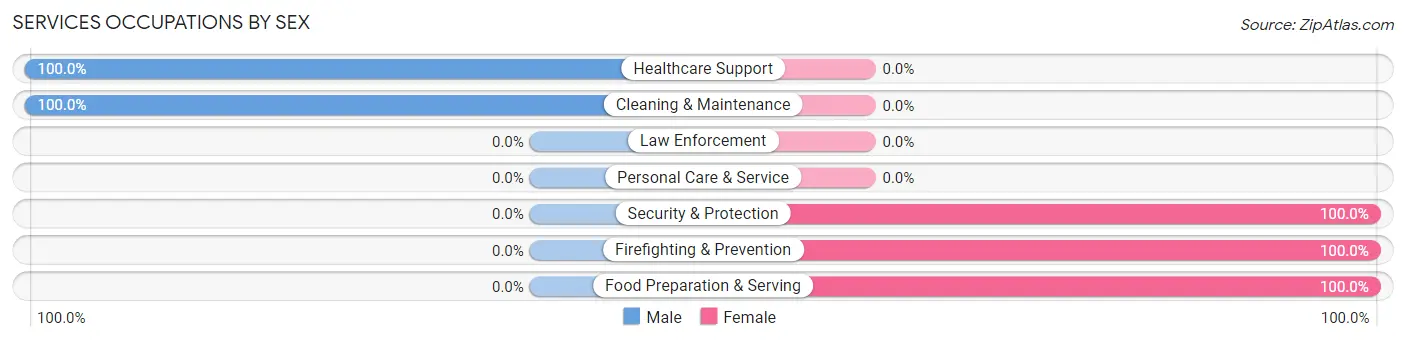
Services Occupations by Sex
Within the Services occupations in Benton, the most male-oriented occupations are Healthcare Support (100.0%), and Cleaning & Maintenance (100.0%), while the most female-oriented occupations are Security & Protection (100.0%), Firefighting & Prevention (100.0%), and Food Preparation & Serving (100.0%).
| Occupation | Male | Female |
| Healthcare Support | 6 (100.0%) | 0 (0.0%) |
| Security & Protection | 0 (0.0%) | 16 (100.0%) |
| Firefighting & Prevention | 0 (0.0%) | 16 (100.0%) |
| Law Enforcement | 0 (0.0%) | 0 (0.0%) |
| Food Preparation & Serving | 0 (0.0%) | 15 (100.0%) |
| Cleaning & Maintenance | 1 (100.0%) | 0 (0.0%) |
| Personal Care & Service | 0 (0.0%) | 0 (0.0%) |
| Total (Category) | 7 (18.4%) | 31 (81.6%) |
| Total (Overall) | 84 (53.8%) | 72 (46.2%) |
Sales and Office Occupations
The most common Sales and Office occupations in Benton are Office & Administration (18 | 11.5%), and Sales & Related (13 | 8.3%).
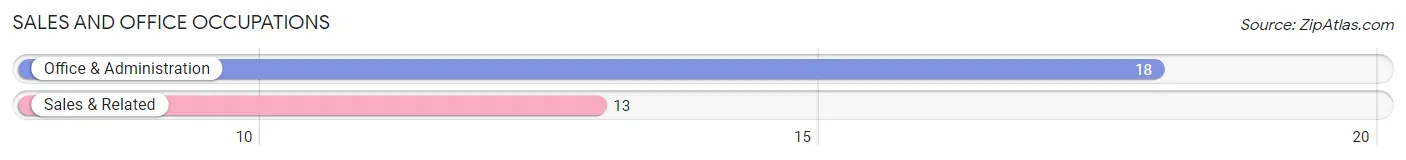
Sales and Office Occupations by Sex
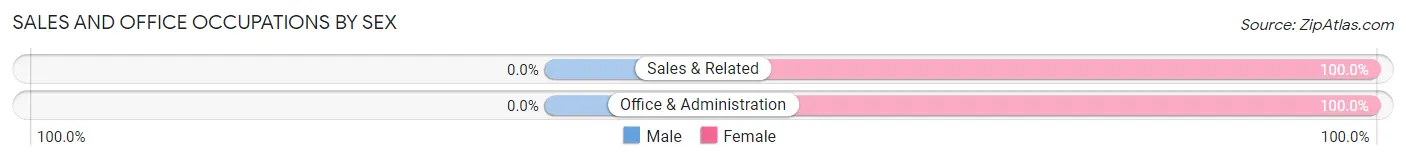
| Occupation | Male | Female |
| Sales & Related | 0 (0.0%) | 13 (100.0%) |
| Office & Administration | 0 (0.0%) | 18 (100.0%) |
| Total (Category) | 0 (0.0%) | 31 (100.0%) |
| Total (Overall) | 84 (53.8%) | 72 (46.2%) |
Natural Resources, Construction and Maintenance Occupations
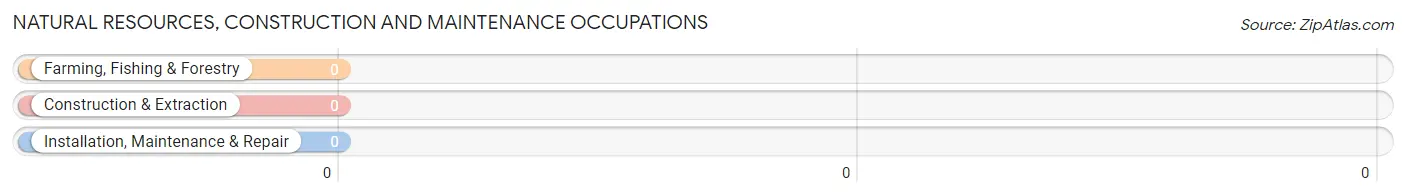
Natural Resources, Construction and Maintenance Occupations by Sex
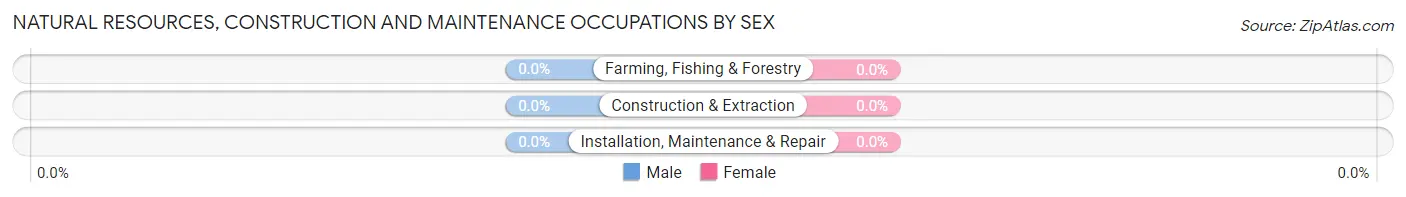
| Occupation | Male | Female |
| Farming, Fishing & Forestry | 0 (0.0%) | 0 (0.0%) |
| Construction & Extraction | 0 (0.0%) | 0 (0.0%) |
| Installation, Maintenance & Repair | 0 (0.0%) | 0 (0.0%) |
| Total (Category) | 0 (0.0%) | 0 (0.0%) |
| Total (Overall) | 84 (53.8%) | 72 (46.2%) |
Production, Transportation and Moving Occupations
The most common Production, Transportation and Moving occupations in Benton are , and Transportation (4 | 2.6%).
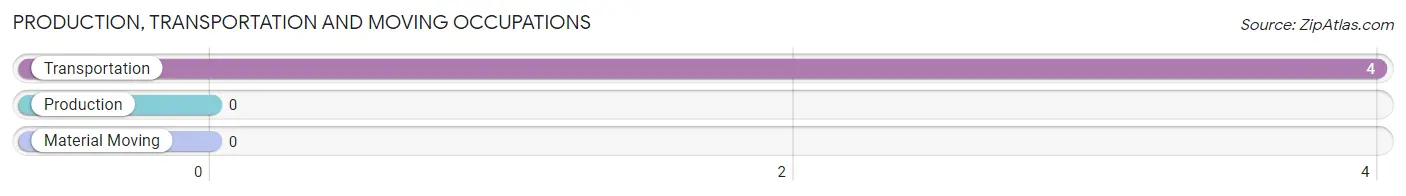
Production, Transportation and Moving Occupations by Sex
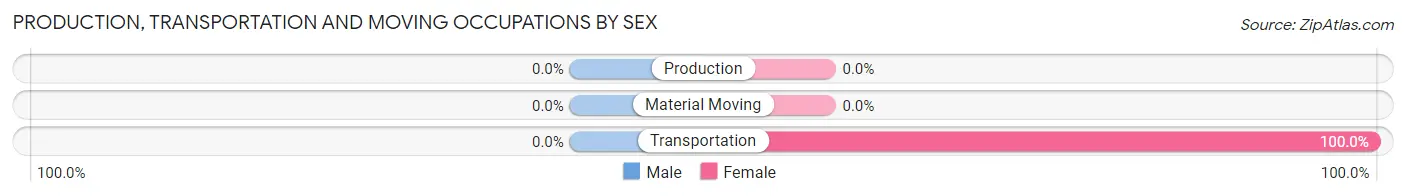
| Occupation | Male | Female |
| Production | 0 (0.0%) | 0 (0.0%) |
| Transportation | 0 (0.0%) | 4 (100.0%) |
| Material Moving | 0 (0.0%) | 0 (0.0%) |
| Total (Category) | 0 (0.0%) | 4 (100.0%) |
| Total (Overall) | 84 (53.8%) | 72 (46.2%) |
Employment Industries by Sex in Benton
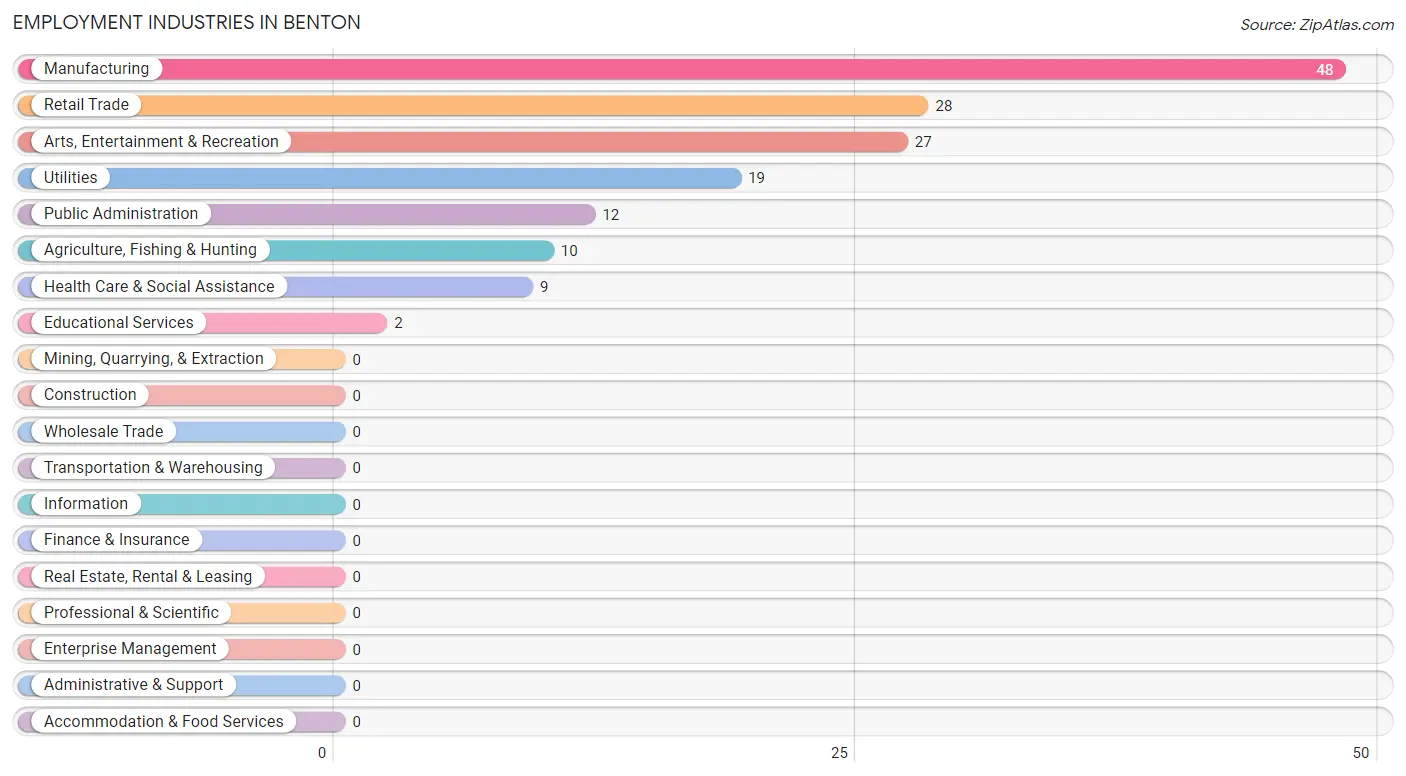
Employment Industries in Benton
The major employment industries in Benton include Manufacturing (48 | 30.8%), Retail Trade (28 | 17.9%), Arts, Entertainment & Recreation (27 | 17.3%), Utilities (19 | 12.2%), and Public Administration (12 | 7.7%).
Employment Industries by Sex in Benton
The Benton industries that see more men than women are Manufacturing (100.0%), Utilities (100.0%), and Educational Services (100.0%), whereas the industries that tend to have a higher number of women are Retail Trade (100.0%), Arts, Entertainment & Recreation (100.0%), and Public Administration (75.0%).
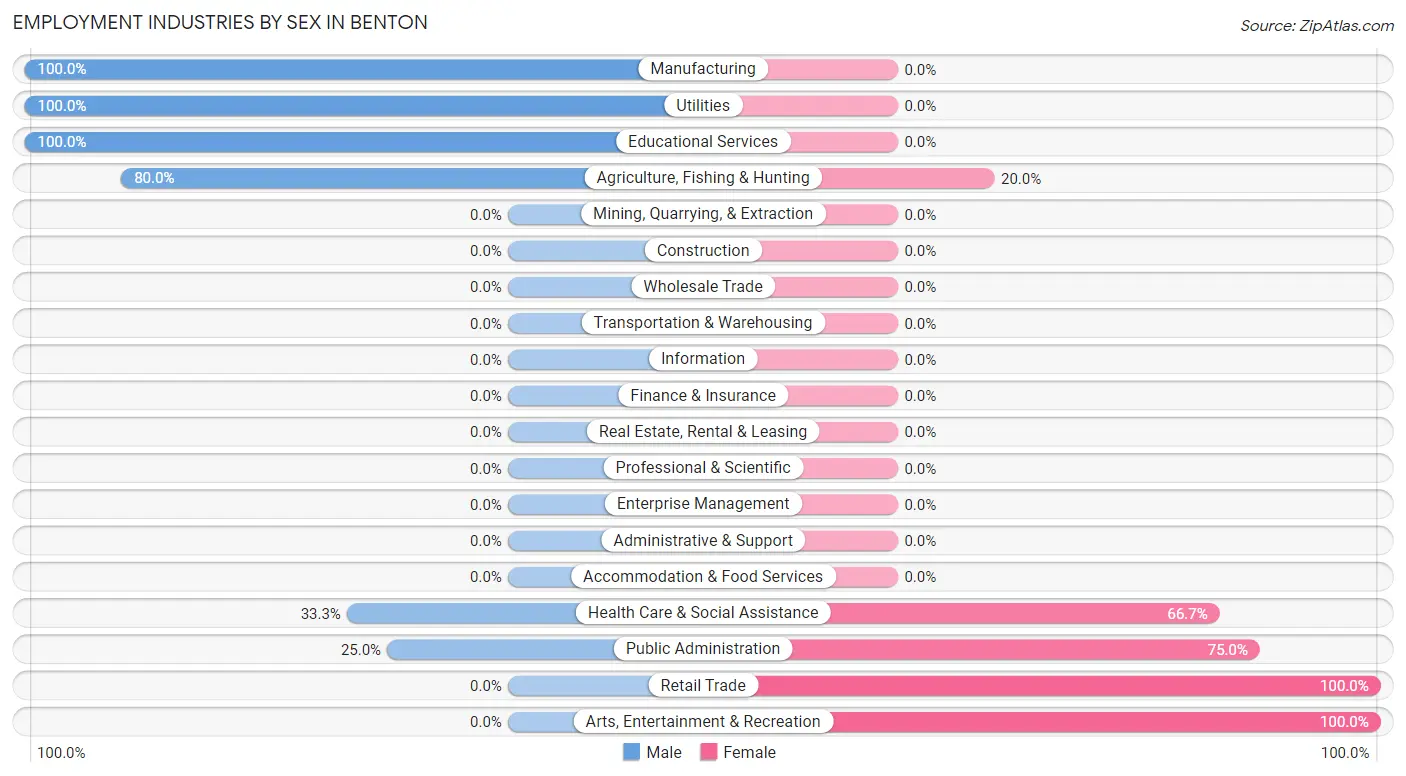
| Industry | Male | Female |
| Agriculture, Fishing & Hunting | 8 (80.0%) | 2 (20.0%) |
| Mining, Quarrying, & Extraction | 0 (0.0%) | 0 (0.0%) |
| Construction | 0 (0.0%) | 0 (0.0%) |
| Manufacturing | 48 (100.0%) | 0 (0.0%) |
| Wholesale Trade | 0 (0.0%) | 0 (0.0%) |
| Retail Trade | 0 (0.0%) | 28 (100.0%) |
| Transportation & Warehousing | 0 (0.0%) | 0 (0.0%) |
| Utilities | 19 (100.0%) | 0 (0.0%) |
| Information | 0 (0.0%) | 0 (0.0%) |
| Finance & Insurance | 0 (0.0%) | 0 (0.0%) |
| Real Estate, Rental & Leasing | 0 (0.0%) | 0 (0.0%) |
| Professional & Scientific | 0 (0.0%) | 0 (0.0%) |
| Enterprise Management | 0 (0.0%) | 0 (0.0%) |
| Administrative & Support | 0 (0.0%) | 0 (0.0%) |
| Educational Services | 2 (100.0%) | 0 (0.0%) |
| Health Care & Social Assistance | 3 (33.3%) | 6 (66.7%) |
| Arts, Entertainment & Recreation | 0 (0.0%) | 27 (100.0%) |
| Accommodation & Food Services | 0 (0.0%) | 0 (0.0%) |
| Public Administration | 3 (25.0%) | 9 (75.0%) |
| Total | 84 (53.8%) | 72 (46.2%) |
Education in Benton
School Enrollment in Benton
The most common levels of schooling among the 24 students in Benton are elementary school (15 | 62.5%), high school (7 | 29.2%), and middle school (2 | 8.3%).
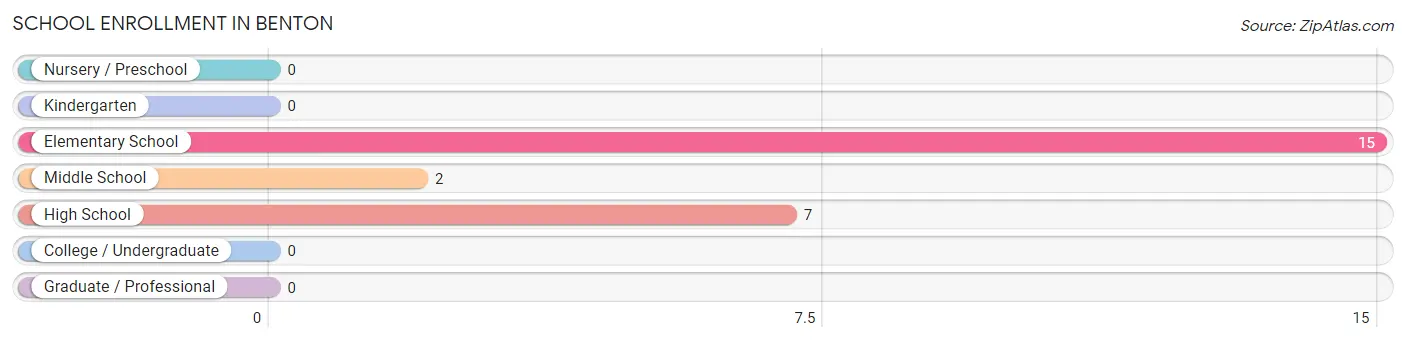
| School Level | # Students | % Students |
| Nursery / Preschool | 0 | 0.0% |
| Kindergarten | 0 | 0.0% |
| Elementary School | 15 | 62.5% |
| Middle School | 2 | 8.3% |
| High School | 7 | 29.2% |
| College / Undergraduate | 0 | 0.0% |
| Graduate / Professional | 0 | 0.0% |
| Total | 24 | 100.0% |
School Enrollment by Age by Funding Source in Benton
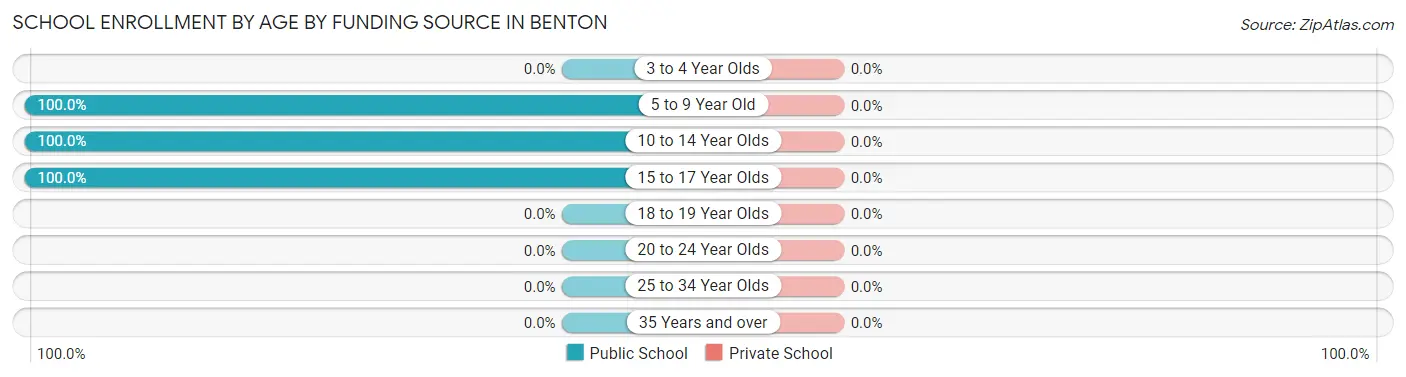
| Age Bracket | Public School | Private School |
| 3 to 4 Year Olds | 0 (0.0%) | 0 (0.0%) |
| 5 to 9 Year Old | 13 (100.0%) | 0 (0.0%) |
| 10 to 14 Year Olds | 7 (100.0%) | 0 (0.0%) |
| 15 to 17 Year Olds | 4 (100.0%) | 0 (0.0%) |
| 18 to 19 Year Olds | 0 (0.0%) | 0 (0.0%) |
| 20 to 24 Year Olds | 0 (0.0%) | 0 (0.0%) |
| 25 to 34 Year Olds | 0 (0.0%) | 0 (0.0%) |
| 35 Years and over | 0 (0.0%) | 0 (0.0%) |
| Total | 24 (100.0%) | 0 (0.0%) |
Educational Attainment by Field of Study in Benton
Social sciences (25 | 51.0%), visual & performing arts (13 | 26.5%), and education (11 | 22.5%) are the most common fields of study among 49 individuals in Benton who have obtained a bachelor's degree or higher.
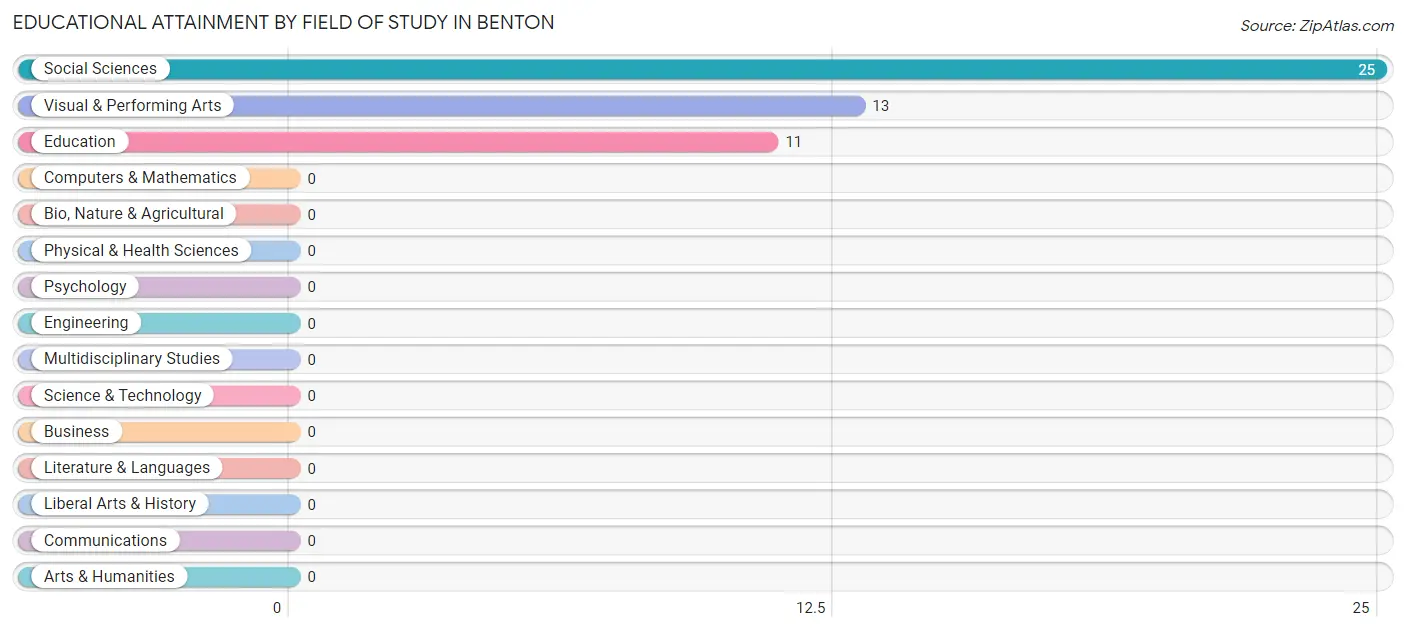
| Field of Study | # Graduates | % Graduates |
| Computers & Mathematics | 0 | 0.0% |
| Bio, Nature & Agricultural | 0 | 0.0% |
| Physical & Health Sciences | 0 | 0.0% |
| Psychology | 0 | 0.0% |
| Social Sciences | 25 | 51.0% |
| Engineering | 0 | 0.0% |
| Multidisciplinary Studies | 0 | 0.0% |
| Science & Technology | 0 | 0.0% |
| Business | 0 | 0.0% |
| Education | 11 | 22.5% |
| Literature & Languages | 0 | 0.0% |
| Liberal Arts & History | 0 | 0.0% |
| Visual & Performing Arts | 13 | 26.5% |
| Communications | 0 | 0.0% |
| Arts & Humanities | 0 | 0.0% |
| Total | 49 | 100.0% |
Transportation & Commute in Benton
Vehicle Availability by Sex in Benton
The most prevalent vehicle ownership categories in Benton are males with 3 vehicles (56, accounting for 66.7%) and females with 3 vehicles (29, making up 90.3%).
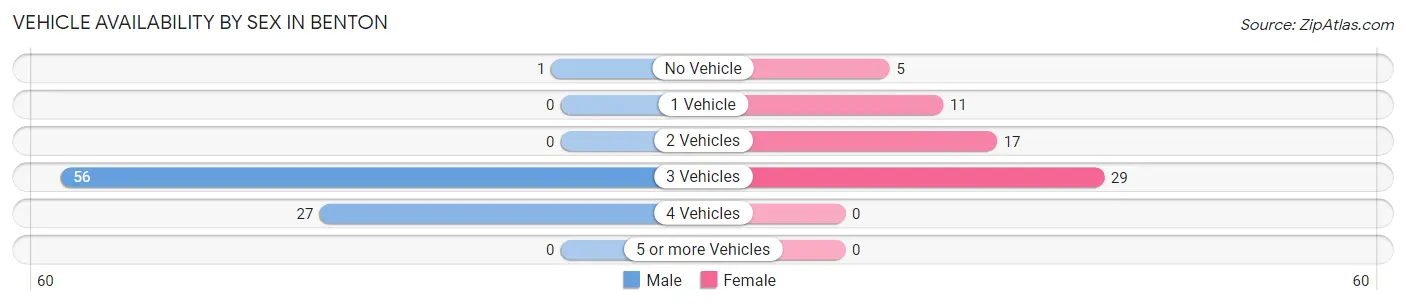
| Vehicles Available | Male | Female |
| No Vehicle | 1 (1.2%) | 5 (8.1%) |
| 1 Vehicle | 0 (0.0%) | 11 (17.7%) |
| 2 Vehicles | 0 (0.0%) | 17 (27.4%) |
| 3 Vehicles | 56 (66.7%) | 29 (46.8%) |
| 4 Vehicles | 27 (32.1%) | 0 (0.0%) |
| 5 or more Vehicles | 0 (0.0%) | 0 (0.0%) |
| Total | 84 (100.0%) | 62 (100.0%) |
Commute Time in Benton
The most frequently occuring commute durations in Benton are 35 to 39 minutes (48 commuters, 34.3%), 45 to 59 minutes (29 commuters, 20.7%), and 40 to 44 minutes (27 commuters, 19.3%).
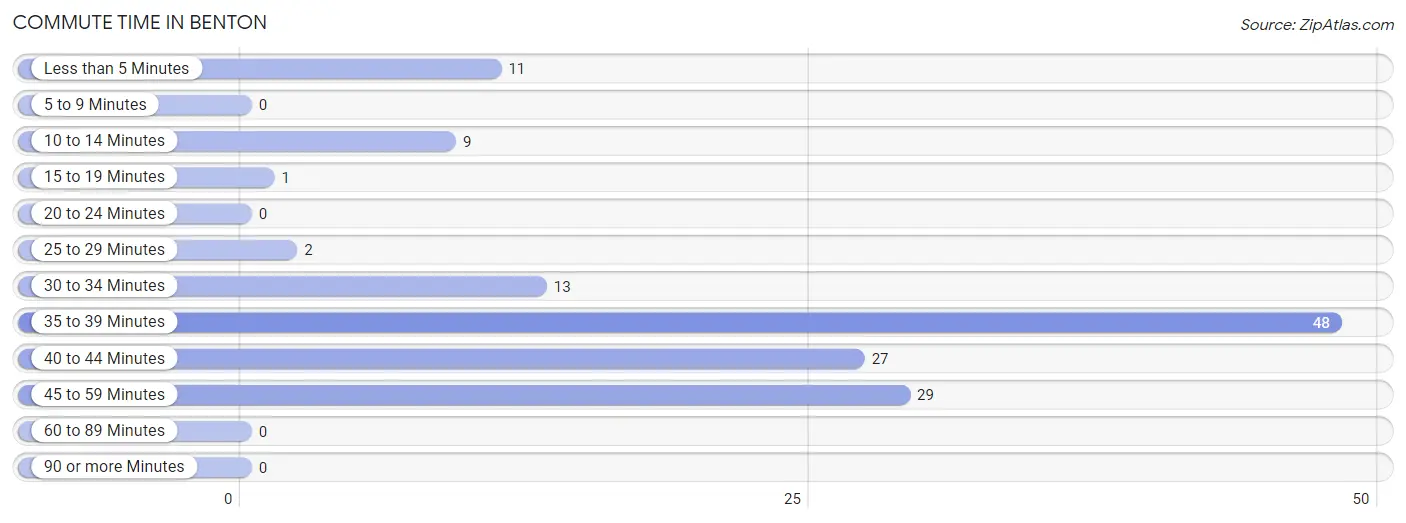
| Commute Time | # Commuters | % Commuters |
| Less than 5 Minutes | 11 | 7.9% |
| 5 to 9 Minutes | 0 | 0.0% |
| 10 to 14 Minutes | 9 | 6.4% |
| 15 to 19 Minutes | 1 | 0.7% |
| 20 to 24 Minutes | 0 | 0.0% |
| 25 to 29 Minutes | 2 | 1.4% |
| 30 to 34 Minutes | 13 | 9.3% |
| 35 to 39 Minutes | 48 | 34.3% |
| 40 to 44 Minutes | 27 | 19.3% |
| 45 to 59 Minutes | 29 | 20.7% |
| 60 to 89 Minutes | 0 | 0.0% |
| 90 or more Minutes | 0 | 0.0% |
Commute Time by Sex in Benton
The most common commute times in Benton are 35 to 39 minutes (48 commuters, 61.5%) for males and 45 to 59 minutes (27 commuters, 43.5%) for females.
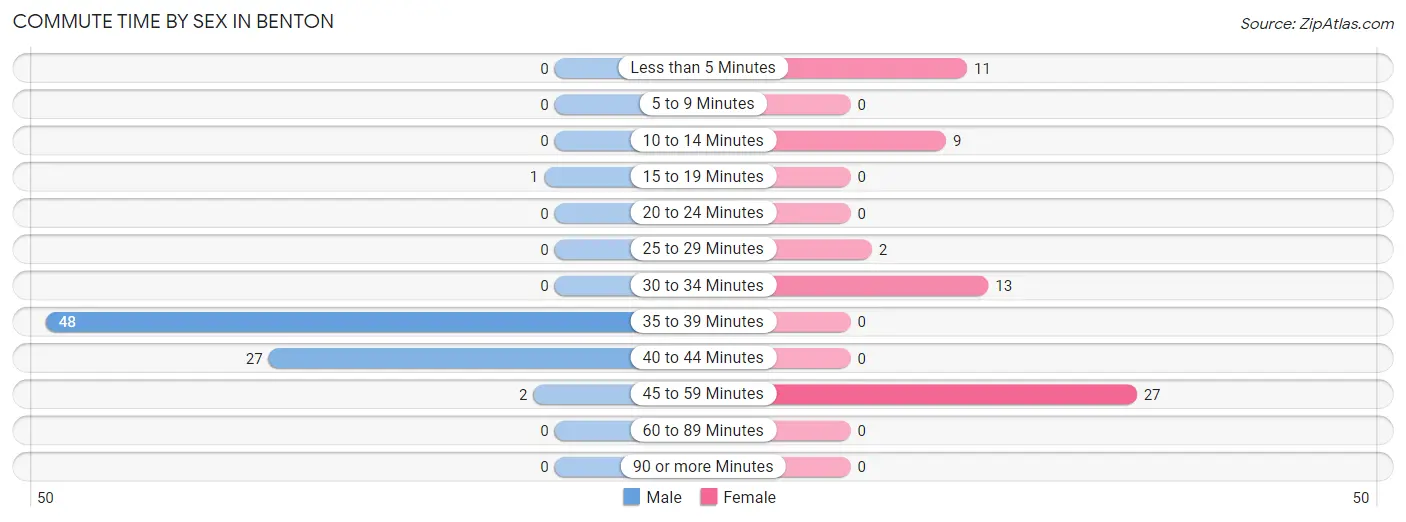
| Commute Time | Male | Female |
| Less than 5 Minutes | 0 (0.0%) | 11 (17.7%) |
| 5 to 9 Minutes | 0 (0.0%) | 0 (0.0%) |
| 10 to 14 Minutes | 0 (0.0%) | 9 (14.5%) |
| 15 to 19 Minutes | 1 (1.3%) | 0 (0.0%) |
| 20 to 24 Minutes | 0 (0.0%) | 0 (0.0%) |
| 25 to 29 Minutes | 0 (0.0%) | 2 (3.2%) |
| 30 to 34 Minutes | 0 (0.0%) | 13 (21.0%) |
| 35 to 39 Minutes | 48 (61.5%) | 0 (0.0%) |
| 40 to 44 Minutes | 27 (34.6%) | 0 (0.0%) |
| 45 to 59 Minutes | 2 (2.6%) | 27 (43.5%) |
| 60 to 89 Minutes | 0 (0.0%) | 0 (0.0%) |
| 90 or more Minutes | 0 (0.0%) | 0 (0.0%) |
Time of Departure to Work by Sex in Benton
The most frequent times of departure to work in Benton are 8:00 AM to 8:29 AM (50, 64.1%) for males and 7:30 AM to 7:59 AM (22, 35.5%) for females.
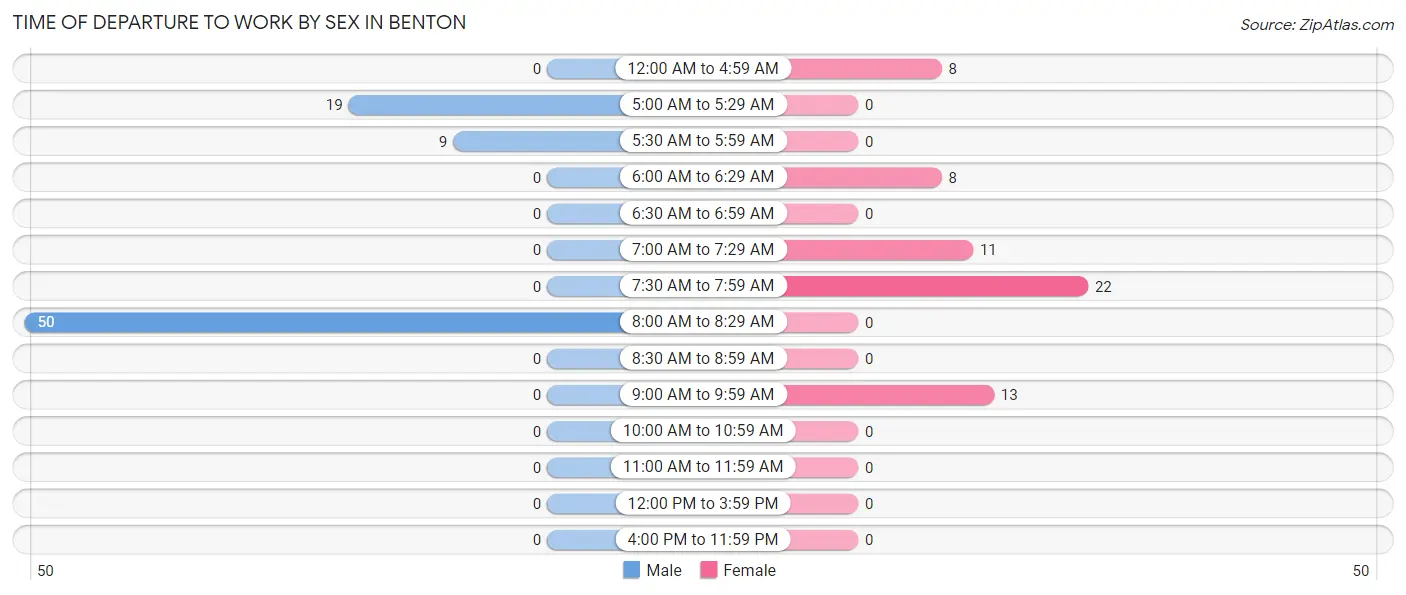
| Time of Departure | Male | Female |
| 12:00 AM to 4:59 AM | 0 (0.0%) | 8 (12.9%) |
| 5:00 AM to 5:29 AM | 19 (24.4%) | 0 (0.0%) |
| 5:30 AM to 5:59 AM | 9 (11.5%) | 0 (0.0%) |
| 6:00 AM to 6:29 AM | 0 (0.0%) | 8 (12.9%) |
| 6:30 AM to 6:59 AM | 0 (0.0%) | 0 (0.0%) |
| 7:00 AM to 7:29 AM | 0 (0.0%) | 11 (17.7%) |
| 7:30 AM to 7:59 AM | 0 (0.0%) | 22 (35.5%) |
| 8:00 AM to 8:29 AM | 50 (64.1%) | 0 (0.0%) |
| 8:30 AM to 8:59 AM | 0 (0.0%) | 0 (0.0%) |
| 9:00 AM to 9:59 AM | 0 (0.0%) | 13 (21.0%) |
| 10:00 AM to 10:59 AM | 0 (0.0%) | 0 (0.0%) |
| 11:00 AM to 11:59 AM | 0 (0.0%) | 0 (0.0%) |
| 12:00 PM to 3:59 PM | 0 (0.0%) | 0 (0.0%) |
| 4:00 PM to 11:59 PM | 0 (0.0%) | 0 (0.0%) |
| Total | 78 (100.0%) | 62 (100.0%) |
Housing Occupancy in Benton
Occupancy by Ownership in Benton
Of the total 172 dwellings in Benton, owner-occupied units account for 139 (80.8%), while renter-occupied units make up 33 (19.2%).
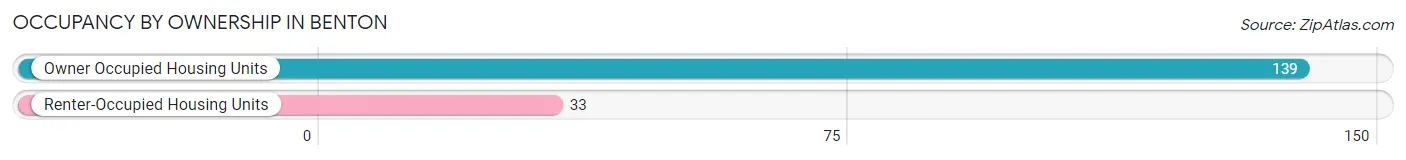
| Occupancy | # Housing Units | % Housing Units |
| Owner Occupied Housing Units | 139 | 80.8% |
| Renter-Occupied Housing Units | 33 | 19.2% |
| Total Occupied Housing Units | 172 | 100.0% |
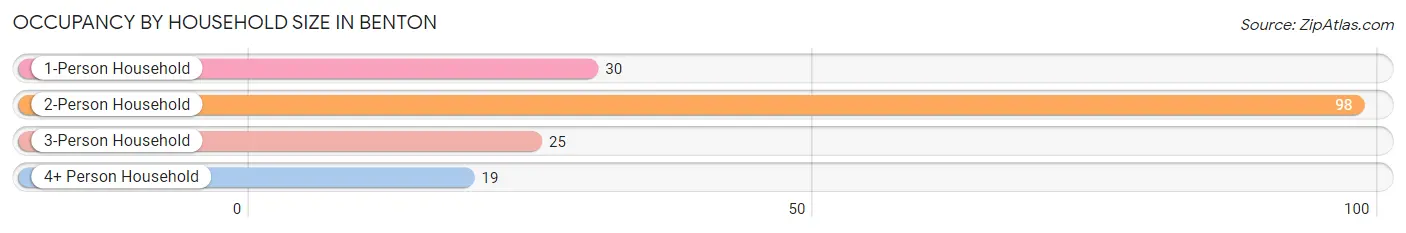
Occupancy by Household Size in Benton
| Household Size | # Housing Units | % Housing Units |
| 1-Person Household | 30 | 17.4% |
| 2-Person Household | 98 | 57.0% |
| 3-Person Household | 25 | 14.5% |
| 4+ Person Household | 19 | 11.1% |
| Total Housing Units | 172 | 100.0% |
Occupancy by Ownership by Household Size in Benton
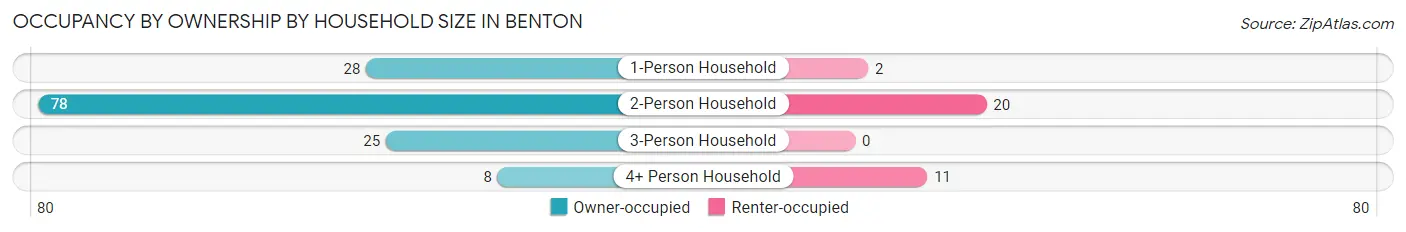
| Household Size | Owner-occupied | Renter-occupied |
| 1-Person Household | 28 (93.3%) | 2 (6.7%) |
| 2-Person Household | 78 (79.6%) | 20 (20.4%) |
| 3-Person Household | 25 (100.0%) | 0 (0.0%) |
| 4+ Person Household | 8 (42.1%) | 11 (57.9%) |
| Total Housing Units | 139 (80.8%) | 33 (19.2%) |
Occupancy by Educational Attainment in Benton
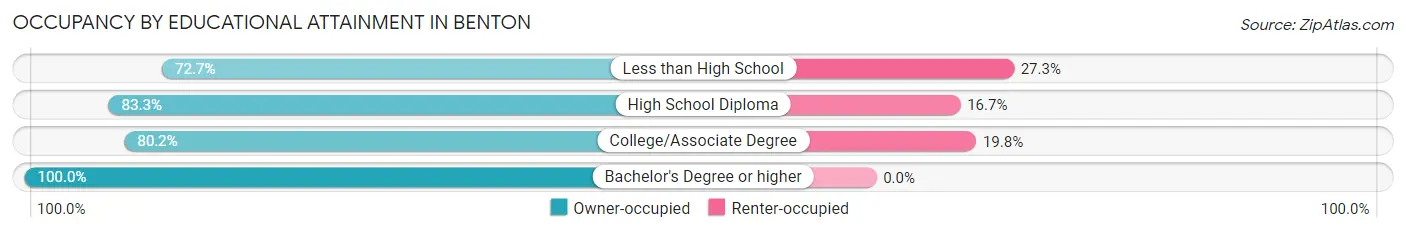
| Household Size | Owner-occupied | Renter-occupied |
| Less than High School | 24 (72.7%) | 9 (27.3%) |
| High School Diploma | 25 (83.3%) | 5 (16.7%) |
| College/Associate Degree | 77 (80.2%) | 19 (19.8%) |
| Bachelor's Degree or higher | 13 (100.0%) | 0 (0.0%) |
Occupancy by Age of Householder in Benton
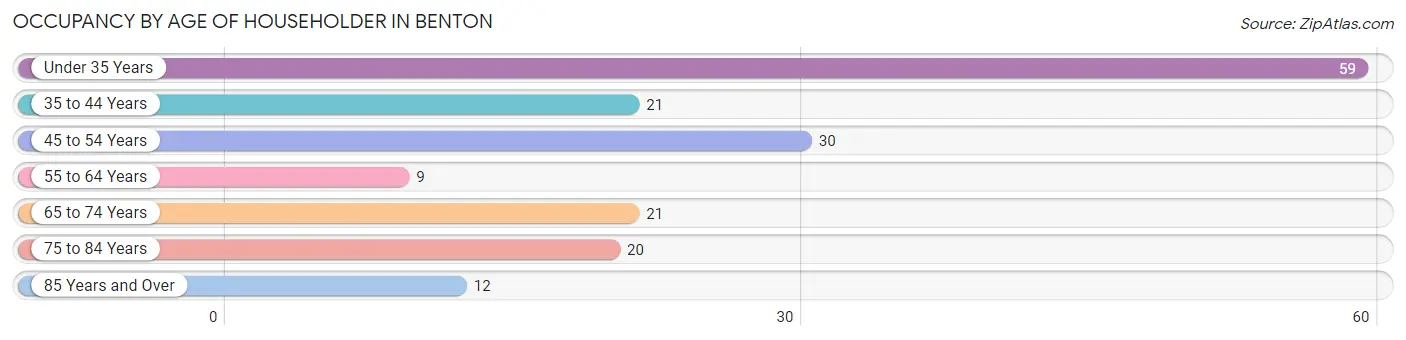
| Age Bracket | # Households | % Households |
| Under 35 Years | 59 | 34.3% |
| 35 to 44 Years | 21 | 12.2% |
| 45 to 54 Years | 30 | 17.4% |
| 55 to 64 Years | 9 | 5.2% |
| 65 to 74 Years | 21 | 12.2% |
| 75 to 84 Years | 20 | 11.6% |
| 85 Years and Over | 12 | 7.0% |
| Total | 172 | 100.0% |
Housing Finances in Benton
Median Income by Occupancy in Benton
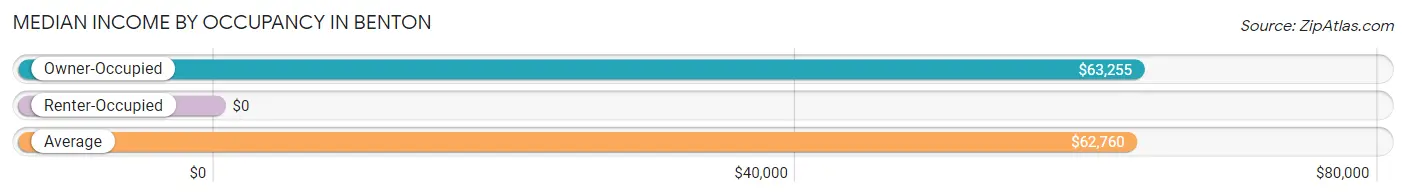
| Occupancy Type | # Households | Median Income |
| Owner-Occupied | 139 (80.8%) | $63,255 |
| Renter-Occupied | 33 (19.2%) | $0 |
| Average | 172 (100.0%) | $62,760 |
Occupancy by Householder Income Bracket in Benton
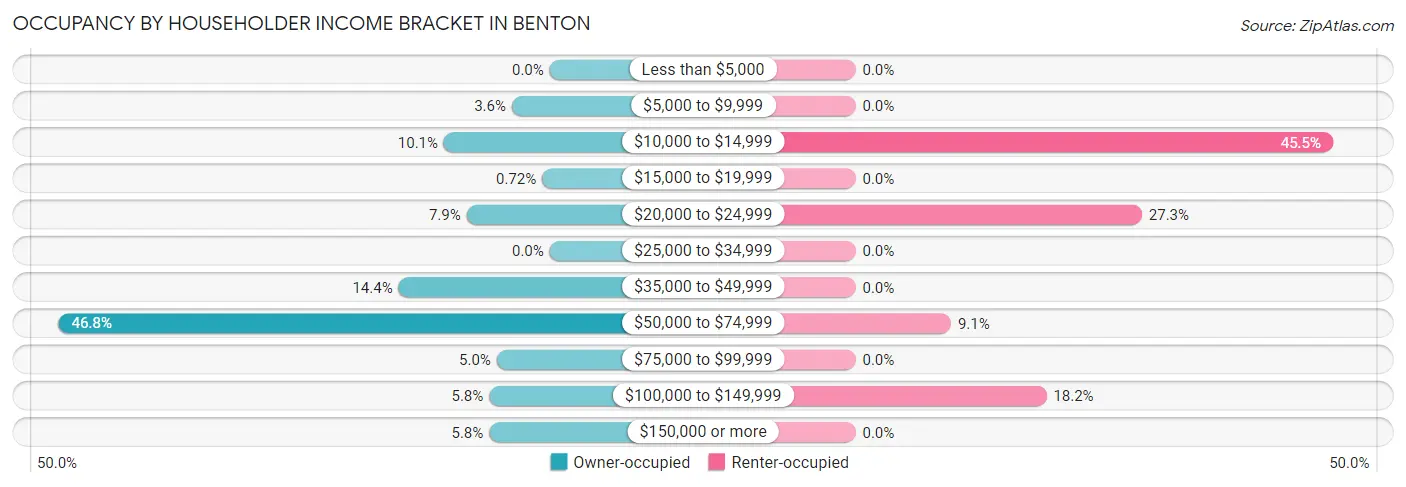
| Income Bracket | Owner-occupied | Renter-occupied |
| Less than $5,000 | 0 (0.0%) | 0 (0.0%) |
| $5,000 to $9,999 | 5 (3.6%) | 0 (0.0%) |
| $10,000 to $14,999 | 14 (10.1%) | 15 (45.5%) |
| $15,000 to $19,999 | 1 (0.7%) | 0 (0.0%) |
| $20,000 to $24,999 | 11 (7.9%) | 9 (27.3%) |
| $25,000 to $34,999 | 0 (0.0%) | 0 (0.0%) |
| $35,000 to $49,999 | 20 (14.4%) | 0 (0.0%) |
| $50,000 to $74,999 | 65 (46.8%) | 3 (9.1%) |
| $75,000 to $99,999 | 7 (5.0%) | 0 (0.0%) |
| $100,000 to $149,999 | 8 (5.8%) | 6 (18.2%) |
| $150,000 or more | 8 (5.8%) | 0 (0.0%) |
| Total | 139 (100.0%) | 33 (100.0%) |
Monthly Housing Cost Tiers in Benton
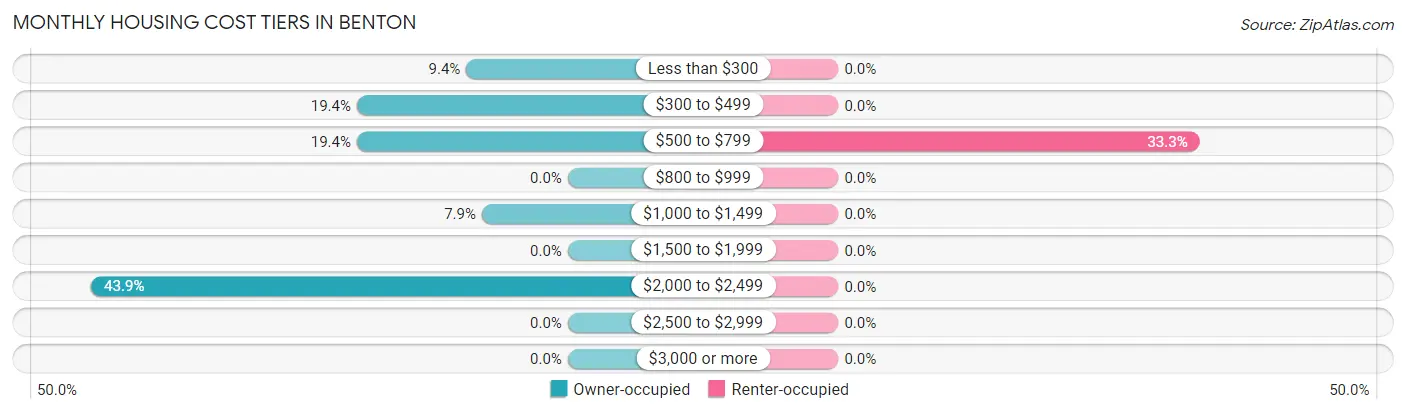
| Monthly Cost | Owner-occupied | Renter-occupied |
| Less than $300 | 13 (9.3%) | 0 (0.0%) |
| $300 to $499 | 27 (19.4%) | 0 (0.0%) |
| $500 to $799 | 27 (19.4%) | 11 (33.3%) |
| $800 to $999 | 0 (0.0%) | 0 (0.0%) |
| $1,000 to $1,499 | 11 (7.9%) | 0 (0.0%) |
| $1,500 to $1,999 | 0 (0.0%) | 0 (0.0%) |
| $2,000 to $2,499 | 61 (43.9%) | 0 (0.0%) |
| $2,500 to $2,999 | 0 (0.0%) | 0 (0.0%) |
| $3,000 or more | 0 (0.0%) | 0 (0.0%) |
| Total | 139 (100.0%) | 33 (100.0%) |
Physical Housing Characteristics in Benton
Housing Structures in Benton
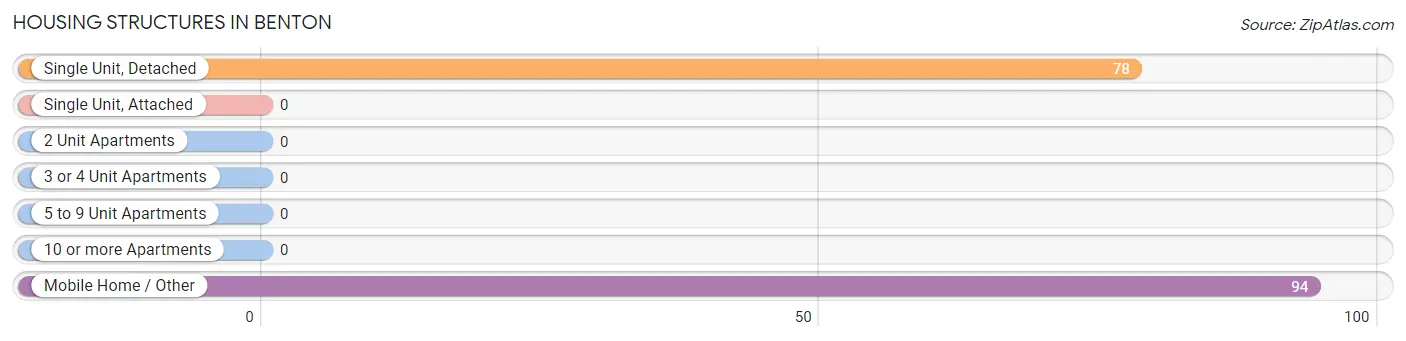
| Structure Type | # Housing Units | % Housing Units |
| Single Unit, Detached | 78 | 45.4% |
| Single Unit, Attached | 0 | 0.0% |
| 2 Unit Apartments | 0 | 0.0% |
| 3 or 4 Unit Apartments | 0 | 0.0% |
| 5 to 9 Unit Apartments | 0 | 0.0% |
| 10 or more Apartments | 0 | 0.0% |
| Mobile Home / Other | 94 | 54.6% |
| Total | 172 | 100.0% |
Housing Structures by Occupancy in Benton
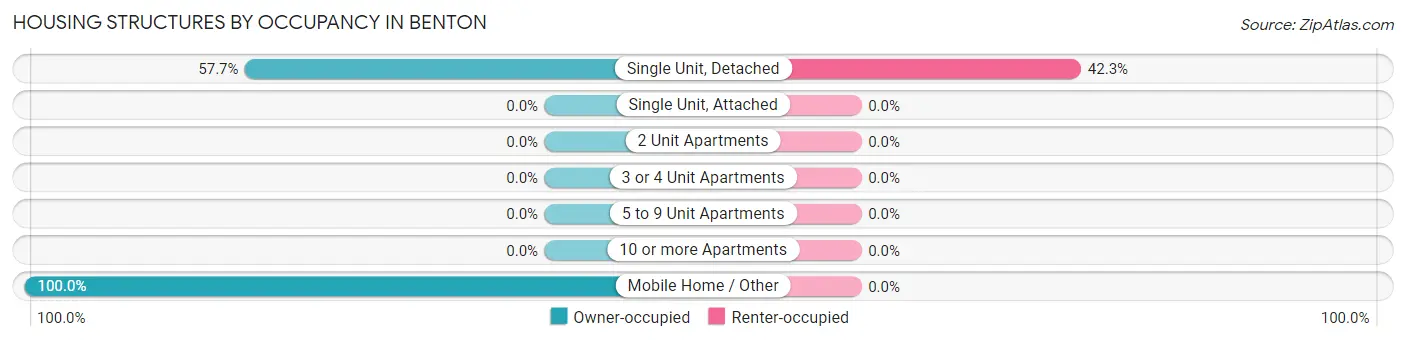
| Structure Type | Owner-occupied | Renter-occupied |
| Single Unit, Detached | 45 (57.7%) | 33 (42.3%) |
| Single Unit, Attached | 0 (0.0%) | 0 (0.0%) |
| 2 Unit Apartments | 0 (0.0%) | 0 (0.0%) |
| 3 or 4 Unit Apartments | 0 (0.0%) | 0 (0.0%) |
| 5 to 9 Unit Apartments | 0 (0.0%) | 0 (0.0%) |
| 10 or more Apartments | 0 (0.0%) | 0 (0.0%) |
| Mobile Home / Other | 94 (100.0%) | 0 (0.0%) |
| Total | 139 (80.8%) | 33 (19.2%) |
Housing Structures by Number of Rooms in Benton
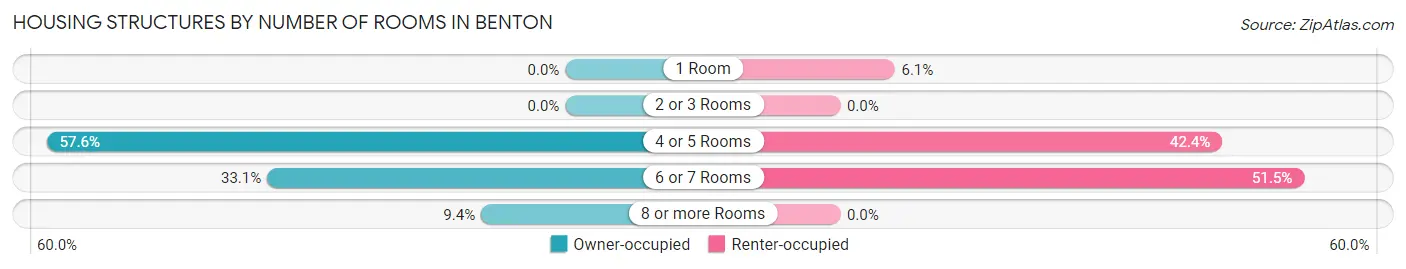
| Number of Rooms | Owner-occupied | Renter-occupied |
| 1 Room | 0 (0.0%) | 2 (6.1%) |
| 2 or 3 Rooms | 0 (0.0%) | 0 (0.0%) |
| 4 or 5 Rooms | 80 (57.6%) | 14 (42.4%) |
| 6 or 7 Rooms | 46 (33.1%) | 17 (51.5%) |
| 8 or more Rooms | 13 (9.3%) | 0 (0.0%) |
| Total | 139 (100.0%) | 33 (100.0%) |
Housing Structure by Heating Type in Benton
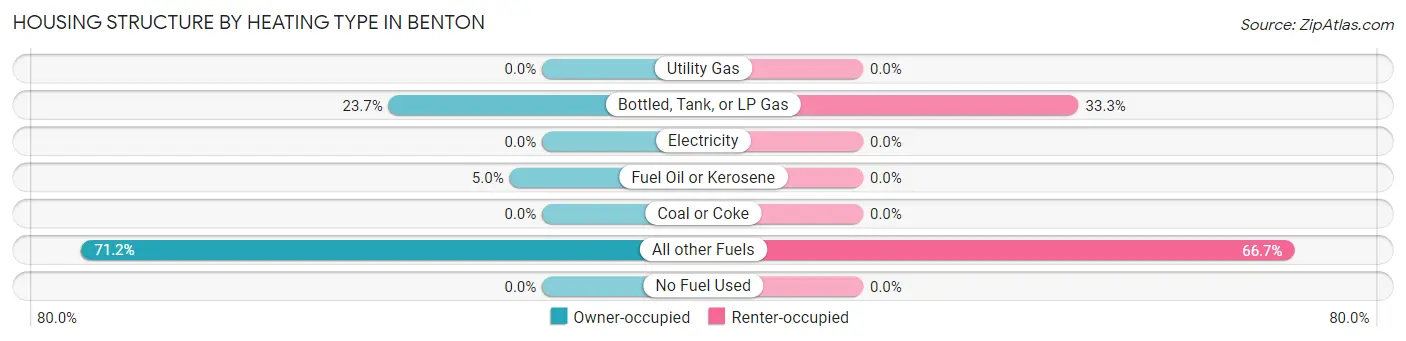
| Heating Type | Owner-occupied | Renter-occupied |
| Utility Gas | 0 (0.0%) | 0 (0.0%) |
| Bottled, Tank, or LP Gas | 33 (23.7%) | 11 (33.3%) |
| Electricity | 0 (0.0%) | 0 (0.0%) |
| Fuel Oil or Kerosene | 7 (5.0%) | 0 (0.0%) |
| Coal or Coke | 0 (0.0%) | 0 (0.0%) |
| All other Fuels | 99 (71.2%) | 22 (66.7%) |
| No Fuel Used | 0 (0.0%) | 0 (0.0%) |
| Total | 139 (100.0%) | 33 (100.0%) |
Household Vehicle Usage in Benton
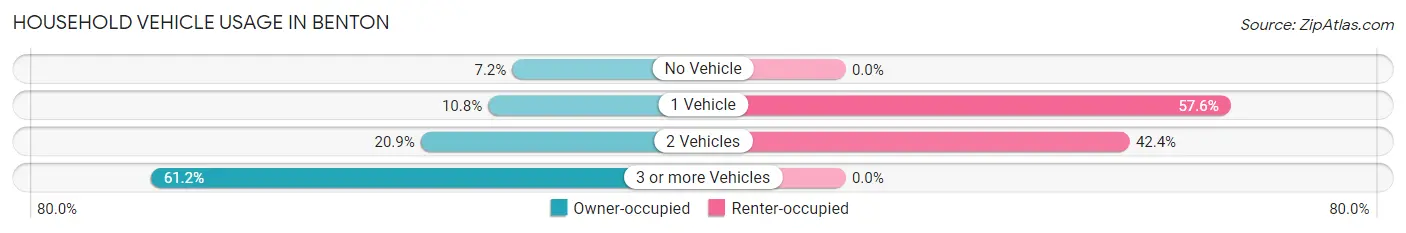
| Vehicles per Household | Owner-occupied | Renter-occupied |
| No Vehicle | 10 (7.2%) | 0 (0.0%) |
| 1 Vehicle | 15 (10.8%) | 19 (57.6%) |
| 2 Vehicles | 29 (20.9%) | 14 (42.4%) |
| 3 or more Vehicles | 85 (61.2%) | 0 (0.0%) |
| Total | 139 (100.0%) | 33 (100.0%) |
Real Estate & Mortgages in Benton
Real Estate and Mortgage Overview in Benton
| Characteristic | Without Mortgage | With Mortgage |
| Housing Units | 67 | 72 |
| Median Property Value | $247,900 | $276,000 |
| Median Household Income | - | - |
| Monthly Housing Costs | $359 | $0 |
| Real Estate Taxes | $1,311 | $4 |
Property Value by Mortgage Status in Benton
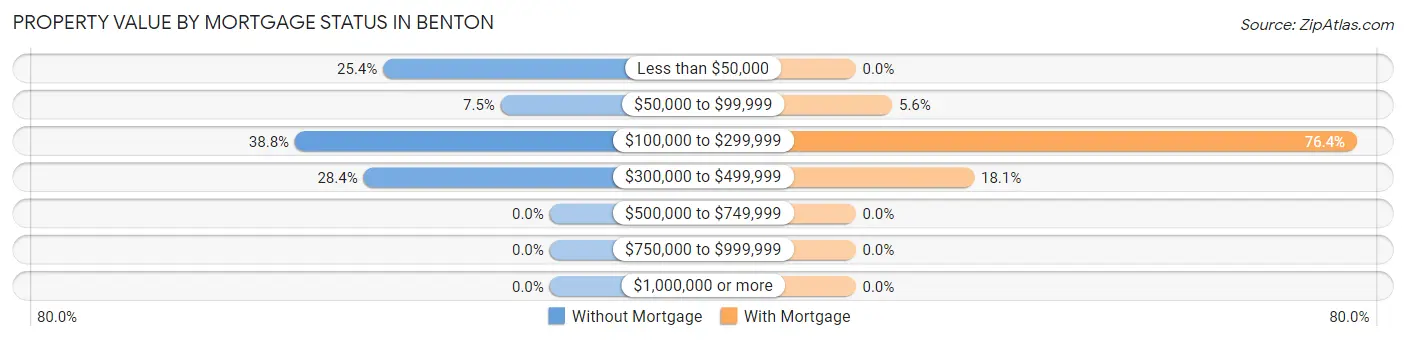
| Property Value | Without Mortgage | With Mortgage |
| Less than $50,000 | 17 (25.4%) | 0 (0.0%) |
| $50,000 to $99,999 | 5 (7.5%) | 4 (5.6%) |
| $100,000 to $299,999 | 26 (38.8%) | 55 (76.4%) |
| $300,000 to $499,999 | 19 (28.4%) | 13 (18.1%) |
| $500,000 to $749,999 | 0 (0.0%) | 0 (0.0%) |
| $750,000 to $999,999 | 0 (0.0%) | 0 (0.0%) |
| $1,000,000 or more | 0 (0.0%) | 0 (0.0%) |
| Total | 67 (100.0%) | 72 (100.0%) |
Household Income by Mortgage Status in Benton
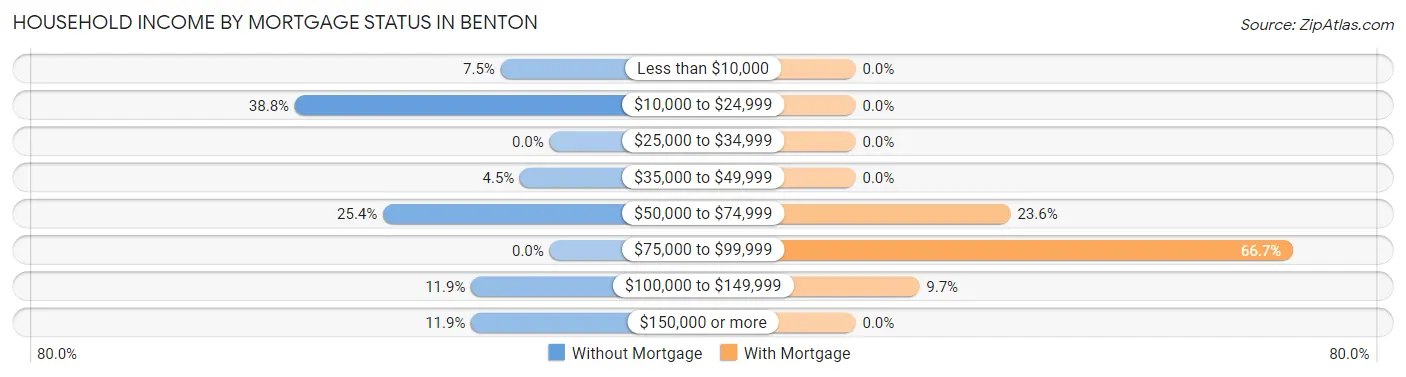
| Household Income | Without Mortgage | With Mortgage |
| Less than $10,000 | 5 (7.5%) | 0 (0.0%) |
| $10,000 to $24,999 | 26 (38.8%) | 0 (0.0%) |
| $25,000 to $34,999 | 0 (0.0%) | 0 (0.0%) |
| $35,000 to $49,999 | 3 (4.5%) | 0 (0.0%) |
| $50,000 to $74,999 | 17 (25.4%) | 17 (23.6%) |
| $75,000 to $99,999 | 0 (0.0%) | 48 (66.7%) |
| $100,000 to $149,999 | 8 (11.9%) | 7 (9.7%) |
| $150,000 or more | 8 (11.9%) | 0 (0.0%) |
| Total | 67 (100.0%) | 72 (100.0%) |
Property Value to Household Income Ratio in Benton
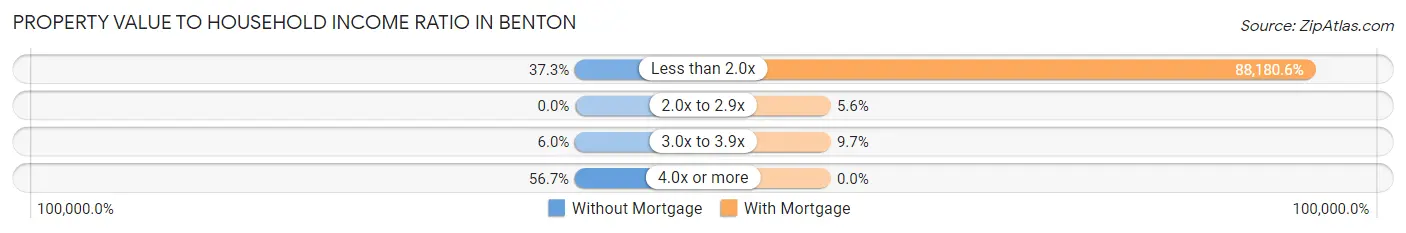
| Value-to-Income Ratio | Without Mortgage | With Mortgage |
| Less than 2.0x | 25 (37.3%) | 63,490 (88,180.6%) |
| 2.0x to 2.9x | 0 (0.0%) | 4 (5.6%) |
| 3.0x to 3.9x | 4 (6.0%) | 7 (9.7%) |
| 4.0x or more | 38 (56.7%) | 0 (0.0%) |
| Total | 67 (100.0%) | 72 (100.0%) |
Real Estate Taxes by Mortgage Status in Benton
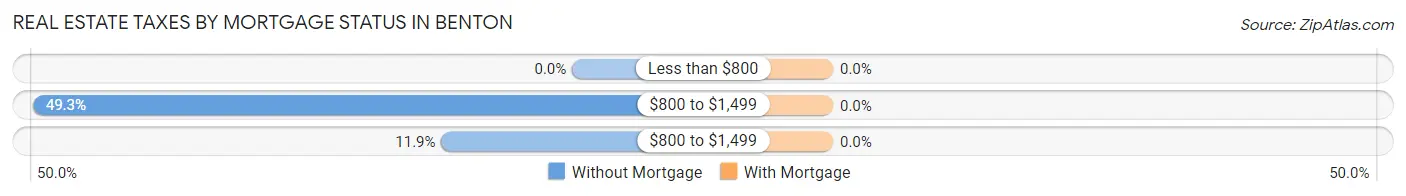
| Property Taxes | Without Mortgage | With Mortgage |
| Less than $800 | 0 (0.0%) | 0 (0.0%) |
| $800 to $1,499 | 33 (49.2%) | 0 (0.0%) |
| $800 to $1,499 | 8 (11.9%) | 0 (0.0%) |
| Total | 67 (100.0%) | 72 (100.0%) |
Health & Disability in Benton
Health Insurance Coverage by Age in Benton
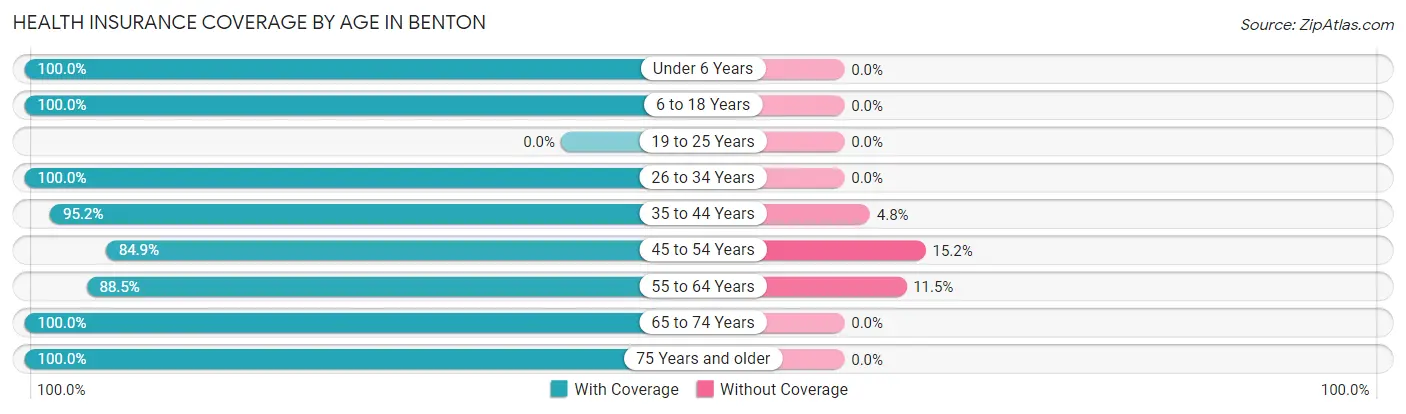
| Age Bracket | With Coverage | Without Coverage |
| Under 6 Years | 36 (100.0%) | 0 (0.0%) |
| 6 to 18 Years | 24 (100.0%) | 0 (0.0%) |
| 19 to 25 Years | 0 (0.0%) | 0 (0.0%) |
| 26 to 34 Years | 73 (100.0%) | 0 (0.0%) |
| 35 to 44 Years | 40 (95.2%) | 2 (4.8%) |
| 45 to 54 Years | 56 (84.9%) | 10 (15.1%) |
| 55 to 64 Years | 23 (88.5%) | 3 (11.5%) |
| 65 to 74 Years | 94 (100.0%) | 0 (0.0%) |
| 75 Years and older | 32 (100.0%) | 0 (0.0%) |
| Total | 378 (96.2%) | 15 (3.8%) |
Health Insurance Coverage by Citizenship Status in Benton
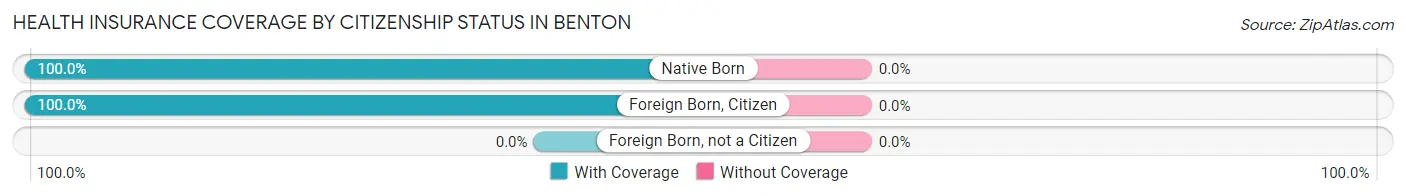
| Citizenship Status | With Coverage | Without Coverage |
| Native Born | 36 (100.0%) | 0 (0.0%) |
| Foreign Born, Citizen | 24 (100.0%) | 0 (0.0%) |
| Foreign Born, not a Citizen | 0 (0.0%) | 0 (0.0%) |
Health Insurance Coverage by Household Income in Benton
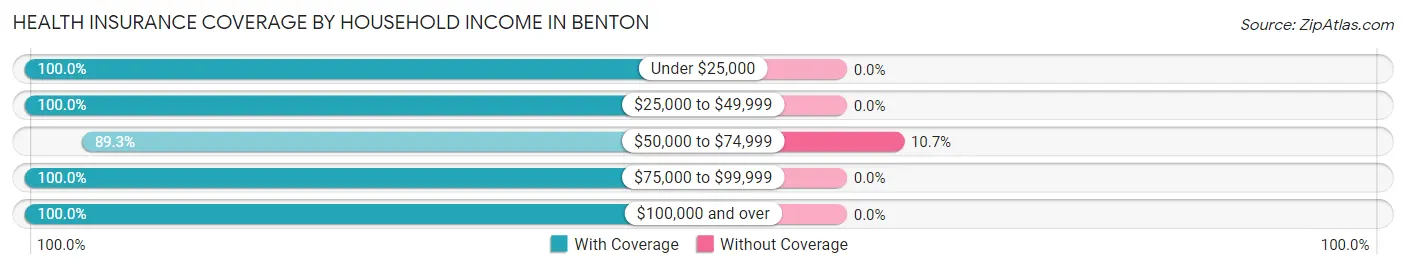
| Household Income | With Coverage | Without Coverage |
| Under $25,000 | 151 (100.0%) | 0 (0.0%) |
| $25,000 to $49,999 | 39 (100.0%) | 0 (0.0%) |
| $50,000 to $74,999 | 125 (89.3%) | 15 (10.7%) |
| $75,000 to $99,999 | 7 (100.0%) | 0 (0.0%) |
| $100,000 and over | 56 (100.0%) | 0 (0.0%) |
Public vs Private Health Insurance Coverage by Age in Benton
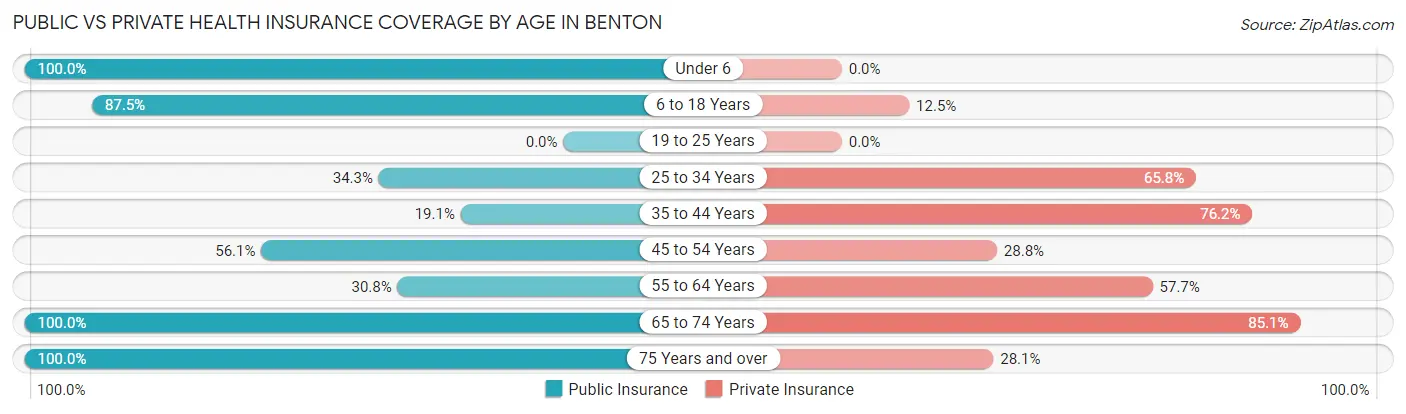
| Age Bracket | Public Insurance | Private Insurance |
| Under 6 | 36 (100.0%) | 0 (0.0%) |
| 6 to 18 Years | 21 (87.5%) | 3 (12.5%) |
| 19 to 25 Years | 0 (0.0%) | 0 (0.0%) |
| 25 to 34 Years | 25 (34.3%) | 48 (65.7%) |
| 35 to 44 Years | 8 (19.1%) | 32 (76.2%) |
| 45 to 54 Years | 37 (56.1%) | 19 (28.8%) |
| 55 to 64 Years | 8 (30.8%) | 15 (57.7%) |
| 65 to 74 Years | 94 (100.0%) | 80 (85.1%) |
| 75 Years and over | 32 (100.0%) | 9 (28.1%) |
| Total | 261 (66.4%) | 206 (52.4%) |
Disability Status by Sex by Age in Benton
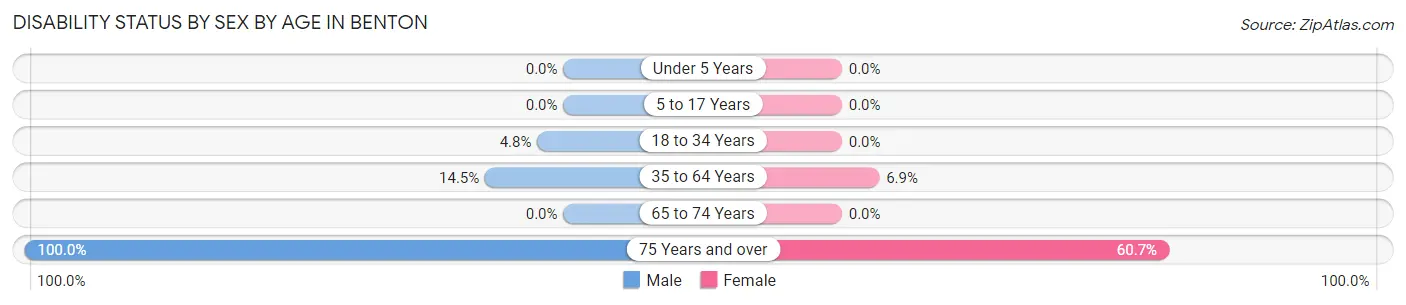
| Age Bracket | Male | Female |
| Under 5 Years | 0 (0.0%) | 0 (0.0%) |
| 5 to 17 Years | 0 (0.0%) | 0 (0.0%) |
| 18 to 34 Years | 3 (4.8%) | 0 (0.0%) |
| 35 to 64 Years | 9 (14.5%) | 5 (6.9%) |
| 65 to 74 Years | 0 (0.0%) | 0 (0.0%) |
| 75 Years and over | 4 (100.0%) | 17 (60.7%) |
Disability Class by Sex by Age in Benton
Disability Class: Hearing Difficulty
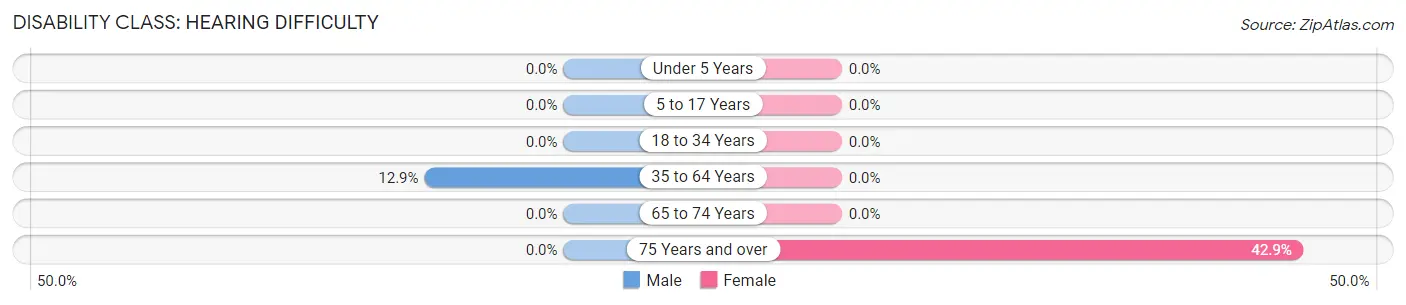
| Age Bracket | Male | Female |
| Under 5 Years | 0 (0.0%) | 0 (0.0%) |
| 5 to 17 Years | 0 (0.0%) | 0 (0.0%) |
| 18 to 34 Years | 0 (0.0%) | 0 (0.0%) |
| 35 to 64 Years | 8 (12.9%) | 0 (0.0%) |
| 65 to 74 Years | 0 (0.0%) | 0 (0.0%) |
| 75 Years and over | 0 (0.0%) | 12 (42.9%) |
Disability Class: Vision Difficulty
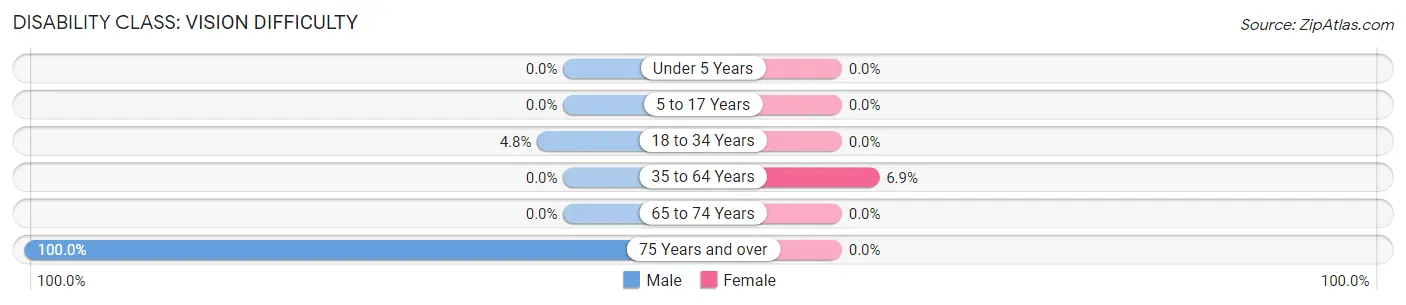
| Age Bracket | Male | Female |
| Under 5 Years | 0 (0.0%) | 0 (0.0%) |
| 5 to 17 Years | 0 (0.0%) | 0 (0.0%) |
| 18 to 34 Years | 3 (4.8%) | 0 (0.0%) |
| 35 to 64 Years | 0 (0.0%) | 5 (6.9%) |
| 65 to 74 Years | 0 (0.0%) | 0 (0.0%) |
| 75 Years and over | 4 (100.0%) | 0 (0.0%) |
Disability Class: Cognitive Difficulty
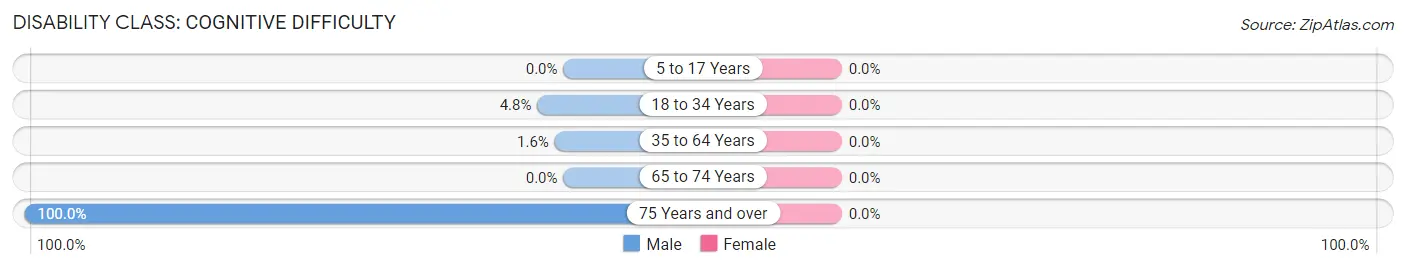
| Age Bracket | Male | Female |
| 5 to 17 Years | 0 (0.0%) | 0 (0.0%) |
| 18 to 34 Years | 3 (4.8%) | 0 (0.0%) |
| 35 to 64 Years | 1 (1.6%) | 0 (0.0%) |
| 65 to 74 Years | 0 (0.0%) | 0 (0.0%) |
| 75 Years and over | 4 (100.0%) | 0 (0.0%) |
Disability Class: Ambulatory Difficulty
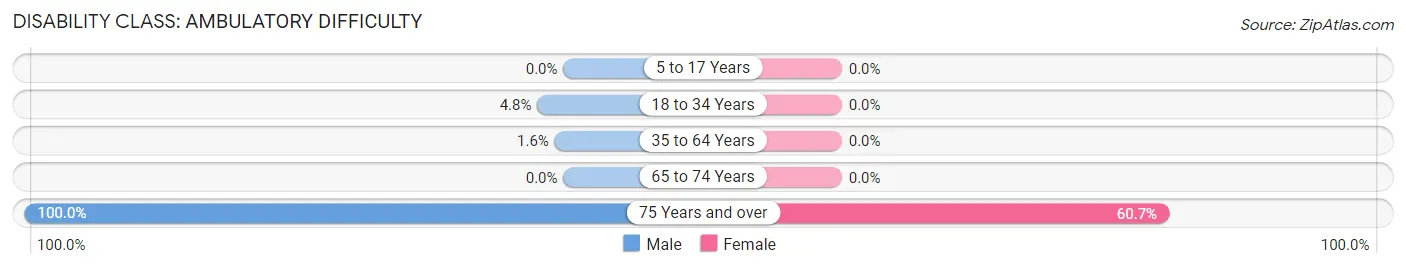
| Age Bracket | Male | Female |
| 5 to 17 Years | 0 (0.0%) | 0 (0.0%) |
| 18 to 34 Years | 3 (4.8%) | 0 (0.0%) |
| 35 to 64 Years | 1 (1.6%) | 0 (0.0%) |
| 65 to 74 Years | 0 (0.0%) | 0 (0.0%) |
| 75 Years and over | 4 (100.0%) | 17 (60.7%) |
Disability Class: Self-Care Difficulty
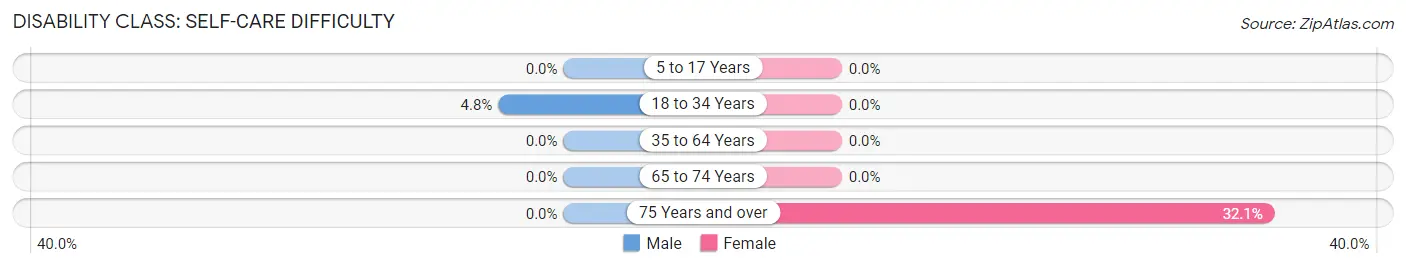
| Age Bracket | Male | Female |
| 5 to 17 Years | 0 (0.0%) | 0 (0.0%) |
| 18 to 34 Years | 3 (4.8%) | 0 (0.0%) |
| 35 to 64 Years | 0 (0.0%) | 0 (0.0%) |
| 65 to 74 Years | 0 (0.0%) | 0 (0.0%) |
| 75 Years and over | 0 (0.0%) | 9 (32.1%) |
Technology Access in Benton
Computing Device Access in Benton
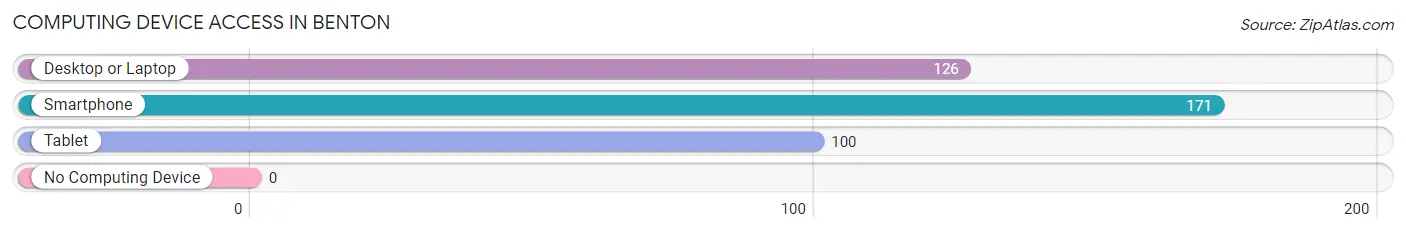
| Device Type | # Households | % Households |
| Desktop or Laptop | 126 | 73.3% |
| Smartphone | 171 | 99.4% |
| Tablet | 100 | 58.1% |
| No Computing Device | 0 | 0.0% |
| Total | 172 | 100.0% |
Internet Access in Benton
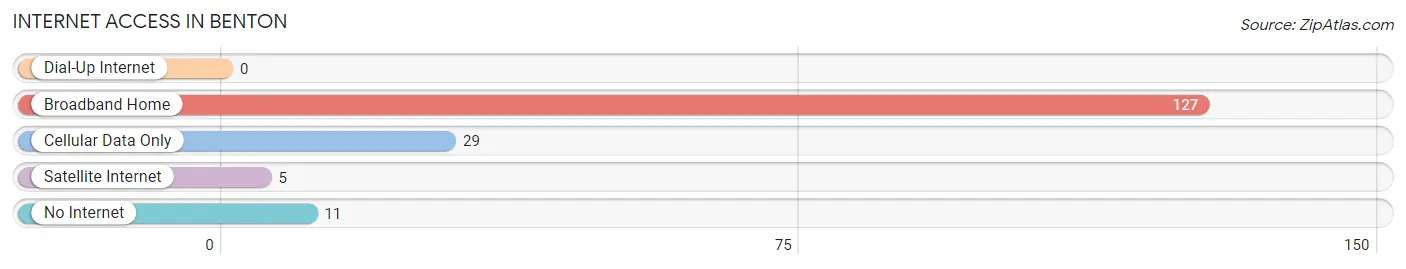
| Internet Type | # Households | % Households |
| Dial-Up Internet | 0 | 0.0% |
| Broadband Home | 127 | 73.8% |
| Cellular Data Only | 29 | 16.9% |
| Satellite Internet | 5 | 2.9% |
| No Internet | 11 | 6.4% |
| Total | 172 | 100.0% |
Benton Summary
Benton is a small unincorporated community located in Mono County, California. It is situated in the Owens Valley, at the base of the White Mountains, and is surrounded by the Inyo National Forest. The town is located on the eastern side of the Sierra Nevada mountain range, and is approximately 20 miles south of Bishop, California.
History
Benton was founded in 1864 by a group of miners who were searching for gold in the area. The town was named after William Benton, a local miner who had discovered gold in the area. The town quickly grew, and by the late 1800s, it had become a bustling mining town with a population of over 500 people.
The town was home to several businesses, including a hotel, saloon, general store, and a post office. The town also had a school, which was built in 1876.
In the early 1900s, the town began to decline as the gold rush ended and the population began to dwindle. By the 1950s, the population had dropped to just over 100 people.
Geography
Benton is located in the Owens Valley, at the base of the White Mountains. The town is situated at an elevation of 4,000 feet, and is surrounded by the Inyo National Forest. The town is located on the eastern side of the Sierra Nevada mountain range, and is approximately 20 miles south of Bishop, California.
The town is located in a semi-arid climate, with hot summers and cold winters. The average annual temperature is around 50 degrees Fahrenheit, and the average annual precipitation is around 8 inches.
Economy
The economy of Benton is largely based on tourism. The town is a popular destination for hikers, campers, and other outdoor enthusiasts. The town is also home to several small businesses, including a general store, a restaurant, and a gas station.
The town is also home to a small mining operation, which produces gold, silver, and other minerals. The mining operation is owned by a local family, and employs several people in the area.
Demographics
As of the 2010 census, the population of Benton was estimated to be around 200 people. The town is predominantly white, with a small Hispanic population. The median household income is around $30,000, and the median home value is around $150,000.
Conclusion
Benton is a small unincorporated community located in Mono County, California. It is situated in the Owens Valley, at the base of the White Mountains, and is surrounded by the Inyo National Forest. The town is located on the eastern side of the Sierra Nevada mountain range, and is approximately 20 miles south of Bishop, California. The town was founded in 1864 by a group of miners who were searching for gold in the area, and has since become a popular destination for hikers, campers, and other outdoor enthusiasts. The economy of Benton is largely based on tourism, and the town is also home to a small mining operation. As of the 2010 census, the population of Benton was estimated to be around 200 people.
Common Questions
What is Per Capita Income in Benton?
Per Capita income in Benton is $27,467.
What is the Median Family Income in Benton?
Median Family Income in Benton is $50,313.
What is the Median Household income in Benton?
Median Household Income in Benton is $62,760.
What is Inequality or Gini Index in Benton?
Inequality or Gini Index in Benton is 0.38.
What is the Total Population of Benton?
Total Population of Benton is 393.
What is the Total Male Population of Benton?
Total Male Population of Benton is 209.
What is the Total Female Population of Benton?
Total Female Population of Benton is 184.
What is the Ratio of Males per 100 Females in Benton?
There are 113.59 Males per 100 Females in Benton.
What is the Ratio of Females per 100 Males in Benton?
There are 88.04 Females per 100 Males in Benton.
What is the Median Population Age in Benton?
Median Population Age in Benton is 49.4 Years.
What is the Average Family Size in Benton
Average Family Size in Benton is 2.5 People.
What is the Average Household Size in Benton
Average Household Size in Benton is 2.3 People.
How Large is the Labor Force in Benton?
There are 158 People in the Labor Forcein in Benton.
What is the Percentage of People in the Labor Force in Benton?
46.9% of People are in the Labor Force in Benton.
What is the Unemployment Rate in Benton?
Unemployment Rate in Benton is 1.3%.