Plainview, NY Map & Demographics
Plainview Map
Plainview Overview
$71,495
PER CAPITA INCOME
$211,995
AVG FAMILY INCOME
$181,423
AVG HOUSEHOLD INCOME
39.6%
WAGE / INCOME GAP [ % ]
60.4¢/ $1
WAGE / INCOME GAP [ $ ]
0.40
INEQUALITY / GINI INDEX
26,620
TOTAL POPULATION
13,129
MALE POPULATION
13,491
FEMALE POPULATION
97.32
MALES / 100 FEMALES
102.76
FEMALES / 100 MALES
43.5
MEDIAN AGE
3.4
AVG FAMILY SIZE
3.0
AVG HOUSEHOLD SIZE
14,023
LABOR FORCE [ PEOPLE ]
66.6%
PERCENT IN LABOR FORCE
2.7%
UNEMPLOYMENT RATE
Plainview Zip Codes
Income in Plainview
Income Overview in Plainview
Per Capita Income in Plainview is $71,495, while median incomes of families and households are $211,995 and $181,423 respectively.
| Characteristic | Number | Measure |
| Per Capita Income | 26,620 | $71,495 |
| Median Family Income | 7,243 | $211,995 |
| Mean Family Income | 7,243 | $239,533 |
| Median Household Income | 8,923 | $181,423 |
| Mean Household Income | 8,923 | $208,491 |
| Income Deficit | 7,243 | $0 |
| Wage / Income Gap (%) | 26,620 | 39.64% |
| Wage / Income Gap ($) | 26,620 | 60.36¢ per $1 |
| Gini / Inequality Index | 26,620 | 0.40 |
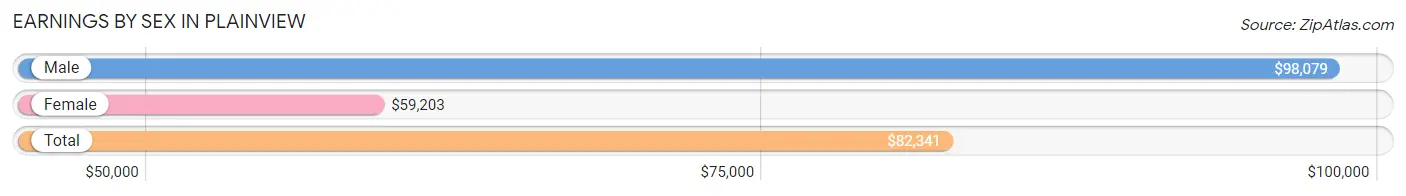
Earnings by Sex in Plainview
Average Earnings in Plainview are $82,341, $98,079 for men and $59,203 for women, a difference of 39.6%.
| Sex | Number | Average Earnings |
| Male | 7,565 (51.6%) | $98,079 |
| Female | 7,095 (48.4%) | $59,203 |
| Total | 14,660 (100.0%) | $82,341 |
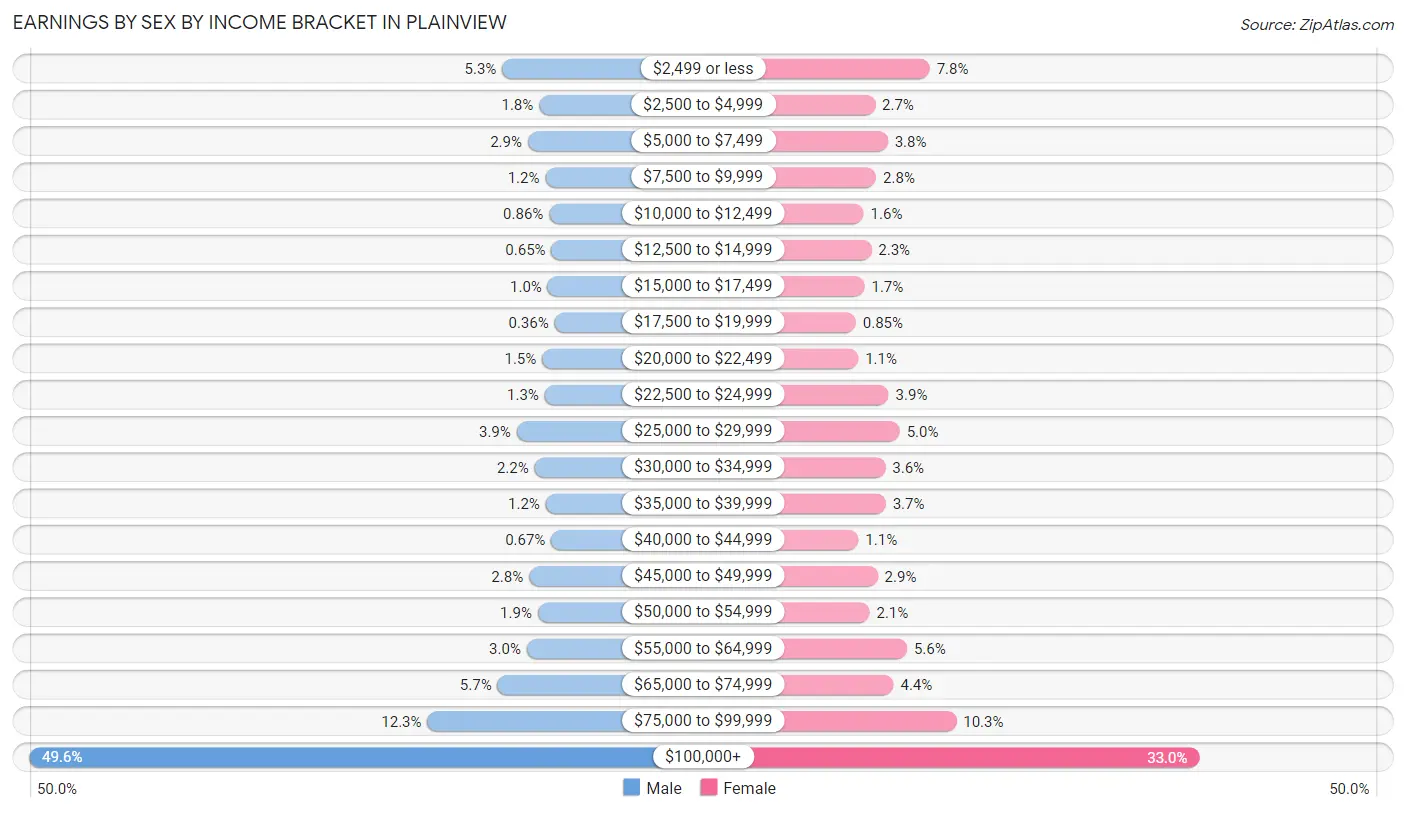
Earnings by Sex by Income Bracket in Plainview
The most common earnings brackets in Plainview are $100,000+ for men (3,751 | 49.6%) and $100,000+ for women (2,343 | 33.0%).
| Income | Male | Female |
| $2,499 or less | 398 (5.3%) | 551 (7.8%) |
| $2,500 to $4,999 | 136 (1.8%) | 188 (2.6%) |
| $5,000 to $7,499 | 216 (2.9%) | 272 (3.8%) |
| $7,500 to $9,999 | 92 (1.2%) | 195 (2.8%) |
| $10,000 to $12,499 | 65 (0.9%) | 112 (1.6%) |
| $12,500 to $14,999 | 49 (0.6%) | 163 (2.3%) |
| $15,000 to $17,499 | 76 (1.0%) | 118 (1.7%) |
| $17,500 to $19,999 | 27 (0.4%) | 60 (0.9%) |
| $20,000 to $22,499 | 115 (1.5%) | 76 (1.1%) |
| $22,500 to $24,999 | 97 (1.3%) | 278 (3.9%) |
| $25,000 to $29,999 | 296 (3.9%) | 352 (5.0%) |
| $30,000 to $34,999 | 169 (2.2%) | 256 (3.6%) |
| $35,000 to $39,999 | 90 (1.2%) | 259 (3.6%) |
| $40,000 to $44,999 | 51 (0.7%) | 77 (1.1%) |
| $45,000 to $49,999 | 208 (2.8%) | 205 (2.9%) |
| $50,000 to $54,999 | 146 (1.9%) | 151 (2.1%) |
| $55,000 to $64,999 | 224 (3.0%) | 400 (5.6%) |
| $65,000 to $74,999 | 431 (5.7%) | 311 (4.4%) |
| $75,000 to $99,999 | 928 (12.3%) | 728 (10.3%) |
| $100,000+ | 3,751 (49.6%) | 2,343 (33.0%) |
| Total | 7,565 (100.0%) | 7,095 (100.0%) |
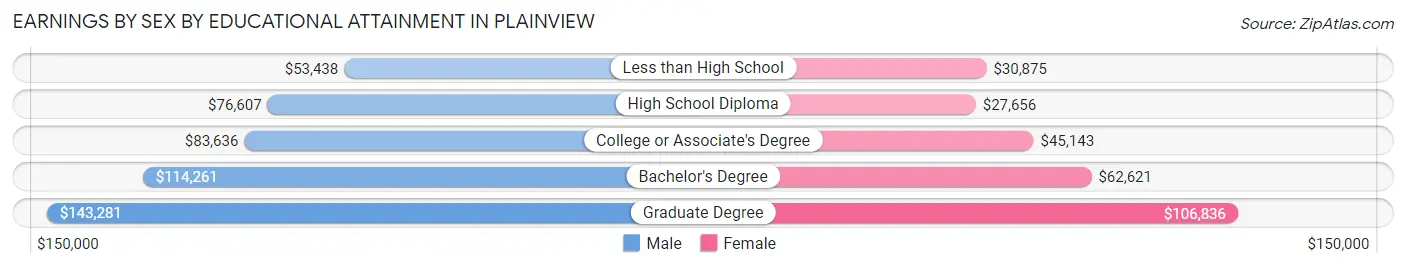
Earnings by Sex by Educational Attainment in Plainview
Average earnings in Plainview are $109,375 for men and $75,233 for women, a difference of 31.2%. Men with an educational attainment of graduate degree enjoy the highest average annual earnings of $143,281, while those with less than high school education earn the least with $53,438. Women with an educational attainment of graduate degree earn the most with the average annual earnings of $106,836, while those with high school diploma education have the smallest earnings of $27,656.
| Educational Attainment | Male Income | Female Income |
| Less than High School | $53,438 | $30,875 |
| High School Diploma | $76,607 | $27,656 |
| College or Associate's Degree | $83,636 | $45,143 |
| Bachelor's Degree | $114,261 | $62,621 |
| Graduate Degree | $143,281 | $106,836 |
| Total | $109,375 | $75,233 |
Family Income in Plainview
Family Income Brackets in Plainview
According to the Plainview family income data, there are 3,817 families falling into the $200,000+ income range, which is the most common income bracket and makes up 52.7% of all families. Conversely, the $10,000 to $14,999 income bracket is the least frequent group with only 7 families (0.1%) belonging to this category.
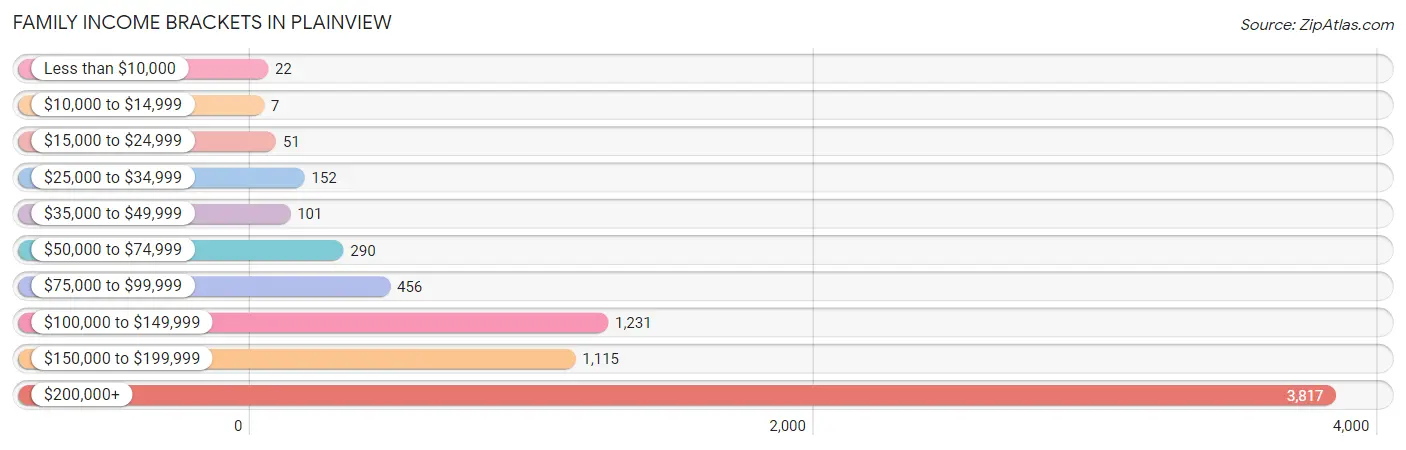
| Income Bracket | # Families | % Families |
| Less than $10,000 | 22 | 0.3% |
| $10,000 to $14,999 | 7 | 0.1% |
| $15,000 to $24,999 | 51 | 0.7% |
| $25,000 to $34,999 | 152 | 2.1% |
| $35,000 to $49,999 | 101 | 1.4% |
| $50,000 to $74,999 | 290 | 4.0% |
| $75,000 to $99,999 | 456 | 6.3% |
| $100,000 to $149,999 | 1,231 | 17.0% |
| $150,000 to $199,999 | 1,115 | 15.4% |
| $200,000+ | 3,817 | 52.7% |
Family Income by Famaliy Size in Plainview
4-person families (2,369 | 32.7%) account for the highest median family income in Plainview with $250,001 per family, while 2-person families (2,410 | 33.3%) have the highest median income of $84,107 per family member.
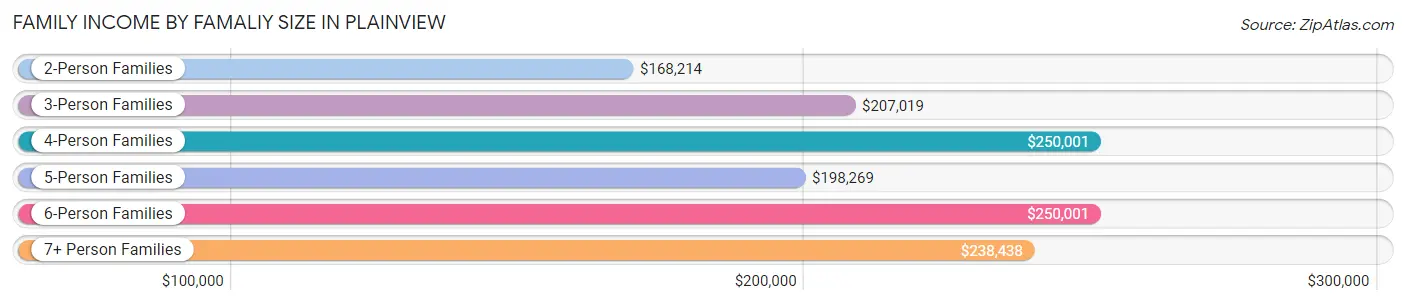
| Income Bracket | # Families | Median Income |
| 2-Person Families | 2,410 (33.3%) | $168,214 |
| 3-Person Families | 1,741 (24.0%) | $207,019 |
| 4-Person Families | 2,369 (32.7%) | $250,001 |
| 5-Person Families | 504 (7.0%) | $198,269 |
| 6-Person Families | 138 (1.9%) | $250,001 |
| 7+ Person Families | 81 (1.1%) | $238,438 |
| Total | 7,243 (100.0%) | $211,995 |
Family Income by Number of Earners in Plainview
The median family income in Plainview is $211,995, with families comprising 3+ earners (1,403) having the highest median family income of $250,001, while families with no earners (698) have the lowest median family income of $102,941, accounting for 19.4% and 9.6% of families, respectively.
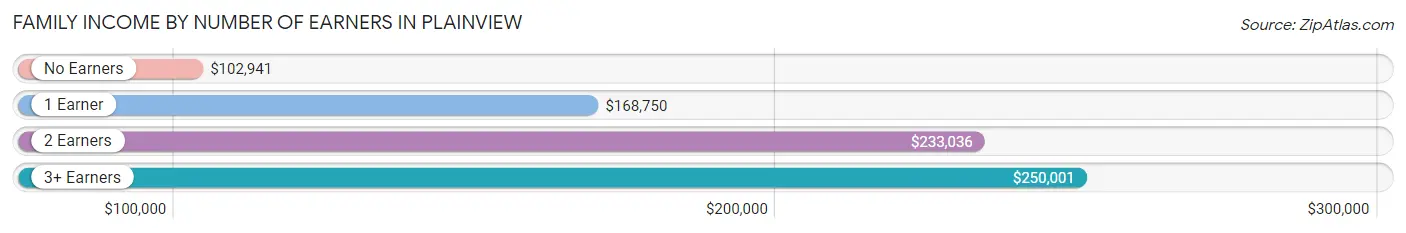
| Number of Earners | # Families | Median Income |
| No Earners | 698 (9.6%) | $102,941 |
| 1 Earner | 1,514 (20.9%) | $168,750 |
| 2 Earners | 3,628 (50.1%) | $233,036 |
| 3+ Earners | 1,403 (19.4%) | $250,001 |
| Total | 7,243 (100.0%) | $211,995 |
Household Income in Plainview
Household Income Brackets in Plainview
With 3,899 households falling in the category, the $200,000+ income range is the most frequent in Plainview, accounting for 43.7% of all households. In contrast, only 125 households (1.4%) fall into the $10,000 to $14,999 income bracket, making it the least populous group.
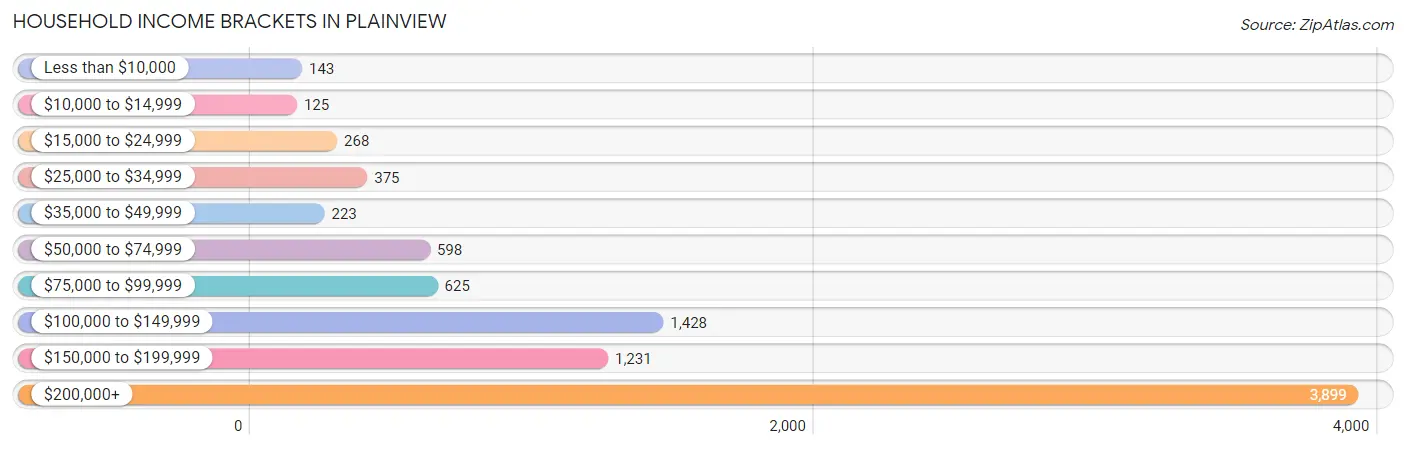
| Income Bracket | # Households | % Households |
| Less than $10,000 | 143 | 1.6% |
| $10,000 to $14,999 | 125 | 1.4% |
| $15,000 to $24,999 | 268 | 3.0% |
| $25,000 to $34,999 | 375 | 4.2% |
| $35,000 to $49,999 | 223 | 2.5% |
| $50,000 to $74,999 | 598 | 6.7% |
| $75,000 to $99,999 | 625 | 7.0% |
| $100,000 to $149,999 | 1,428 | 16.0% |
| $150,000 to $199,999 | 1,231 | 13.8% |
| $200,000+ | 3,899 | 43.7% |
Household Income by Householder Age in Plainview
The median household income in Plainview is $181,423, with the highest median household income of $234,663 found in the 25 to 44 years age bracket for the primary householder. A total of 1,909 households (21.4%) fall into this category.
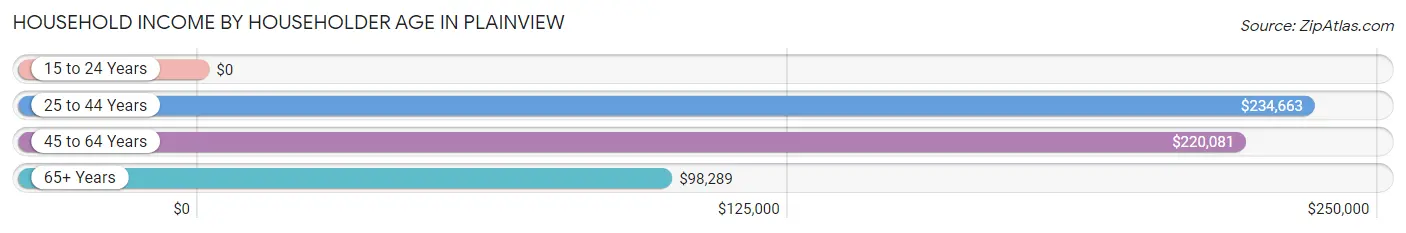
| Income Bracket | # Households | Median Income |
| 15 to 24 Years | 0 (0.0%) | $0 |
| 25 to 44 Years | 1,909 (21.4%) | $234,663 |
| 45 to 64 Years | 3,644 (40.8%) | $220,081 |
| 65+ Years | 3,370 (37.8%) | $98,289 |
| Total | 8,923 (100.0%) | $181,423 |
Poverty in Plainview
Income Below Poverty by Sex and Age in Plainview
With 2.0% poverty level for males and 2.9% for females among the residents of Plainview, 12 to 14 year old males and 75 year old and over females are the most vulnerable to poverty, with 29 males (6.5%) and 142 females (10.0%) in their respective age groups living below the poverty level.
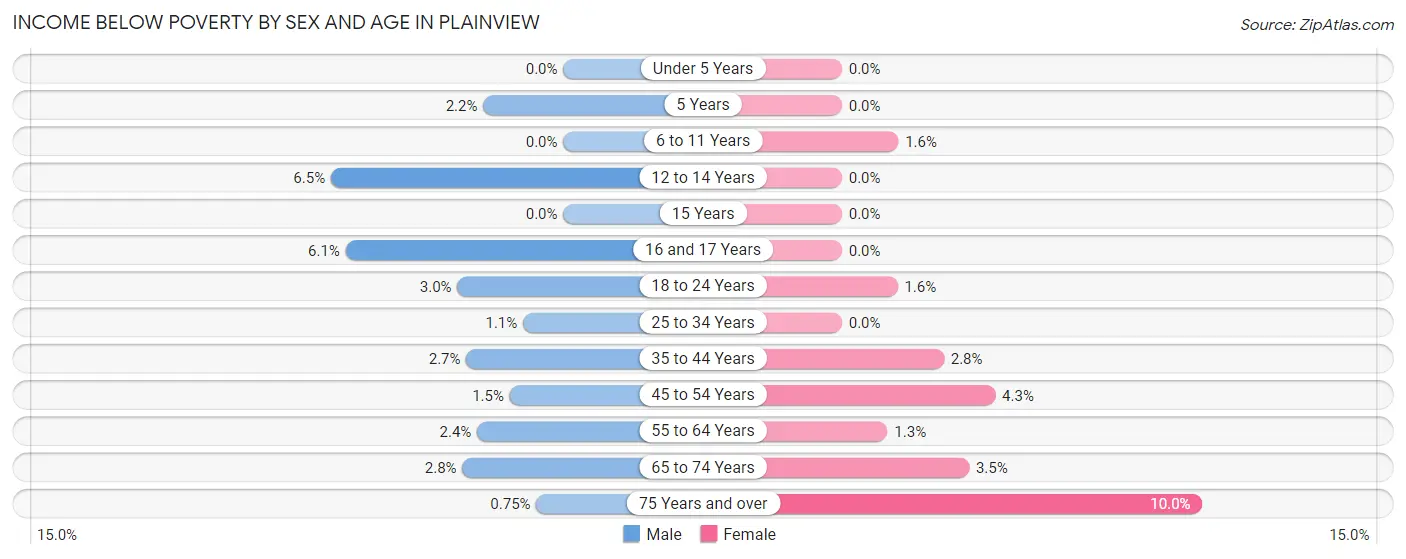
| Age Bracket | Male | Female |
| Under 5 Years | 0 (0.0%) | 0 (0.0%) |
| 5 Years | 4 (2.2%) | 0 (0.0%) |
| 6 to 11 Years | 0 (0.0%) | 16 (1.6%) |
| 12 to 14 Years | 29 (6.5%) | 0 (0.0%) |
| 15 Years | 0 (0.0%) | 0 (0.0%) |
| 16 and 17 Years | 22 (6.1%) | 0 (0.0%) |
| 18 to 24 Years | 30 (2.9%) | 16 (1.5%) |
| 25 to 34 Years | 11 (1.1%) | 0 (0.0%) |
| 35 to 44 Years | 45 (2.7%) | 56 (2.8%) |
| 45 to 54 Years | 27 (1.5%) | 79 (4.3%) |
| 55 to 64 Years | 45 (2.4%) | 21 (1.3%) |
| 65 to 74 Years | 36 (2.8%) | 63 (3.5%) |
| 75 Years and over | 8 (0.7%) | 142 (10.0%) |
| Total | 257 (2.0%) | 393 (2.9%) |
Income Above Poverty by Sex and Age in Plainview
According to the poverty statistics in Plainview, males aged under 5 years and females aged under 5 years are the age groups that are most secure financially, with 100.0% of males and 100.0% of females in these age groups living above the poverty line.
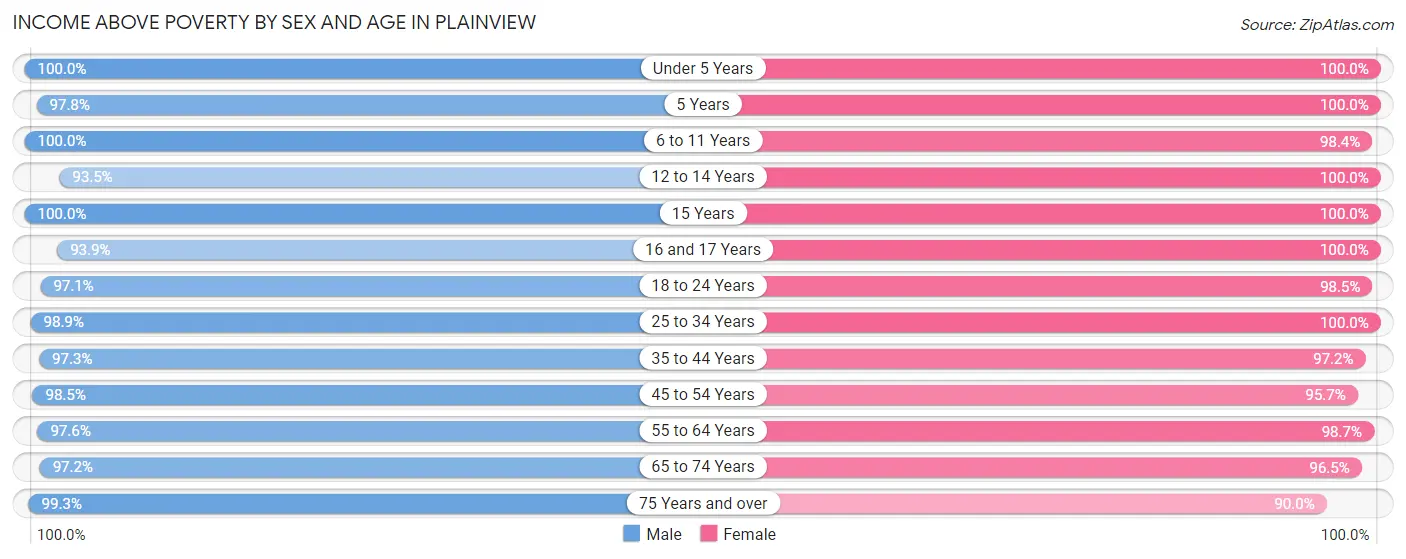
| Age Bracket | Male | Female |
| Under 5 Years | 613 (100.0%) | 647 (100.0%) |
| 5 Years | 175 (97.8%) | 122 (100.0%) |
| 6 to 11 Years | 1,496 (100.0%) | 1,006 (98.4%) |
| 12 to 14 Years | 419 (93.5%) | 623 (100.0%) |
| 15 Years | 261 (100.0%) | 111 (100.0%) |
| 16 and 17 Years | 341 (93.9%) | 365 (100.0%) |
| 18 to 24 Years | 987 (97.1%) | 1,016 (98.5%) |
| 25 to 34 Years | 973 (98.9%) | 782 (100.0%) |
| 35 to 44 Years | 1,622 (97.3%) | 1,918 (97.2%) |
| 45 to 54 Years | 1,780 (98.5%) | 1,769 (95.7%) |
| 55 to 64 Years | 1,833 (97.6%) | 1,632 (98.7%) |
| 65 to 74 Years | 1,243 (97.2%) | 1,719 (96.5%) |
| 75 Years and over | 1,055 (99.3%) | 1,273 (90.0%) |
| Total | 12,798 (98.0%) | 12,983 (97.1%) |
Income Below Poverty Among Married-Couple Families in Plainview
The poverty statistics for married-couple families in Plainview show that 0.7% or 46 of the total 6,444 families live below the poverty line. Families with 1 or 2 children have the highest poverty rate of 1.3%, comprising of 40 families. On the other hand, families with 3 or 4 children have the lowest poverty rate of 0.0%, which includes 0 families.
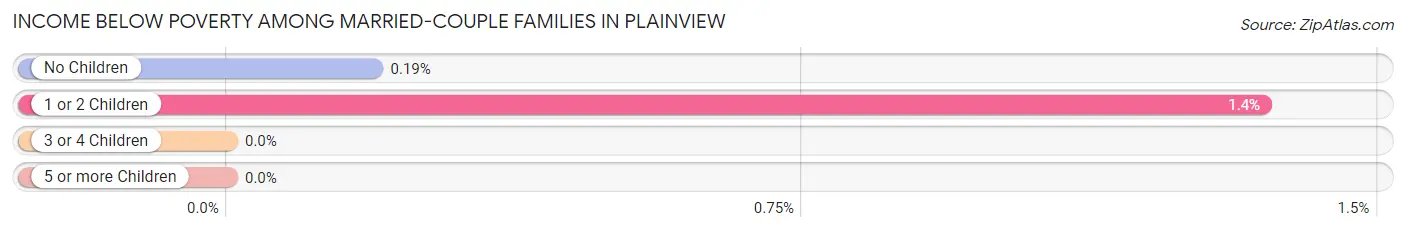
| Children | Above Poverty | Below Poverty |
| No Children | 3,201 (99.8%) | 6 (0.2%) |
| 1 or 2 Children | 2,924 (98.7%) | 40 (1.3%) |
| 3 or 4 Children | 266 (100.0%) | 0 (0.0%) |
| 5 or more Children | 7 (100.0%) | 0 (0.0%) |
| Total | 6,398 (99.3%) | 46 (0.7%) |
Income Below Poverty Among Single-Parent Households in Plainview
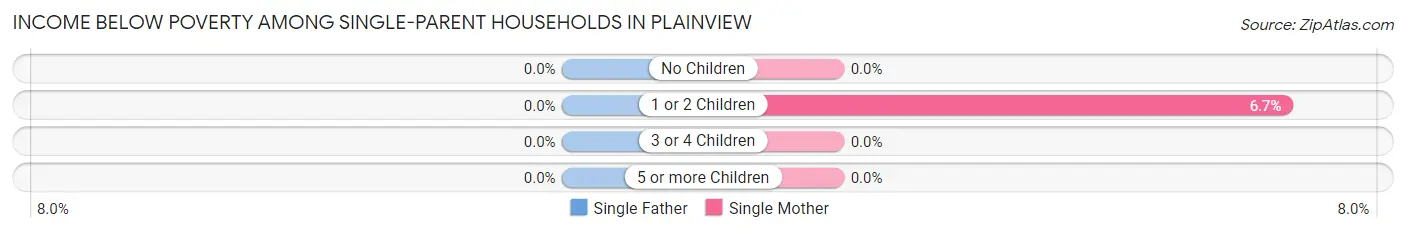
| Children | Single Father | Single Mother |
| No Children | 0 (0.0%) | 0 (0.0%) |
| 1 or 2 Children | 0 (0.0%) | 15 (6.7%) |
| 3 or 4 Children | 0 (0.0%) | 0 (0.0%) |
| 5 or more Children | 0 (0.0%) | 0 (0.0%) |
| Total | 0 (0.0%) | 15 (2.5%) |
Income Below Poverty Among Married-Couple vs Single-Parent Households in Plainview
The poverty data for Plainview shows that 46 of the married-couple family households (0.7%) and 15 of the single-parent households (1.9%) are living below the poverty level. Within the married-couple family households, those with 1 or 2 children have the highest poverty rate, with 40 households (1.3%) falling below the poverty line. Among the single-parent households, those with 1 or 2 children have the highest poverty rate, with 15 household (5.7%) living below poverty.
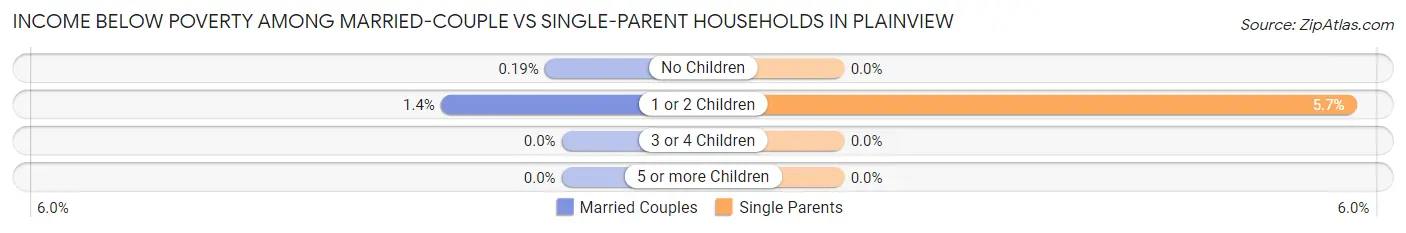
| Children | Married-Couple Families | Single-Parent Households |
| No Children | 6 (0.2%) | 0 (0.0%) |
| 1 or 2 Children | 40 (1.3%) | 15 (5.7%) |
| 3 or 4 Children | 0 (0.0%) | 0 (0.0%) |
| 5 or more Children | 0 (0.0%) | 0 (0.0%) |
| Total | 46 (0.7%) | 15 (1.9%) |
Race in Plainview
The most populous races in Plainview are White / Caucasian (19,899 | 74.8%), Asian (5,291 | 19.9%), and Hispanic or Latino (1,227 | 4.6%).
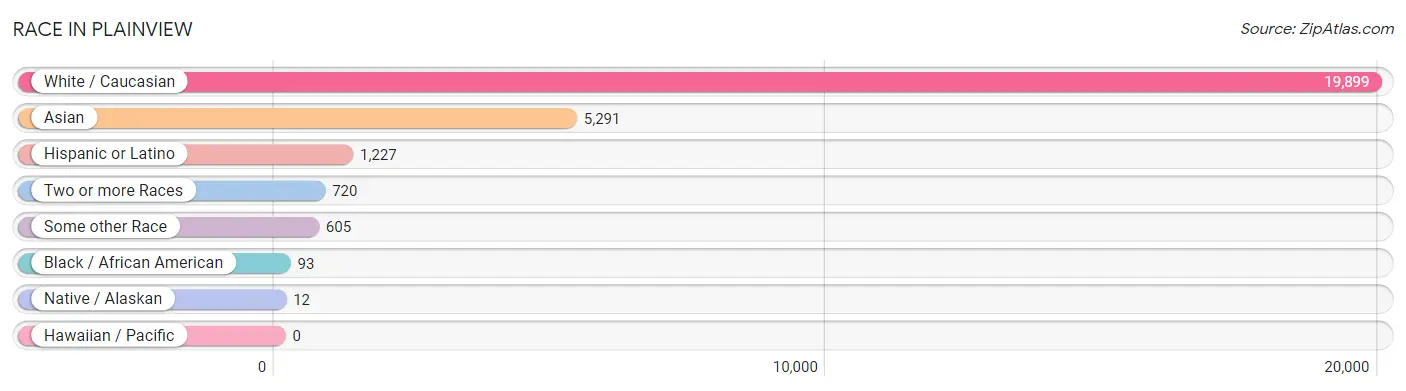
| Race | # Population | % Population |
| Asian | 5,291 | 19.9% |
| Black / African American | 93 | 0.4% |
| Hawaiian / Pacific | 0 | 0.0% |
| Hispanic or Latino | 1,227 | 4.6% |
| Native / Alaskan | 12 | 0.1% |
| White / Caucasian | 19,899 | 74.8% |
| Two or more Races | 720 | 2.7% |
| Some other Race | 605 | 2.3% |
| Total | 26,620 | 100.0% |
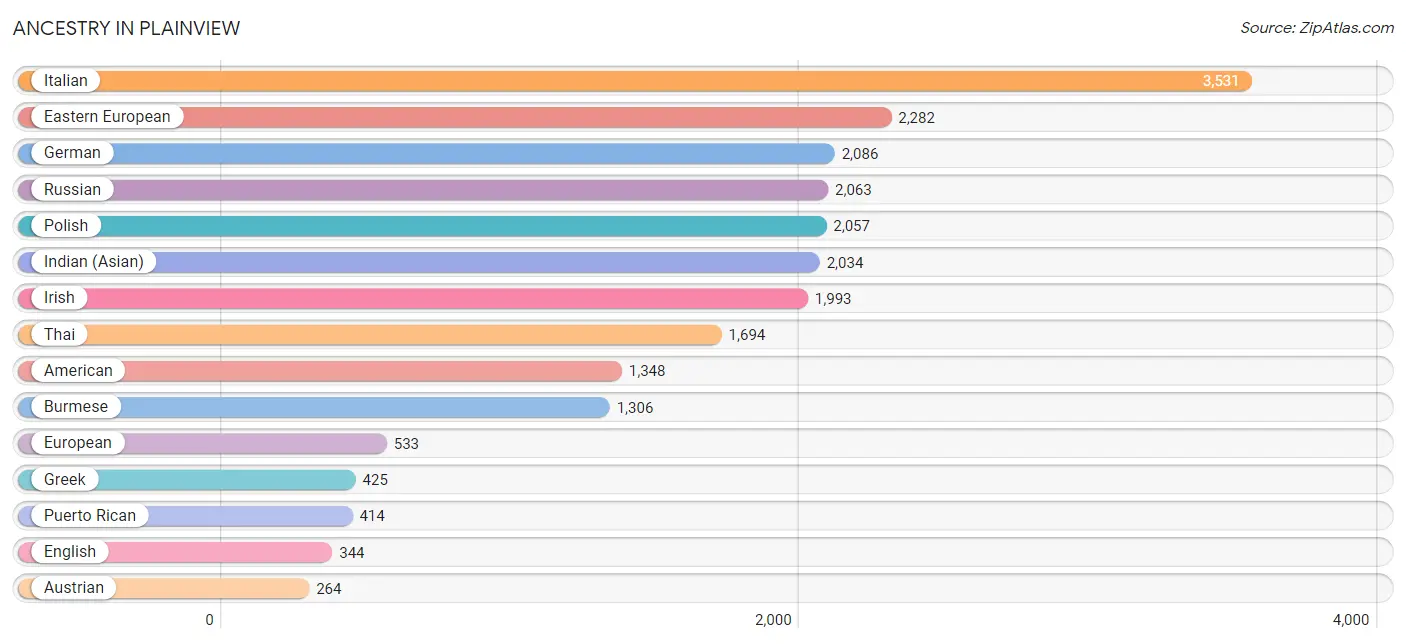
Ancestry in Plainview
The most populous ancestries reported in Plainview are Italian (3,531 | 13.3%), Eastern European (2,282 | 8.6%), German (2,086 | 7.8%), Russian (2,063 | 7.7%), and Polish (2,057 | 7.7%), together accounting for 45.1% of all Plainview residents.
| Ancestry | # Population | % Population |
| Afghan | 24 | 0.1% |
| American | 1,348 | 5.1% |
| Arab | 177 | 0.7% |
| Argentinean | 23 | 0.1% |
| Austrian | 264 | 1.0% |
| Bhutanese | 19 | 0.1% |
| Blackfeet | 31 | 0.1% |
| Brazilian | 62 | 0.2% |
| British | 63 | 0.2% |
| Burmese | 1,306 | 4.9% |
| Carpatho Rusyn | 9 | 0.0% |
| Celtic | 8 | 0.0% |
| Central American | 83 | 0.3% |
| Chilean | 20 | 0.1% |
| Colombian | 72 | 0.3% |
| Croatian | 65 | 0.2% |
| Cuban | 15 | 0.1% |
| Czech | 128 | 0.5% |
| Dominican | 87 | 0.3% |
| Dutch | 20 | 0.1% |
| Eastern European | 2,282 | 8.6% |
| Ecuadorian | 107 | 0.4% |
| Egyptian | 101 | 0.4% |
| English | 344 | 1.3% |
| European | 533 | 2.0% |
| Filipino | 22 | 0.1% |
| French | 110 | 0.4% |
| French Canadian | 7 | 0.0% |
| German | 2,086 | 7.8% |
| Greek | 425 | 1.6% |
| Guyanese | 32 | 0.1% |
| Haitian | 6 | 0.0% |
| Honduran | 24 | 0.1% |
| Hungarian | 213 | 0.8% |
| Indian (Asian) | 2,034 | 7.6% |
| Iranian | 49 | 0.2% |
| Iraqi | 26 | 0.1% |
| Irish | 1,993 | 7.5% |
| Iroquois | 12 | 0.1% |
| Israeli | 92 | 0.4% |
| Italian | 3,531 | 13.3% |
| Jamaican | 20 | 0.1% |
| Korean | 163 | 0.6% |
| Laotian | 7 | 0.0% |
| Latvian | 27 | 0.1% |
| Lithuanian | 242 | 0.9% |
| Mexican | 5 | 0.0% |
| Mongolian | 20 | 0.1% |
| Moroccan | 50 | 0.2% |
| Native Hawaiian | 6 | 0.0% |
| Norwegian | 24 | 0.1% |
| Pakistani | 34 | 0.1% |
| Peruvian | 6 | 0.0% |
| Polish | 2,057 | 7.7% |
| Portuguese | 100 | 0.4% |
| Puerto Rican | 414 | 1.6% |
| Romanian | 253 | 0.9% |
| Russian | 2,063 | 7.7% |
| Salvadoran | 59 | 0.2% |
| Scottish | 31 | 0.1% |
| Serbian | 3 | 0.0% |
| Slovak | 29 | 0.1% |
| Slovene | 15 | 0.1% |
| Somali | 7 | 0.0% |
| South American | 249 | 0.9% |
| Spaniard | 170 | 0.6% |
| Spanish | 30 | 0.1% |
| Subsaharan African | 7 | 0.0% |
| Swedish | 46 | 0.2% |
| Swiss | 12 | 0.1% |
| Thai | 1,694 | 6.4% |
| Turkish | 41 | 0.2% |
| Ukrainian | 120 | 0.4% |
| Uruguayan | 21 | 0.1% |
| Vietnamese | 39 | 0.2% |
| Yugoslavian | 16 | 0.1% | View All 76 Rows |
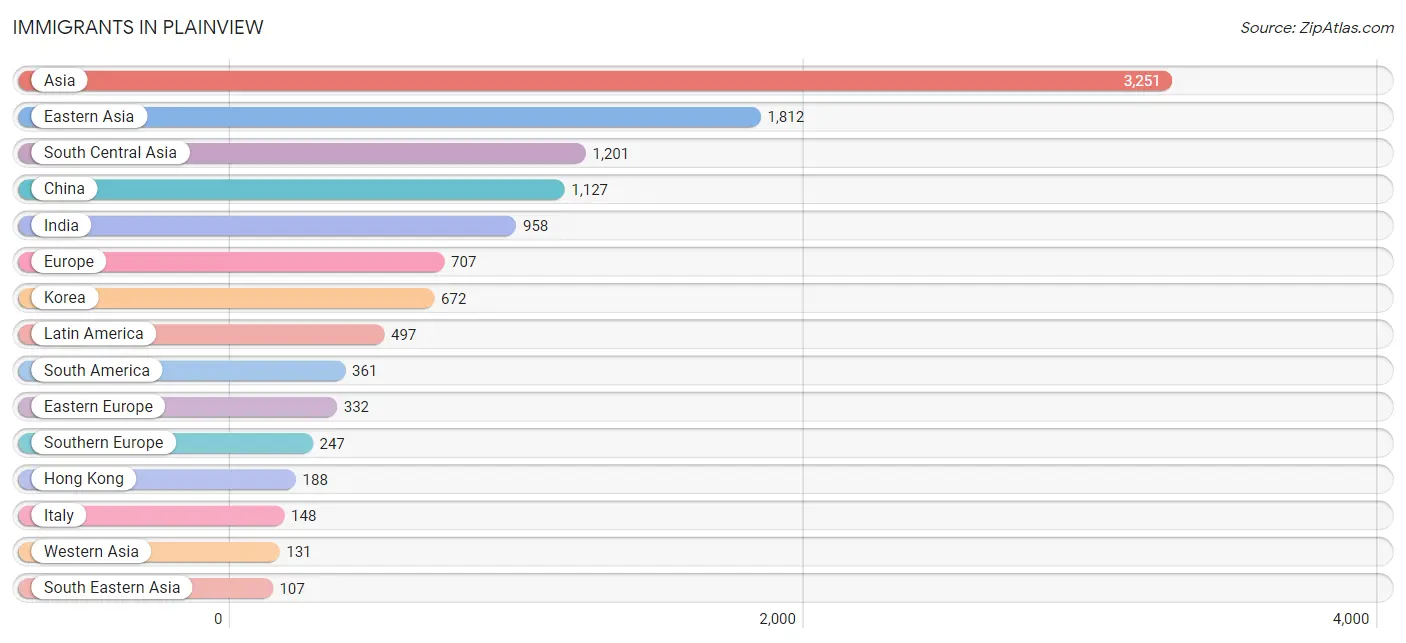
Immigrants in Plainview
The most numerous immigrant groups reported in Plainview came from Asia (3,251 | 12.2%), Eastern Asia (1,812 | 6.8%), South Central Asia (1,201 | 4.5%), China (1,127 | 4.2%), and India (958 | 3.6%), together accounting for 31.4% of all Plainview residents.
| Immigration Origin | # Population | % Population |
| Afghanistan | 36 | 0.1% |
| Africa | 49 | 0.2% |
| Argentina | 83 | 0.3% |
| Asia | 3,251 | 12.2% |
| Austria | 8 | 0.0% |
| Bangladesh | 35 | 0.1% |
| Belgium | 9 | 0.0% |
| Brazil | 48 | 0.2% |
| Canada | 7 | 0.0% |
| Caribbean | 73 | 0.3% |
| Central America | 63 | 0.2% |
| Chile | 5 | 0.0% |
| China | 1,127 | 4.2% |
| Colombia | 62 | 0.2% |
| Croatia | 59 | 0.2% |
| Cuba | 15 | 0.1% |
| Czechoslovakia | 56 | 0.2% |
| Dominican Republic | 32 | 0.1% |
| Eastern Asia | 1,812 | 6.8% |
| Eastern Europe | 332 | 1.3% |
| Ecuador | 72 | 0.3% |
| Egypt | 25 | 0.1% |
| El Salvador | 58 | 0.2% |
| England | 9 | 0.0% |
| Europe | 707 | 2.7% |
| France | 7 | 0.0% |
| Germany | 41 | 0.2% |
| Greece | 89 | 0.3% |
| Guyana | 17 | 0.1% |
| Haiti | 14 | 0.1% |
| Hong Kong | 188 | 0.7% |
| Hungary | 3 | 0.0% |
| India | 958 | 3.6% |
| Indonesia | 7 | 0.0% |
| Iran | 78 | 0.3% |
| Ireland | 31 | 0.1% |
| Israel | 93 | 0.4% |
| Italy | 148 | 0.6% |
| Jamaica | 12 | 0.1% |
| Japan | 13 | 0.1% |
| Korea | 672 | 2.5% |
| Latin America | 497 | 1.9% |
| Malaysia | 13 | 0.1% |
| Mexico | 5 | 0.0% |
| Morocco | 20 | 0.1% |
| Northern Africa | 45 | 0.2% |
| Northern Europe | 55 | 0.2% |
| Pakistan | 84 | 0.3% |
| Peru | 6 | 0.0% |
| Philippines | 49 | 0.2% |
| Poland | 86 | 0.3% |
| Portugal | 10 | 0.0% |
| Romania | 55 | 0.2% |
| Russia | 17 | 0.1% |
| Serbia | 3 | 0.0% |
| Singapore | 10 | 0.0% |
| South Africa | 4 | 0.0% |
| South America | 361 | 1.4% |
| South Central Asia | 1,201 | 4.5% |
| South Eastern Asia | 107 | 0.4% |
| Southern Europe | 247 | 0.9% |
| Switzerland | 8 | 0.0% |
| Taiwan | 33 | 0.1% |
| Thailand | 28 | 0.1% |
| Ukraine | 22 | 0.1% |
| Uruguay | 21 | 0.1% |
| Uzbekistan | 10 | 0.0% |
| Western Asia | 131 | 0.5% |
| Western Europe | 73 | 0.3% | View All 69 Rows |
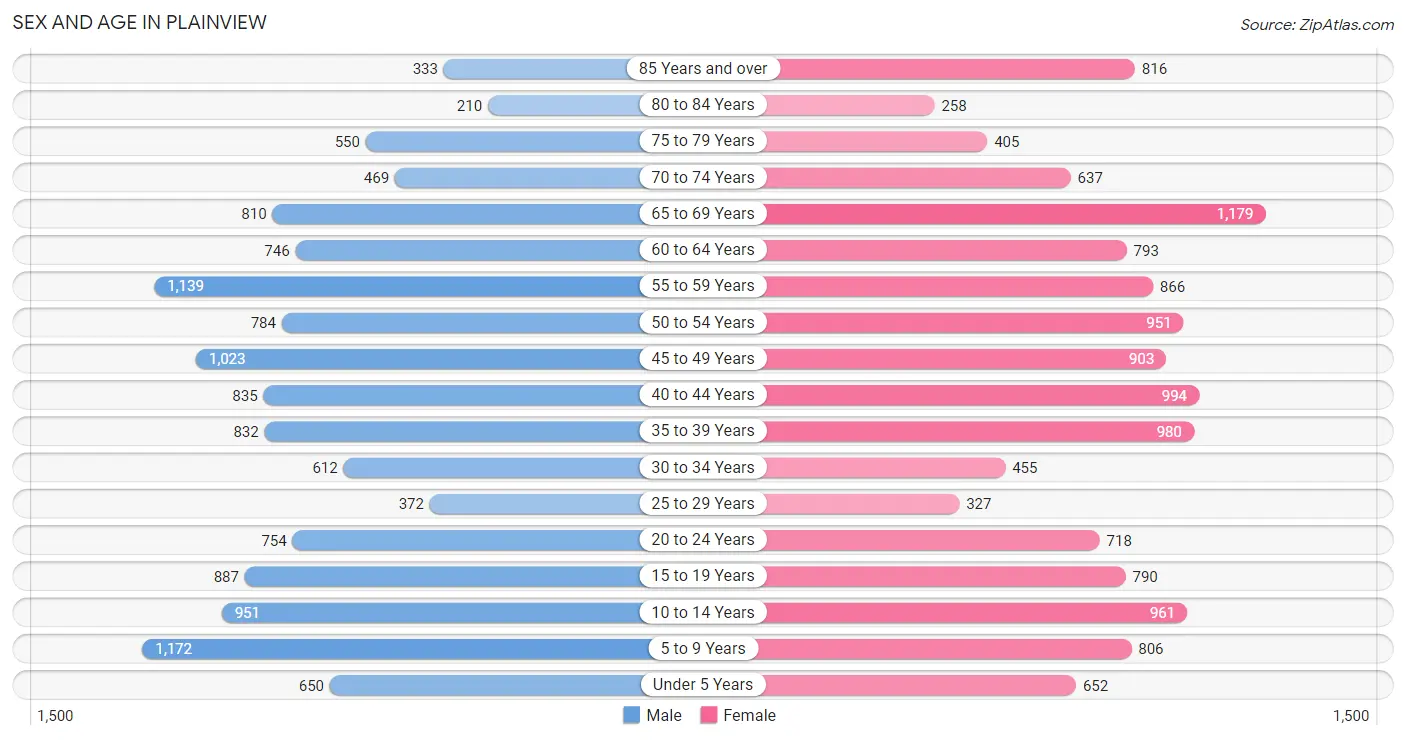
Sex and Age in Plainview
Sex and Age in Plainview
The most populous age groups in Plainview are 5 to 9 Years (1,172 | 8.9%) for men and 65 to 69 Years (1,179 | 8.7%) for women.
| Age Bracket | Male | Female |
| Under 5 Years | 650 (5.0%) | 652 (4.8%) |
| 5 to 9 Years | 1,172 (8.9%) | 806 (6.0%) |
| 10 to 14 Years | 951 (7.2%) | 961 (7.1%) |
| 15 to 19 Years | 887 (6.8%) | 790 (5.9%) |
| 20 to 24 Years | 754 (5.7%) | 718 (5.3%) |
| 25 to 29 Years | 372 (2.8%) | 327 (2.4%) |
| 30 to 34 Years | 612 (4.7%) | 455 (3.4%) |
| 35 to 39 Years | 832 (6.3%) | 980 (7.3%) |
| 40 to 44 Years | 835 (6.4%) | 994 (7.4%) |
| 45 to 49 Years | 1,023 (7.8%) | 903 (6.7%) |
| 50 to 54 Years | 784 (6.0%) | 951 (7.0%) |
| 55 to 59 Years | 1,139 (8.7%) | 866 (6.4%) |
| 60 to 64 Years | 746 (5.7%) | 793 (5.9%) |
| 65 to 69 Years | 810 (6.2%) | 1,179 (8.7%) |
| 70 to 74 Years | 469 (3.6%) | 637 (4.7%) |
| 75 to 79 Years | 550 (4.2%) | 405 (3.0%) |
| 80 to 84 Years | 210 (1.6%) | 258 (1.9%) |
| 85 Years and over | 333 (2.5%) | 816 (6.0%) |
| Total | 13,129 (100.0%) | 13,491 (100.0%) |
Families and Households in Plainview
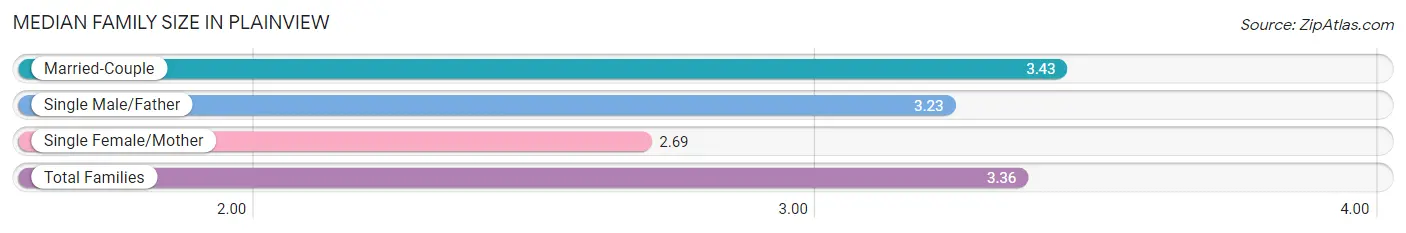
Median Family Size in Plainview
The median family size in Plainview is 3.36 persons per family, with married-couple families (6,444 | 89.0%) accounting for the largest median family size of 3.43 persons per family. On the other hand, single female/mother families (609 | 8.4%) represent the smallest median family size with 2.69 persons per family.
| Family Type | # Families | Family Size |
| Married-Couple | 6,444 (89.0%) | 3.43 |
| Single Male/Father | 190 (2.6%) | 3.23 |
| Single Female/Mother | 609 (8.4%) | 2.69 |
| Total Families | 7,243 (100.0%) | 3.36 |
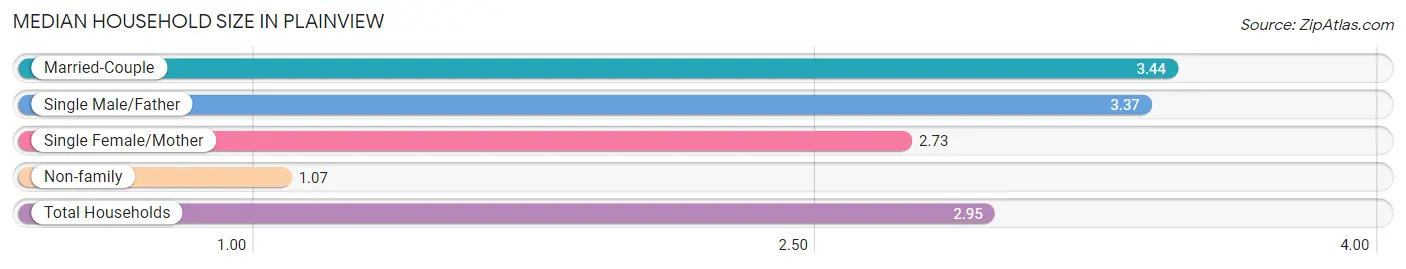
Median Household Size in Plainview
The median household size in Plainview is 2.95 persons per household, with married-couple households (6,444 | 72.2%) accounting for the largest median household size of 3.44 persons per household. non-family households (1,680 | 18.8%) represent the smallest median household size with 1.07 persons per household.
| Household Type | # Households | Household Size |
| Married-Couple | 6,444 (72.2%) | 3.44 |
| Single Male/Father | 190 (2.1%) | 3.37 |
| Single Female/Mother | 609 (6.8%) | 2.73 |
| Non-family | 1,680 (18.8%) | 1.07 |
| Total Households | 8,923 (100.0%) | 2.95 |
Household Size by Marriage Status in Plainview
Out of a total of 8,923 households in Plainview, 7,243 (81.2%) are family households, while 1,680 (18.8%) are nonfamily households. The most numerous type of family households are 2-person households, comprising 2,376, and the most common type of nonfamily households are 1-person households, comprising 1,582.
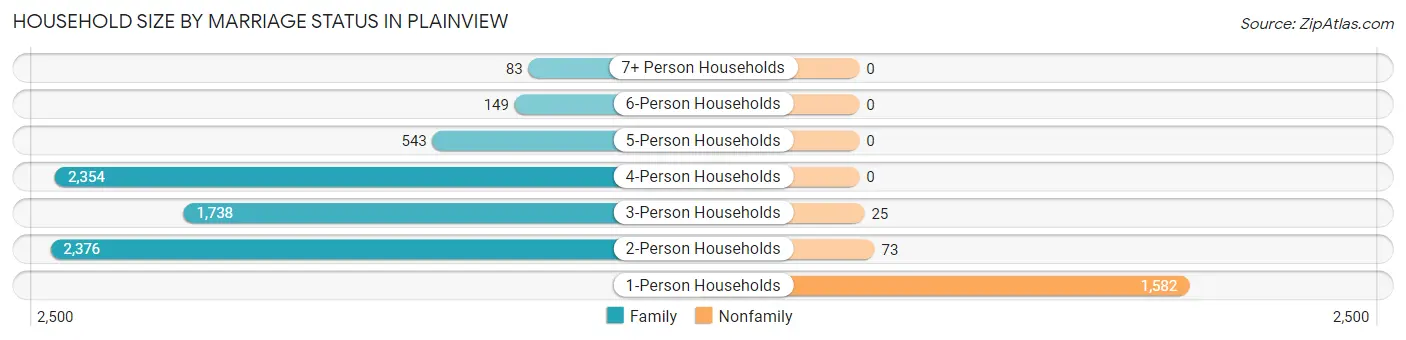
| Household Size | Family Households | Nonfamily Households |
| 1-Person Households | - | 1,582 (17.7%) |
| 2-Person Households | 2,376 (26.6%) | 73 (0.8%) |
| 3-Person Households | 1,738 (19.5%) | 25 (0.3%) |
| 4-Person Households | 2,354 (26.4%) | 0 (0.0%) |
| 5-Person Households | 543 (6.1%) | 0 (0.0%) |
| 6-Person Households | 149 (1.7%) | 0 (0.0%) |
| 7+ Person Households | 83 (0.9%) | 0 (0.0%) |
| Total | 7,243 (81.2%) | 1,680 (18.8%) |
Female Fertility in Plainview
Fertility by Age in Plainview
Average fertility rate in Plainview is 47.0 births per 1,000 women. Women in the age bracket of 20 to 34 years have the highest fertility rate with 84.0 births per 1,000 women. Women in the age bracket of 20 to 34 years acount for 50.4% of all women with births.
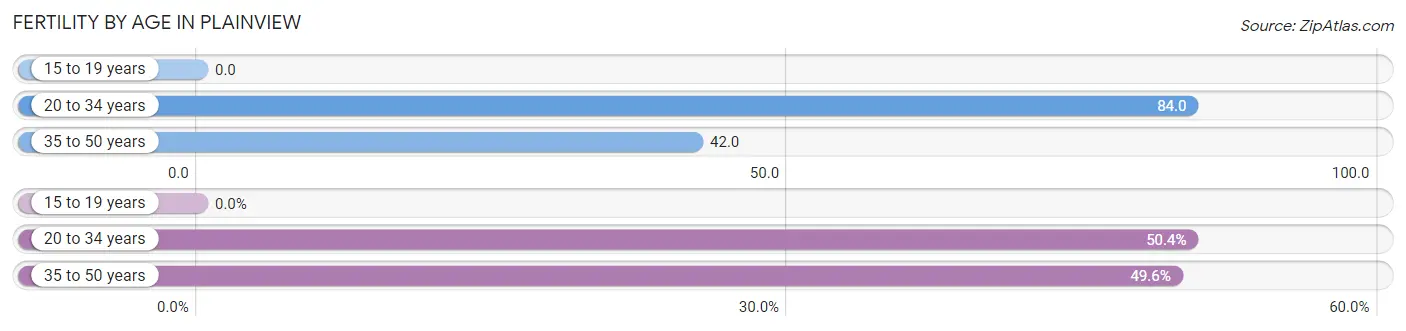
| Age Bracket | Women with Births | Births / 1,000 Women |
| 15 to 19 years | 0 (0.0%) | 0.0 |
| 20 to 34 years | 126 (50.4%) | 84.0 |
| 35 to 50 years | 124 (49.6%) | 42.0 |
| Total | 250 (100.0%) | 47.0 |
Fertility by Age by Marriage Status in Plainview
82.0% of women with births (250) in Plainview are married. The highest percentage of unmarried women with births falls into 20 to 34 years age bracket with 35.7% of them unmarried at the time of birth, while the lowest percentage of unmarried women with births belong to 35 to 50 years age bracket with 0.0% of them unmarried.
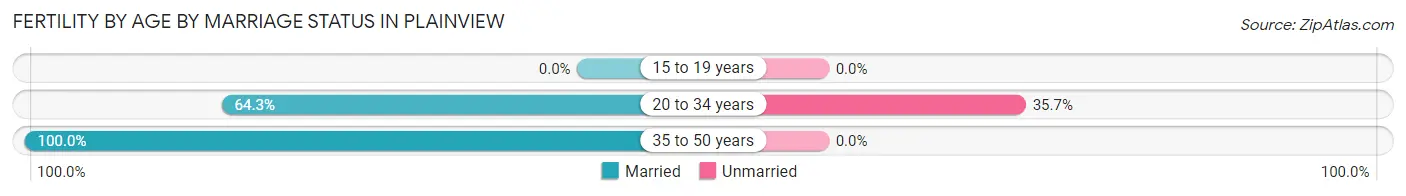
| Age Bracket | Married | Unmarried |
| 15 to 19 years | 0 (0.0%) | 0 (0.0%) |
| 20 to 34 years | 81 (64.3%) | 45 (35.7%) |
| 35 to 50 years | 124 (100.0%) | 0 (0.0%) |
| Total | 205 (82.0%) | 45 (18.0%) |
Fertility by Education in Plainview
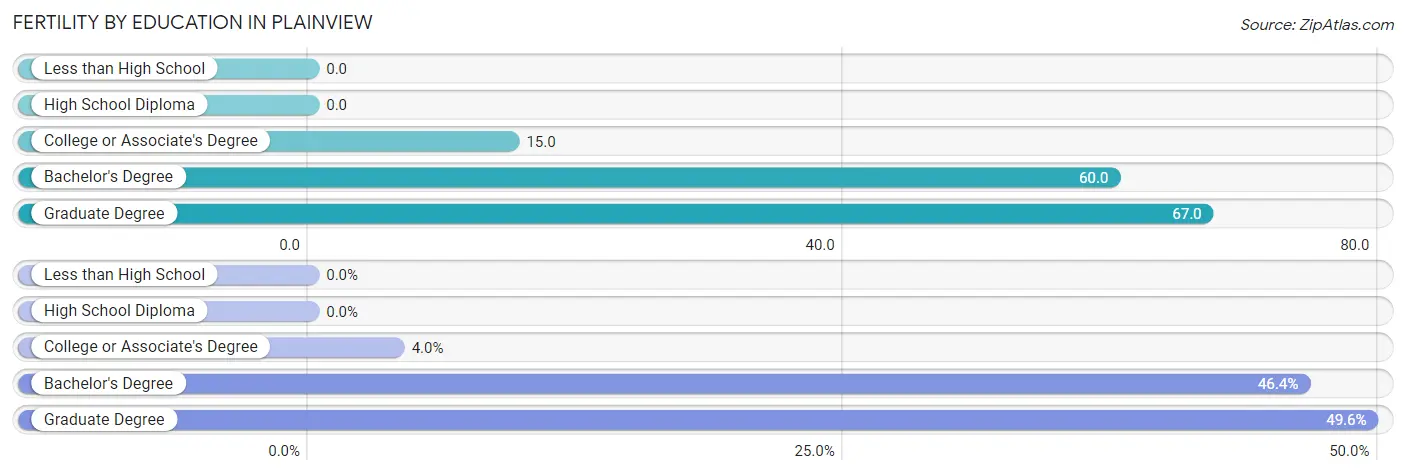
| Educational Attainment | Women with Births | Births / 1,000 Women |
| Less than High School | 0 (0.0%) | 0.0 |
| High School Diploma | 0 (0.0%) | 0.0 |
| College or Associate's Degree | 10 (4.0%) | 15.0 |
| Bachelor's Degree | 116 (46.4%) | 60.0 |
| Graduate Degree | 124 (49.6%) | 67.0 |
| Total | 250 (100.0%) | 47.0 |
Fertility by Education by Marriage Status in Plainview
18.0% of women with births in Plainview are unmarried. Women with the educational attainment of graduate degree are most likely to be married with 100.0% of them married at childbirth, while women with the educational attainment of college or associate's degree are least likely to be married with 100.0% of them unmarried at childbirth.
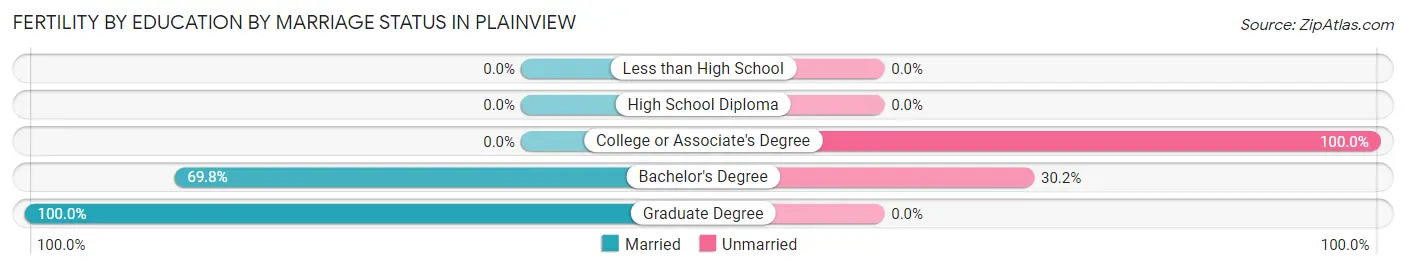
| Educational Attainment | Married | Unmarried |
| Less than High School | 0 (0.0%) | 0 (0.0%) |
| High School Diploma | 0 (0.0%) | 0 (0.0%) |
| College or Associate's Degree | 0 (0.0%) | 10 (100.0%) |
| Bachelor's Degree | 81 (69.8%) | 35 (30.2%) |
| Graduate Degree | 124 (100.0%) | 0 (0.0%) |
| Total | 205 (82.0%) | 45 (18.0%) |
Employment Characteristics in Plainview
Employment by Class of Employer in Plainview
Among the 13,379 employed individuals in Plainview, private company employees (7,955 | 59.5%), local government employees (2,021 | 15.1%), and not-for-profit organizations (1,295 | 9.7%) make up the most common classes of employment.
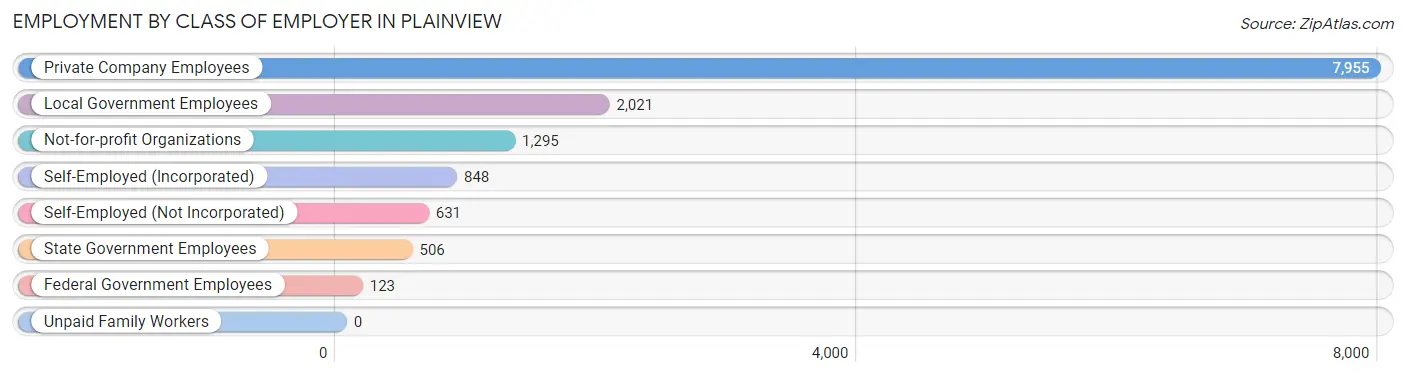
| Employer Class | # Employees | % Employees |
| Private Company Employees | 7,955 | 59.5% |
| Self-Employed (Incorporated) | 848 | 6.3% |
| Self-Employed (Not Incorporated) | 631 | 4.7% |
| Not-for-profit Organizations | 1,295 | 9.7% |
| Local Government Employees | 2,021 | 15.1% |
| State Government Employees | 506 | 3.8% |
| Federal Government Employees | 123 | 0.9% |
| Unpaid Family Workers | 0 | 0.0% |
| Total | 13,379 | 100.0% |
Employment Status by Age in Plainview
According to the labor force statistics for Plainview, out of the total population over 16 years of age (21,056), 66.6% or 14,023 individuals are in the labor force, with 2.7% or 379 of them unemployed. The age group with the highest labor force participation rate is 25 to 29 years, with 92.8% or 649 individuals in the labor force. Within the labor force, the 16 to 19 years age range has the highest percentage of unemployed individuals, with 7.4% or 39 of them being unemployed.
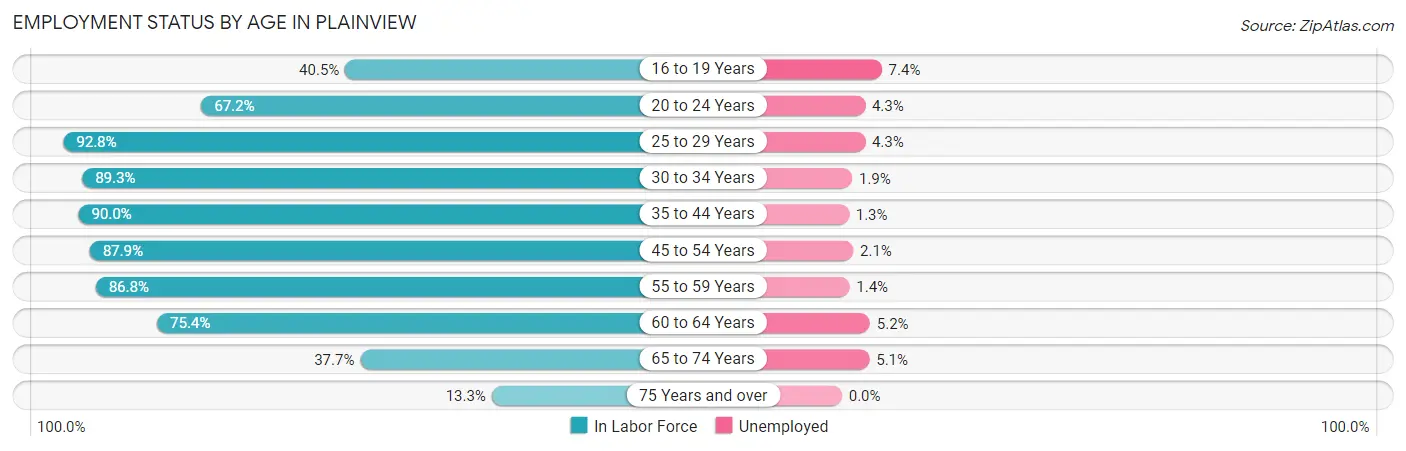
| Age Bracket | In Labor Force | Unemployed |
| 16 to 19 Years | 529 (40.5%) | 39 (7.4%) |
| 20 to 24 Years | 989 (67.2%) | 43 (4.3%) |
| 25 to 29 Years | 649 (92.8%) | 28 (4.3%) |
| 30 to 34 Years | 953 (89.3%) | 18 (1.9%) |
| 35 to 44 Years | 3,277 (90.0%) | 43 (1.3%) |
| 45 to 54 Years | 3,218 (87.9%) | 68 (2.1%) |
| 55 to 59 Years | 1,740 (86.8%) | 24 (1.4%) |
| 60 to 64 Years | 1,160 (75.4%) | 60 (5.2%) |
| 65 to 74 Years | 1,167 (37.7%) | 60 (5.1%) |
| 75 Years and over | 342 (13.3%) | 0 (0.0%) |
| Total | 14,023 (66.6%) | 379 (2.7%) |
Employment Status by Educational Attainment in Plainview
According to labor force statistics for Plainview, 87.2% of individuals (10,998) out of the total population between 25 and 64 years of age (12,612) are in the labor force, with 2.2% or 242 of them being unemployed. The group with the highest labor force participation rate are those with the educational attainment of bachelor's degree or higher, with 90.9% or 8,805 individuals in the labor force. Within the labor force, individuals with less than high school education have the highest percentage of unemployment, with 13.3% or 16 of them being unemployed.
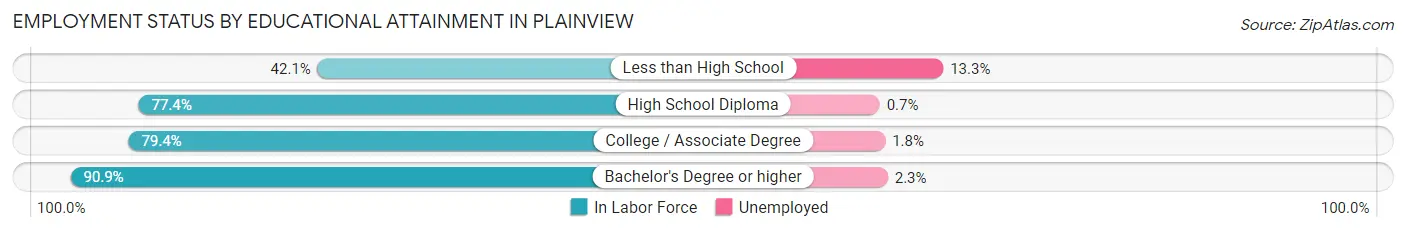
| Educational Attainment | In Labor Force | Unemployed |
| Less than High School | 120 (42.1%) | 38 (13.3%) |
| High School Diploma | 889 (77.4%) | 8 (0.7%) |
| College / Associate Degree | 1,185 (79.4%) | 27 (1.8%) |
| Bachelor's Degree or higher | 8,805 (90.9%) | 223 (2.3%) |
| Total | 10,998 (87.2%) | 277 (2.2%) |
Employment Occupations by Sex in Plainview
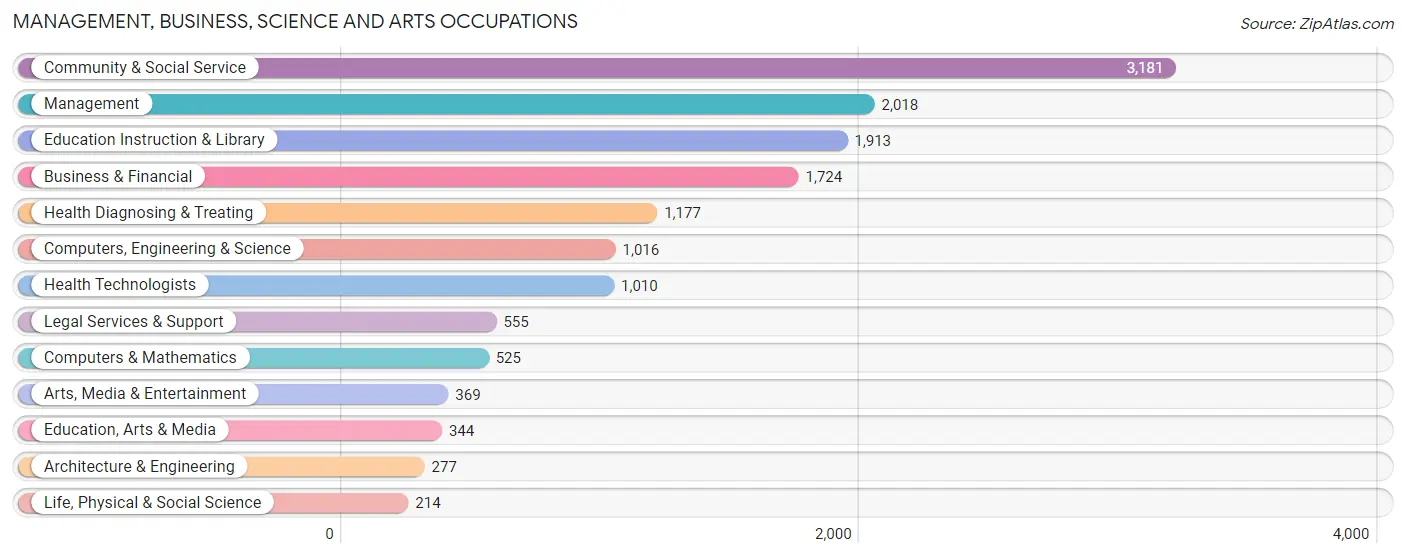
Management, Business, Science and Arts Occupations
The most common Management, Business, Science and Arts occupations in Plainview are Community & Social Service (3,181 | 23.3%), Management (2,018 | 14.8%), Education Instruction & Library (1,913 | 14.0%), Business & Financial (1,724 | 12.6%), and Health Diagnosing & Treating (1,177 | 8.6%).
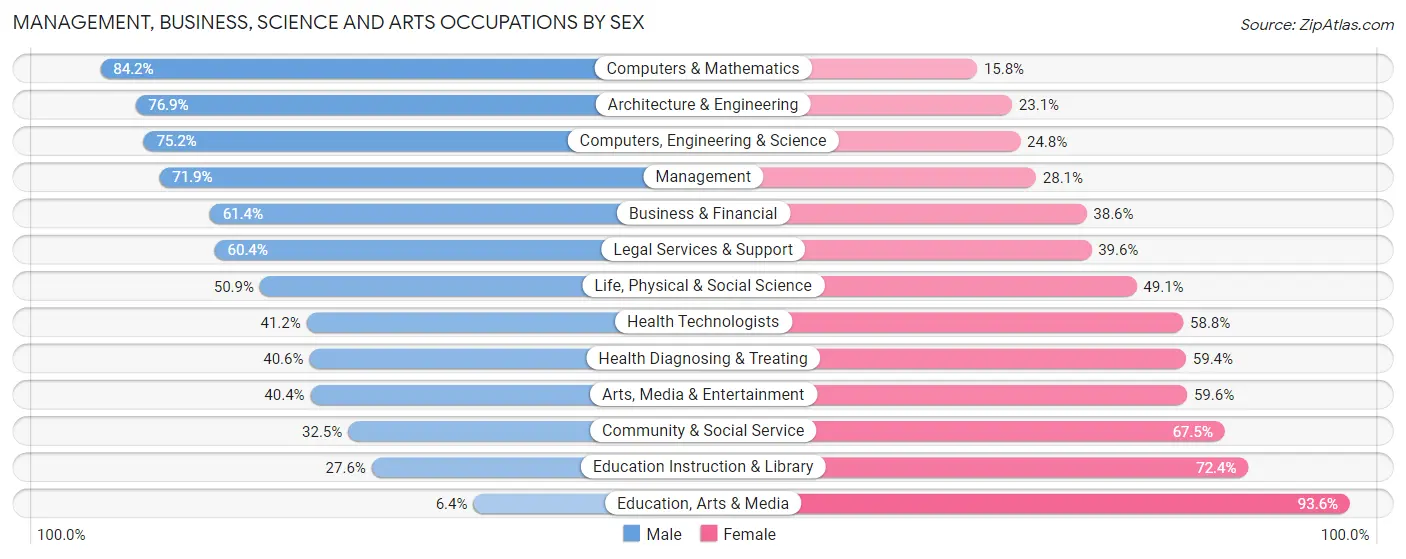
Management, Business, Science and Arts Occupations by Sex
Within the Management, Business, Science and Arts occupations in Plainview, the most male-oriented occupations are Computers & Mathematics (84.2%), Architecture & Engineering (76.9%), and Computers, Engineering & Science (75.2%), while the most female-oriented occupations are Education, Arts & Media (93.6%), Education Instruction & Library (72.4%), and Community & Social Service (67.5%).
| Occupation | Male | Female |
| Management | 1,451 (71.9%) | 567 (28.1%) |
| Business & Financial | 1,058 (61.4%) | 666 (38.6%) |
| Computers, Engineering & Science | 764 (75.2%) | 252 (24.8%) |
| Computers & Mathematics | 442 (84.2%) | 83 (15.8%) |
| Architecture & Engineering | 213 (76.9%) | 64 (23.1%) |
| Life, Physical & Social Science | 109 (50.9%) | 105 (49.1%) |
| Community & Social Service | 1,034 (32.5%) | 2,147 (67.5%) |
| Education, Arts & Media | 22 (6.4%) | 322 (93.6%) |
| Legal Services & Support | 335 (60.4%) | 220 (39.6%) |
| Education Instruction & Library | 528 (27.6%) | 1,385 (72.4%) |
| Arts, Media & Entertainment | 149 (40.4%) | 220 (59.6%) |
| Health Diagnosing & Treating | 478 (40.6%) | 699 (59.4%) |
| Health Technologists | 416 (41.2%) | 594 (58.8%) |
| Total (Category) | 4,785 (52.5%) | 4,331 (47.5%) |
| Total (Overall) | 7,035 (51.6%) | 6,607 (48.4%) |
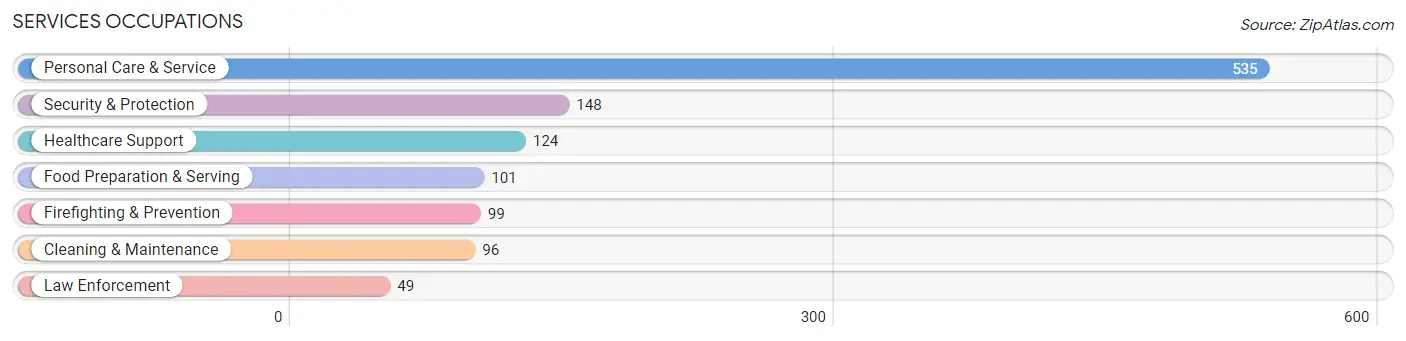
Services Occupations
The most common Services occupations in Plainview are Personal Care & Service (535 | 3.9%), Security & Protection (148 | 1.1%), Healthcare Support (124 | 0.9%), Food Preparation & Serving (101 | 0.7%), and Firefighting & Prevention (99 | 0.7%).
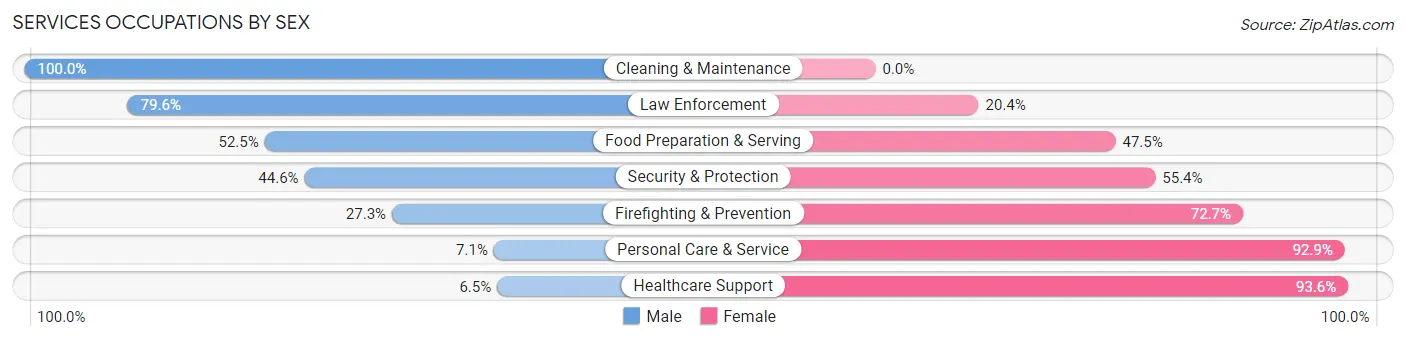
Services Occupations by Sex
Within the Services occupations in Plainview, the most male-oriented occupations are Cleaning & Maintenance (100.0%), Law Enforcement (79.6%), and Food Preparation & Serving (52.5%), while the most female-oriented occupations are Healthcare Support (93.5%), Personal Care & Service (92.9%), and Firefighting & Prevention (72.7%).
| Occupation | Male | Female |
| Healthcare Support | 8 (6.5%) | 116 (93.5%) |
| Security & Protection | 66 (44.6%) | 82 (55.4%) |
| Firefighting & Prevention | 27 (27.3%) | 72 (72.7%) |
| Law Enforcement | 39 (79.6%) | 10 (20.4%) |
| Food Preparation & Serving | 53 (52.5%) | 48 (47.5%) |
| Cleaning & Maintenance | 96 (100.0%) | 0 (0.0%) |
| Personal Care & Service | 38 (7.1%) | 497 (92.9%) |
| Total (Category) | 261 (26.0%) | 743 (74.0%) |
| Total (Overall) | 7,035 (51.6%) | 6,607 (48.4%) |
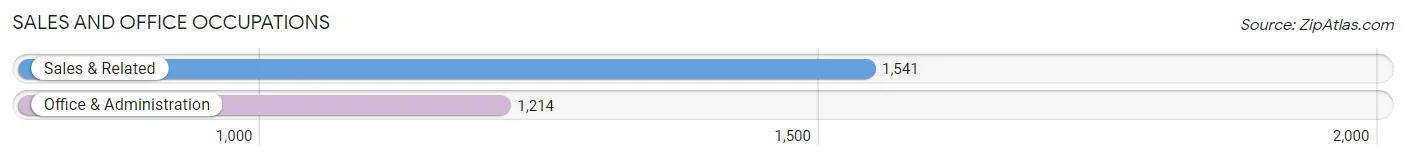
Sales and Office Occupations
The most common Sales and Office occupations in Plainview are Sales & Related (1,541 | 11.3%), and Office & Administration (1,214 | 8.9%).
Sales and Office Occupations by Sex
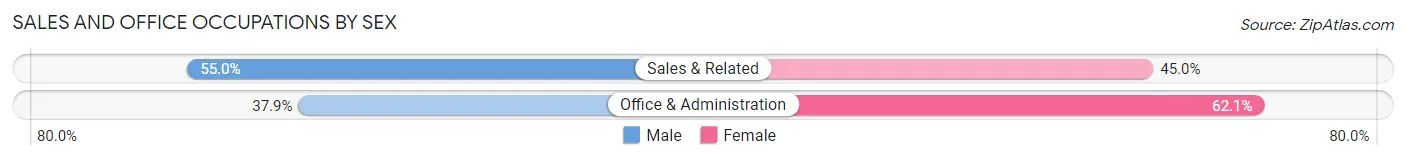
| Occupation | Male | Female |
| Sales & Related | 847 (55.0%) | 694 (45.0%) |
| Office & Administration | 460 (37.9%) | 754 (62.1%) |
| Total (Category) | 1,307 (47.4%) | 1,448 (52.6%) |
| Total (Overall) | 7,035 (51.6%) | 6,607 (48.4%) |
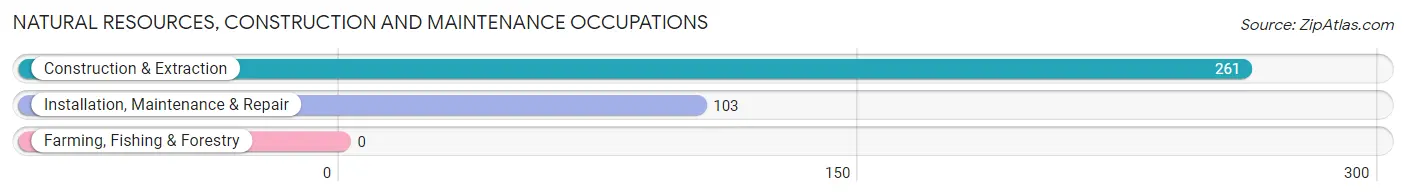
Natural Resources, Construction and Maintenance Occupations
The most common Natural Resources, Construction and Maintenance occupations in Plainview are Construction & Extraction (261 | 1.9%), and Installation, Maintenance & Repair (103 | 0.8%).
Natural Resources, Construction and Maintenance Occupations by Sex
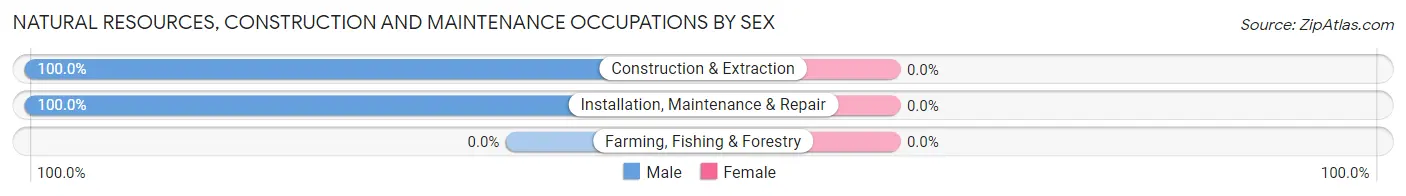
| Occupation | Male | Female |
| Farming, Fishing & Forestry | 0 (0.0%) | 0 (0.0%) |
| Construction & Extraction | 261 (100.0%) | 0 (0.0%) |
| Installation, Maintenance & Repair | 103 (100.0%) | 0 (0.0%) |
| Total (Category) | 364 (100.0%) | 0 (0.0%) |
| Total (Overall) | 7,035 (51.6%) | 6,607 (48.4%) |
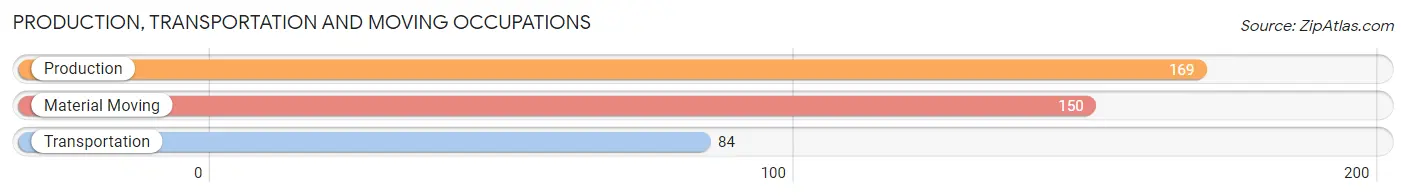
Production, Transportation and Moving Occupations
The most common Production, Transportation and Moving occupations in Plainview are Production (169 | 1.2%), Material Moving (150 | 1.1%), and Transportation (84 | 0.6%).
Production, Transportation and Moving Occupations by Sex
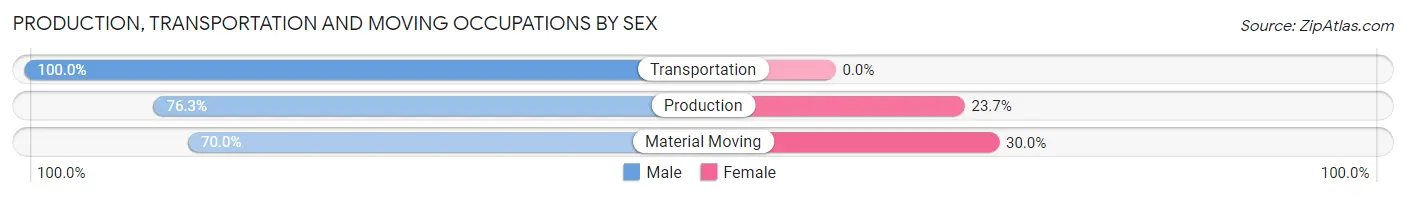
| Occupation | Male | Female |
| Production | 129 (76.3%) | 40 (23.7%) |
| Transportation | 84 (100.0%) | 0 (0.0%) |
| Material Moving | 105 (70.0%) | 45 (30.0%) |
| Total (Category) | 318 (78.9%) | 85 (21.1%) |
| Total (Overall) | 7,035 (51.6%) | 6,607 (48.4%) |
Employment Industries by Sex in Plainview
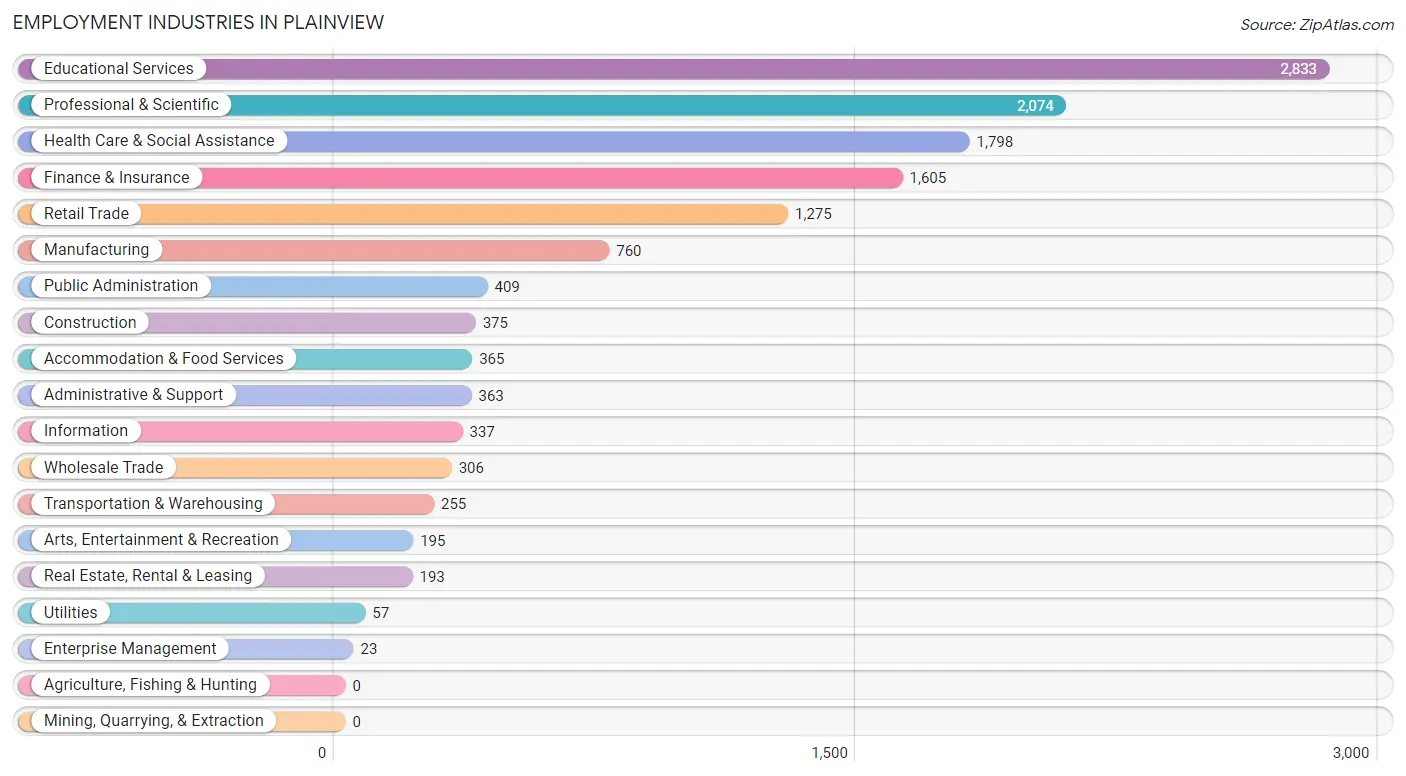
Employment Industries in Plainview
The major employment industries in Plainview include Educational Services (2,833 | 20.8%), Professional & Scientific (2,074 | 15.2%), Health Care & Social Assistance (1,798 | 13.2%), Finance & Insurance (1,605 | 11.8%), and Retail Trade (1,275 | 9.3%).
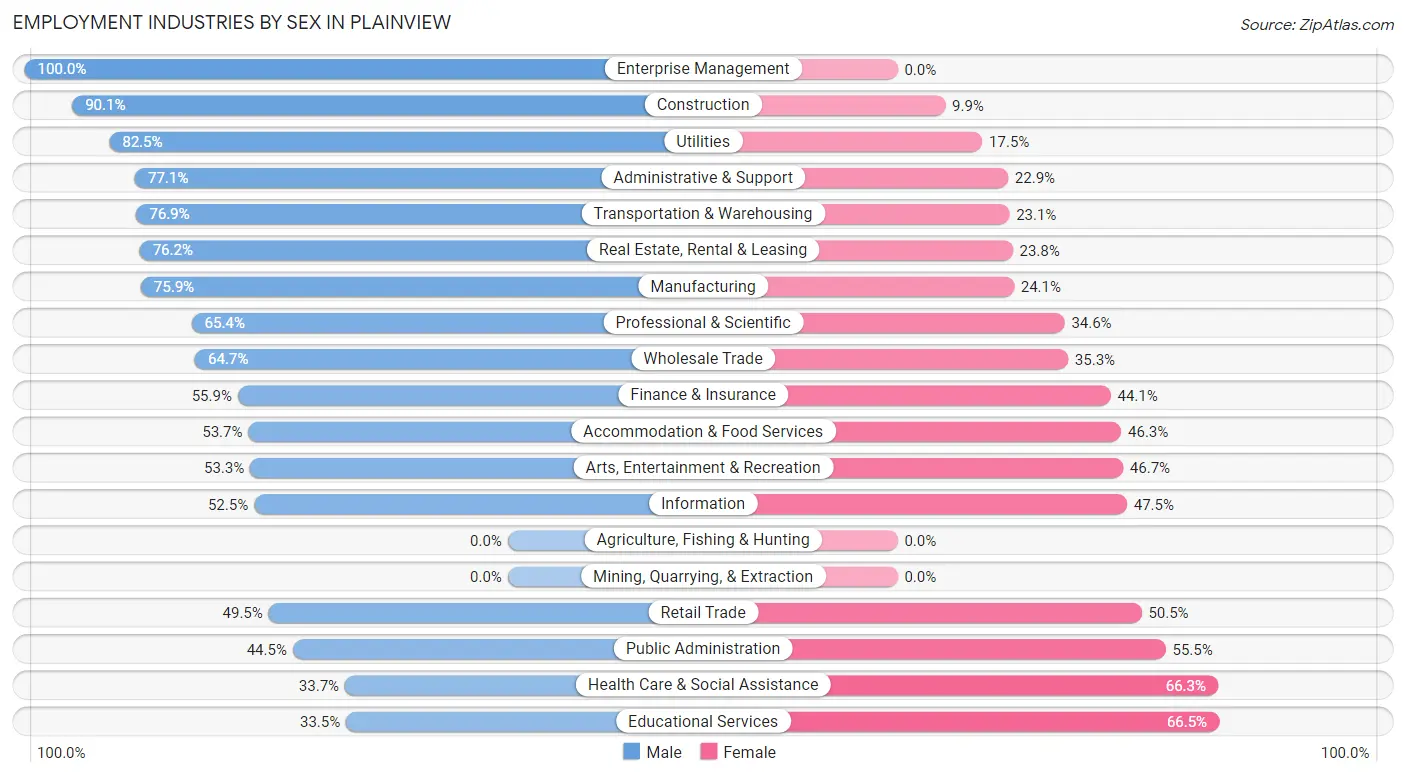
Employment Industries by Sex in Plainview
The Plainview industries that see more men than women are Enterprise Management (100.0%), Construction (90.1%), and Utilities (82.5%), whereas the industries that tend to have a higher number of women are Educational Services (66.5%), Health Care & Social Assistance (66.3%), and Public Administration (55.5%).
| Industry | Male | Female |
| Agriculture, Fishing & Hunting | 0 (0.0%) | 0 (0.0%) |
| Mining, Quarrying, & Extraction | 0 (0.0%) | 0 (0.0%) |
| Construction | 338 (90.1%) | 37 (9.9%) |
| Manufacturing | 577 (75.9%) | 183 (24.1%) |
| Wholesale Trade | 198 (64.7%) | 108 (35.3%) |
| Retail Trade | 631 (49.5%) | 644 (50.5%) |
| Transportation & Warehousing | 196 (76.9%) | 59 (23.1%) |
| Utilities | 47 (82.5%) | 10 (17.5%) |
| Information | 177 (52.5%) | 160 (47.5%) |
| Finance & Insurance | 897 (55.9%) | 708 (44.1%) |
| Real Estate, Rental & Leasing | 147 (76.2%) | 46 (23.8%) |
| Professional & Scientific | 1,357 (65.4%) | 717 (34.6%) |
| Enterprise Management | 23 (100.0%) | 0 (0.0%) |
| Administrative & Support | 280 (77.1%) | 83 (22.9%) |
| Educational Services | 948 (33.5%) | 1,885 (66.5%) |
| Health Care & Social Assistance | 606 (33.7%) | 1,192 (66.3%) |
| Arts, Entertainment & Recreation | 104 (53.3%) | 91 (46.7%) |
| Accommodation & Food Services | 196 (53.7%) | 169 (46.3%) |
| Public Administration | 182 (44.5%) | 227 (55.5%) |
| Total | 7,035 (51.6%) | 6,607 (48.4%) |
Education in Plainview
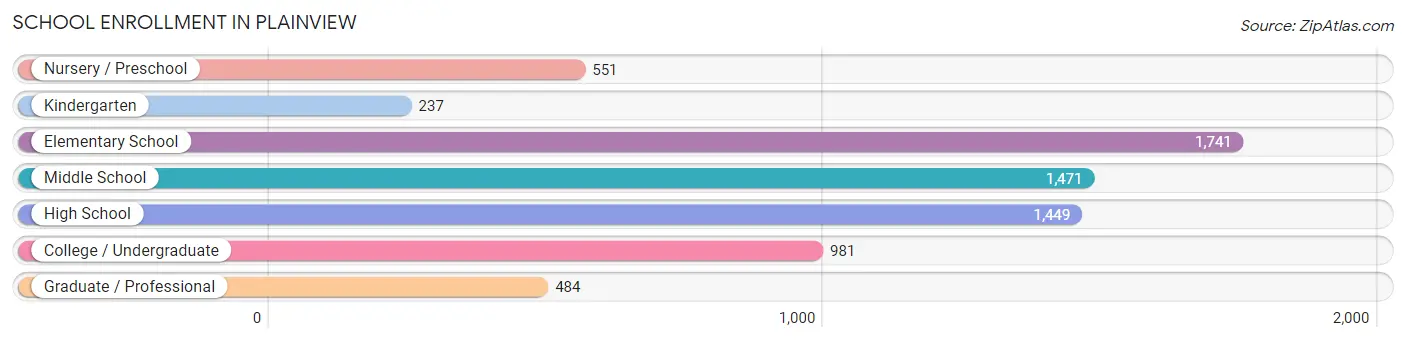
School Enrollment in Plainview
The most common levels of schooling among the 6,914 students in Plainview are elementary school (1,741 | 25.2%), middle school (1,471 | 21.3%), and high school (1,449 | 21.0%).
| School Level | # Students | % Students |
| Nursery / Preschool | 551 | 8.0% |
| Kindergarten | 237 | 3.4% |
| Elementary School | 1,741 | 25.2% |
| Middle School | 1,471 | 21.3% |
| High School | 1,449 | 21.0% |
| College / Undergraduate | 981 | 14.2% |
| Graduate / Professional | 484 | 7.0% |
| Total | 6,914 | 100.0% |
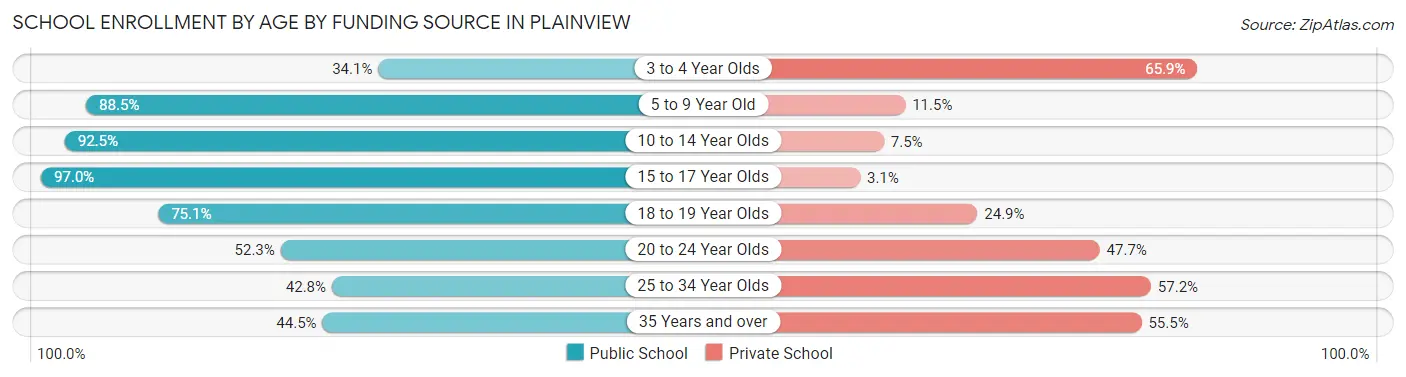
School Enrollment by Age by Funding Source in Plainview
Out of a total of 6,914 students who are enrolled in schools in Plainview, 1,410 (20.4%) attend a private institution, while the remaining 5,504 (79.6%) are enrolled in public schools. The age group of 3 to 4 year olds has the highest likelihood of being enrolled in private schools, with 303 (65.9% in the age bracket) enrolled. Conversely, the age group of 15 to 17 year olds has the lowest likelihood of being enrolled in a private school, with 984 (97.0% in the age bracket) attending a public institution.
| Age Bracket | Public School | Private School |
| 3 to 4 Year Olds | 157 (34.1%) | 303 (65.9%) |
| 5 to 9 Year Old | 1,722 (88.5%) | 223 (11.5%) |
| 10 to 14 Year Olds | 1,705 (92.5%) | 138 (7.5%) |
| 15 to 17 Year Olds | 984 (97.0%) | 31 (3.0%) |
| 18 to 19 Year Olds | 359 (75.1%) | 119 (24.9%) |
| 20 to 24 Year Olds | 394 (52.3%) | 359 (47.7%) |
| 25 to 34 Year Olds | 74 (42.8%) | 99 (57.2%) |
| 35 Years and over | 110 (44.5%) | 137 (55.5%) |
| Total | 5,504 (79.6%) | 1,410 (20.4%) |
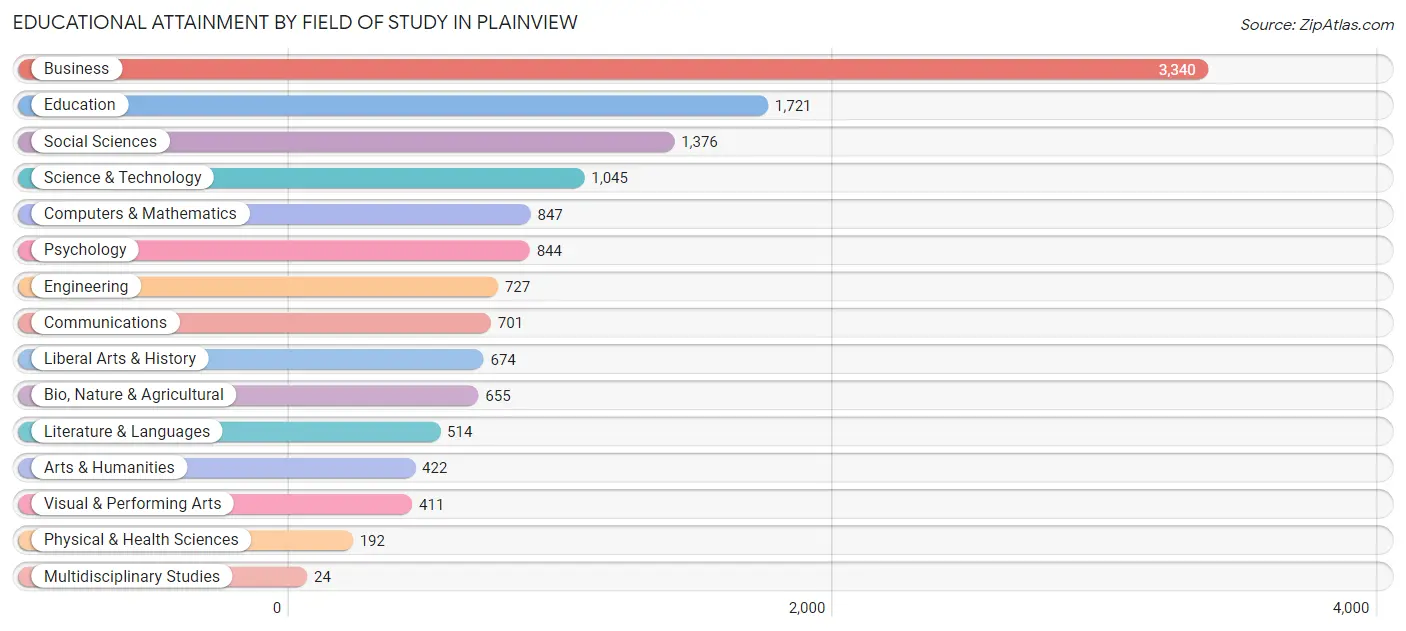
Educational Attainment by Field of Study in Plainview
Business (3,340 | 24.7%), education (1,721 | 12.8%), social sciences (1,376 | 10.2%), science & technology (1,045 | 7.7%), and computers & mathematics (847 | 6.3%) are the most common fields of study among 13,493 individuals in Plainview who have obtained a bachelor's degree or higher.
| Field of Study | # Graduates | % Graduates |
| Computers & Mathematics | 847 | 6.3% |
| Bio, Nature & Agricultural | 655 | 4.9% |
| Physical & Health Sciences | 192 | 1.4% |
| Psychology | 844 | 6.3% |
| Social Sciences | 1,376 | 10.2% |
| Engineering | 727 | 5.4% |
| Multidisciplinary Studies | 24 | 0.2% |
| Science & Technology | 1,045 | 7.7% |
| Business | 3,340 | 24.7% |
| Education | 1,721 | 12.8% |
| Literature & Languages | 514 | 3.8% |
| Liberal Arts & History | 674 | 5.0% |
| Visual & Performing Arts | 411 | 3.0% |
| Communications | 701 | 5.2% |
| Arts & Humanities | 422 | 3.1% |
| Total | 13,493 | 100.0% |
Transportation & Commute in Plainview
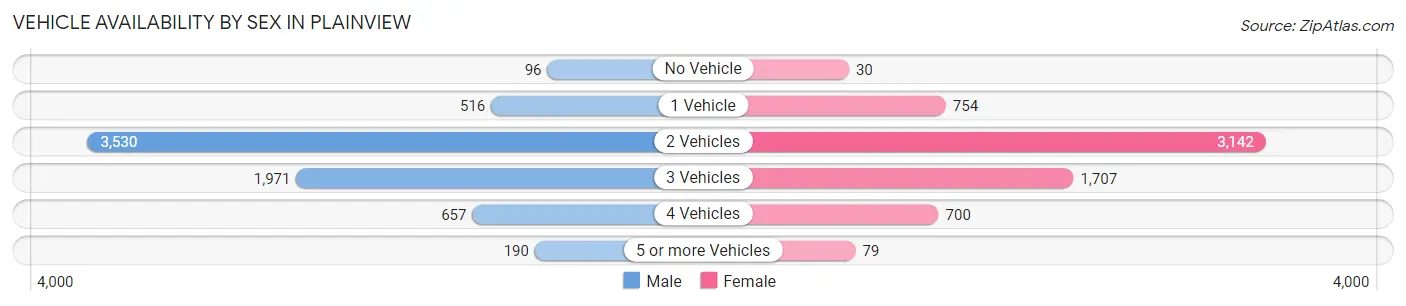
Vehicle Availability by Sex in Plainview
The most prevalent vehicle ownership categories in Plainview are males with 2 vehicles (3,530, accounting for 50.7%) and females with 2 vehicles (3,142, making up 55.0%).
| Vehicles Available | Male | Female |
| No Vehicle | 96 (1.4%) | 30 (0.5%) |
| 1 Vehicle | 516 (7.4%) | 754 (11.8%) |
| 2 Vehicles | 3,530 (50.7%) | 3,142 (49.0%) |
| 3 Vehicles | 1,971 (28.3%) | 1,707 (26.6%) |
| 4 Vehicles | 657 (9.4%) | 700 (10.9%) |
| 5 or more Vehicles | 190 (2.7%) | 79 (1.2%) |
| Total | 6,960 (100.0%) | 6,412 (100.0%) |
Commute Time in Plainview
The most frequently occuring commute durations in Plainview are 30 to 34 minutes (1,486 commuters, 14.0%), 60 to 89 minutes (1,422 commuters, 13.4%), and 10 to 14 minutes (1,277 commuters, 12.0%).
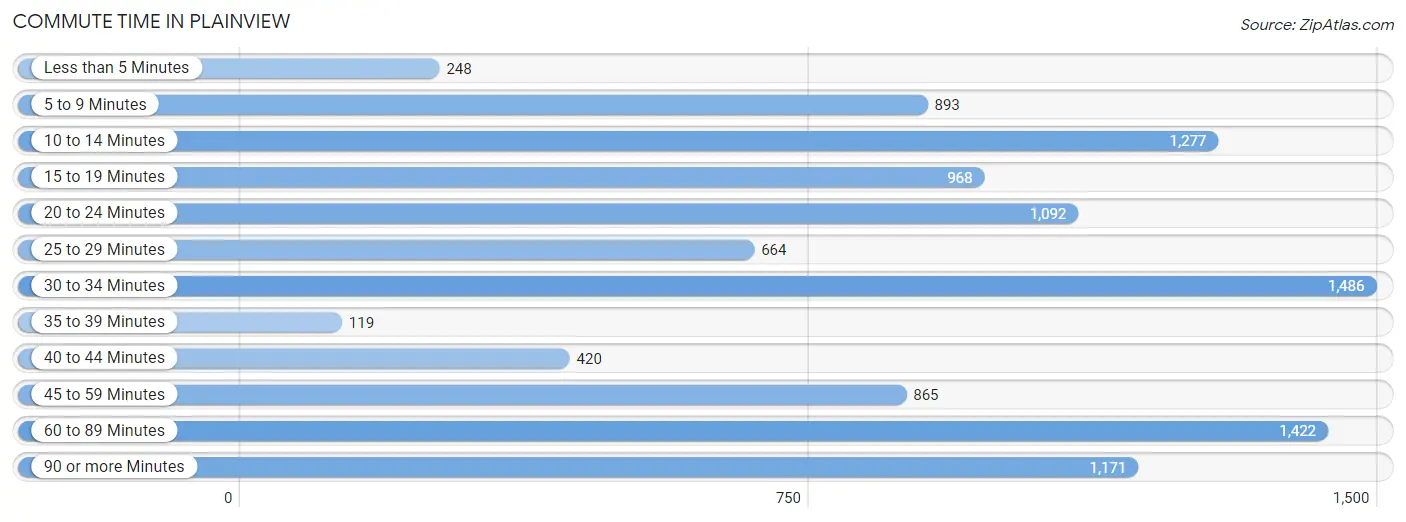
| Commute Time | # Commuters | % Commuters |
| Less than 5 Minutes | 248 | 2.3% |
| 5 to 9 Minutes | 893 | 8.4% |
| 10 to 14 Minutes | 1,277 | 12.0% |
| 15 to 19 Minutes | 968 | 9.1% |
| 20 to 24 Minutes | 1,092 | 10.3% |
| 25 to 29 Minutes | 664 | 6.2% |
| 30 to 34 Minutes | 1,486 | 14.0% |
| 35 to 39 Minutes | 119 | 1.1% |
| 40 to 44 Minutes | 420 | 4.0% |
| 45 to 59 Minutes | 865 | 8.1% |
| 60 to 89 Minutes | 1,422 | 13.4% |
| 90 or more Minutes | 1,171 | 11.0% |
Commute Time by Sex in Plainview
The most common commute times in Plainview are 60 to 89 minutes (887 commuters, 16.5%) for males and 30 to 34 minutes (769 commuters, 14.7%) for females.
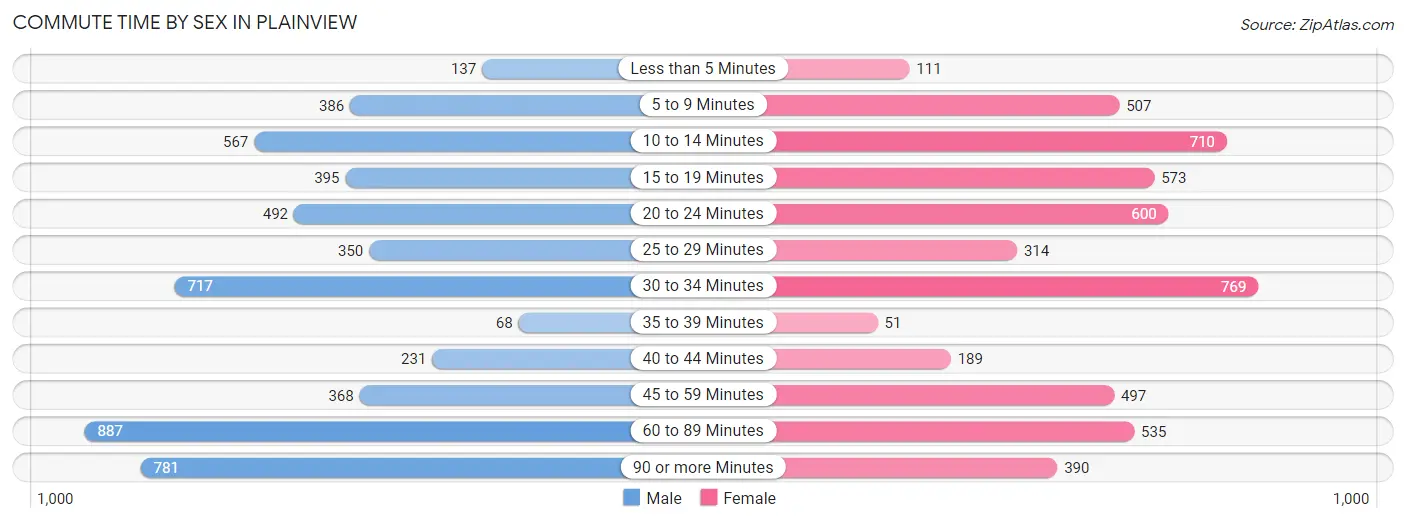
| Commute Time | Male | Female |
| Less than 5 Minutes | 137 (2.5%) | 111 (2.1%) |
| 5 to 9 Minutes | 386 (7.2%) | 507 (9.7%) |
| 10 to 14 Minutes | 567 (10.5%) | 710 (13.5%) |
| 15 to 19 Minutes | 395 (7.3%) | 573 (10.9%) |
| 20 to 24 Minutes | 492 (9.1%) | 600 (11.4%) |
| 25 to 29 Minutes | 350 (6.5%) | 314 (6.0%) |
| 30 to 34 Minutes | 717 (13.3%) | 769 (14.7%) |
| 35 to 39 Minutes | 68 (1.3%) | 51 (1.0%) |
| 40 to 44 Minutes | 231 (4.3%) | 189 (3.6%) |
| 45 to 59 Minutes | 368 (6.8%) | 497 (9.5%) |
| 60 to 89 Minutes | 887 (16.5%) | 535 (10.2%) |
| 90 or more Minutes | 781 (14.5%) | 390 (7.4%) |
Time of Departure to Work by Sex in Plainview
The most frequent times of departure to work in Plainview are 8:00 AM to 8:29 AM (1,029, 19.1%) for males and 8:00 AM to 8:29 AM (840, 16.0%) for females.
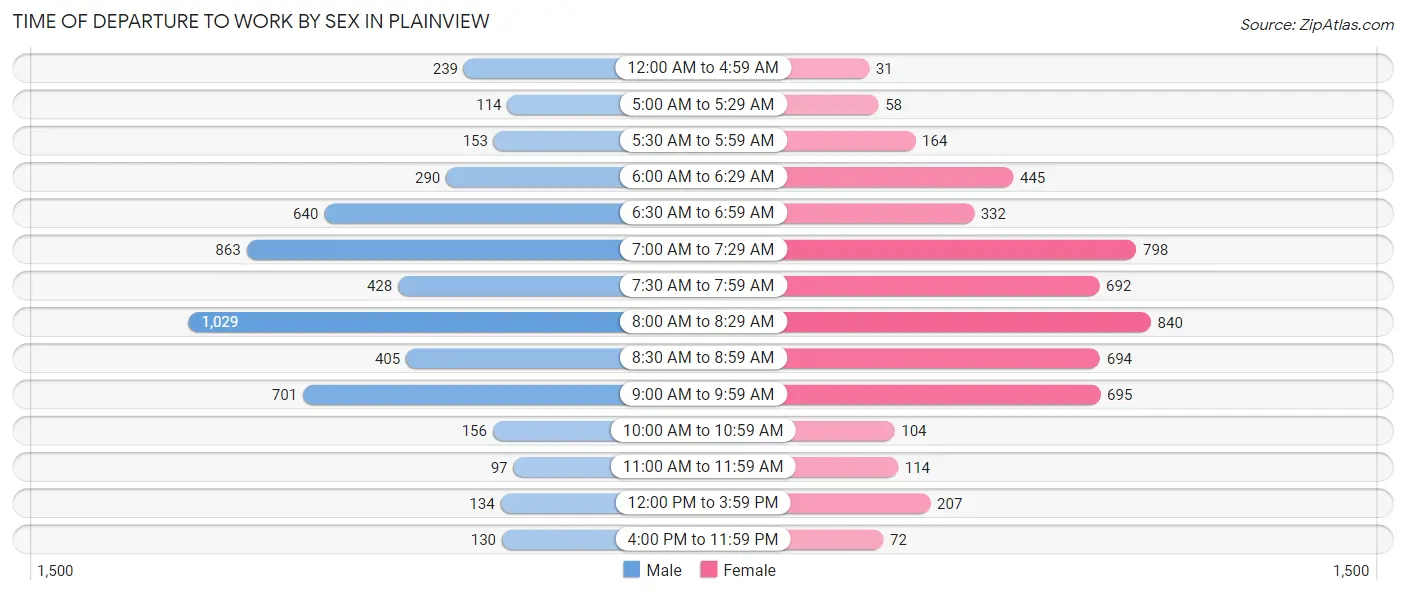
| Time of Departure | Male | Female |
| 12:00 AM to 4:59 AM | 239 (4.4%) | 31 (0.6%) |
| 5:00 AM to 5:29 AM | 114 (2.1%) | 58 (1.1%) |
| 5:30 AM to 5:59 AM | 153 (2.8%) | 164 (3.1%) |
| 6:00 AM to 6:29 AM | 290 (5.4%) | 445 (8.5%) |
| 6:30 AM to 6:59 AM | 640 (11.9%) | 332 (6.3%) |
| 7:00 AM to 7:29 AM | 863 (16.0%) | 798 (15.2%) |
| 7:30 AM to 7:59 AM | 428 (8.0%) | 692 (13.2%) |
| 8:00 AM to 8:29 AM | 1,029 (19.1%) | 840 (16.0%) |
| 8:30 AM to 8:59 AM | 405 (7.5%) | 694 (13.2%) |
| 9:00 AM to 9:59 AM | 701 (13.0%) | 695 (13.3%) |
| 10:00 AM to 10:59 AM | 156 (2.9%) | 104 (2.0%) |
| 11:00 AM to 11:59 AM | 97 (1.8%) | 114 (2.2%) |
| 12:00 PM to 3:59 PM | 134 (2.5%) | 207 (4.0%) |
| 4:00 PM to 11:59 PM | 130 (2.4%) | 72 (1.4%) |
| Total | 5,379 (100.0%) | 5,246 (100.0%) |
Housing Occupancy in Plainview
Occupancy by Ownership in Plainview
Of the total 8,923 dwellings in Plainview, owner-occupied units account for 8,206 (92.0%), while renter-occupied units make up 717 (8.0%).
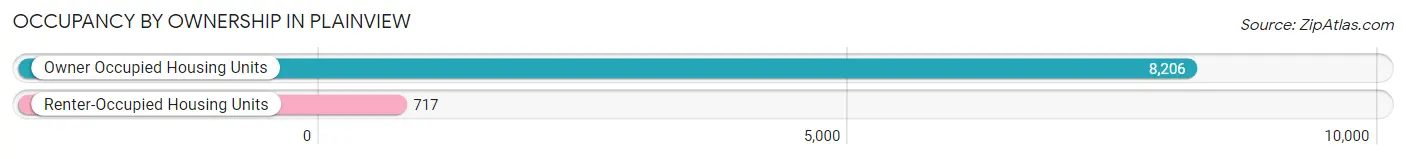
| Occupancy | # Housing Units | % Housing Units |
| Owner Occupied Housing Units | 8,206 | 92.0% |
| Renter-Occupied Housing Units | 717 | 8.0% |
| Total Occupied Housing Units | 8,923 | 100.0% |
Occupancy by Household Size in Plainview
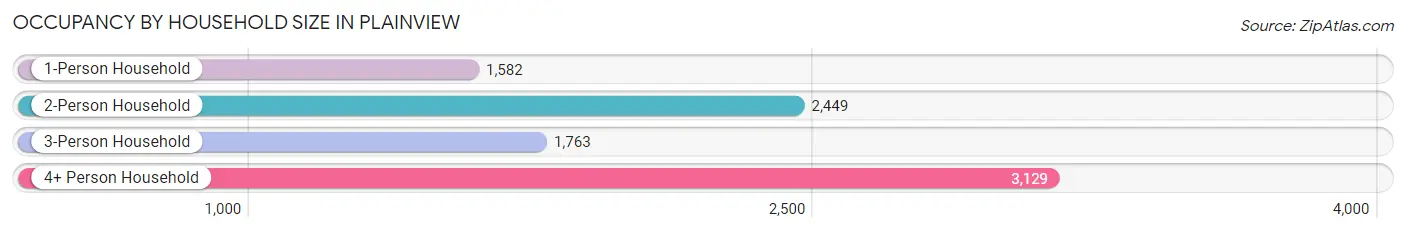
| Household Size | # Housing Units | % Housing Units |
| 1-Person Household | 1,582 | 17.7% |
| 2-Person Household | 2,449 | 27.5% |
| 3-Person Household | 1,763 | 19.8% |
| 4+ Person Household | 3,129 | 35.1% |
| Total Housing Units | 8,923 | 100.0% |
Occupancy by Ownership by Household Size in Plainview
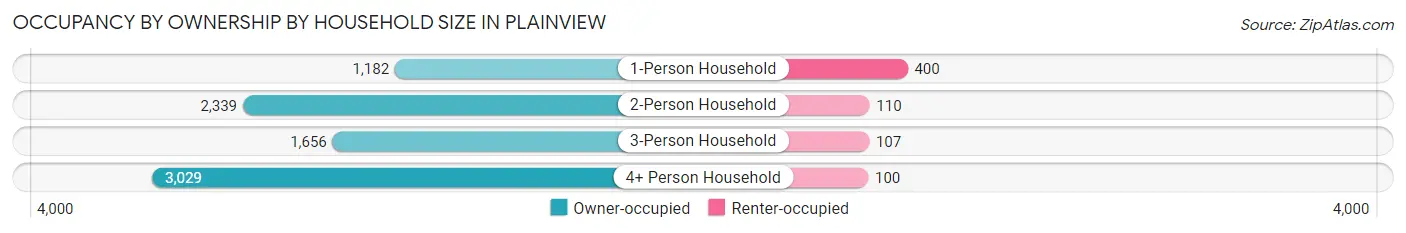
| Household Size | Owner-occupied | Renter-occupied |
| 1-Person Household | 1,182 (74.7%) | 400 (25.3%) |
| 2-Person Household | 2,339 (95.5%) | 110 (4.5%) |
| 3-Person Household | 1,656 (93.9%) | 107 (6.1%) |
| 4+ Person Household | 3,029 (96.8%) | 100 (3.2%) |
| Total Housing Units | 8,206 (92.0%) | 717 (8.0%) |
Occupancy by Educational Attainment in Plainview
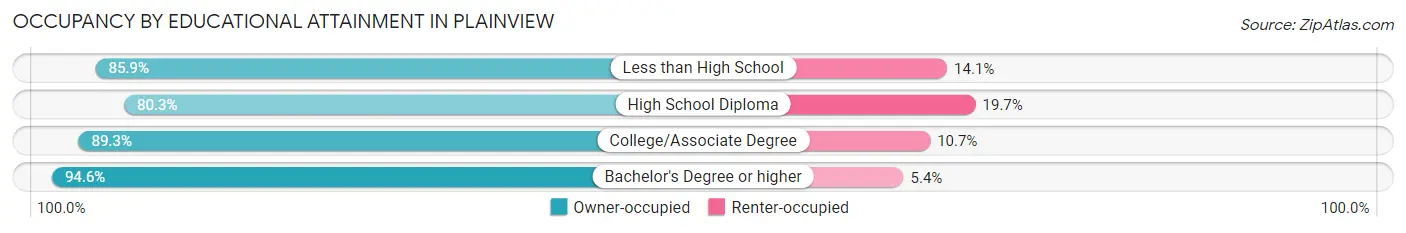
| Household Size | Owner-occupied | Renter-occupied |
| Less than High School | 171 (85.9%) | 28 (14.1%) |
| High School Diploma | 790 (80.3%) | 194 (19.7%) |
| College/Associate Degree | 1,259 (89.3%) | 151 (10.7%) |
| Bachelor's Degree or higher | 5,986 (94.6%) | 344 (5.4%) |
Occupancy by Age of Householder in Plainview
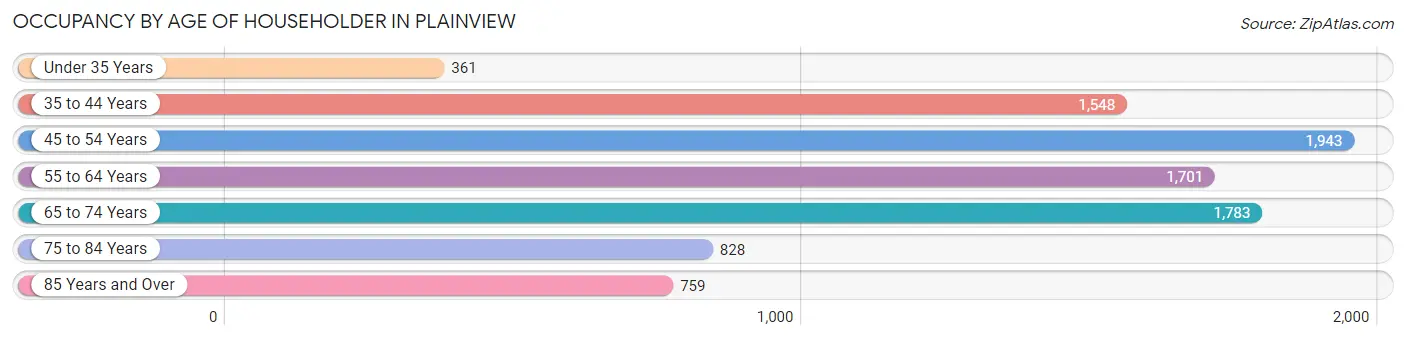
| Age Bracket | # Households | % Households |
| Under 35 Years | 361 | 4.1% |
| 35 to 44 Years | 1,548 | 17.3% |
| 45 to 54 Years | 1,943 | 21.8% |
| 55 to 64 Years | 1,701 | 19.1% |
| 65 to 74 Years | 1,783 | 20.0% |
| 75 to 84 Years | 828 | 9.3% |
| 85 Years and Over | 759 | 8.5% |
| Total | 8,923 | 100.0% |
Housing Finances in Plainview
Median Income by Occupancy in Plainview
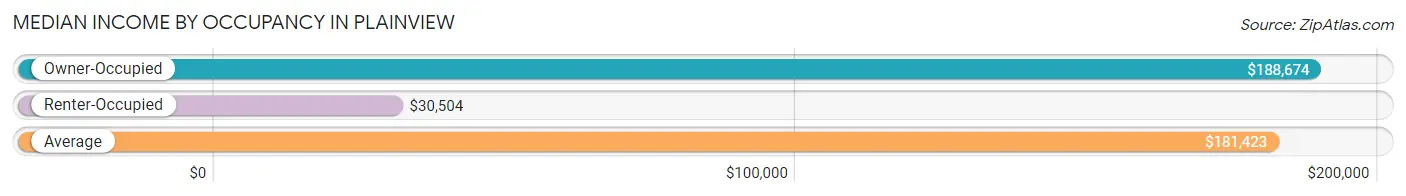
| Occupancy Type | # Households | Median Income |
| Owner-Occupied | 8,206 (92.0%) | $188,674 |
| Renter-Occupied | 717 (8.0%) | $30,504 |
| Average | 8,923 (100.0%) | $181,423 |
Occupancy by Householder Income Bracket in Plainview
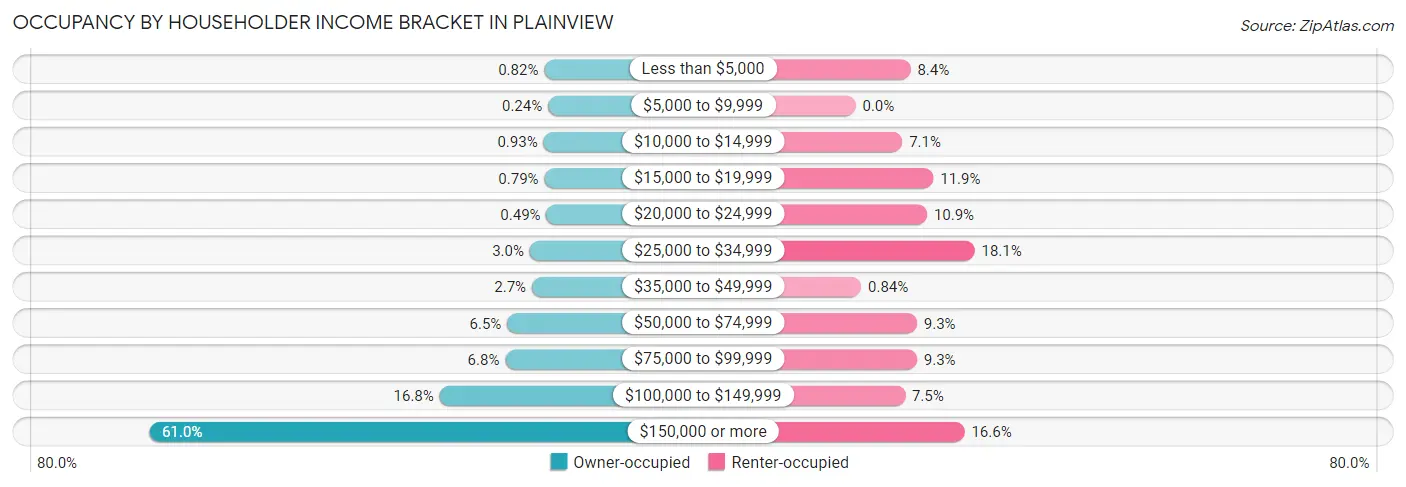
| Income Bracket | Owner-occupied | Renter-occupied |
| Less than $5,000 | 67 (0.8%) | 60 (8.4%) |
| $5,000 to $9,999 | 20 (0.2%) | 0 (0.0%) |
| $10,000 to $14,999 | 76 (0.9%) | 51 (7.1%) |
| $15,000 to $19,999 | 65 (0.8%) | 85 (11.8%) |
| $20,000 to $24,999 | 40 (0.5%) | 78 (10.9%) |
| $25,000 to $34,999 | 248 (3.0%) | 130 (18.1%) |
| $35,000 to $49,999 | 221 (2.7%) | 6 (0.8%) |
| $50,000 to $74,999 | 530 (6.5%) | 67 (9.3%) |
| $75,000 to $99,999 | 555 (6.8%) | 67 (9.3%) |
| $100,000 to $149,999 | 1,375 (16.8%) | 54 (7.5%) |
| $150,000 or more | 5,009 (61.0%) | 119 (16.6%) |
| Total | 8,206 (100.0%) | 717 (100.0%) |
Monthly Housing Cost Tiers in Plainview
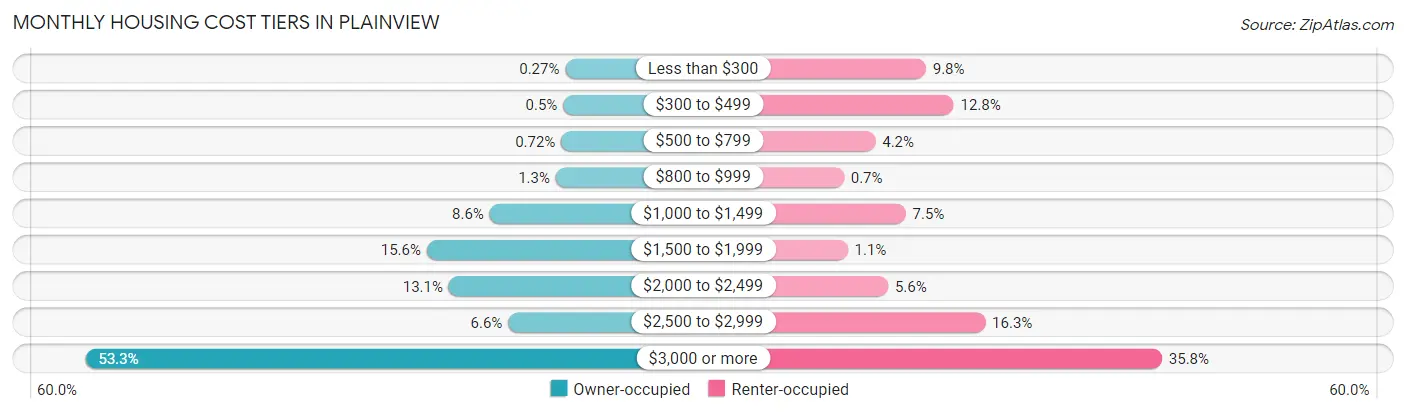
| Monthly Cost | Owner-occupied | Renter-occupied |
| Less than $300 | 22 (0.3%) | 70 (9.8%) |
| $300 to $499 | 41 (0.5%) | 92 (12.8%) |
| $500 to $799 | 59 (0.7%) | 30 (4.2%) |
| $800 to $999 | 108 (1.3%) | 5 (0.7%) |
| $1,000 to $1,499 | 707 (8.6%) | 54 (7.5%) |
| $1,500 to $1,999 | 1,278 (15.6%) | 8 (1.1%) |
| $2,000 to $2,499 | 1,078 (13.1%) | 40 (5.6%) |
| $2,500 to $2,999 | 540 (6.6%) | 117 (16.3%) |
| $3,000 or more | 4,373 (53.3%) | 257 (35.8%) |
| Total | 8,206 (100.0%) | 717 (100.0%) |
Physical Housing Characteristics in Plainview
Housing Structures in Plainview
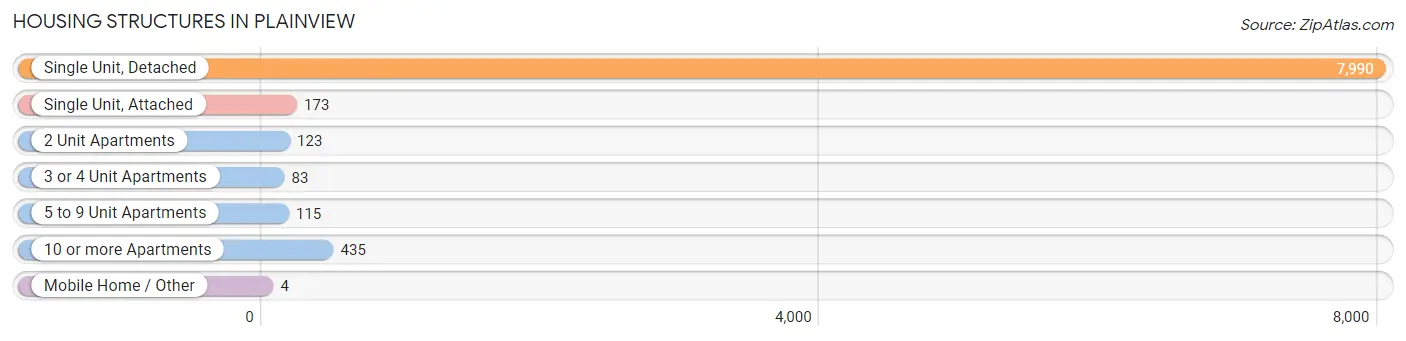
| Structure Type | # Housing Units | % Housing Units |
| Single Unit, Detached | 7,990 | 89.5% |
| Single Unit, Attached | 173 | 1.9% |
| 2 Unit Apartments | 123 | 1.4% |
| 3 or 4 Unit Apartments | 83 | 0.9% |
| 5 to 9 Unit Apartments | 115 | 1.3% |
| 10 or more Apartments | 435 | 4.9% |
| Mobile Home / Other | 4 | 0.0% |
| Total | 8,923 | 100.0% |
Housing Structures by Occupancy in Plainview
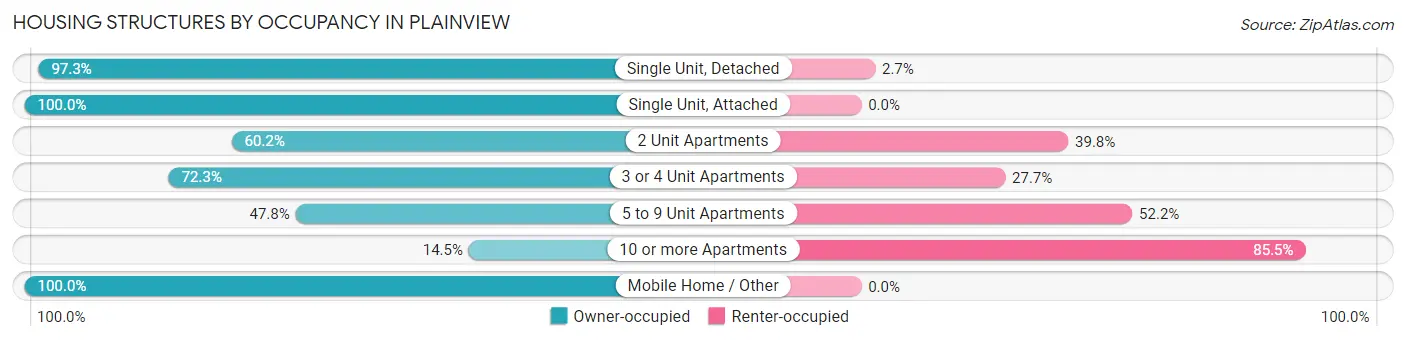
| Structure Type | Owner-occupied | Renter-occupied |
| Single Unit, Detached | 7,777 (97.3%) | 213 (2.7%) |
| Single Unit, Attached | 173 (100.0%) | 0 (0.0%) |
| 2 Unit Apartments | 74 (60.2%) | 49 (39.8%) |
| 3 or 4 Unit Apartments | 60 (72.3%) | 23 (27.7%) |
| 5 to 9 Unit Apartments | 55 (47.8%) | 60 (52.2%) |
| 10 or more Apartments | 63 (14.5%) | 372 (85.5%) |
| Mobile Home / Other | 4 (100.0%) | 0 (0.0%) |
| Total | 8,206 (92.0%) | 717 (8.0%) |
Housing Structures by Number of Rooms in Plainview
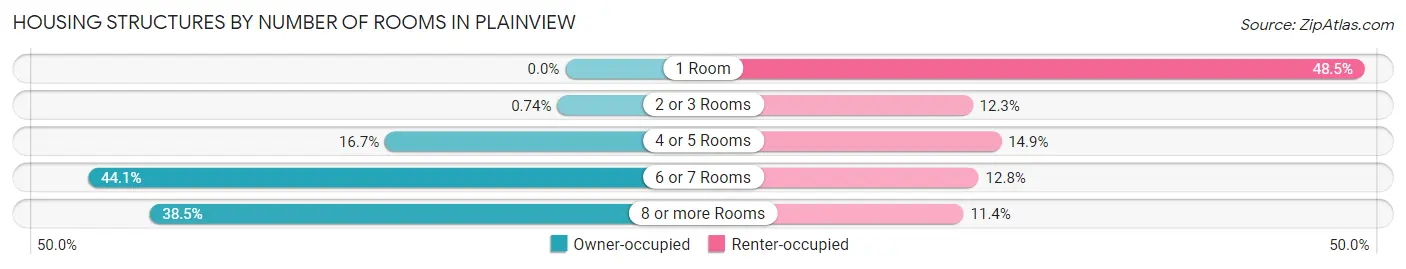
| Number of Rooms | Owner-occupied | Renter-occupied |
| 1 Room | 0 (0.0%) | 348 (48.5%) |
| 2 or 3 Rooms | 61 (0.7%) | 88 (12.3%) |
| 4 or 5 Rooms | 1,368 (16.7%) | 107 (14.9%) |
| 6 or 7 Rooms | 3,621 (44.1%) | 92 (12.8%) |
| 8 or more Rooms | 3,156 (38.5%) | 82 (11.4%) |
| Total | 8,206 (100.0%) | 717 (100.0%) |
Housing Structure by Heating Type in Plainview
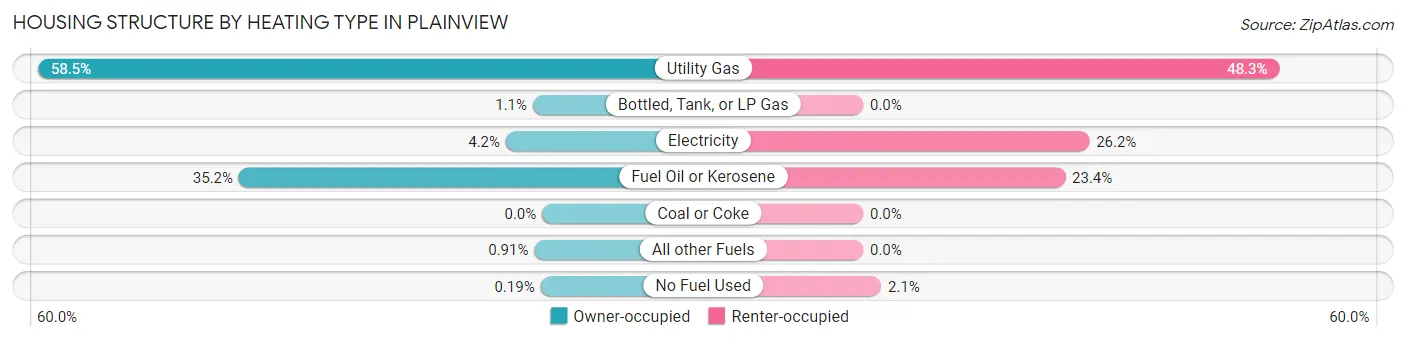
| Heating Type | Owner-occupied | Renter-occupied |
| Utility Gas | 4,797 (58.5%) | 346 (48.3%) |
| Bottled, Tank, or LP Gas | 88 (1.1%) | 0 (0.0%) |
| Electricity | 345 (4.2%) | 188 (26.2%) |
| Fuel Oil or Kerosene | 2,885 (35.2%) | 168 (23.4%) |
| Coal or Coke | 0 (0.0%) | 0 (0.0%) |
| All other Fuels | 75 (0.9%) | 0 (0.0%) |
| No Fuel Used | 16 (0.2%) | 15 (2.1%) |
| Total | 8,206 (100.0%) | 717 (100.0%) |
Household Vehicle Usage in Plainview
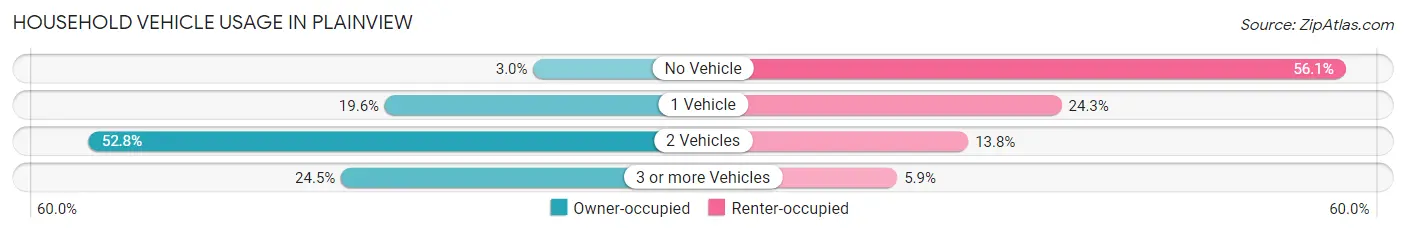
| Vehicles per Household | Owner-occupied | Renter-occupied |
| No Vehicle | 247 (3.0%) | 402 (56.1%) |
| 1 Vehicle | 1,612 (19.6%) | 174 (24.3%) |
| 2 Vehicles | 4,333 (52.8%) | 99 (13.8%) |
| 3 or more Vehicles | 2,014 (24.5%) | 42 (5.9%) |
| Total | 8,206 (100.0%) | 717 (100.0%) |
Real Estate & Mortgages in Plainview
Real Estate and Mortgage Overview in Plainview
| Characteristic | Without Mortgage | With Mortgage |
| Housing Units | 3,078 | 5,128 |
| Median Property Value | $686,200 | $694,600 |
| Median Household Income | $138,333 | $3,677 |
| Monthly Housing Costs | $1,501 | $4,246 |
| Real Estate Taxes | $10,001 | $25 |
Property Value by Mortgage Status in Plainview
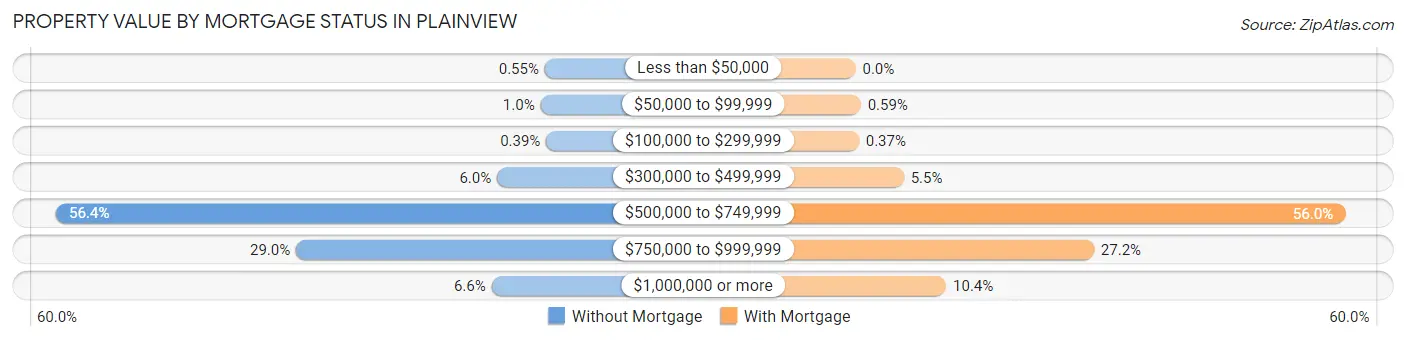
| Property Value | Without Mortgage | With Mortgage |
| Less than $50,000 | 17 (0.5%) | 0 (0.0%) |
| $50,000 to $99,999 | 32 (1.0%) | 30 (0.6%) |
| $100,000 to $299,999 | 12 (0.4%) | 19 (0.4%) |
| $300,000 to $499,999 | 185 (6.0%) | 282 (5.5%) |
| $500,000 to $749,999 | 1,736 (56.4%) | 2,869 (55.9%) |
| $750,000 to $999,999 | 892 (29.0%) | 1,397 (27.2%) |
| $1,000,000 or more | 204 (6.6%) | 531 (10.3%) |
| Total | 3,078 (100.0%) | 5,128 (100.0%) |
Household Income by Mortgage Status in Plainview
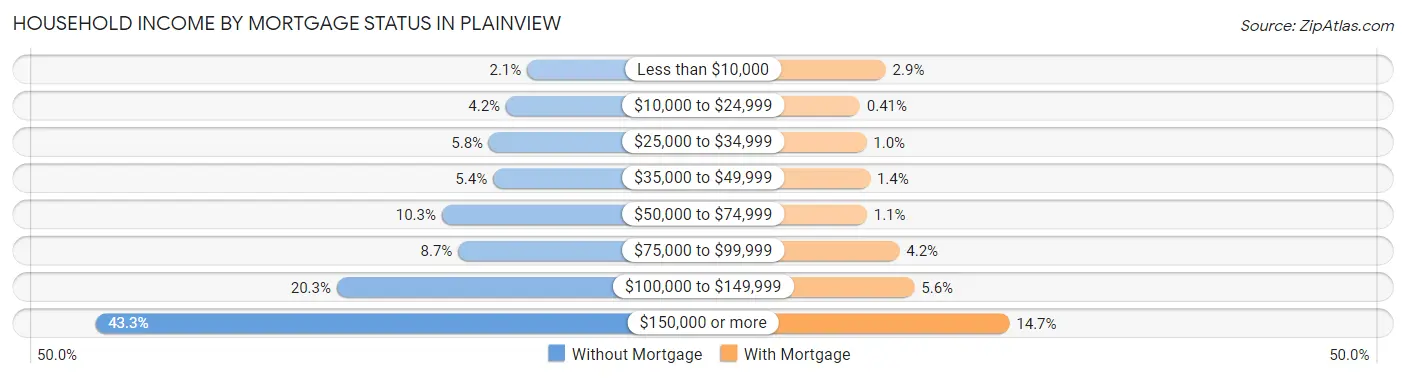
| Household Income | Without Mortgage | With Mortgage |
| Less than $10,000 | 66 (2.1%) | 147 (2.9%) |
| $10,000 to $24,999 | 128 (4.2%) | 21 (0.4%) |
| $25,000 to $34,999 | 178 (5.8%) | 53 (1.0%) |
| $35,000 to $49,999 | 166 (5.4%) | 70 (1.4%) |
| $50,000 to $74,999 | 316 (10.3%) | 55 (1.1%) |
| $75,000 to $99,999 | 268 (8.7%) | 214 (4.2%) |
| $100,000 to $149,999 | 624 (20.3%) | 287 (5.6%) |
| $150,000 or more | 1,332 (43.3%) | 751 (14.6%) |
| Total | 3,078 (100.0%) | 5,128 (100.0%) |
Property Value to Household Income Ratio in Plainview
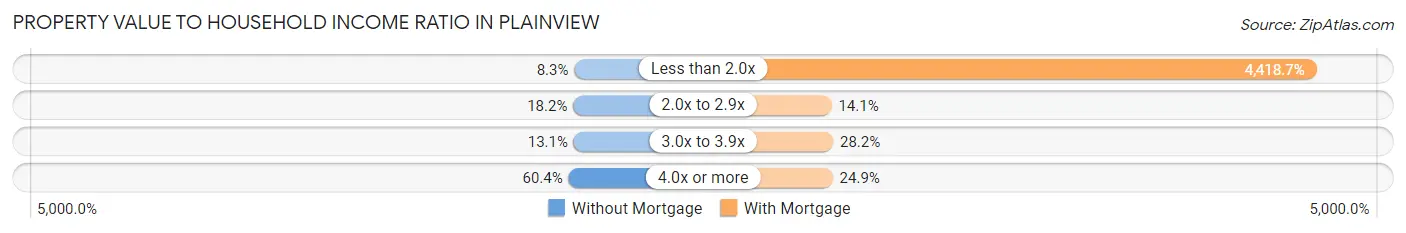
| Value-to-Income Ratio | Without Mortgage | With Mortgage |
| Less than 2.0x | 256 (8.3%) | 226,591 (4,418.7%) |
| 2.0x to 2.9x | 561 (18.2%) | 724 (14.1%) |
| 3.0x to 3.9x | 402 (13.1%) | 1,445 (28.2%) |
| 4.0x or more | 1,859 (60.4%) | 1,278 (24.9%) |
| Total | 3,078 (100.0%) | 5,128 (100.0%) |
Real Estate Taxes by Mortgage Status in Plainview
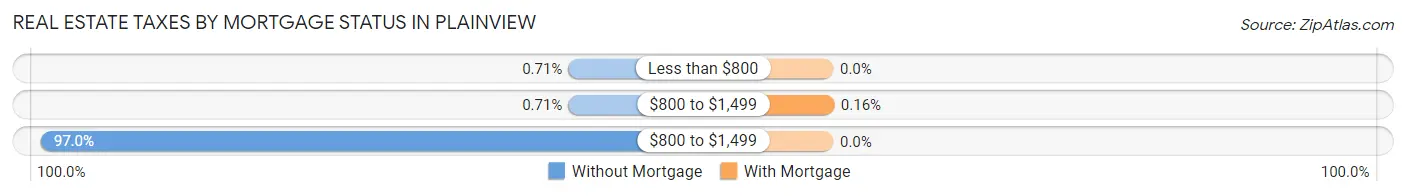
| Property Taxes | Without Mortgage | With Mortgage |
| Less than $800 | 22 (0.7%) | 0 (0.0%) |
| $800 to $1,499 | 22 (0.7%) | 8 (0.2%) |
| $800 to $1,499 | 2,987 (97.0%) | 0 (0.0%) |
| Total | 3,078 (100.0%) | 5,128 (100.0%) |
Health & Disability in Plainview
Health Insurance Coverage by Age in Plainview
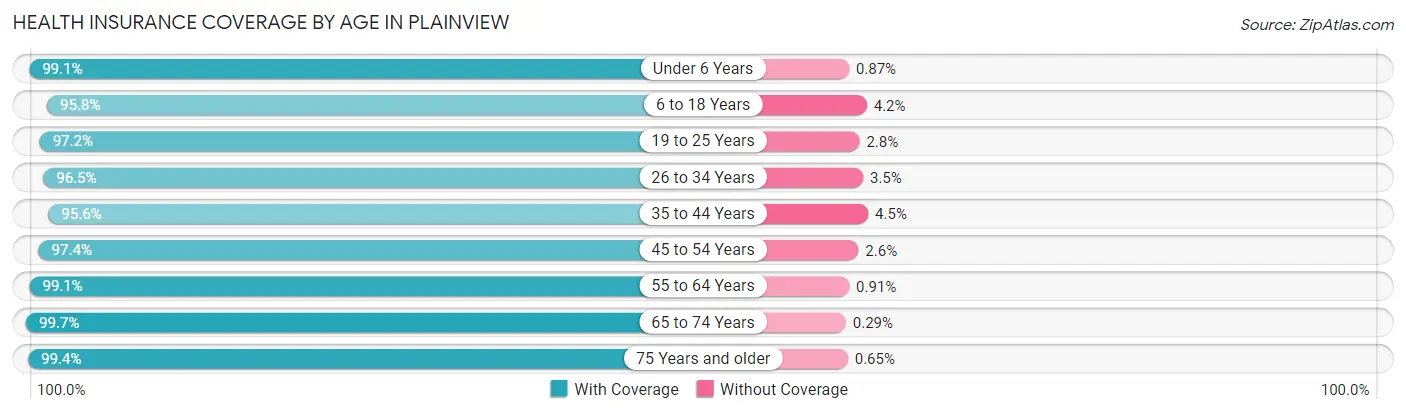
| Age Bracket | With Coverage | Without Coverage |
| Under 6 Years | 1,589 (99.1%) | 14 (0.9%) |
| 6 to 18 Years | 4,758 (95.8%) | 208 (4.2%) |
| 19 to 25 Years | 1,854 (97.2%) | 54 (2.8%) |
| 26 to 34 Years | 1,573 (96.5%) | 57 (3.5%) |
| 35 to 44 Years | 3,479 (95.6%) | 162 (4.4%) |
| 45 to 54 Years | 3,559 (97.4%) | 96 (2.6%) |
| 55 to 64 Years | 3,499 (99.1%) | 32 (0.9%) |
| 65 to 74 Years | 3,052 (99.7%) | 9 (0.3%) |
| 75 Years and older | 2,462 (99.4%) | 16 (0.6%) |
| Total | 25,825 (97.6%) | 648 (2.5%) |
Health Insurance Coverage by Citizenship Status in Plainview
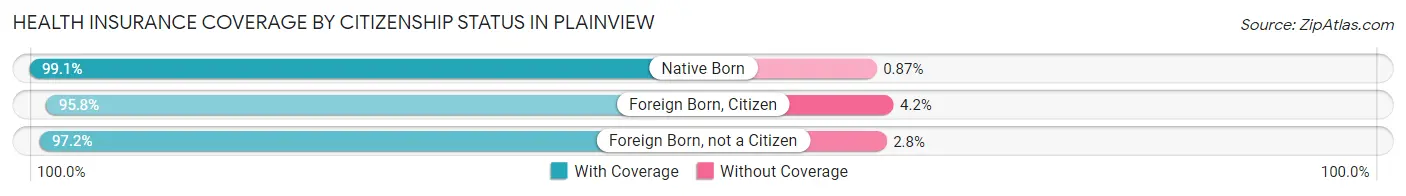
| Citizenship Status | With Coverage | Without Coverage |
| Native Born | 1,589 (99.1%) | 14 (0.9%) |
| Foreign Born, Citizen | 4,758 (95.8%) | 208 (4.2%) |
| Foreign Born, not a Citizen | 1,854 (97.2%) | 54 (2.8%) |
Health Insurance Coverage by Household Income in Plainview
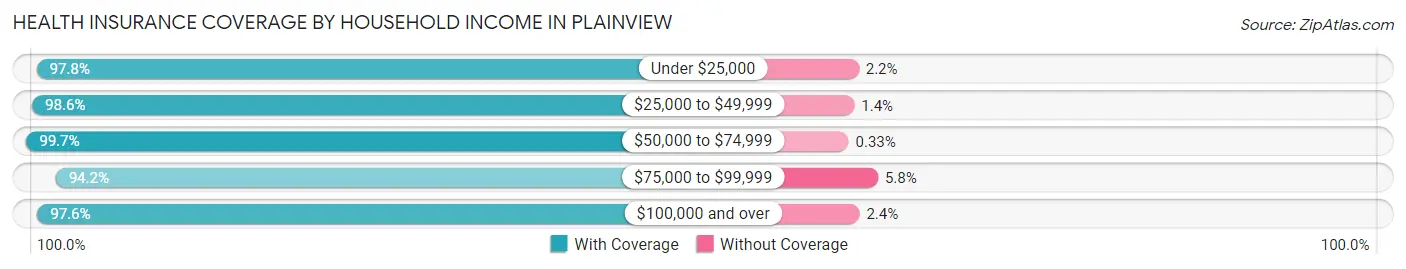
| Household Income | With Coverage | Without Coverage |
| Under $25,000 | 697 (97.8%) | 16 (2.2%) |
| $25,000 to $49,999 | 901 (98.6%) | 13 (1.4%) |
| $50,000 to $74,999 | 1,193 (99.7%) | 4 (0.3%) |
| $75,000 to $99,999 | 1,531 (94.2%) | 95 (5.8%) |
| $100,000 and over | 21,329 (97.6%) | 520 (2.4%) |
Public vs Private Health Insurance Coverage by Age in Plainview
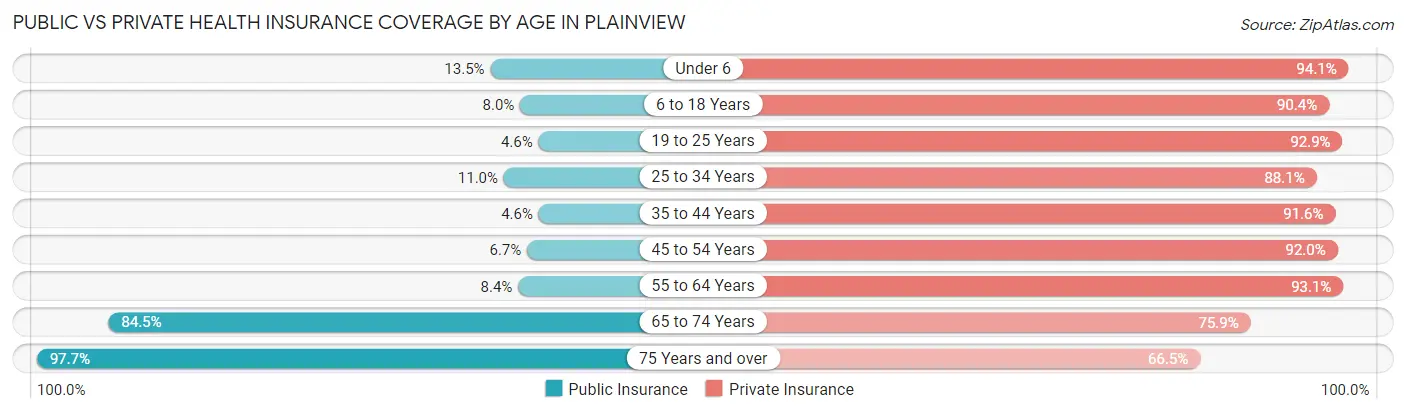
| Age Bracket | Public Insurance | Private Insurance |
| Under 6 | 217 (13.5%) | 1,508 (94.1%) |
| 6 to 18 Years | 398 (8.0%) | 4,491 (90.4%) |
| 19 to 25 Years | 88 (4.6%) | 1,773 (92.9%) |
| 25 to 34 Years | 180 (11.0%) | 1,436 (88.1%) |
| 35 to 44 Years | 166 (4.6%) | 3,335 (91.6%) |
| 45 to 54 Years | 246 (6.7%) | 3,363 (92.0%) |
| 55 to 64 Years | 296 (8.4%) | 3,286 (93.1%) |
| 65 to 74 Years | 2,585 (84.5%) | 2,322 (75.9%) |
| 75 Years and over | 2,422 (97.7%) | 1,648 (66.5%) |
| Total | 6,598 (24.9%) | 23,162 (87.5%) |
Disability Status by Sex by Age in Plainview
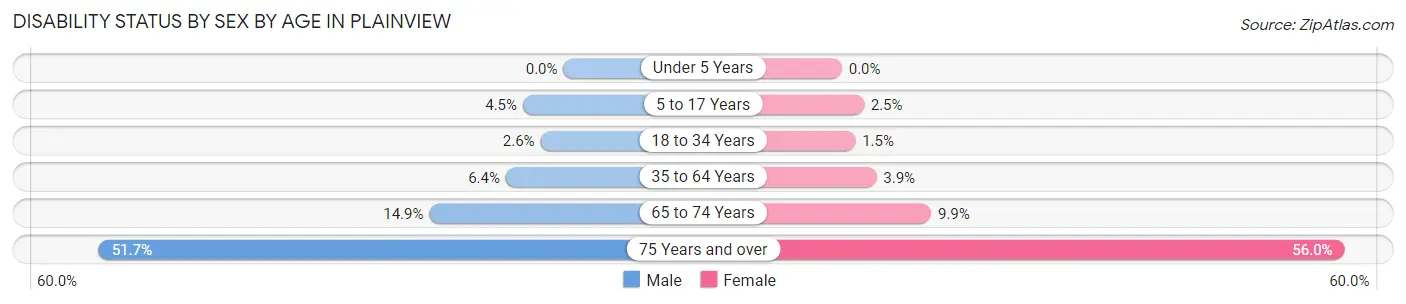
| Age Bracket | Male | Female |
| Under 5 Years | 0 (0.0%) | 0 (0.0%) |
| 5 to 17 Years | 124 (4.5%) | 55 (2.5%) |
| 18 to 34 Years | 51 (2.5%) | 27 (1.5%) |
| 35 to 64 Years | 343 (6.4%) | 211 (3.8%) |
| 65 to 74 Years | 191 (14.9%) | 177 (9.9%) |
| 75 Years and over | 550 (51.7%) | 792 (56.0%) |
Disability Class by Sex by Age in Plainview
Disability Class: Hearing Difficulty
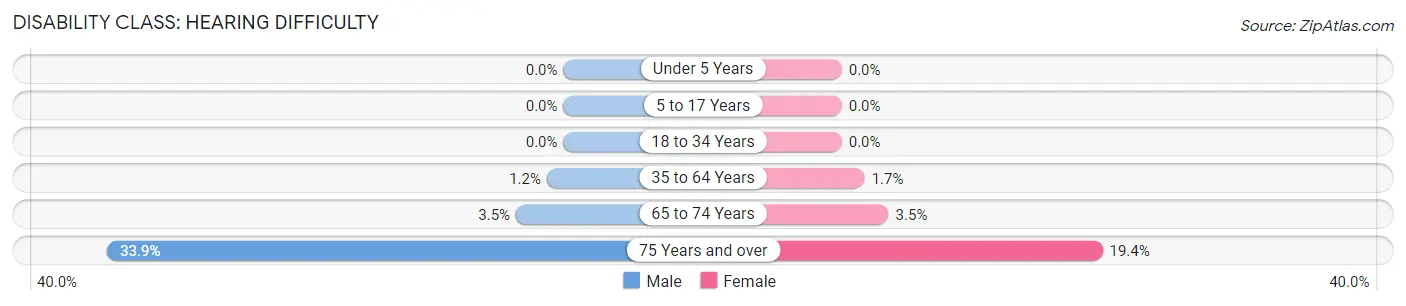
| Age Bracket | Male | Female |
| Under 5 Years | 0 (0.0%) | 0 (0.0%) |
| 5 to 17 Years | 0 (0.0%) | 0 (0.0%) |
| 18 to 34 Years | 0 (0.0%) | 0 (0.0%) |
| 35 to 64 Years | 66 (1.2%) | 93 (1.7%) |
| 65 to 74 Years | 45 (3.5%) | 62 (3.5%) |
| 75 Years and over | 360 (33.9%) | 274 (19.4%) |
Disability Class: Vision Difficulty
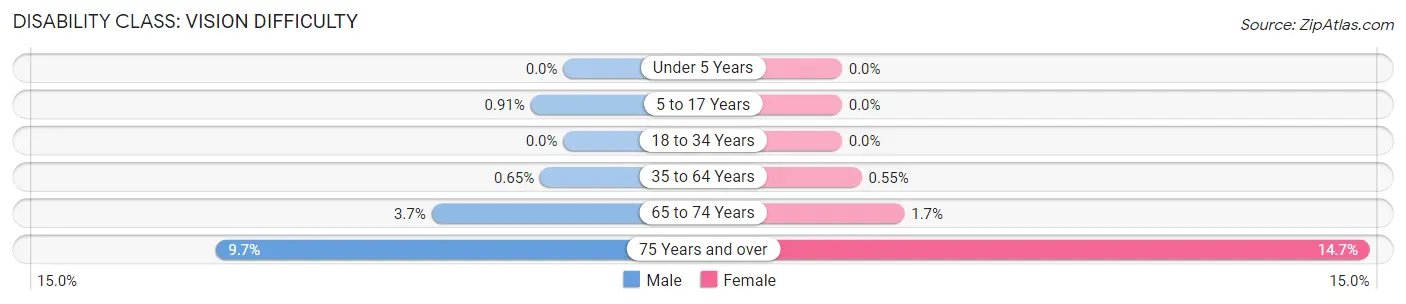
| Age Bracket | Male | Female |
| Under 5 Years | 0 (0.0%) | 0 (0.0%) |
| 5 to 17 Years | 25 (0.9%) | 0 (0.0%) |
| 18 to 34 Years | 0 (0.0%) | 0 (0.0%) |
| 35 to 64 Years | 35 (0.6%) | 30 (0.5%) |
| 65 to 74 Years | 47 (3.7%) | 31 (1.7%) |
| 75 Years and over | 103 (9.7%) | 208 (14.7%) |
Disability Class: Cognitive Difficulty
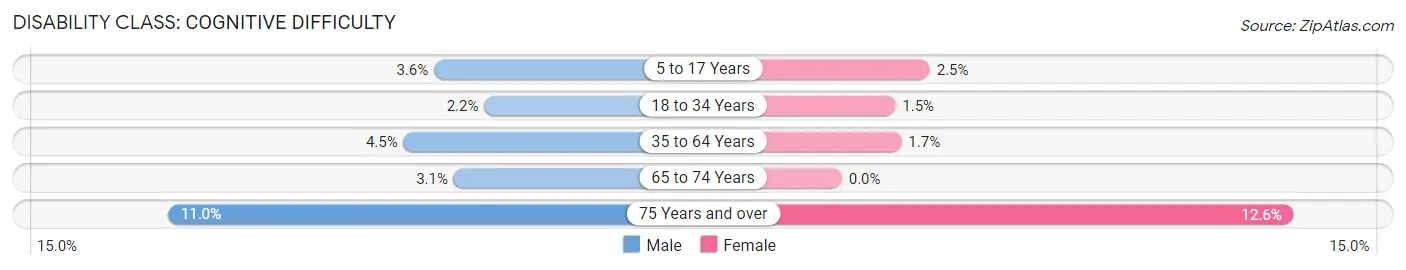
| Age Bracket | Male | Female |
| 5 to 17 Years | 99 (3.6%) | 55 (2.5%) |
| 18 to 34 Years | 44 (2.2%) | 27 (1.5%) |
| 35 to 64 Years | 238 (4.4%) | 91 (1.7%) |
| 65 to 74 Years | 39 (3.0%) | 0 (0.0%) |
| 75 Years and over | 117 (11.0%) | 178 (12.6%) |
Disability Class: Ambulatory Difficulty
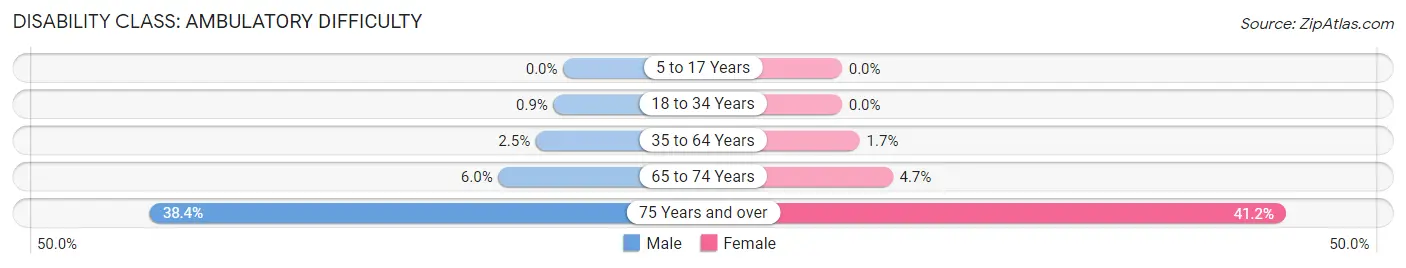
| Age Bracket | Male | Female |
| 5 to 17 Years | 0 (0.0%) | 0 (0.0%) |
| 18 to 34 Years | 18 (0.9%) | 0 (0.0%) |
| 35 to 64 Years | 136 (2.5%) | 91 (1.7%) |
| 65 to 74 Years | 77 (6.0%) | 84 (4.7%) |
| 75 Years and over | 408 (38.4%) | 583 (41.2%) |
Disability Class: Self-Care Difficulty
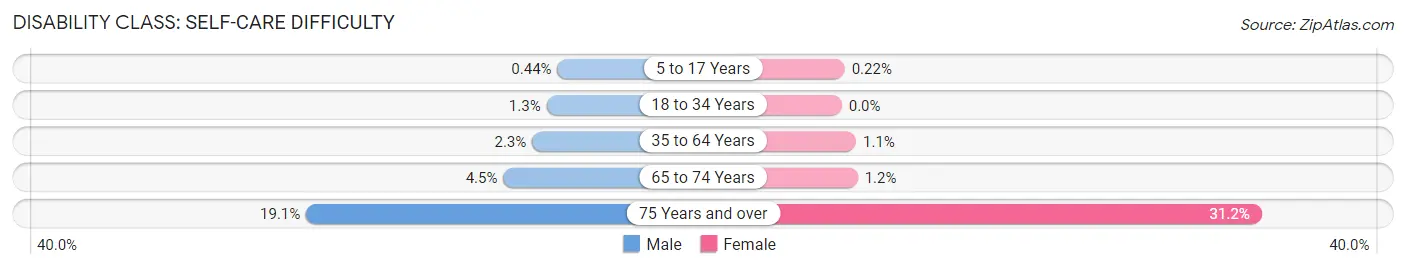
| Age Bracket | Male | Female |
| 5 to 17 Years | 12 (0.4%) | 5 (0.2%) |
| 18 to 34 Years | 25 (1.3%) | 0 (0.0%) |
| 35 to 64 Years | 124 (2.3%) | 58 (1.1%) |
| 65 to 74 Years | 57 (4.5%) | 21 (1.2%) |
| 75 Years and over | 203 (19.1%) | 441 (31.2%) |
Technology Access in Plainview
Computing Device Access in Plainview
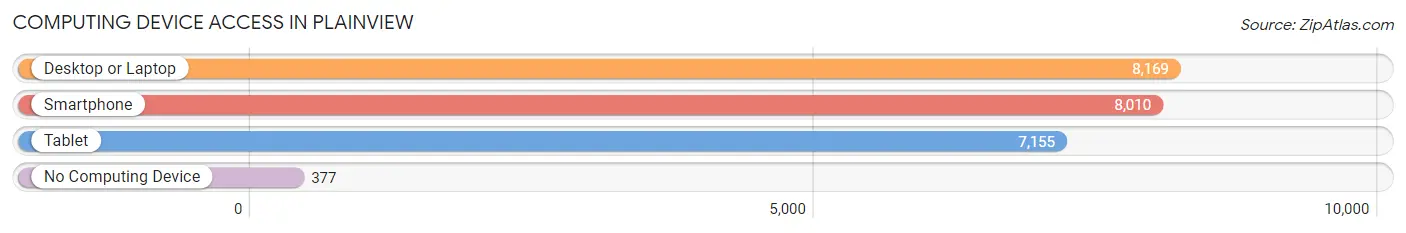
| Device Type | # Households | % Households |
| Desktop or Laptop | 8,169 | 91.5% |
| Smartphone | 8,010 | 89.8% |
| Tablet | 7,155 | 80.2% |
| No Computing Device | 377 | 4.2% |
| Total | 8,923 | 100.0% |
Internet Access in Plainview
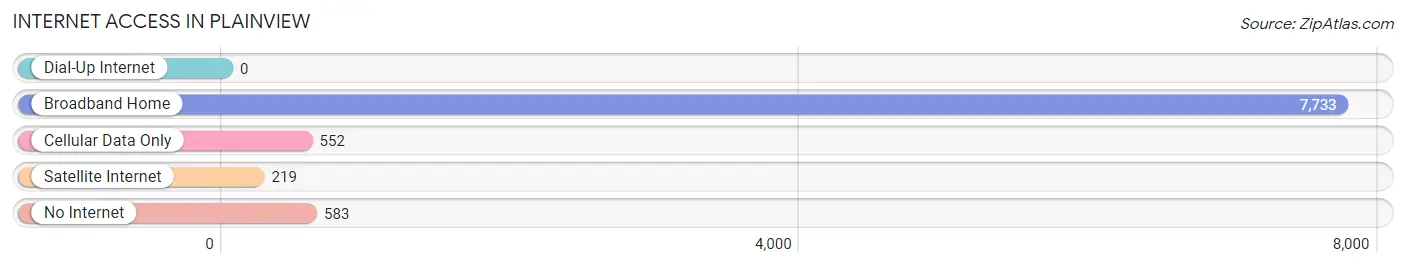
| Internet Type | # Households | % Households |
| Dial-Up Internet | 0 | 0.0% |
| Broadband Home | 7,733 | 86.7% |
| Cellular Data Only | 552 | 6.2% |
| Satellite Internet | 219 | 2.5% |
| No Internet | 583 | 6.5% |
| Total | 8,923 | 100.0% |
Plainview Summary
Plainview is a hamlet located in the Town of Oyster Bay in Nassau County, New York. It is situated on the north shore of Long Island, approximately 25 miles east of Manhattan. The hamlet is home to a population of approximately 27,000 people, and is part of the larger Plainview-Old Bethpage Central School District.
History
The area that is now Plainview was originally inhabited by the Matinecock Native American tribe. The first European settlers arrived in the area in the mid-17th century, and the hamlet was officially established in 1793. The hamlet was originally known as “Old Bethpage”, and was renamed “Plainview” in 1875.
The hamlet experienced significant growth in the late 19th and early 20th centuries, as it became a popular destination for wealthy New Yorkers looking to escape the hustle and bustle of the city. The hamlet was home to several large estates, including the former estate of William K. Vanderbilt, which is now the site of the Plainview-Old Bethpage John F. Kennedy High School.
Geography
Plainview is located in the Town of Oyster Bay in Nassau County, New York. It is situated on the north shore of Long Island, approximately 25 miles east of Manhattan. The hamlet is bordered by the hamlets of Old Bethpage to the east, Hicksville to the south, and Jericho to the west.
The hamlet is located in the Plainview-Old Bethpage Central School District, which covers an area of approximately 10 square miles. The hamlet is home to several parks, including Plainview-Old Bethpage Community Park, Plainview-Old Bethpage Park, and Plainview-Old Bethpage Dog Park.
Economy
Plainview is home to a variety of businesses, including retail stores, restaurants, and professional services. The hamlet is also home to several corporate headquarters, including the headquarters of the Plainview-Old Bethpage Central School District, the Plainview-Old Bethpage Chamber of Commerce, and the Plainview-Old Bethpage Public Library.
The hamlet is also home to several industrial parks, including the Plainview Industrial Park, the Plainview Business Park, and the Plainview Technology Park. These parks are home to a variety of businesses, including manufacturing, technology, and research and development companies.
Demographics
As of the 2010 census, the population of Plainview was 27,000. The racial makeup of the hamlet was 79.3% White, 8.2% Asian, 6.2% Hispanic or Latino, and 4.3% African American. The median household income was $101,000, and the median home value was $521,000.
The hamlet is home to a variety of religious institutions, including churches, synagogues, and mosques. The hamlet is also home to a variety of educational institutions, including the Plainview-Old Bethpage Central School District, the Plainview-Old Bethpage Public Library, and the Plainview-Old Bethpage John F. Kennedy High School.
Common Questions
What is Per Capita Income in Plainview?
Per Capita income in Plainview is $71,495.
What is the Median Family Income in Plainview?
Median Family Income in Plainview is $211,995.
What is the Median Household income in Plainview?
Median Household Income in Plainview is $181,423.
What is Income or Wage Gap in Plainview?
Income or Wage Gap in Plainview is 39.6%.
Women in Plainview earn 60.4 cents for every dollar earned by a man.
What is Inequality or Gini Index in Plainview?
Inequality or Gini Index in Plainview is 0.40.
What is the Total Population of Plainview?
Total Population of Plainview is 26,620.
What is the Total Male Population of Plainview?
Total Male Population of Plainview is 13,129.
What is the Total Female Population of Plainview?
Total Female Population of Plainview is 13,491.
What is the Ratio of Males per 100 Females in Plainview?
There are 97.32 Males per 100 Females in Plainview.
What is the Ratio of Females per 100 Males in Plainview?
There are 102.76 Females per 100 Males in Plainview.
What is the Median Population Age in Plainview?
Median Population Age in Plainview is 43.5 Years.
What is the Average Family Size in Plainview
Average Family Size in Plainview is 3.4 People.
What is the Average Household Size in Plainview
Average Household Size in Plainview is 3.0 People.
How Large is the Labor Force in Plainview?
There are 14,023 People in the Labor Forcein in Plainview.
What is the Percentage of People in the Labor Force in Plainview?
66.6% of People are in the Labor Force in Plainview.
What is the Unemployment Rate in Plainview?
Unemployment Rate in Plainview is 2.7%.