Zip Codes with the Highest Percentage of Population Employed in Health Diagnosing & Treating in Burlington, VT
RELATED REPORTS & OPTIONS
Health Diagnosing & Treating
Burlington
Compare Zip Codes
Map of Zip Codes with the Highest Percentage of Population Employed in Health Diagnosing & Treating in Burlington
0.60%
9.0%
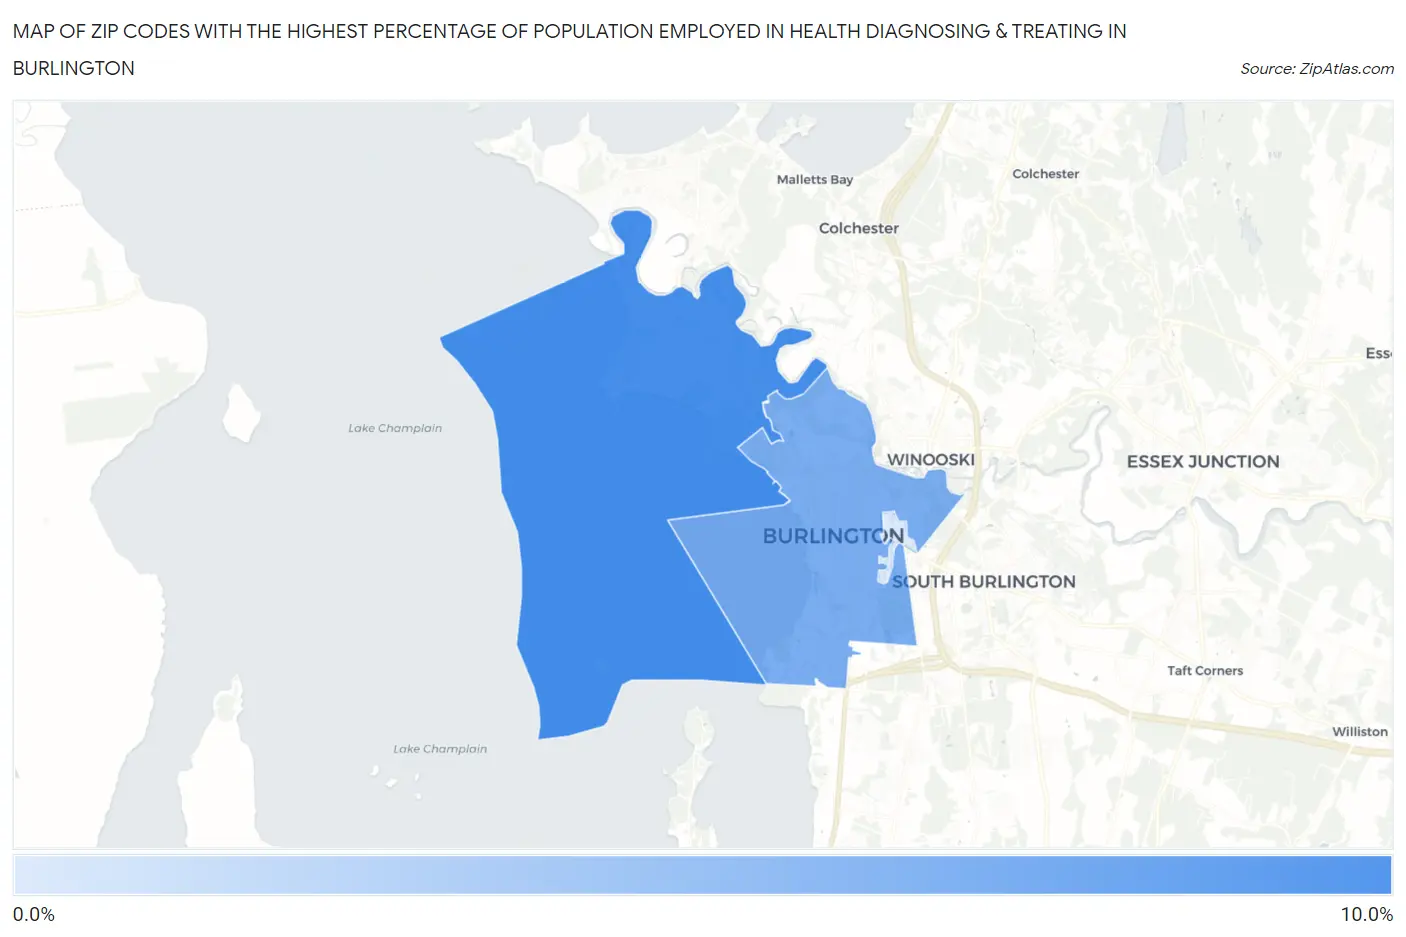
Zip Codes with the Highest Percentage of Population Employed in Health Diagnosing & Treating in Burlington, VT
| Zip Code | % Employed | vs State | vs National | |
| 1. | 05408 | 9.0% | 6.9%(+2.11)#46 | 6.2%(+2.72)#5,425 |
| 2. | 05401 | 6.1% | 6.9%(-0.755)#104 | 6.2%(-0.146)#13,531 |
| 3. | 05405 | 0.60% | 6.9%(-6.25)#228 | 6.2%(-5.64)#28,230 |
1
Common Questions
What are the Top Zip Codes with the Highest Percentage of Population Employed in Health Diagnosing & Treating in Burlington, VT?
Top Zip Codes with the Highest Percentage of Population Employed in Health Diagnosing & Treating in Burlington, VT are:
What zip code has the Highest Percentage of Population Employed in Health Diagnosing & Treating in Burlington, VT?
05408 has the Highest Percentage of Population Employed in Health Diagnosing & Treating in Burlington, VT with 9.0%.
What is the Percentage of Population Employed in Health Diagnosing & Treating in Burlington, VT?
Percentage of Population Employed in Health Diagnosing & Treating in Burlington is 6.7%.
What is the Percentage of Population Employed in Health Diagnosing & Treating in Vermont?
Percentage of Population Employed in Health Diagnosing & Treating in Vermont is 6.9%.
What is the Percentage of Population Employed in Health Diagnosing & Treating in the United States?
Percentage of Population Employed in Health Diagnosing & Treating in the United States is 6.2%.