Quechee, VT Map & Demographics
Quechee Map
Quechee Overview
$55,235
PER CAPITA INCOME
$39,118
AVG FAMILY INCOME
$50,547
AVG HOUSEHOLD INCOME
0.44
INEQUALITY / GINI INDEX
340
TOTAL POPULATION
102
MALE POPULATION
238
FEMALE POPULATION
42.86
MALES / 100 FEMALES
233.33
FEMALES / 100 MALES
64.7
MEDIAN AGE
2.5
AVG FAMILY SIZE
1.5
AVG HOUSEHOLD SIZE
133
LABOR FORCE [ PEOPLE ]
43.6%
PERCENT IN LABOR FORCE
9.8%
UNEMPLOYMENT RATE
Quechee Zip Codes
Quechee Area Codes
Income in Quechee
Income Overview in Quechee
Per Capita Income in Quechee is $55,235, while median incomes of families and households are $39,118 and $50,547 respectively.
| Characteristic | Number | Measure |
| Per Capita Income | 340 | $55,235 |
| Median Family Income | 70 | $39,118 |
| Mean Family Income | 70 | $43,586 |
| Median Household Income | 221 | $50,547 |
| Mean Household Income | 221 | $84,956 |
| Income Deficit | 70 | $0 |
| Wage / Income Gap (%) | 340 | 0.00% |
| Wage / Income Gap ($) | 340 | 100.00¢ per $1 |
| Gini / Inequality Index | 340 | 0.44 |
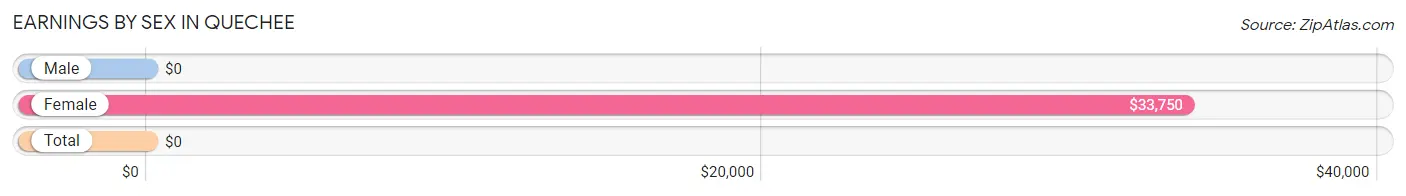
Earnings by Sex in Quechee
| Sex | Number | Average Earnings |
| Male | 65 (48.9%) | $0 |
| Female | 68 (51.1%) | $33,750 |
| Total | 133 (100.0%) | $0 |
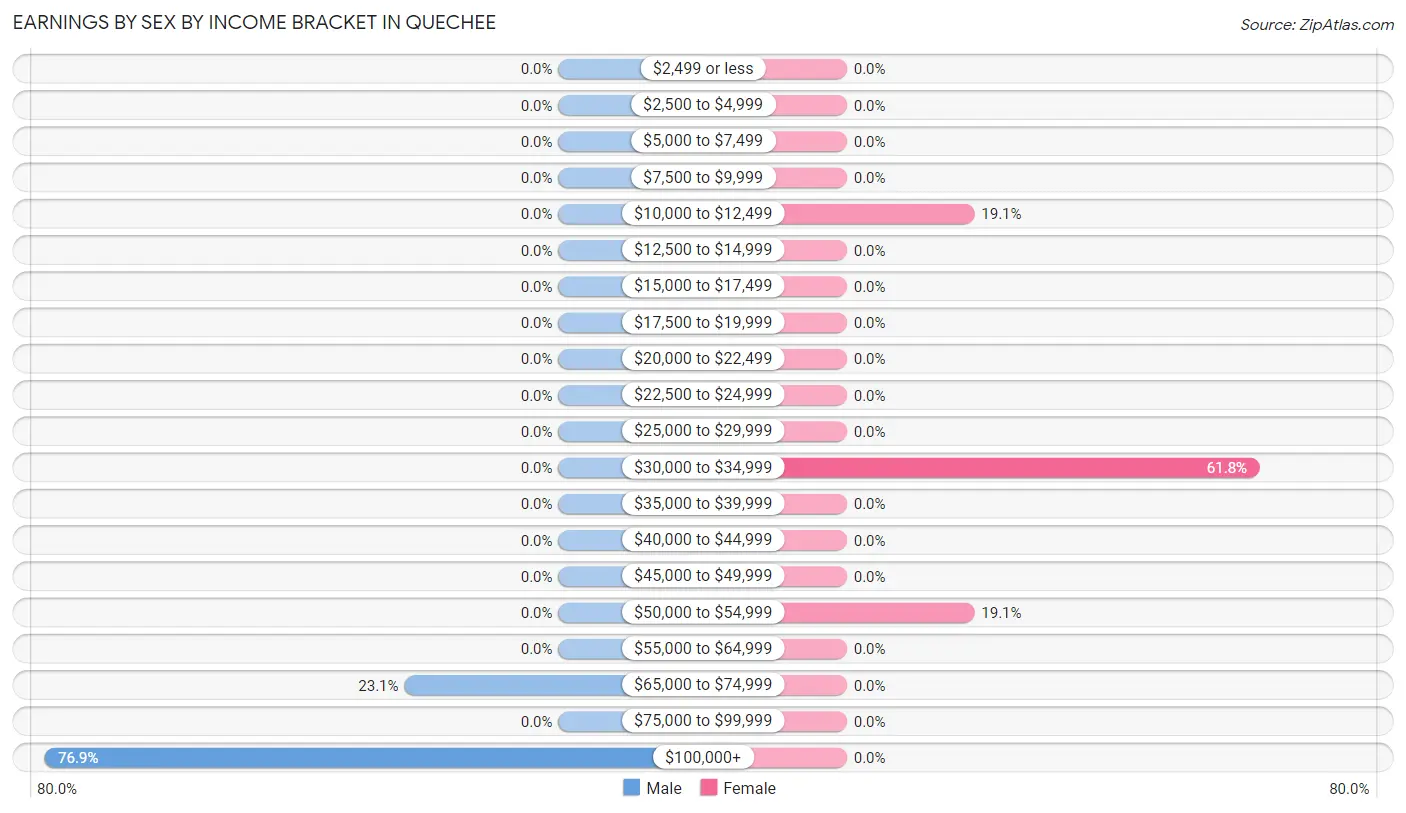
Earnings by Sex by Income Bracket in Quechee
The most common earnings brackets in Quechee are $100,000+ for men (50 | 76.9%) and $30,000 to $34,999 for women (42 | 61.8%).
| Income | Male | Female |
| $2,499 or less | 0 (0.0%) | 0 (0.0%) |
| $2,500 to $4,999 | 0 (0.0%) | 0 (0.0%) |
| $5,000 to $7,499 | 0 (0.0%) | 0 (0.0%) |
| $7,500 to $9,999 | 0 (0.0%) | 0 (0.0%) |
| $10,000 to $12,499 | 0 (0.0%) | 13 (19.1%) |
| $12,500 to $14,999 | 0 (0.0%) | 0 (0.0%) |
| $15,000 to $17,499 | 0 (0.0%) | 0 (0.0%) |
| $17,500 to $19,999 | 0 (0.0%) | 0 (0.0%) |
| $20,000 to $22,499 | 0 (0.0%) | 0 (0.0%) |
| $22,500 to $24,999 | 0 (0.0%) | 0 (0.0%) |
| $25,000 to $29,999 | 0 (0.0%) | 0 (0.0%) |
| $30,000 to $34,999 | 0 (0.0%) | 42 (61.8%) |
| $35,000 to $39,999 | 0 (0.0%) | 0 (0.0%) |
| $40,000 to $44,999 | 0 (0.0%) | 0 (0.0%) |
| $45,000 to $49,999 | 0 (0.0%) | 0 (0.0%) |
| $50,000 to $54,999 | 0 (0.0%) | 13 (19.1%) |
| $55,000 to $64,999 | 0 (0.0%) | 0 (0.0%) |
| $65,000 to $74,999 | 15 (23.1%) | 0 (0.0%) |
| $75,000 to $99,999 | 0 (0.0%) | 0 (0.0%) |
| $100,000+ | 50 (76.9%) | 0 (0.0%) |
| Total | 65 (100.0%) | 68 (100.0%) |
Earnings by Sex by Educational Attainment in Quechee
| Educational Attainment | Male Income | Female Income |
| Less than High School | - | - |
| High School Diploma | - | - |
| College or Associate's Degree | - | - |
| Bachelor's Degree | - | - |
| Graduate Degree | - | - |
| Total | - | - |
Family Income in Quechee
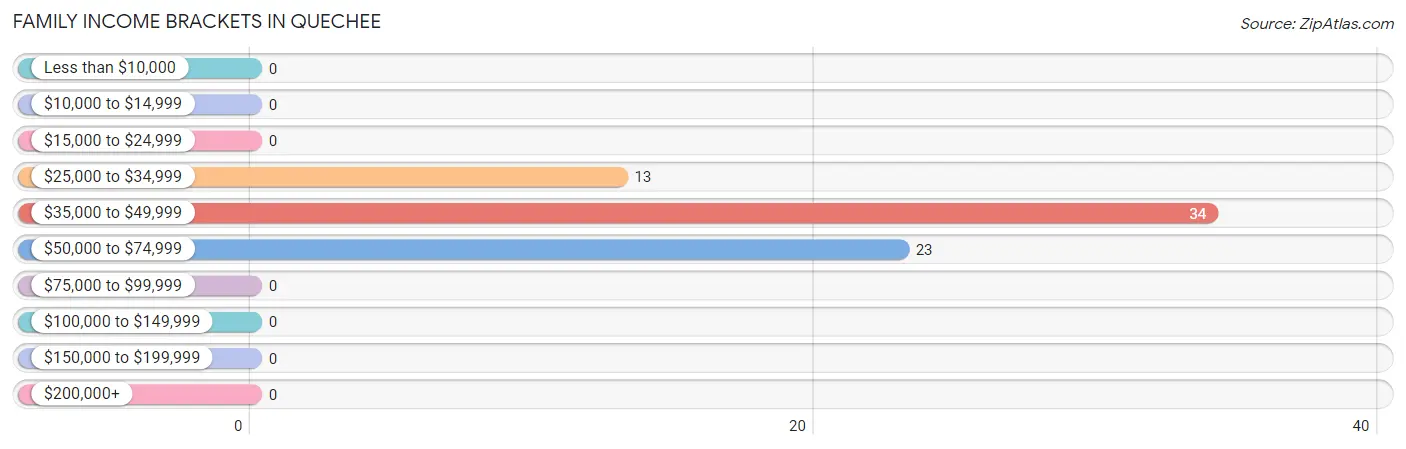
Family Income Brackets in Quechee
According to the Quechee family income data, there are 34 families falling into the $35,000 to $49,999 income range, which is the most common income bracket and makes up 48.6% of all families.
| Income Bracket | # Families | % Families |
| Less than $10,000 | 0 | 0.0% |
| $10,000 to $14,999 | 0 | 0.0% |
| $15,000 to $24,999 | 0 | 0.0% |
| $25,000 to $34,999 | 13 | 18.6% |
| $35,000 to $49,999 | 34 | 48.6% |
| $50,000 to $74,999 | 23 | 32.9% |
| $75,000 to $99,999 | 0 | 0.0% |
| $100,000 to $149,999 | 0 | 0.0% |
| $150,000 to $199,999 | 0 | 0.0% |
| $200,000+ | 0 | 0.0% |
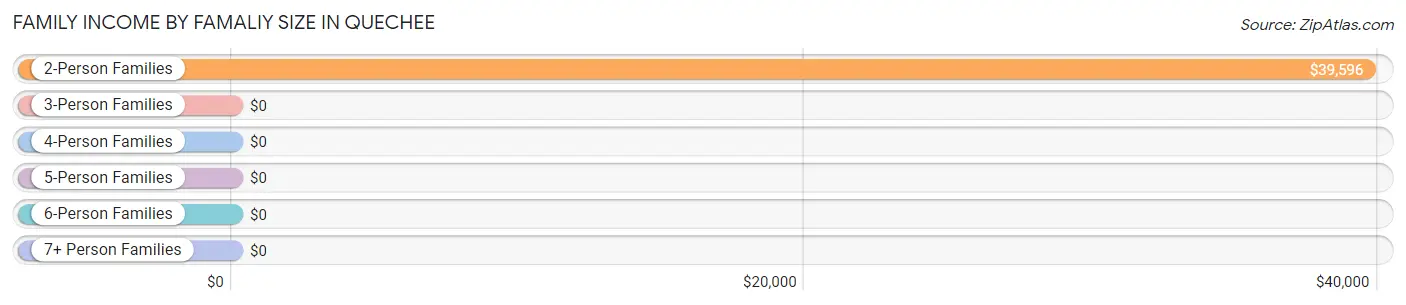
Family Income by Famaliy Size in Quechee
2-person families (57 | 81.4%) account for the highest median family income in Quechee with $39,596 per family, while 2-person families (57 | 81.4%) have the highest median income of $19,798 per family member.
| Income Bracket | # Families | Median Income |
| 2-Person Families | 57 (81.4%) | $39,596 |
| 3-Person Families | 0 (0.0%) | $0 |
| 4-Person Families | 0 (0.0%) | $0 |
| 5-Person Families | 13 (18.6%) | $0 |
| 6-Person Families | 0 (0.0%) | $0 |
| 7+ Person Families | 0 (0.0%) | $0 |
| Total | 70 (100.0%) | $39,118 |
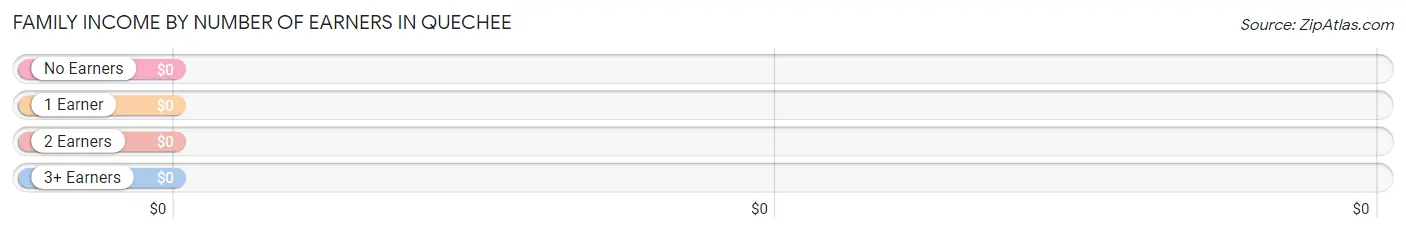
Family Income by Number of Earners in Quechee
| Number of Earners | # Families | Median Income |
| No Earners | 44 (62.9%) | $0 |
| 1 Earner | 26 (37.1%) | $0 |
| 2 Earners | 0 (0.0%) | $0 |
| 3+ Earners | 0 (0.0%) | $0 |
| Total | 70 (100.0%) | $39,118 |
Household Income in Quechee
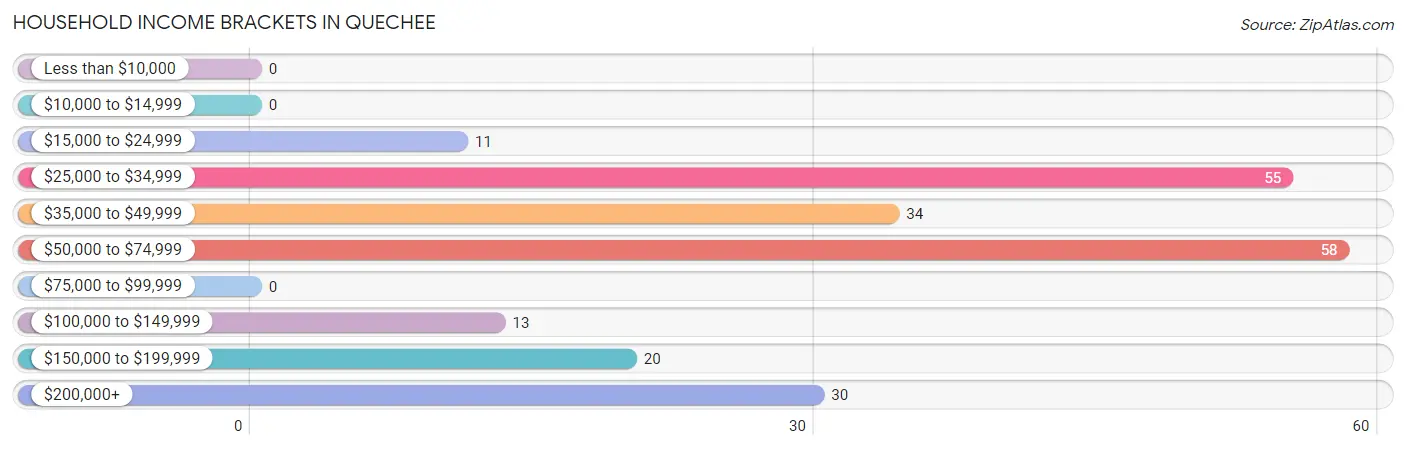
Household Income Brackets in Quechee
With 58 households falling in the category, the $50,000 to $74,999 income range is the most frequent in Quechee, accounting for 26.2% of all households.
| Income Bracket | # Households | % Households |
| Less than $10,000 | 0 | 0.0% |
| $10,000 to $14,999 | 0 | 0.0% |
| $15,000 to $24,999 | 11 | 5.0% |
| $25,000 to $34,999 | 55 | 24.9% |
| $35,000 to $49,999 | 34 | 15.4% |
| $50,000 to $74,999 | 58 | 26.2% |
| $75,000 to $99,999 | 0 | 0.0% |
| $100,000 to $149,999 | 13 | 5.9% |
| $150,000 to $199,999 | 20 | 9.0% |
| $200,000+ | 30 | 13.6% |
Household Income by Householder Age in Quechee
The median household income in Quechee is $50,547, with the highest median household income of $50,339 found in the 65+ years age bracket for the primary householder. A total of 103 households (46.6%) fall into this category.
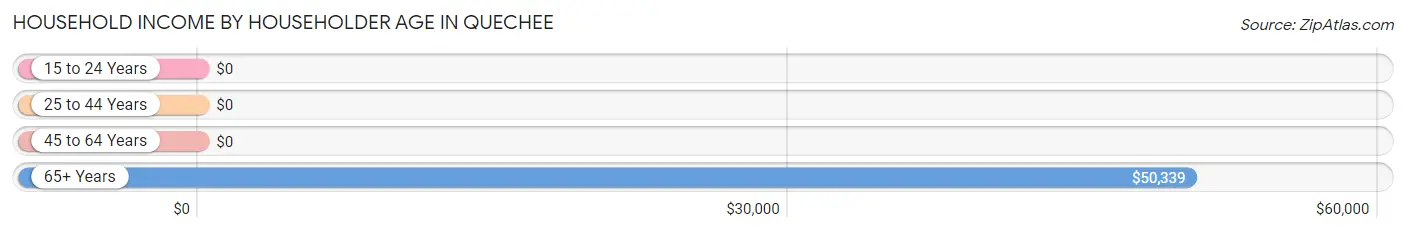
| Income Bracket | # Households | Median Income |
| 15 to 24 Years | 0 (0.0%) | $0 |
| 25 to 44 Years | 33 (14.9%) | $0 |
| 45 to 64 Years | 85 (38.5%) | $0 |
| 65+ Years | 103 (46.6%) | $50,339 |
| Total | 221 (100.0%) | $50,547 |
Poverty in Quechee
Income Below Poverty by Sex and Age in Quechee
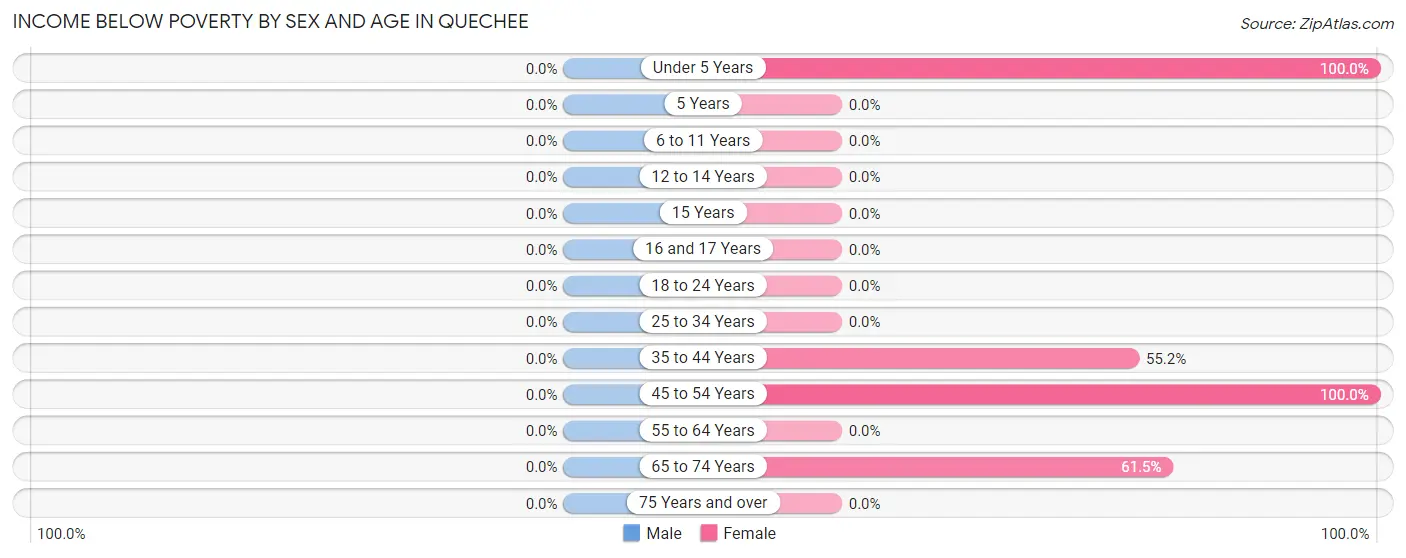
| Age Bracket | Male | Female |
| Under 5 Years | 0 (0.0%) | 18 (100.0%) |
| 5 Years | 0 (0.0%) | 0 (0.0%) |
| 6 to 11 Years | 0 (0.0%) | 0 (0.0%) |
| 12 to 14 Years | 0 (0.0%) | 0 (0.0%) |
| 15 Years | 0 (0.0%) | 0 (0.0%) |
| 16 and 17 Years | 0 (0.0%) | 0 (0.0%) |
| 18 to 24 Years | 0 (0.0%) | 0 (0.0%) |
| 25 to 34 Years | 0 (0.0%) | 0 (0.0%) |
| 35 to 44 Years | 0 (0.0%) | 16 (55.2%) |
| 45 to 54 Years | 0 (0.0%) | 13 (100.0%) |
| 55 to 64 Years | 0 (0.0%) | 0 (0.0%) |
| 65 to 74 Years | 0 (0.0%) | 16 (61.5%) |
| 75 Years and over | 0 (0.0%) | 0 (0.0%) |
| Total | 0 (0.0%) | 63 (26.5%) |
Income Above Poverty by Sex and Age in Quechee
According to the poverty statistics in Quechee, males aged 35 to 44 years and females aged 6 to 11 years are the age groups that are most secure financially, with 100.0% of males and 100.0% of females in these age groups living above the poverty line.
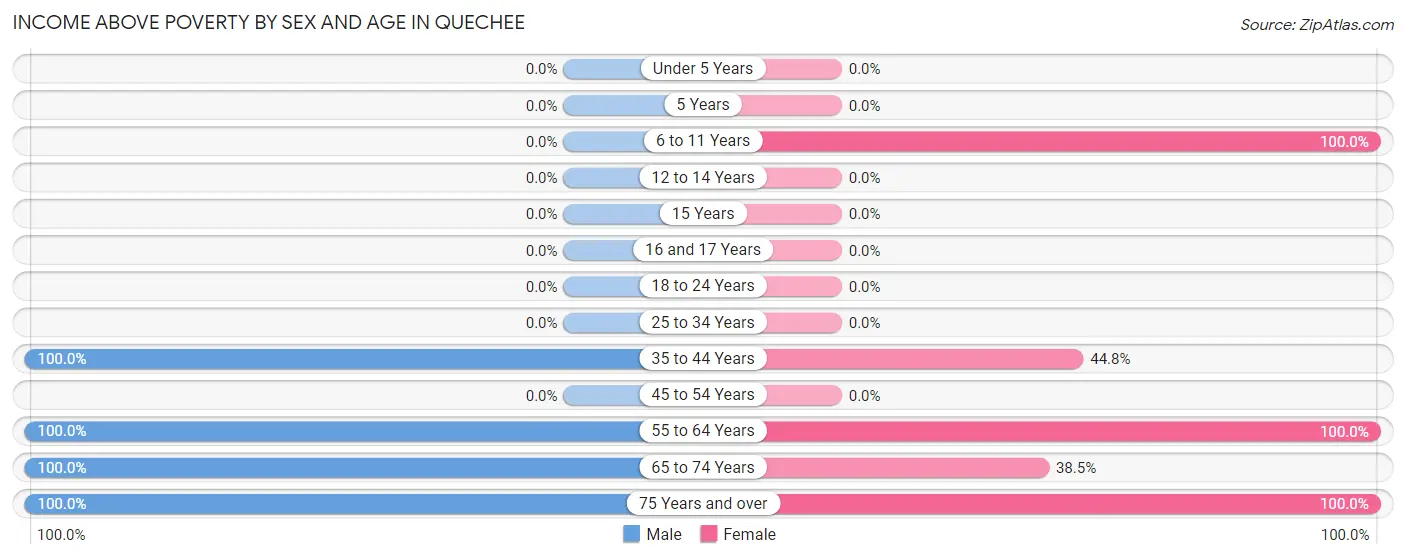
| Age Bracket | Male | Female |
| Under 5 Years | 0 (0.0%) | 0 (0.0%) |
| 5 Years | 0 (0.0%) | 0 (0.0%) |
| 6 to 11 Years | 0 (0.0%) | 17 (100.0%) |
| 12 to 14 Years | 0 (0.0%) | 0 (0.0%) |
| 15 Years | 0 (0.0%) | 0 (0.0%) |
| 16 and 17 Years | 0 (0.0%) | 0 (0.0%) |
| 18 to 24 Years | 0 (0.0%) | 0 (0.0%) |
| 25 to 34 Years | 0 (0.0%) | 0 (0.0%) |
| 35 to 44 Years | 35 (100.0%) | 13 (44.8%) |
| 45 to 54 Years | 0 (0.0%) | 0 (0.0%) |
| 55 to 64 Years | 30 (100.0%) | 42 (100.0%) |
| 65 to 74 Years | 10 (100.0%) | 10 (38.5%) |
| 75 Years and over | 27 (100.0%) | 93 (100.0%) |
| Total | 102 (100.0%) | 175 (73.5%) |
Income Below Poverty Among Married-Couple Families in Quechee
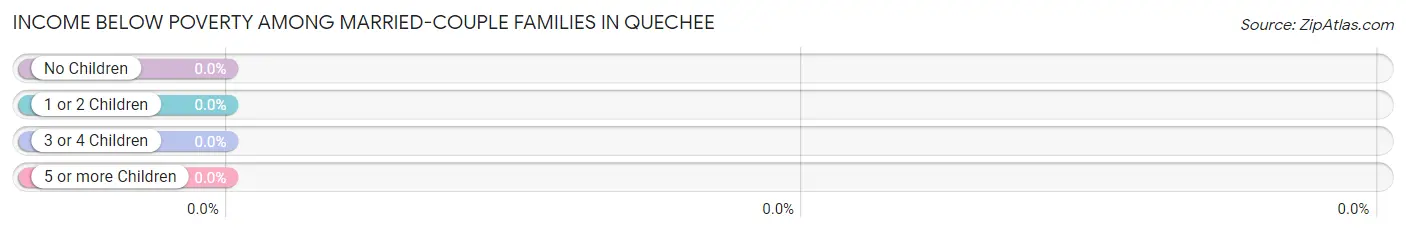
| Children | Above Poverty | Below Poverty |
| No Children | 44 (100.0%) | 0 (0.0%) |
| 1 or 2 Children | 0 (0.0%) | 0 (0.0%) |
| 3 or 4 Children | 0 (0.0%) | 0 (0.0%) |
| 5 or more Children | 0 (0.0%) | 0 (0.0%) |
| Total | 44 (100.0%) | 0 (0.0%) |
Income Below Poverty Among Single-Parent Households in Quechee
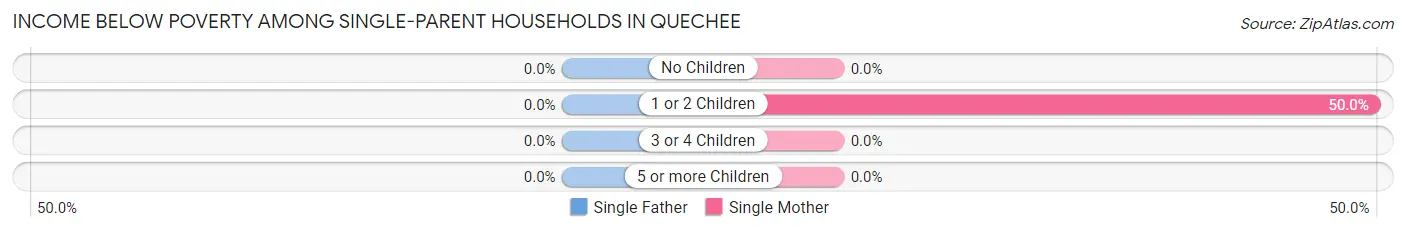
| Children | Single Father | Single Mother |
| No Children | 0 (0.0%) | 0 (0.0%) |
| 1 or 2 Children | 0 (0.0%) | 13 (50.0%) |
| 3 or 4 Children | 0 (0.0%) | 0 (0.0%) |
| 5 or more Children | 0 (0.0%) | 0 (0.0%) |
| Total | 0 (0.0%) | 13 (50.0%) |
Income Below Poverty Among Married-Couple vs Single-Parent Households in Quechee
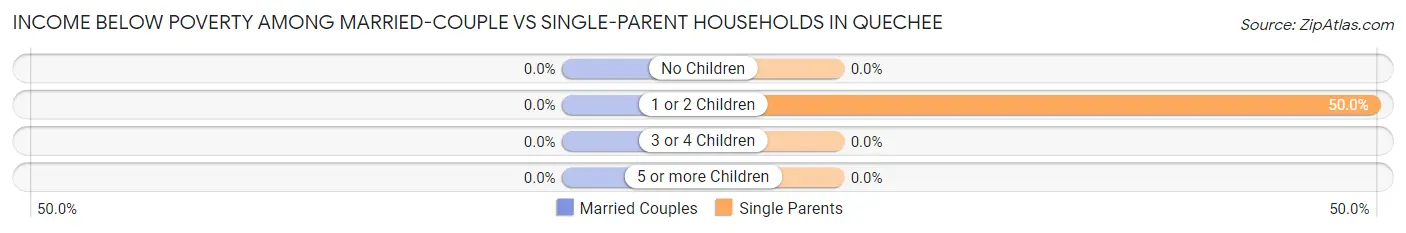
| Children | Married-Couple Families | Single-Parent Households |
| No Children | 0 (0.0%) | 0 (0.0%) |
| 1 or 2 Children | 0 (0.0%) | 13 (50.0%) |
| 3 or 4 Children | 0 (0.0%) | 0 (0.0%) |
| 5 or more Children | 0 (0.0%) | 0 (0.0%) |
| Total | 0 (0.0%) | 13 (50.0%) |
Race in Quechee
The most populous races in Quechee are , and White / Caucasian (340 | 100.0%).
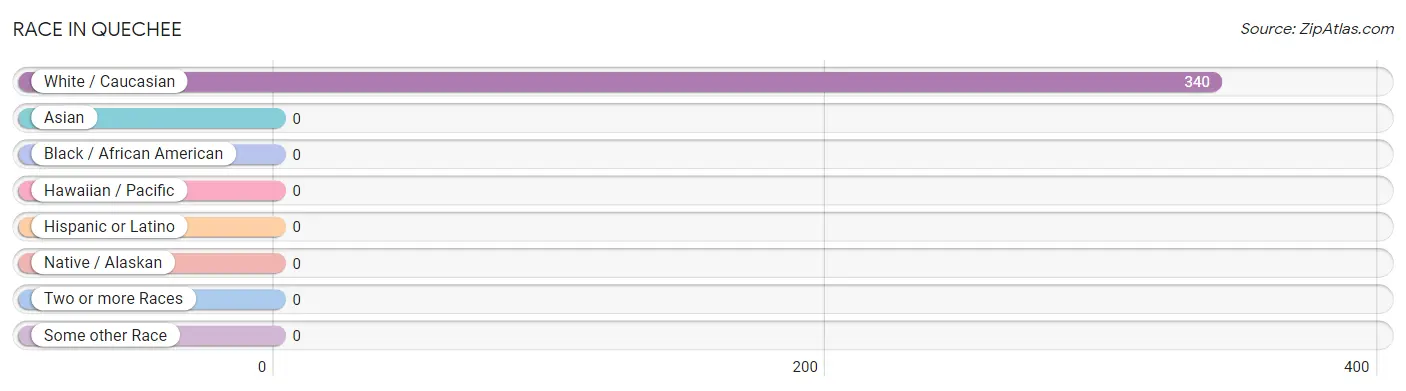
| Race | # Population | % Population |
| Asian | 0 | 0.0% |
| Black / African American | 0 | 0.0% |
| Hawaiian / Pacific | 0 | 0.0% |
| Hispanic or Latino | 0 | 0.0% |
| Native / Alaskan | 0 | 0.0% |
| White / Caucasian | 340 | 100.0% |
| Two or more Races | 0 | 0.0% |
| Some other Race | 0 | 0.0% |
| Total | 340 | 100.0% |
Ancestry in Quechee
The most populous ancestries reported in Quechee are French Canadian (124 | 36.5%), Irish (116 | 34.1%), English (110 | 32.4%), Scotch-Irish (41 | 12.1%), and German (30 | 8.8%), together accounting for 123.8% of all Quechee residents.
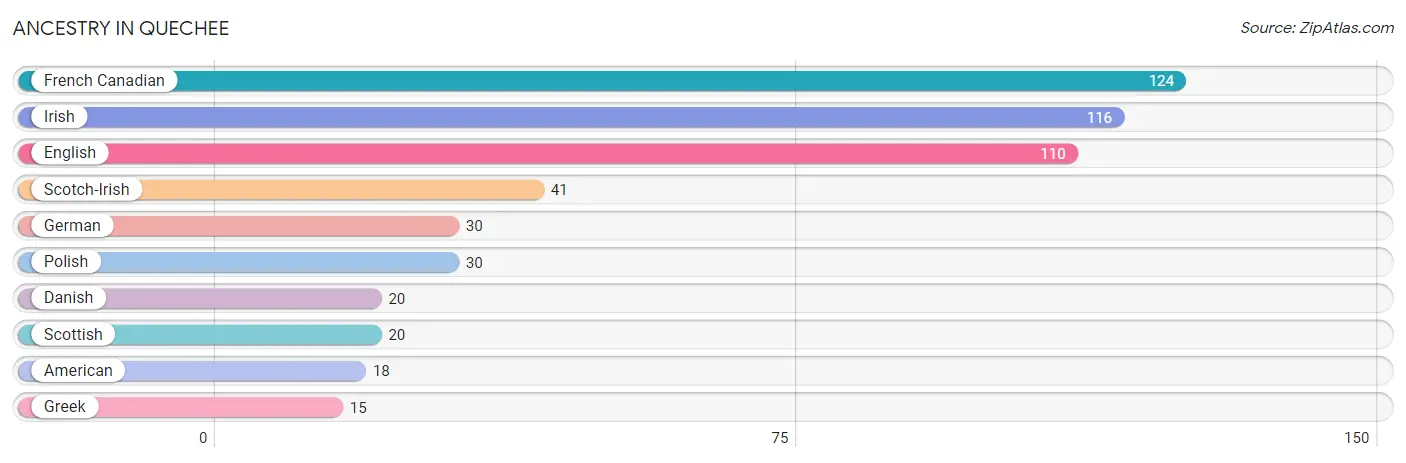
| Ancestry | # Population | % Population |
| American | 18 | 5.3% |
| Danish | 20 | 5.9% |
| English | 110 | 32.4% |
| French Canadian | 124 | 36.5% |
| German | 30 | 8.8% |
| Greek | 15 | 4.4% |
| Irish | 116 | 34.1% |
| Polish | 30 | 8.8% |
| Scotch-Irish | 41 | 12.1% |
| Scottish | 20 | 5.9% | View All 10 Rows |
Immigrants in Quechee

| Immigration Origin | # Population | % Population | View All 0 Rows |
Sex and Age in Quechee
Sex and Age in Quechee
The most populous age groups in Quechee are 55 to 59 Years (30 | 29.4%) for men and 85 Years and over (82 | 34.4%) for women.
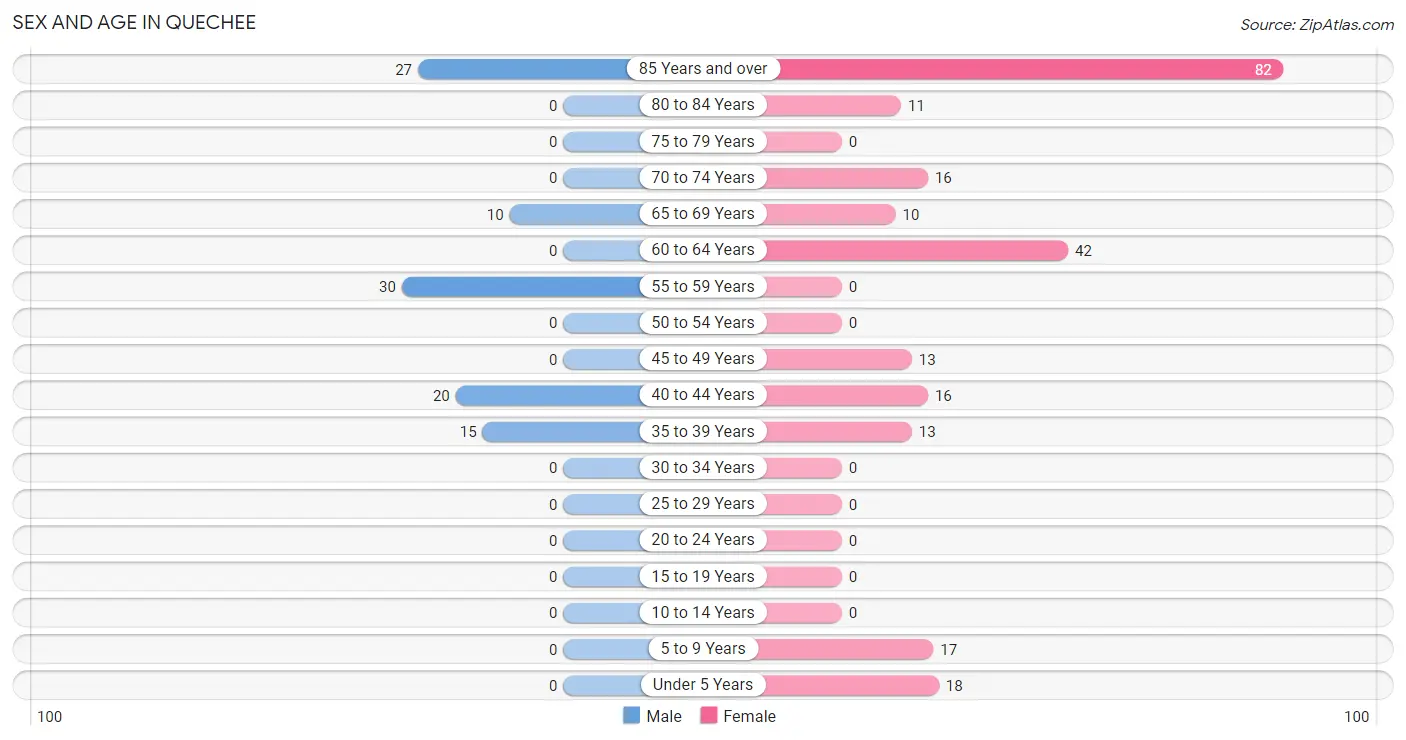
| Age Bracket | Male | Female |
| Under 5 Years | 0 (0.0%) | 18 (7.6%) |
| 5 to 9 Years | 0 (0.0%) | 17 (7.1%) |
| 10 to 14 Years | 0 (0.0%) | 0 (0.0%) |
| 15 to 19 Years | 0 (0.0%) | 0 (0.0%) |
| 20 to 24 Years | 0 (0.0%) | 0 (0.0%) |
| 25 to 29 Years | 0 (0.0%) | 0 (0.0%) |
| 30 to 34 Years | 0 (0.0%) | 0 (0.0%) |
| 35 to 39 Years | 15 (14.7%) | 13 (5.5%) |
| 40 to 44 Years | 20 (19.6%) | 16 (6.7%) |
| 45 to 49 Years | 0 (0.0%) | 13 (5.5%) |
| 50 to 54 Years | 0 (0.0%) | 0 (0.0%) |
| 55 to 59 Years | 30 (29.4%) | 0 (0.0%) |
| 60 to 64 Years | 0 (0.0%) | 42 (17.6%) |
| 65 to 69 Years | 10 (9.8%) | 10 (4.2%) |
| 70 to 74 Years | 0 (0.0%) | 16 (6.7%) |
| 75 to 79 Years | 0 (0.0%) | 0 (0.0%) |
| 80 to 84 Years | 0 (0.0%) | 11 (4.6%) |
| 85 Years and over | 27 (26.5%) | 82 (34.4%) |
| Total | 102 (100.0%) | 238 (100.0%) |
Families and Households in Quechee
Median Family Size in Quechee
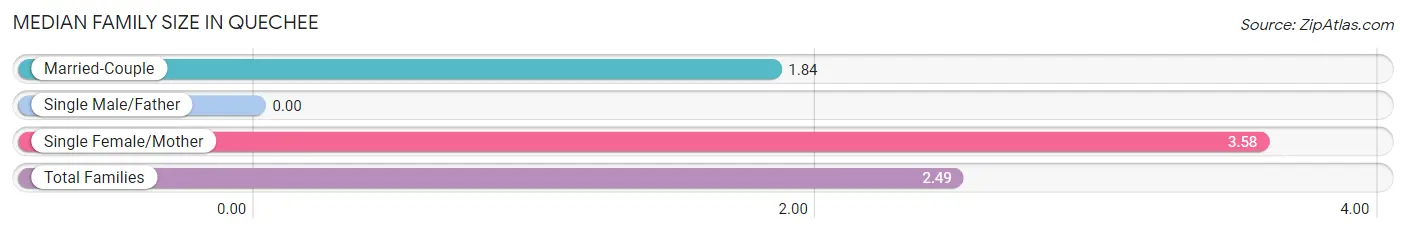
| Family Type | # Families | Family Size |
| Married-Couple | 44 (62.9%) | 1.84 |
| Single Male/Father | 0 (0.0%) | - |
| Single Female/Mother | 26 (37.1%) | 3.58 |
| Total Families | 70 (100.0%) | 2.49 |
Median Household Size in Quechee
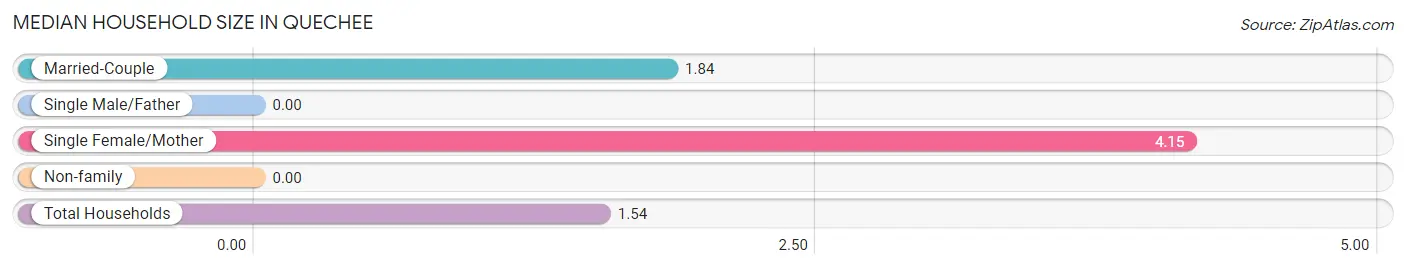
| Household Type | # Households | Household Size |
| Married-Couple | 44 (19.9%) | 1.84 |
| Single Male/Father | 0 (0.0%) | - |
| Single Female/Mother | 26 (11.8%) | 4.15 |
| Non-family | 151 (68.3%) | - |
| Total Households | 221 (100.0%) | 1.54 |
Household Size by Marriage Status in Quechee
Out of a total of 221 households in Quechee, 70 (31.7%) are family households, while 151 (68.3%) are nonfamily households. The most numerous type of family households are 2-person households, comprising 44, and the most common type of nonfamily households are 1-person households, comprising 151.
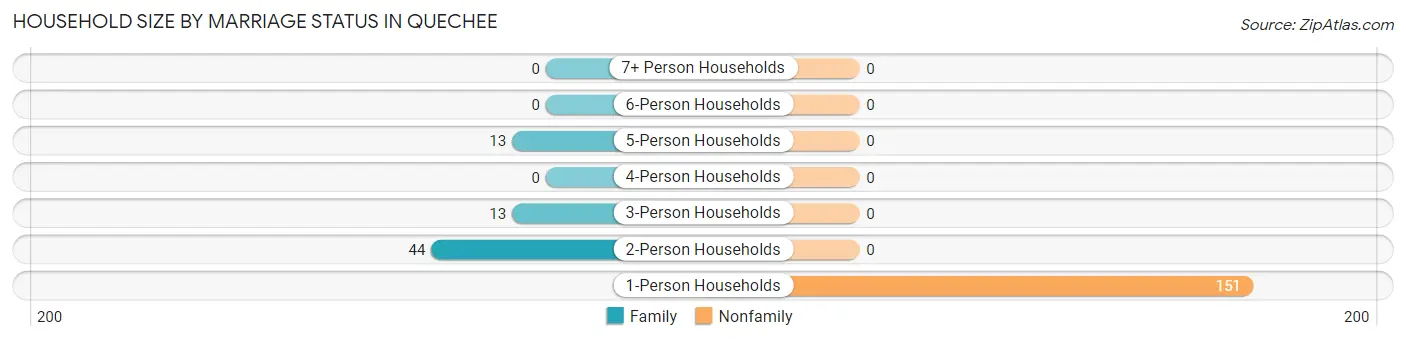
| Household Size | Family Households | Nonfamily Households |
| 1-Person Households | - | 151 (68.3%) |
| 2-Person Households | 44 (19.9%) | 0 (0.0%) |
| 3-Person Households | 13 (5.9%) | 0 (0.0%) |
| 4-Person Households | 0 (0.0%) | 0 (0.0%) |
| 5-Person Households | 13 (5.9%) | 0 (0.0%) |
| 6-Person Households | 0 (0.0%) | 0 (0.0%) |
| 7+ Person Households | 0 (0.0%) | 0 (0.0%) |
| Total | 70 (31.7%) | 151 (68.3%) |
Female Fertility in Quechee
Fertility by Age in Quechee
| Age Bracket | Women with Births | Births / 1,000 Women |
| 15 to 19 years | 0 (0.0%) | 0.0 |
| 20 to 34 years | 0 (0.0%) | 0.0 |
| 35 to 50 years | 0 (0.0%) | 0.0 |
| Total | 0 (0.0%) | 0.0 |
Fertility by Age by Marriage Status in Quechee
| Age Bracket | Married | Unmarried |
| 15 to 19 years | 0 (0.0%) | 0 (0.0%) |
| 20 to 34 years | 0 (0.0%) | 0 (0.0%) |
| 35 to 50 years | 0 (0.0%) | 0 (0.0%) |
| Total | 0 (0.0%) | 0 (0.0%) |
Fertility by Education in Quechee
| Educational Attainment | Women with Births | Births / 1,000 Women |
| Less than High School | 0 (0.0%) | 0.0 |
| High School Diploma | 0 (0.0%) | 0.0 |
| College or Associate's Degree | 0 (0.0%) | 0.0 |
| Bachelor's Degree | 0 (0.0%) | 0.0 |
| Graduate Degree | 0 (0.0%) | 0.0 |
| Total | 0 (0.0%) | 0.0 |
Fertility by Education by Marriage Status in Quechee
| Educational Attainment | Married | Unmarried |
| Less than High School | 0 (0.0%) | 0 (0.0%) |
| High School Diploma | 0 (0.0%) | 0 (0.0%) |
| College or Associate's Degree | 0 (0.0%) | 0 (0.0%) |
| Bachelor's Degree | 0 (0.0%) | 0 (0.0%) |
| Graduate Degree | 0 (0.0%) | 0 (0.0%) |
| Total | 0 (0.0%) | 0 (0.0%) |
Employment Characteristics in Quechee
Employment by Class of Employer in Quechee
Among the 120 employed individuals in Quechee, private company employees (77 | 64.2%), unpaid family workers (30 | 25.0%), and not-for-profit organizations (13 | 10.8%) make up the most common classes of employment.
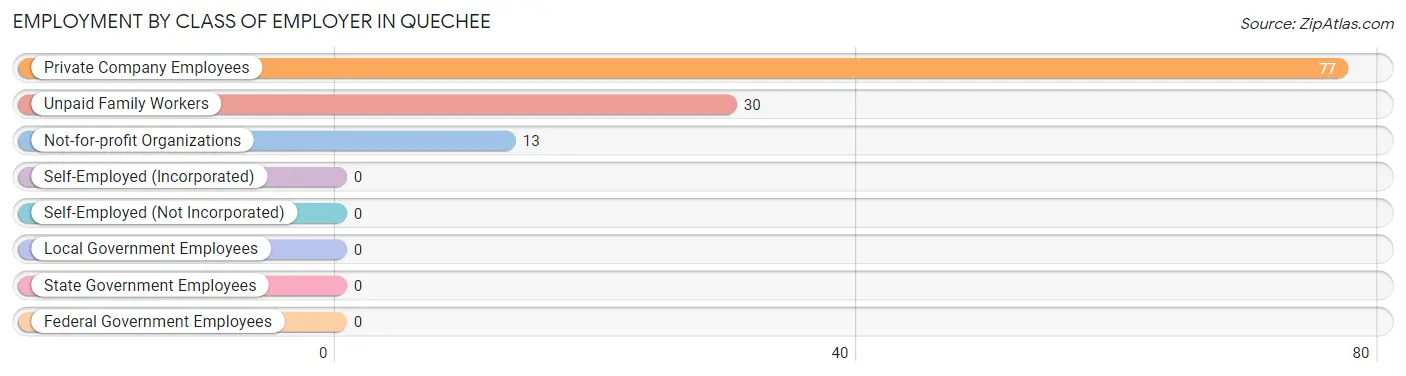
| Employer Class | # Employees | % Employees |
| Private Company Employees | 77 | 64.2% |
| Self-Employed (Incorporated) | 0 | 0.0% |
| Self-Employed (Not Incorporated) | 0 | 0.0% |
| Not-for-profit Organizations | 13 | 10.8% |
| Local Government Employees | 0 | 0.0% |
| State Government Employees | 0 | 0.0% |
| Federal Government Employees | 0 | 0.0% |
| Unpaid Family Workers | 30 | 25.0% |
| Total | 120 | 100.0% |
Employment Status by Age in Quechee
According to the labor force statistics for Quechee, out of the total population over 16 years of age (305), 43.6% or 133 individuals are in the labor force, with 9.8% or 13 of them unemployed. The age group with the highest labor force participation rate is 45 to 54 years, with 100.0% or 13 individuals in the labor force. Within the labor force, the 45 to 54 years age range has the highest percentage of unemployed individuals, with 100.0% or 13 of them being unemployed.
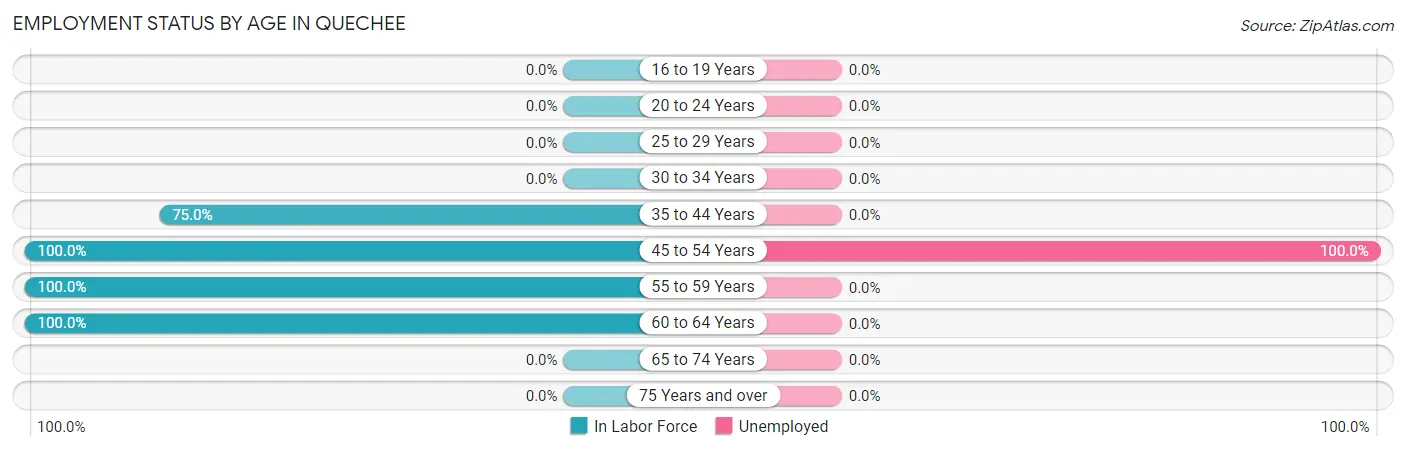
| Age Bracket | In Labor Force | Unemployed |
| 16 to 19 Years | 0 (0.0%) | 0 (0.0%) |
| 20 to 24 Years | 0 (0.0%) | 0 (0.0%) |
| 25 to 29 Years | 0 (0.0%) | 0 (0.0%) |
| 30 to 34 Years | 0 (0.0%) | 0 (0.0%) |
| 35 to 44 Years | 48 (75.0%) | 0 (0.0%) |
| 45 to 54 Years | 13 (100.0%) | 13 (100.0%) |
| 55 to 59 Years | 30 (100.0%) | 0 (0.0%) |
| 60 to 64 Years | 42 (100.0%) | 0 (0.0%) |
| 65 to 74 Years | 0 (0.0%) | 0 (0.0%) |
| 75 Years and over | 0 (0.0%) | 0 (0.0%) |
| Total | 133 (43.6%) | 13 (9.8%) |
Employment Status by Educational Attainment in Quechee
According to labor force statistics for Quechee, 89.3% of individuals (133) out of the total population between 25 and 64 years of age (149) are in the labor force, with 9.8% or 13 of them being unemployed. The group with the highest labor force participation rate are those with the educational attainment of bachelor's degree or higher, with 100.0% or 120 individuals in the labor force. Within the labor force, individuals with high school diploma education have the highest percentage of unemployment, with 100.0% or 13 of them being unemployed.
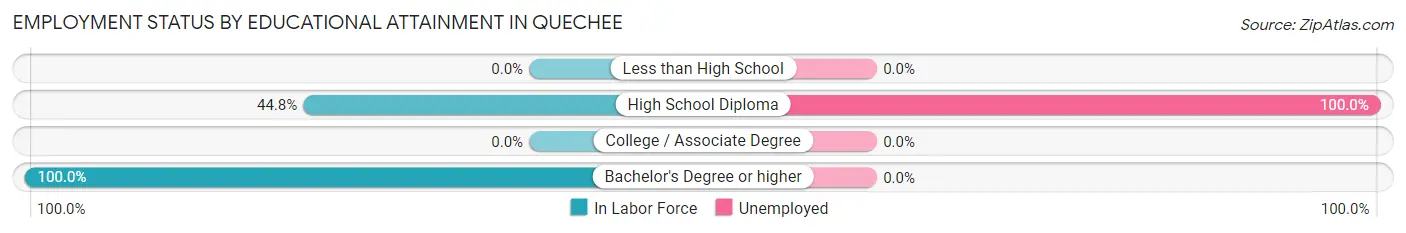
| Educational Attainment | In Labor Force | Unemployed |
| Less than High School | 0 (0.0%) | 0 (0.0%) |
| High School Diploma | 13 (44.8%) | 29 (100.0%) |
| College / Associate Degree | 0 (0.0%) | 0 (0.0%) |
| Bachelor's Degree or higher | 120 (100.0%) | 0 (0.0%) |
| Total | 133 (89.3%) | 15 (9.8%) |
Employment Occupations by Sex in Quechee
Management, Business, Science and Arts Occupations
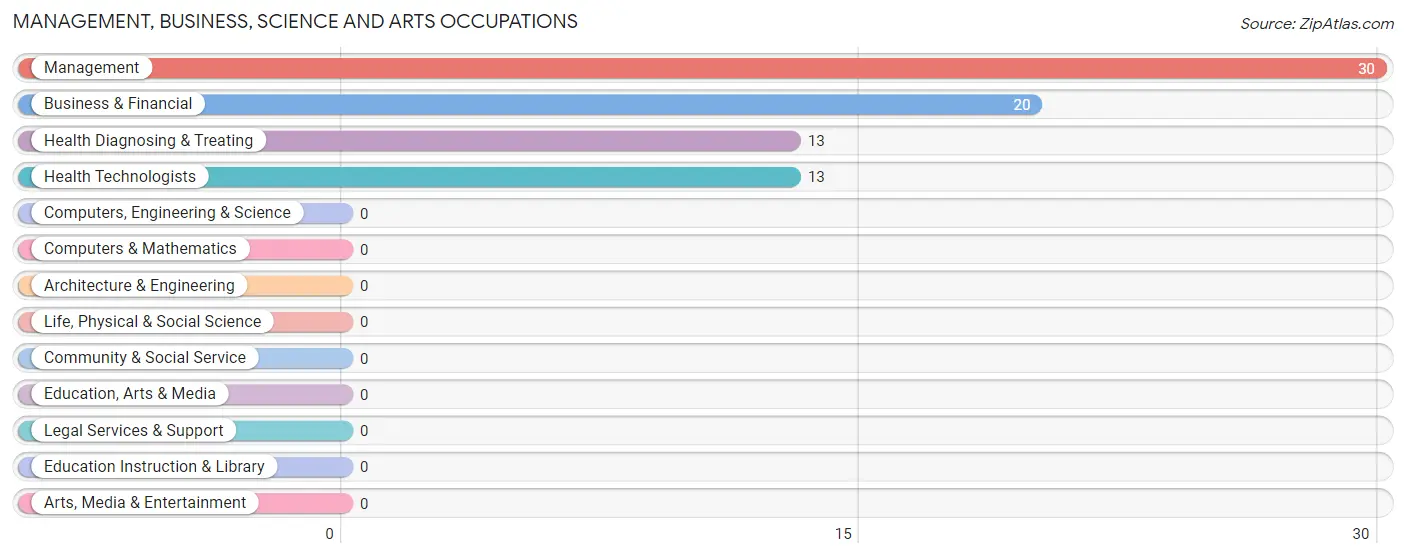
The most common Management, Business, Science and Arts occupations in Quechee are Management (30 | 25.0%), Business & Financial (20 | 16.7%), Health Diagnosing & Treating (13 | 10.8%), and Health Technologists (13 | 10.8%).
Management, Business, Science and Arts Occupations by Sex
Within the Management, Business, Science and Arts occupations in Quechee, the most male-oriented occupations are Management (100.0%), and Business & Financial (100.0%), while the most female-oriented occupations are Health Diagnosing & Treating (100.0%), and Health Technologists (100.0%).
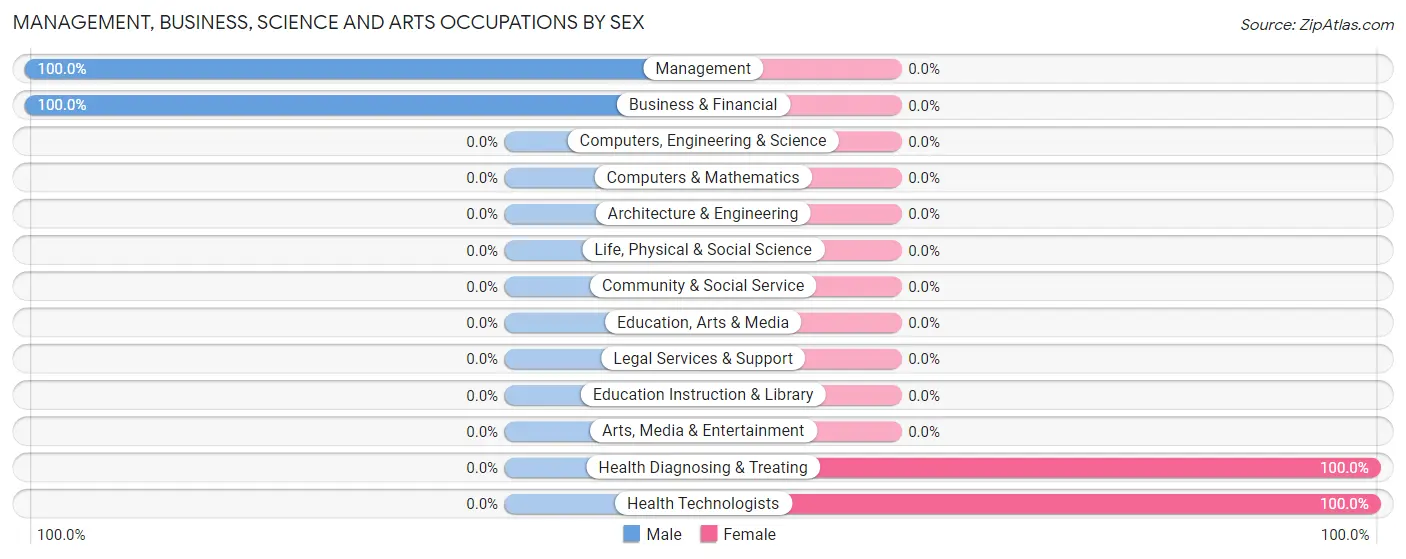
| Occupation | Male | Female |
| Management | 30 (100.0%) | 0 (0.0%) |
| Business & Financial | 20 (100.0%) | 0 (0.0%) |
| Computers, Engineering & Science | 0 (0.0%) | 0 (0.0%) |
| Computers & Mathematics | 0 (0.0%) | 0 (0.0%) |
| Architecture & Engineering | 0 (0.0%) | 0 (0.0%) |
| Life, Physical & Social Science | 0 (0.0%) | 0 (0.0%) |
| Community & Social Service | 0 (0.0%) | 0 (0.0%) |
| Education, Arts & Media | 0 (0.0%) | 0 (0.0%) |
| Legal Services & Support | 0 (0.0%) | 0 (0.0%) |
| Education Instruction & Library | 0 (0.0%) | 0 (0.0%) |
| Arts, Media & Entertainment | 0 (0.0%) | 0 (0.0%) |
| Health Diagnosing & Treating | 0 (0.0%) | 13 (100.0%) |
| Health Technologists | 0 (0.0%) | 13 (100.0%) |
| Total (Category) | 50 (79.4%) | 13 (20.6%) |
| Total (Overall) | 65 (54.2%) | 55 (45.8%) |
Services Occupations
Services Occupations by Sex
| Occupation | Male | Female |
| Healthcare Support | 0 (0.0%) | 0 (0.0%) |
| Security & Protection | 0 (0.0%) | 0 (0.0%) |
| Firefighting & Prevention | 0 (0.0%) | 0 (0.0%) |
| Law Enforcement | 0 (0.0%) | 0 (0.0%) |
| Food Preparation & Serving | 0 (0.0%) | 0 (0.0%) |
| Cleaning & Maintenance | 0 (0.0%) | 0 (0.0%) |
| Personal Care & Service | 0 (0.0%) | 0 (0.0%) |
| Total (Category) | 0 (0.0%) | 0 (0.0%) |
| Total (Overall) | 65 (54.2%) | 55 (45.8%) |
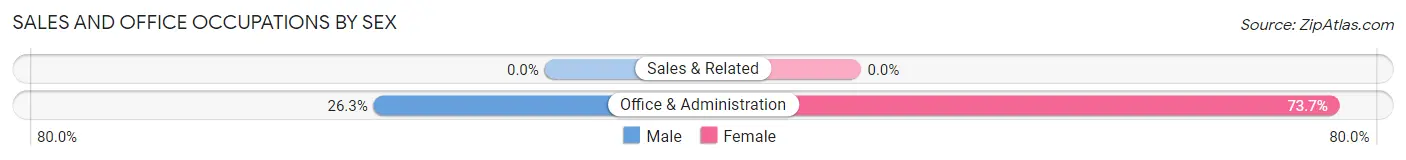
Sales and Office Occupations
The most common Sales and Office occupations in Quechee are , and Office & Administration (57 | 47.5%).
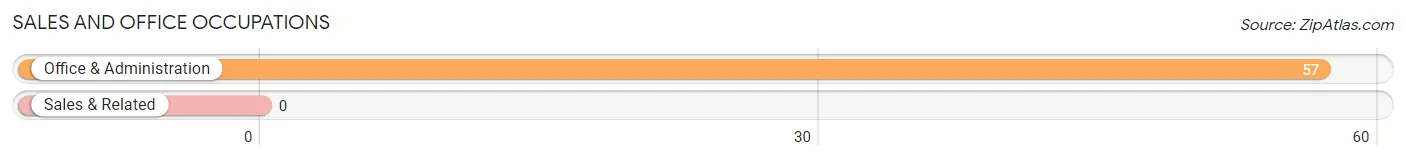
Sales and Office Occupations by Sex
| Occupation | Male | Female |
| Sales & Related | 0 (0.0%) | 0 (0.0%) |
| Office & Administration | 15 (26.3%) | 42 (73.7%) |
| Total (Category) | 15 (26.3%) | 42 (73.7%) |
| Total (Overall) | 65 (54.2%) | 55 (45.8%) |
Natural Resources, Construction and Maintenance Occupations
Natural Resources, Construction and Maintenance Occupations by Sex
| Occupation | Male | Female |
| Farming, Fishing & Forestry | 0 (0.0%) | 0 (0.0%) |
| Construction & Extraction | 0 (0.0%) | 0 (0.0%) |
| Installation, Maintenance & Repair | 0 (0.0%) | 0 (0.0%) |
| Total (Category) | 0 (0.0%) | 0 (0.0%) |
| Total (Overall) | 65 (54.2%) | 55 (45.8%) |
Production, Transportation and Moving Occupations
Production, Transportation and Moving Occupations by Sex
| Occupation | Male | Female |
| Production | 0 (0.0%) | 0 (0.0%) |
| Transportation | 0 (0.0%) | 0 (0.0%) |
| Material Moving | 0 (0.0%) | 0 (0.0%) |
| Total (Category) | 0 (0.0%) | 0 (0.0%) |
| Total (Overall) | 65 (54.2%) | 55 (45.8%) |
Employment Industries by Sex in Quechee
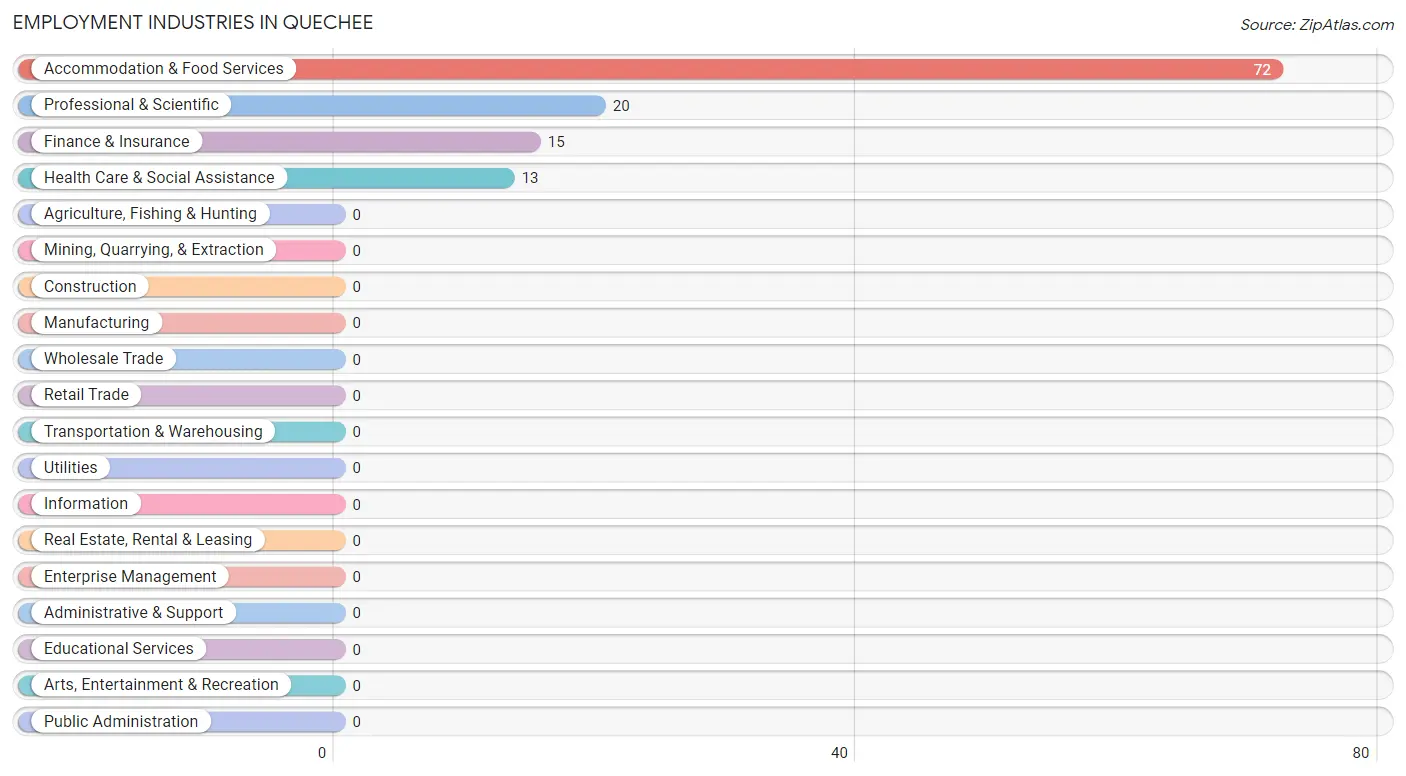
Employment Industries in Quechee
The major employment industries in Quechee include Accommodation & Food Services (72 | 60.0%), Professional & Scientific (20 | 16.7%), Finance & Insurance (15 | 12.5%), and Health Care & Social Assistance (13 | 10.8%).
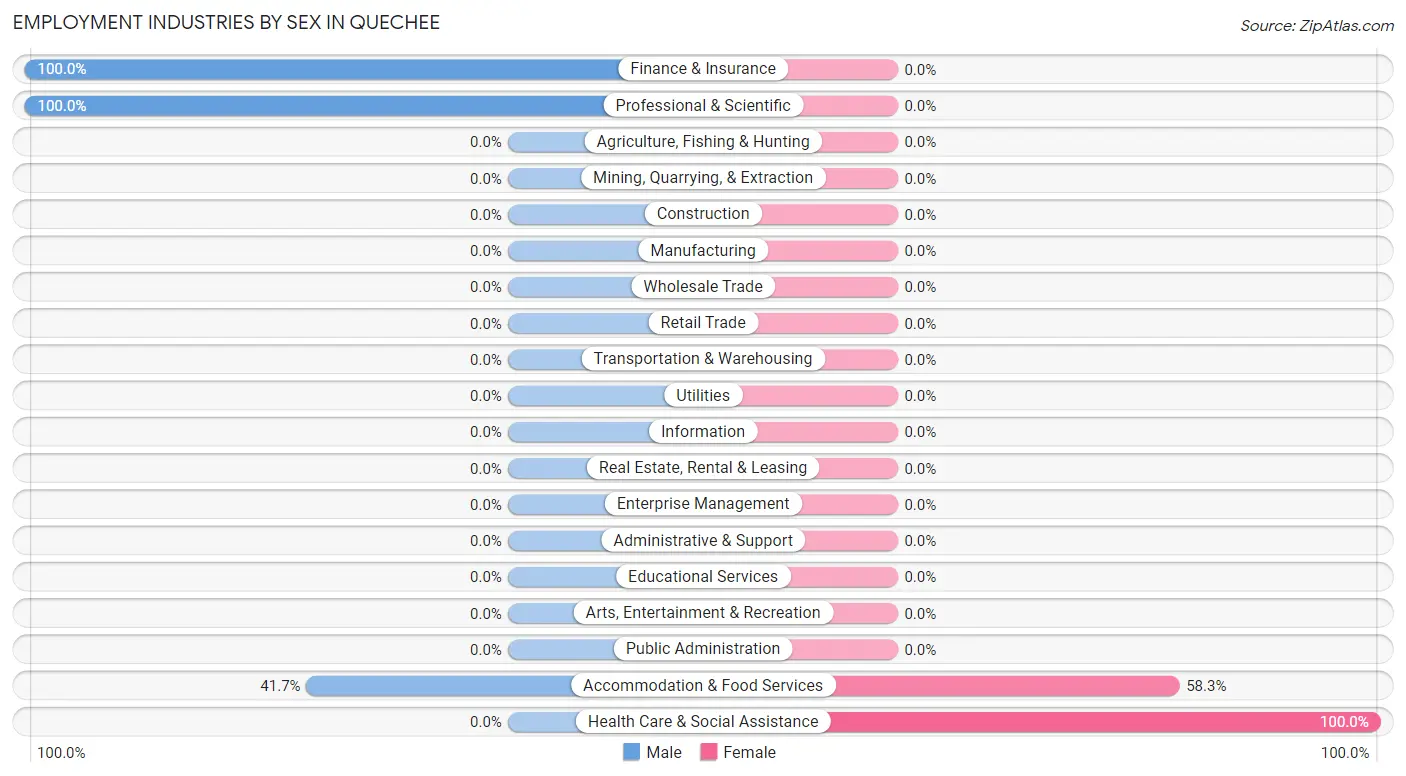
Employment Industries by Sex in Quechee
The Quechee industries that see more men than women are Finance & Insurance (100.0%), Professional & Scientific (100.0%), and Accommodation & Food Services (41.7%), whereas the industries that tend to have a higher number of women are Health Care & Social Assistance (100.0%), and Accommodation & Food Services (58.3%).
| Industry | Male | Female |
| Agriculture, Fishing & Hunting | 0 (0.0%) | 0 (0.0%) |
| Mining, Quarrying, & Extraction | 0 (0.0%) | 0 (0.0%) |
| Construction | 0 (0.0%) | 0 (0.0%) |
| Manufacturing | 0 (0.0%) | 0 (0.0%) |
| Wholesale Trade | 0 (0.0%) | 0 (0.0%) |
| Retail Trade | 0 (0.0%) | 0 (0.0%) |
| Transportation & Warehousing | 0 (0.0%) | 0 (0.0%) |
| Utilities | 0 (0.0%) | 0 (0.0%) |
| Information | 0 (0.0%) | 0 (0.0%) |
| Finance & Insurance | 15 (100.0%) | 0 (0.0%) |
| Real Estate, Rental & Leasing | 0 (0.0%) | 0 (0.0%) |
| Professional & Scientific | 20 (100.0%) | 0 (0.0%) |
| Enterprise Management | 0 (0.0%) | 0 (0.0%) |
| Administrative & Support | 0 (0.0%) | 0 (0.0%) |
| Educational Services | 0 (0.0%) | 0 (0.0%) |
| Health Care & Social Assistance | 0 (0.0%) | 13 (100.0%) |
| Arts, Entertainment & Recreation | 0 (0.0%) | 0 (0.0%) |
| Accommodation & Food Services | 30 (41.7%) | 42 (58.3%) |
| Public Administration | 0 (0.0%) | 0 (0.0%) |
| Total | 65 (54.2%) | 55 (45.8%) |
Education in Quechee
School Enrollment in Quechee
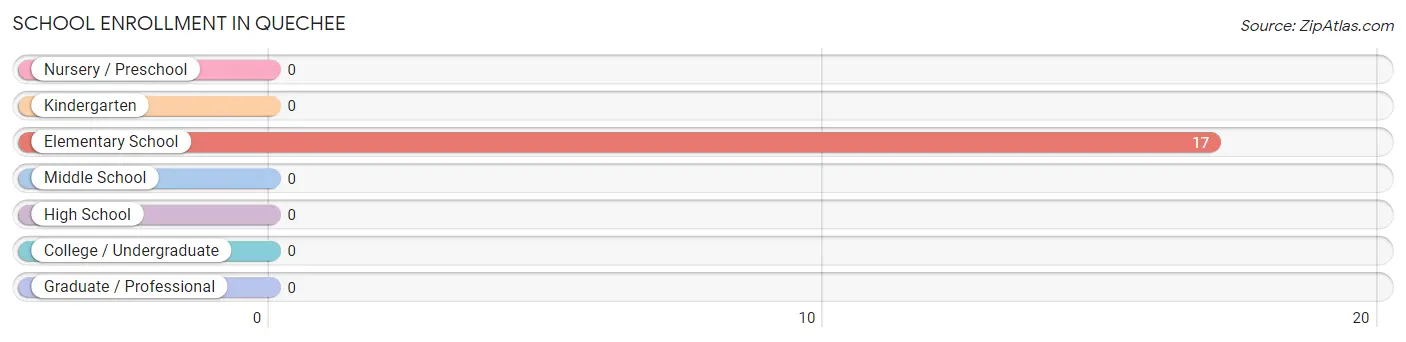
| School Level | # Students | % Students |
| Nursery / Preschool | 0 | 0.0% |
| Kindergarten | 0 | 0.0% |
| Elementary School | 17 | 100.0% |
| Middle School | 0 | 0.0% |
| High School | 0 | 0.0% |
| College / Undergraduate | 0 | 0.0% |
| Graduate / Professional | 0 | 0.0% |
| Total | 17 | 100.0% |
School Enrollment by Age by Funding Source in Quechee
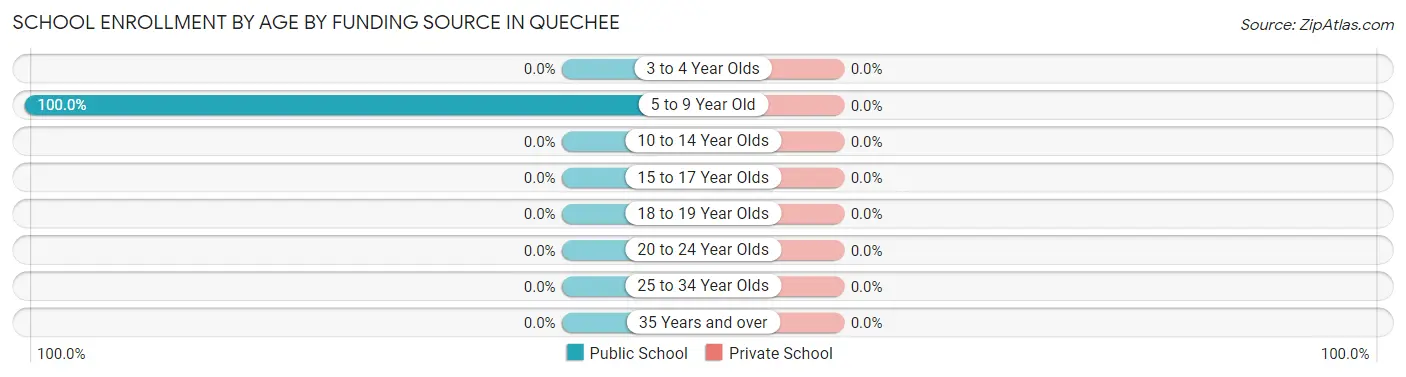
| Age Bracket | Public School | Private School |
| 3 to 4 Year Olds | 0 (0.0%) | 0 (0.0%) |
| 5 to 9 Year Old | 17 (100.0%) | 0 (0.0%) |
| 10 to 14 Year Olds | 0 (0.0%) | 0 (0.0%) |
| 15 to 17 Year Olds | 0 (0.0%) | 0 (0.0%) |
| 18 to 19 Year Olds | 0 (0.0%) | 0 (0.0%) |
| 20 to 24 Year Olds | 0 (0.0%) | 0 (0.0%) |
| 25 to 34 Year Olds | 0 (0.0%) | 0 (0.0%) |
| 35 Years and over | 0 (0.0%) | 0 (0.0%) |
| Total | 17 (100.0%) | 0 (0.0%) |
Educational Attainment by Field of Study in Quechee
Science & technology (95 | 38.9%), engineering (47 | 19.3%), communications (42 | 17.2%), business (30 | 12.3%), and psychology (15 | 6.1%) are the most common fields of study among 244 individuals in Quechee who have obtained a bachelor's degree or higher.
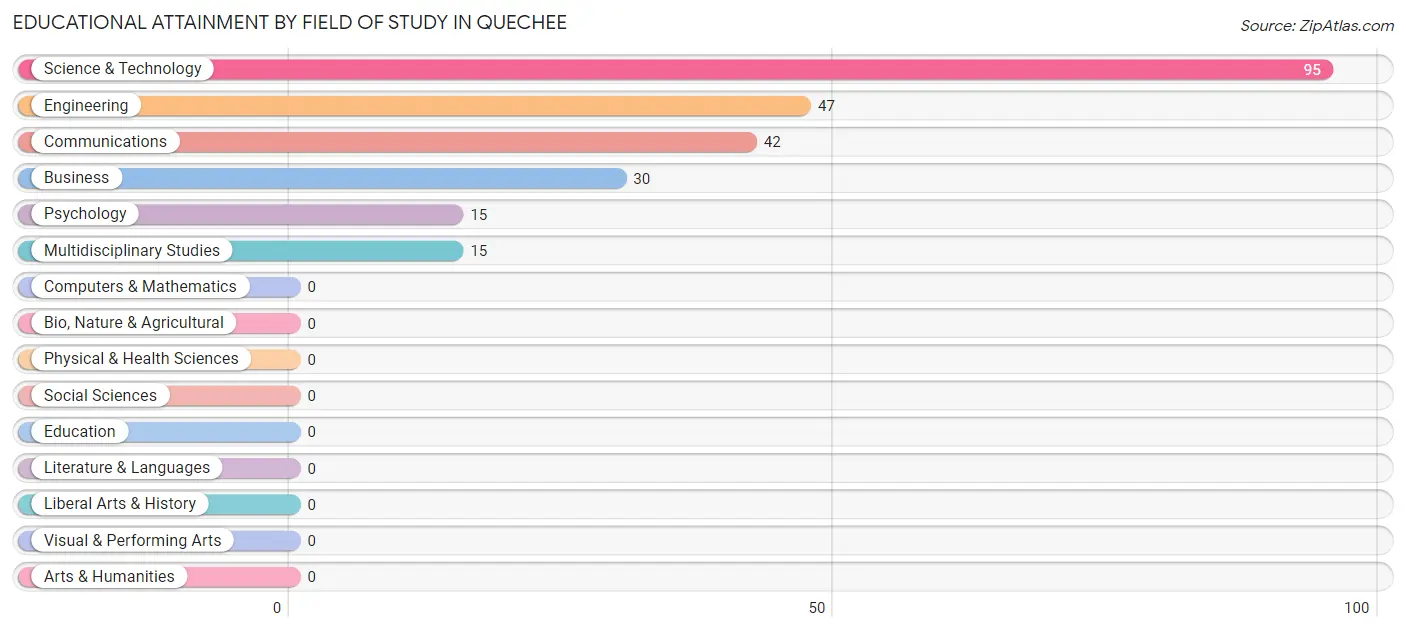
| Field of Study | # Graduates | % Graduates |
| Computers & Mathematics | 0 | 0.0% |
| Bio, Nature & Agricultural | 0 | 0.0% |
| Physical & Health Sciences | 0 | 0.0% |
| Psychology | 15 | 6.1% |
| Social Sciences | 0 | 0.0% |
| Engineering | 47 | 19.3% |
| Multidisciplinary Studies | 15 | 6.1% |
| Science & Technology | 95 | 38.9% |
| Business | 30 | 12.3% |
| Education | 0 | 0.0% |
| Literature & Languages | 0 | 0.0% |
| Liberal Arts & History | 0 | 0.0% |
| Visual & Performing Arts | 0 | 0.0% |
| Communications | 42 | 17.2% |
| Arts & Humanities | 0 | 0.0% |
| Total | 244 | 100.0% |
Transportation & Commute in Quechee
Vehicle Availability by Sex in Quechee
The most prevalent vehicle ownership categories in Quechee are males with 2 vehicles (35, accounting for 53.8%) and females with 2 vehicles (13, making up 63.6%).
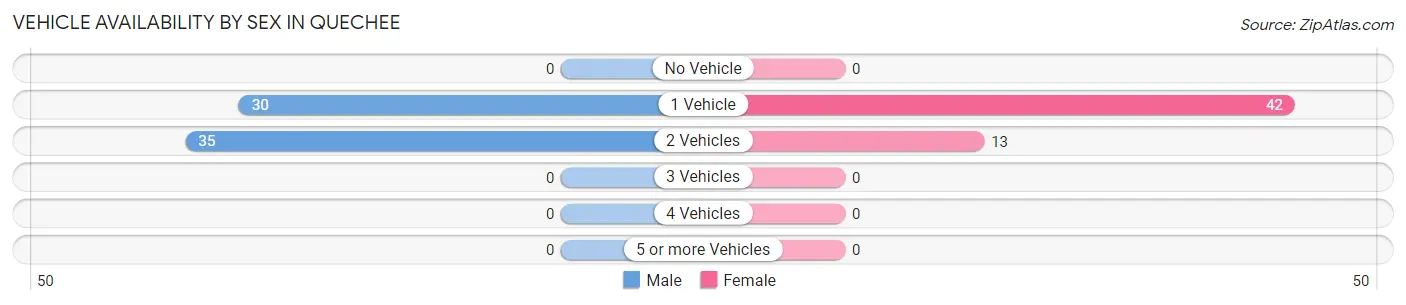
| Vehicles Available | Male | Female |
| No Vehicle | 0 (0.0%) | 0 (0.0%) |
| 1 Vehicle | 30 (46.2%) | 42 (76.4%) |
| 2 Vehicles | 35 (53.8%) | 13 (23.6%) |
| 3 Vehicles | 0 (0.0%) | 0 (0.0%) |
| 4 Vehicles | 0 (0.0%) | 0 (0.0%) |
| 5 or more Vehicles | 0 (0.0%) | 0 (0.0%) |
| Total | 65 (100.0%) | 55 (100.0%) |
Commute Time in Quechee
The most frequently occuring commute durations in Quechee are 20 to 24 minutes (62 commuters, 68.9%), 30 to 34 minutes (15 commuters, 16.7%), and 15 to 19 minutes (13 commuters, 14.4%).
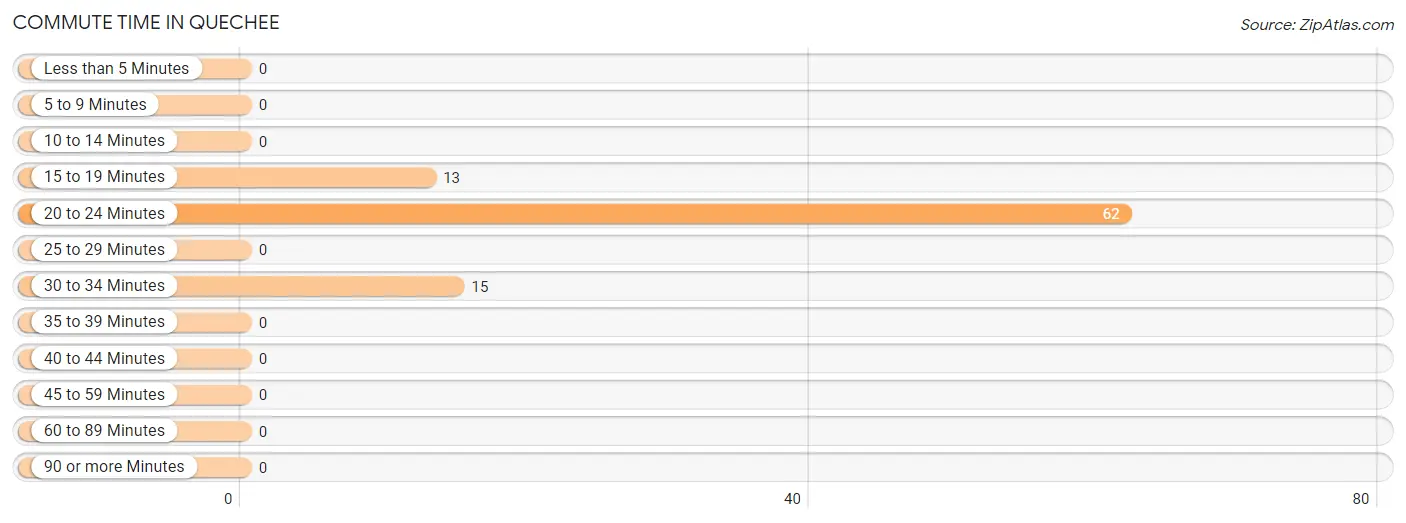
| Commute Time | # Commuters | % Commuters |
| Less than 5 Minutes | 0 | 0.0% |
| 5 to 9 Minutes | 0 | 0.0% |
| 10 to 14 Minutes | 0 | 0.0% |
| 15 to 19 Minutes | 13 | 14.4% |
| 20 to 24 Minutes | 62 | 68.9% |
| 25 to 29 Minutes | 0 | 0.0% |
| 30 to 34 Minutes | 15 | 16.7% |
| 35 to 39 Minutes | 0 | 0.0% |
| 40 to 44 Minutes | 0 | 0.0% |
| 45 to 59 Minutes | 0 | 0.0% |
| 60 to 89 Minutes | 0 | 0.0% |
| 90 or more Minutes | 0 | 0.0% |
Commute Time by Sex in Quechee
The most common commute times in Quechee are 20 to 24 minutes (20 commuters, 57.1%) for males and 20 to 24 minutes (42 commuters, 76.4%) for females.
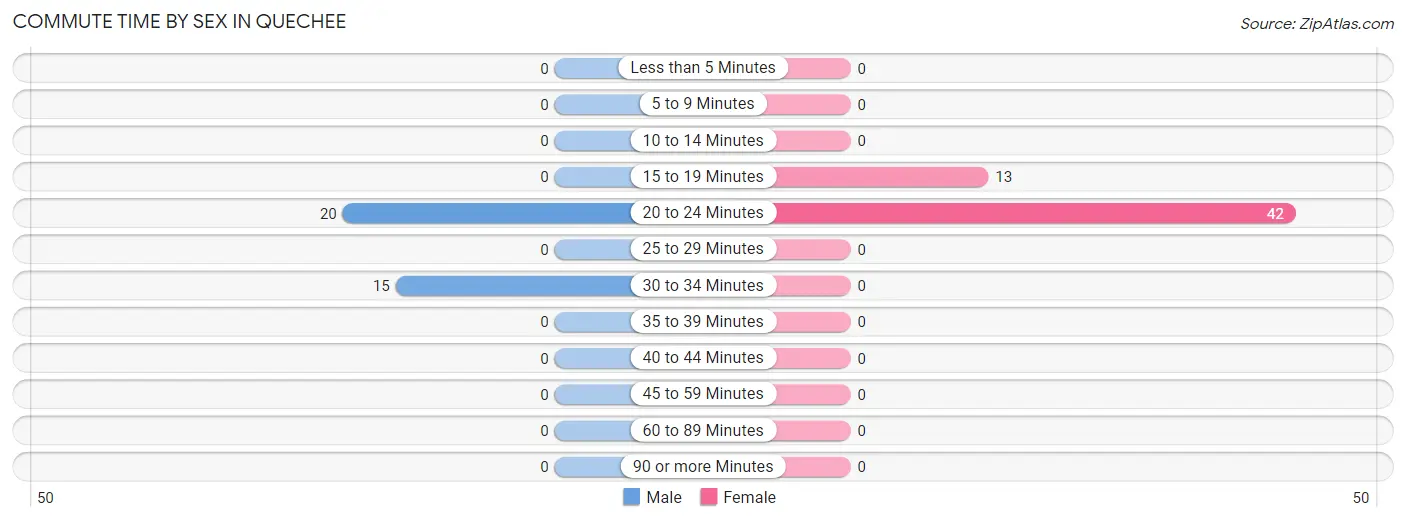
| Commute Time | Male | Female |
| Less than 5 Minutes | 0 (0.0%) | 0 (0.0%) |
| 5 to 9 Minutes | 0 (0.0%) | 0 (0.0%) |
| 10 to 14 Minutes | 0 (0.0%) | 0 (0.0%) |
| 15 to 19 Minutes | 0 (0.0%) | 13 (23.6%) |
| 20 to 24 Minutes | 20 (57.1%) | 42 (76.4%) |
| 25 to 29 Minutes | 0 (0.0%) | 0 (0.0%) |
| 30 to 34 Minutes | 15 (42.9%) | 0 (0.0%) |
| 35 to 39 Minutes | 0 (0.0%) | 0 (0.0%) |
| 40 to 44 Minutes | 0 (0.0%) | 0 (0.0%) |
| 45 to 59 Minutes | 0 (0.0%) | 0 (0.0%) |
| 60 to 89 Minutes | 0 (0.0%) | 0 (0.0%) |
| 90 or more Minutes | 0 (0.0%) | 0 (0.0%) |
Time of Departure to Work by Sex in Quechee
The most frequent times of departure to work in Quechee are 9:00 AM to 9:59 AM (20, 57.1%) for males and 12:00 PM to 3:59 PM (42, 76.4%) for females.
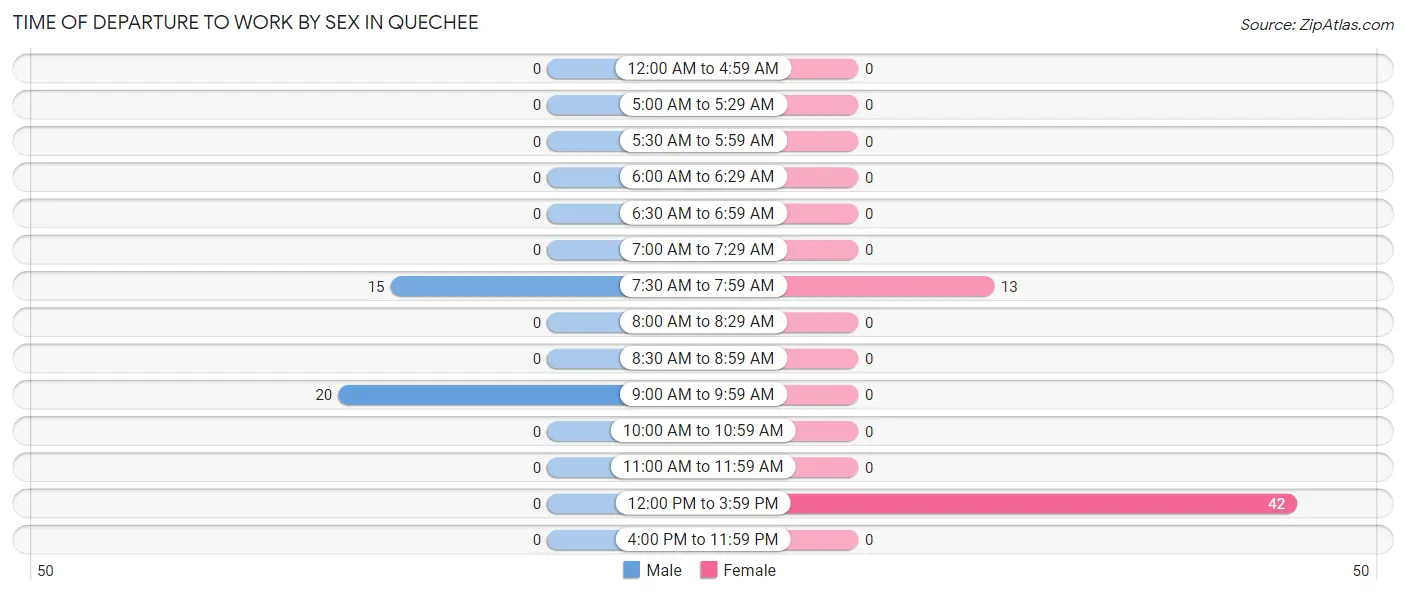
| Time of Departure | Male | Female |
| 12:00 AM to 4:59 AM | 0 (0.0%) | 0 (0.0%) |
| 5:00 AM to 5:29 AM | 0 (0.0%) | 0 (0.0%) |
| 5:30 AM to 5:59 AM | 0 (0.0%) | 0 (0.0%) |
| 6:00 AM to 6:29 AM | 0 (0.0%) | 0 (0.0%) |
| 6:30 AM to 6:59 AM | 0 (0.0%) | 0 (0.0%) |
| 7:00 AM to 7:29 AM | 0 (0.0%) | 0 (0.0%) |
| 7:30 AM to 7:59 AM | 15 (42.9%) | 13 (23.6%) |
| 8:00 AM to 8:29 AM | 0 (0.0%) | 0 (0.0%) |
| 8:30 AM to 8:59 AM | 0 (0.0%) | 0 (0.0%) |
| 9:00 AM to 9:59 AM | 20 (57.1%) | 0 (0.0%) |
| 10:00 AM to 10:59 AM | 0 (0.0%) | 0 (0.0%) |
| 11:00 AM to 11:59 AM | 0 (0.0%) | 0 (0.0%) |
| 12:00 PM to 3:59 PM | 0 (0.0%) | 42 (76.4%) |
| 4:00 PM to 11:59 PM | 0 (0.0%) | 0 (0.0%) |
| Total | 35 (100.0%) | 55 (100.0%) |
Housing Occupancy in Quechee
Occupancy by Ownership in Quechee
Of the total 221 dwellings in Quechee, owner-occupied units account for 195 (88.2%), while renter-occupied units make up 26 (11.8%).
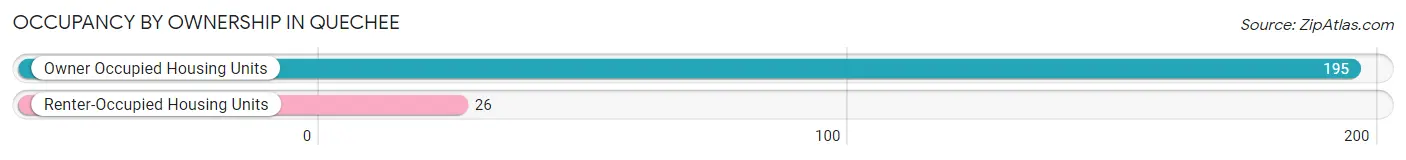
| Occupancy | # Housing Units | % Housing Units |
| Owner Occupied Housing Units | 195 | 88.2% |
| Renter-Occupied Housing Units | 26 | 11.8% |
| Total Occupied Housing Units | 221 | 100.0% |
Occupancy by Household Size in Quechee
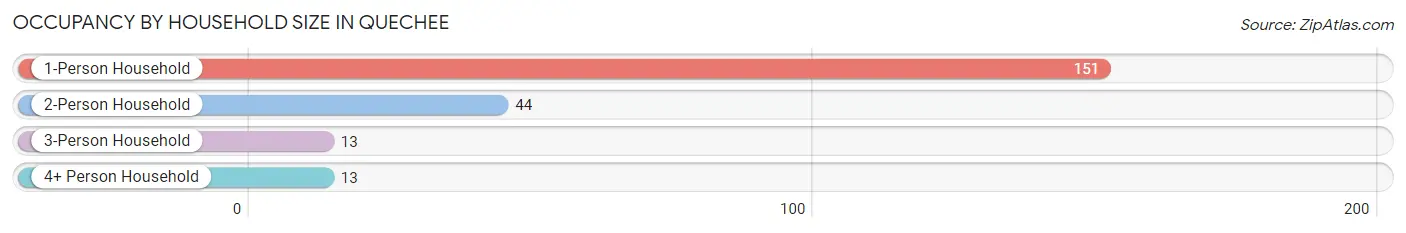
| Household Size | # Housing Units | % Housing Units |
| 1-Person Household | 151 | 68.3% |
| 2-Person Household | 44 | 19.9% |
| 3-Person Household | 13 | 5.9% |
| 4+ Person Household | 13 | 5.9% |
| Total Housing Units | 221 | 100.0% |
Occupancy by Ownership by Household Size in Quechee
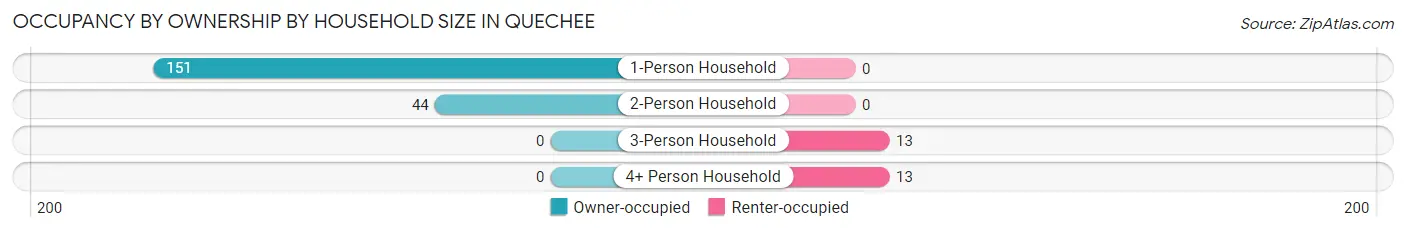
| Household Size | Owner-occupied | Renter-occupied |
| 1-Person Household | 151 (100.0%) | 0 (0.0%) |
| 2-Person Household | 44 (100.0%) | 0 (0.0%) |
| 3-Person Household | 0 (0.0%) | 13 (100.0%) |
| 4+ Person Household | 0 (0.0%) | 13 (100.0%) |
| Total Housing Units | 195 (88.2%) | 26 (11.8%) |
Occupancy by Educational Attainment in Quechee
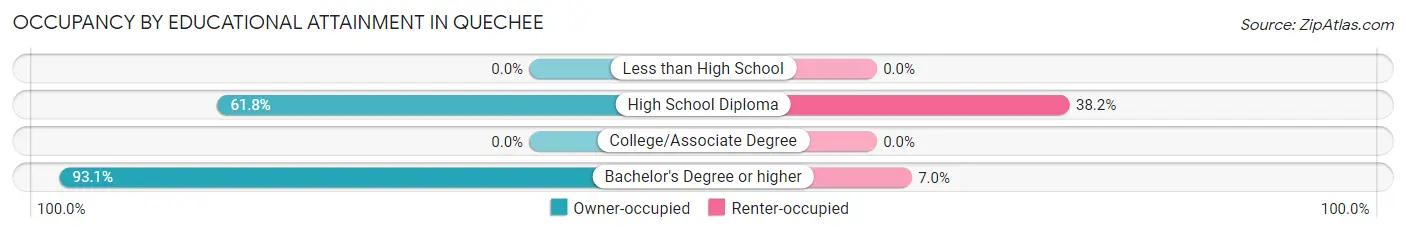
| Household Size | Owner-occupied | Renter-occupied |
| Less than High School | 0 (0.0%) | 0 (0.0%) |
| High School Diploma | 21 (61.8%) | 13 (38.2%) |
| College/Associate Degree | 0 (0.0%) | 0 (0.0%) |
| Bachelor's Degree or higher | 174 (93.0%) | 13 (7.0%) |
Occupancy by Age of Householder in Quechee
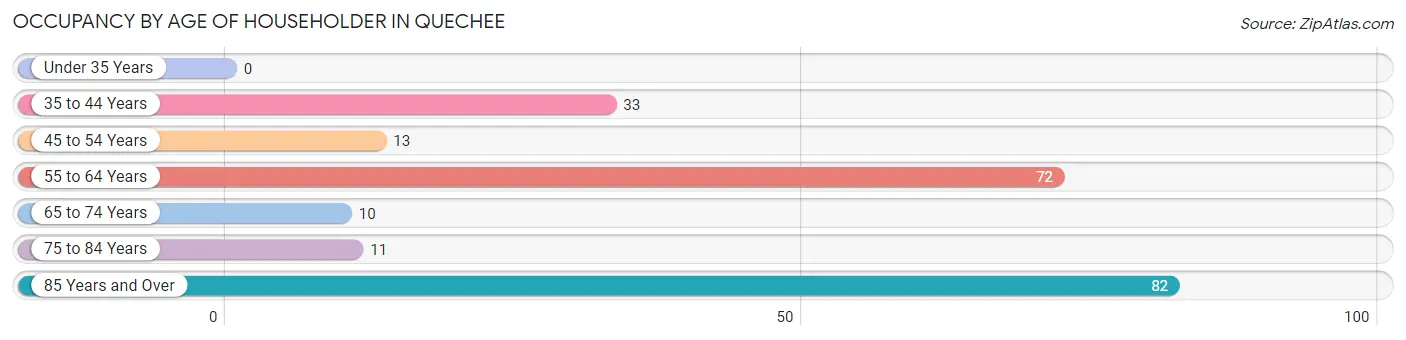
| Age Bracket | # Households | % Households |
| Under 35 Years | 0 | 0.0% |
| 35 to 44 Years | 33 | 14.9% |
| 45 to 54 Years | 13 | 5.9% |
| 55 to 64 Years | 72 | 32.6% |
| 65 to 74 Years | 10 | 4.5% |
| 75 to 84 Years | 11 | 5.0% |
| 85 Years and Over | 82 | 37.1% |
| Total | 221 | 100.0% |
Housing Finances in Quechee
Median Income by Occupancy in Quechee
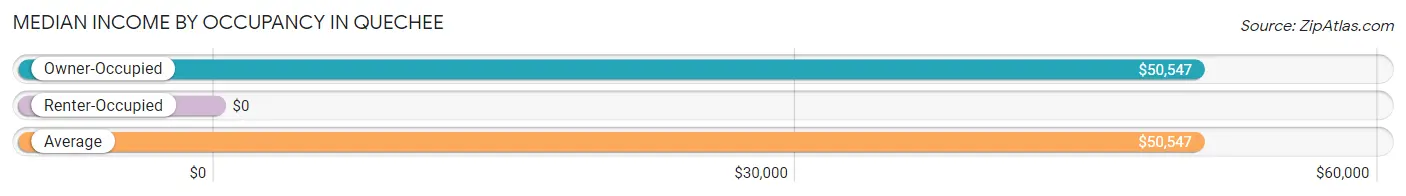
| Occupancy Type | # Households | Median Income |
| Owner-Occupied | 195 (88.2%) | $50,547 |
| Renter-Occupied | 26 (11.8%) | $0 |
| Average | 221 (100.0%) | $50,547 |
Occupancy by Householder Income Bracket in Quechee
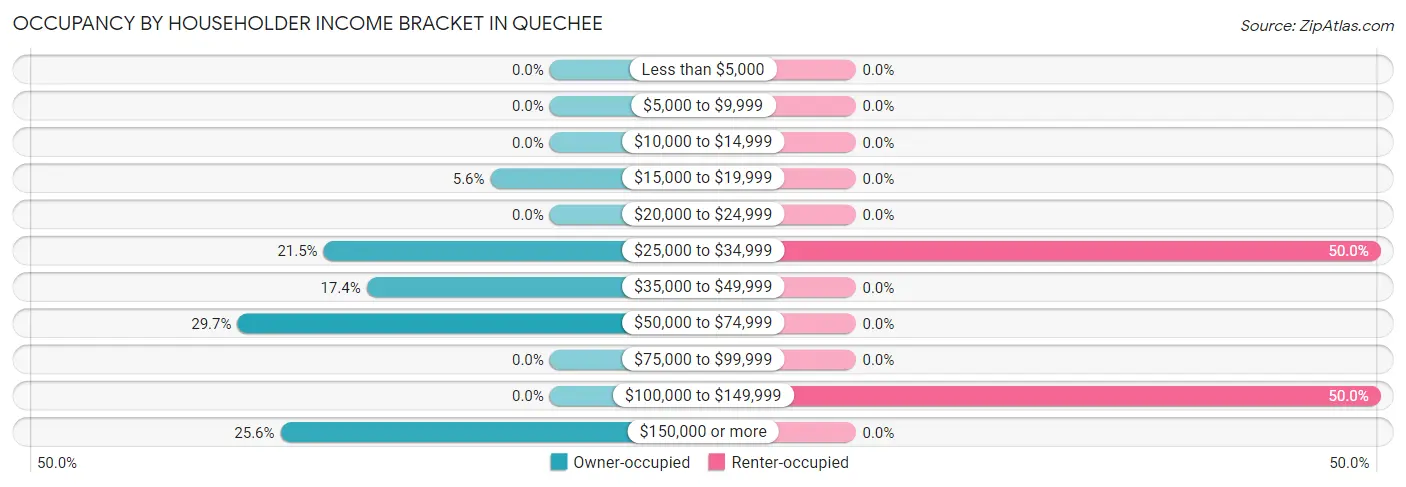
| Income Bracket | Owner-occupied | Renter-occupied |
| Less than $5,000 | 0 (0.0%) | 0 (0.0%) |
| $5,000 to $9,999 | 0 (0.0%) | 0 (0.0%) |
| $10,000 to $14,999 | 0 (0.0%) | 0 (0.0%) |
| $15,000 to $19,999 | 11 (5.6%) | 0 (0.0%) |
| $20,000 to $24,999 | 0 (0.0%) | 0 (0.0%) |
| $25,000 to $34,999 | 42 (21.5%) | 13 (50.0%) |
| $35,000 to $49,999 | 34 (17.4%) | 0 (0.0%) |
| $50,000 to $74,999 | 58 (29.7%) | 0 (0.0%) |
| $75,000 to $99,999 | 0 (0.0%) | 0 (0.0%) |
| $100,000 to $149,999 | 0 (0.0%) | 13 (50.0%) |
| $150,000 or more | 50 (25.6%) | 0 (0.0%) |
| Total | 195 (100.0%) | 26 (100.0%) |
Monthly Housing Cost Tiers in Quechee
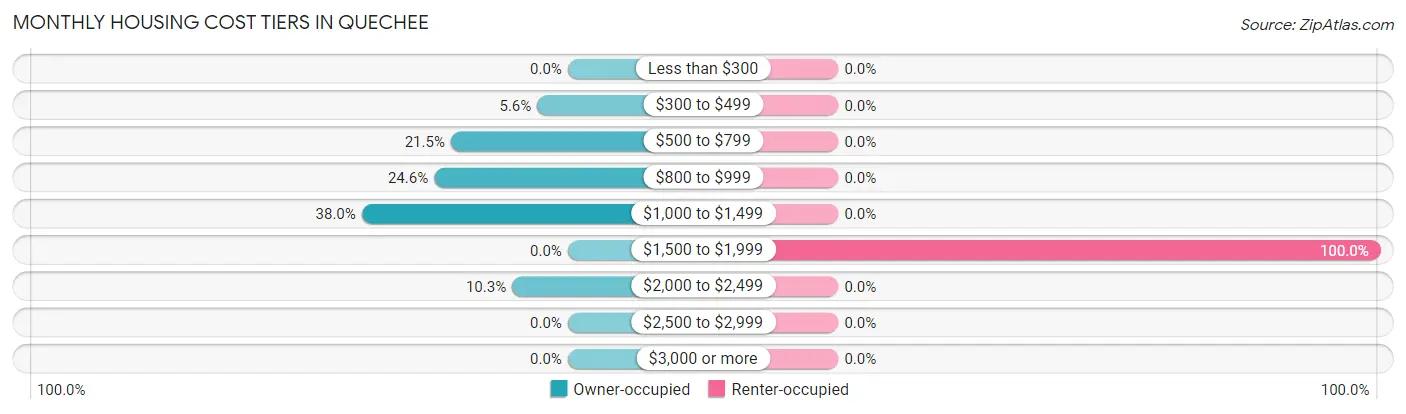
| Monthly Cost | Owner-occupied | Renter-occupied |
| Less than $300 | 0 (0.0%) | 0 (0.0%) |
| $300 to $499 | 11 (5.6%) | 0 (0.0%) |
| $500 to $799 | 42 (21.5%) | 0 (0.0%) |
| $800 to $999 | 48 (24.6%) | 0 (0.0%) |
| $1,000 to $1,499 | 74 (38.0%) | 0 (0.0%) |
| $1,500 to $1,999 | 0 (0.0%) | 26 (100.0%) |
| $2,000 to $2,499 | 20 (10.3%) | 0 (0.0%) |
| $2,500 to $2,999 | 0 (0.0%) | 0 (0.0%) |
| $3,000 or more | 0 (0.0%) | 0 (0.0%) |
| Total | 195 (100.0%) | 26 (100.0%) |
Physical Housing Characteristics in Quechee
Housing Structures in Quechee
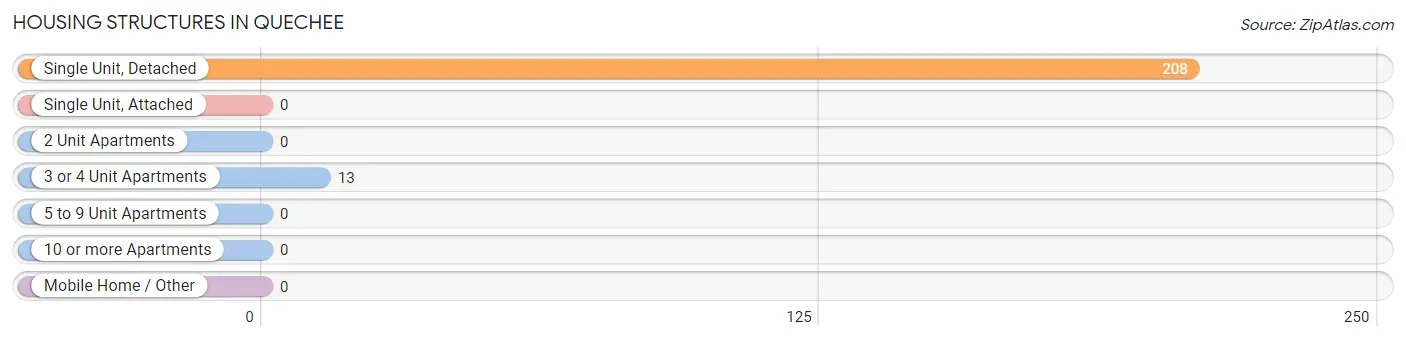
| Structure Type | # Housing Units | % Housing Units |
| Single Unit, Detached | 208 | 94.1% |
| Single Unit, Attached | 0 | 0.0% |
| 2 Unit Apartments | 0 | 0.0% |
| 3 or 4 Unit Apartments | 13 | 5.9% |
| 5 to 9 Unit Apartments | 0 | 0.0% |
| 10 or more Apartments | 0 | 0.0% |
| Mobile Home / Other | 0 | 0.0% |
| Total | 221 | 100.0% |
Housing Structures by Occupancy in Quechee
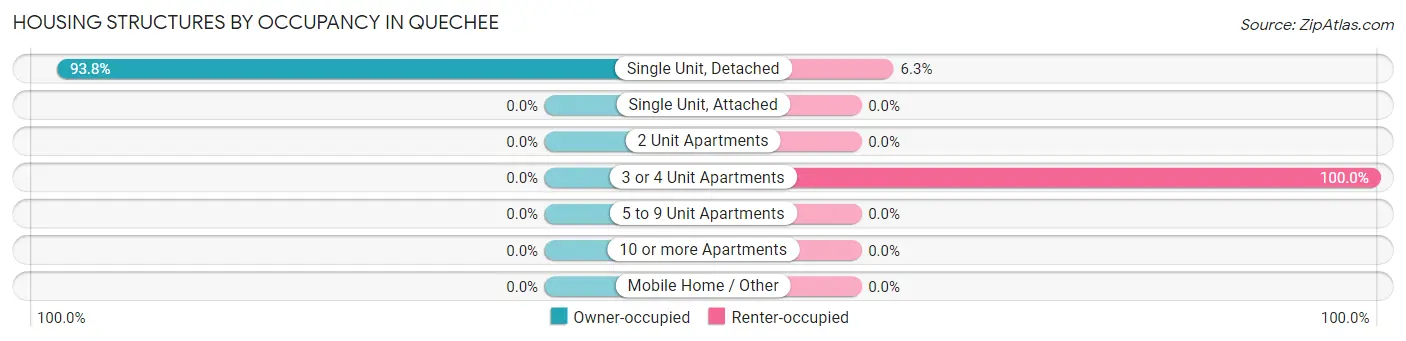
| Structure Type | Owner-occupied | Renter-occupied |
| Single Unit, Detached | 195 (93.8%) | 13 (6.2%) |
| Single Unit, Attached | 0 (0.0%) | 0 (0.0%) |
| 2 Unit Apartments | 0 (0.0%) | 0 (0.0%) |
| 3 or 4 Unit Apartments | 0 (0.0%) | 13 (100.0%) |
| 5 to 9 Unit Apartments | 0 (0.0%) | 0 (0.0%) |
| 10 or more Apartments | 0 (0.0%) | 0 (0.0%) |
| Mobile Home / Other | 0 (0.0%) | 0 (0.0%) |
| Total | 195 (88.2%) | 26 (11.8%) |
Housing Structures by Number of Rooms in Quechee
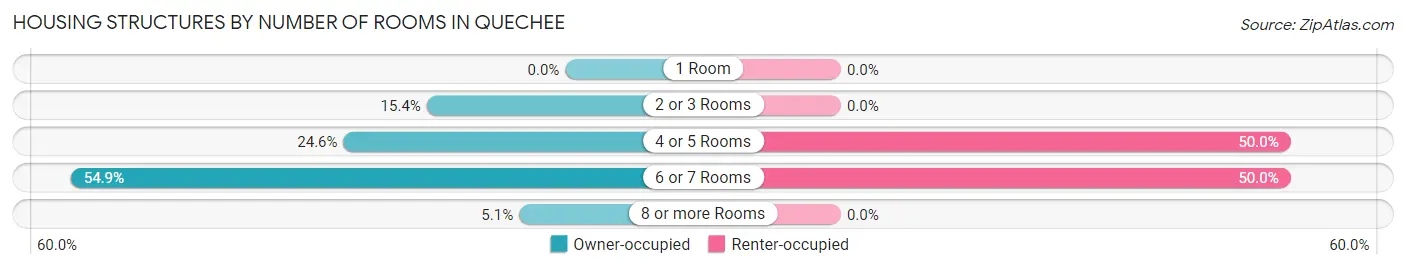
| Number of Rooms | Owner-occupied | Renter-occupied |
| 1 Room | 0 (0.0%) | 0 (0.0%) |
| 2 or 3 Rooms | 30 (15.4%) | 0 (0.0%) |
| 4 or 5 Rooms | 48 (24.6%) | 13 (50.0%) |
| 6 or 7 Rooms | 107 (54.9%) | 13 (50.0%) |
| 8 or more Rooms | 10 (5.1%) | 0 (0.0%) |
| Total | 195 (100.0%) | 26 (100.0%) |
Housing Structure by Heating Type in Quechee
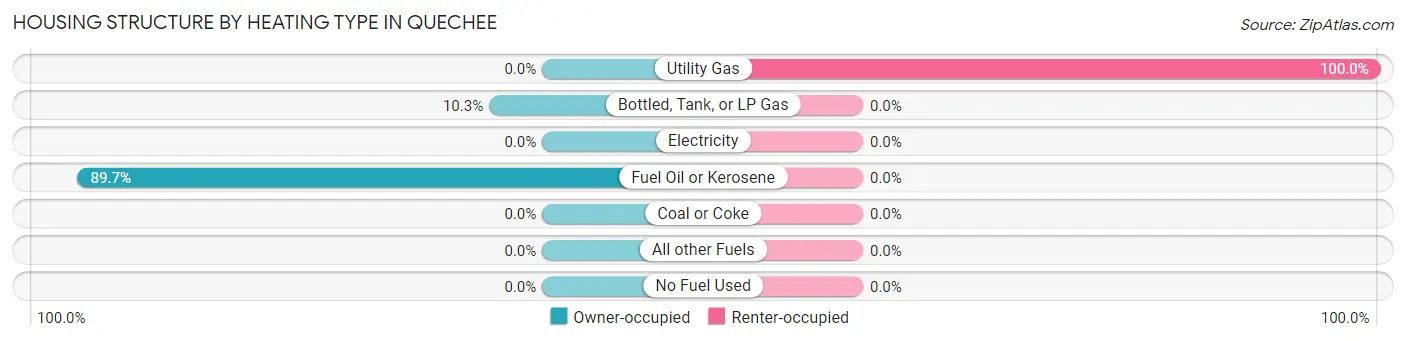
| Heating Type | Owner-occupied | Renter-occupied |
| Utility Gas | 0 (0.0%) | 26 (100.0%) |
| Bottled, Tank, or LP Gas | 20 (10.3%) | 0 (0.0%) |
| Electricity | 0 (0.0%) | 0 (0.0%) |
| Fuel Oil or Kerosene | 175 (89.7%) | 0 (0.0%) |
| Coal or Coke | 0 (0.0%) | 0 (0.0%) |
| All other Fuels | 0 (0.0%) | 0 (0.0%) |
| No Fuel Used | 0 (0.0%) | 0 (0.0%) |
| Total | 195 (100.0%) | 26 (100.0%) |
Household Vehicle Usage in Quechee
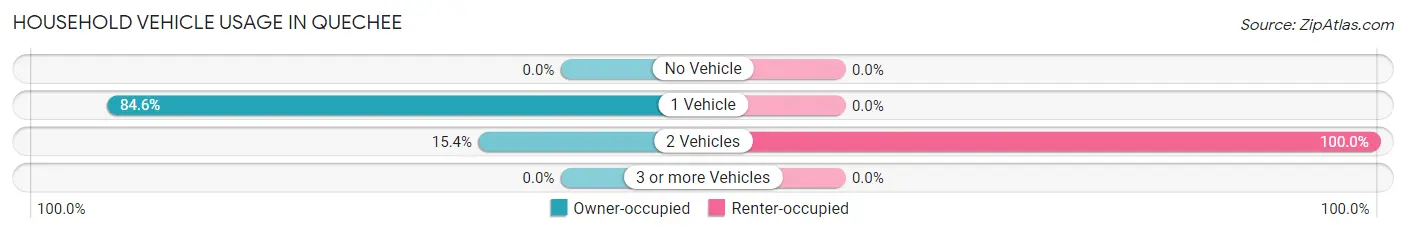
| Vehicles per Household | Owner-occupied | Renter-occupied |
| No Vehicle | 0 (0.0%) | 0 (0.0%) |
| 1 Vehicle | 165 (84.6%) | 0 (0.0%) |
| 2 Vehicles | 30 (15.4%) | 26 (100.0%) |
| 3 or more Vehicles | 0 (0.0%) | 0 (0.0%) |
| Total | 195 (100.0%) | 26 (100.0%) |
Real Estate & Mortgages in Quechee
Real Estate and Mortgage Overview in Quechee
| Characteristic | Without Mortgage | With Mortgage |
| Housing Units | 135 | 60 |
| Median Property Value | $283,400 | $340,000 |
| Median Household Income | $38,566 | $50 |
| Monthly Housing Costs | $930 | $0 |
| Real Estate Taxes | $4,536 | $0 |
Property Value by Mortgage Status in Quechee
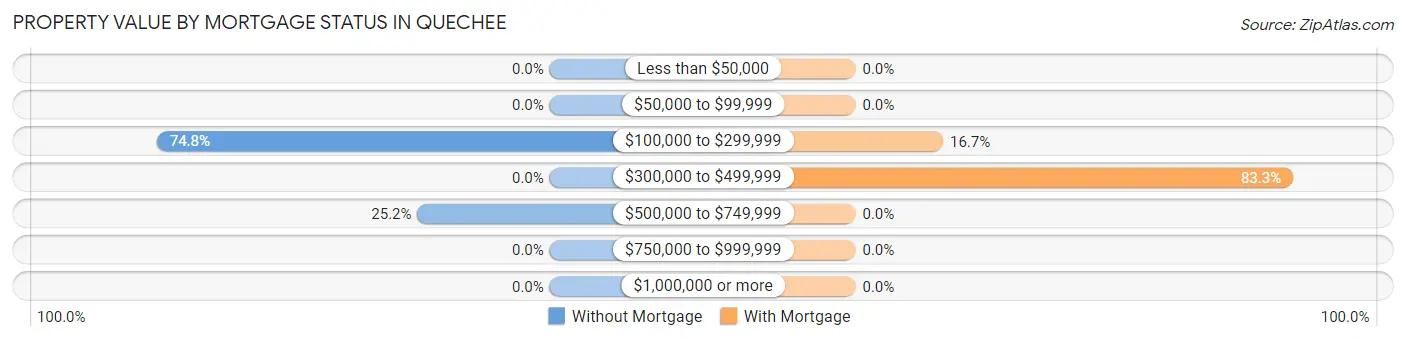
| Property Value | Without Mortgage | With Mortgage |
| Less than $50,000 | 0 (0.0%) | 0 (0.0%) |
| $50,000 to $99,999 | 0 (0.0%) | 0 (0.0%) |
| $100,000 to $299,999 | 101 (74.8%) | 10 (16.7%) |
| $300,000 to $499,999 | 0 (0.0%) | 50 (83.3%) |
| $500,000 to $749,999 | 34 (25.2%) | 0 (0.0%) |
| $750,000 to $999,999 | 0 (0.0%) | 0 (0.0%) |
| $1,000,000 or more | 0 (0.0%) | 0 (0.0%) |
| Total | 135 (100.0%) | 60 (100.0%) |
Household Income by Mortgage Status in Quechee
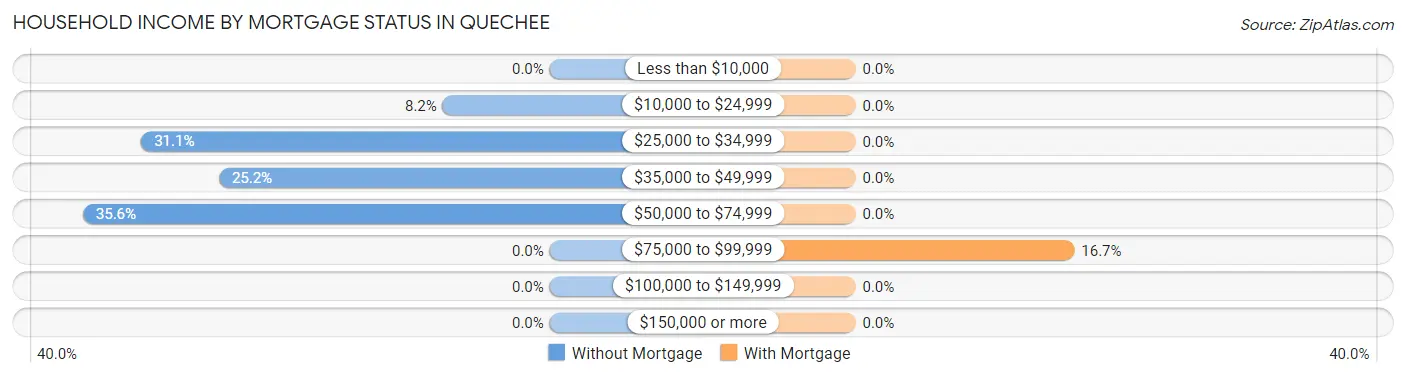
| Household Income | Without Mortgage | With Mortgage |
| Less than $10,000 | 0 (0.0%) | 0 (0.0%) |
| $10,000 to $24,999 | 11 (8.2%) | 0 (0.0%) |
| $25,000 to $34,999 | 42 (31.1%) | 0 (0.0%) |
| $35,000 to $49,999 | 34 (25.2%) | 0 (0.0%) |
| $50,000 to $74,999 | 48 (35.6%) | 0 (0.0%) |
| $75,000 to $99,999 | 0 (0.0%) | 10 (16.7%) |
| $100,000 to $149,999 | 0 (0.0%) | 0 (0.0%) |
| $150,000 or more | 0 (0.0%) | 0 (0.0%) |
| Total | 135 (100.0%) | 60 (100.0%) |
Property Value to Household Income Ratio in Quechee
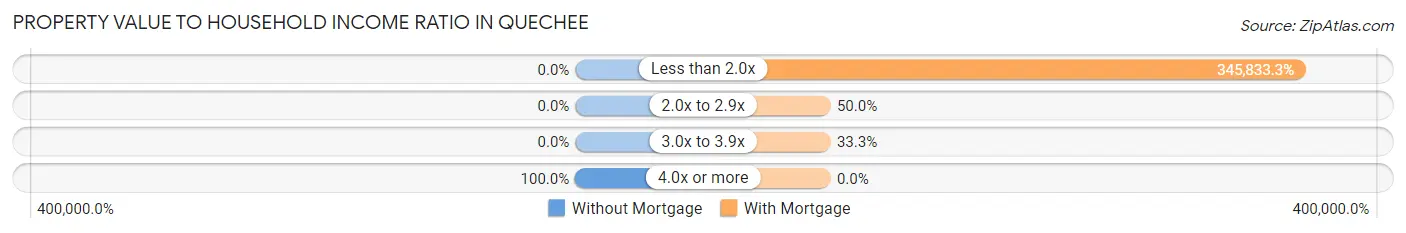
| Value-to-Income Ratio | Without Mortgage | With Mortgage |
| Less than 2.0x | 0 (0.0%) | 207,500 (345,833.3%) |
| 2.0x to 2.9x | 0 (0.0%) | 30 (50.0%) |
| 3.0x to 3.9x | 0 (0.0%) | 20 (33.3%) |
| 4.0x or more | 135 (100.0%) | 0 (0.0%) |
| Total | 135 (100.0%) | 60 (100.0%) |
Real Estate Taxes by Mortgage Status in Quechee
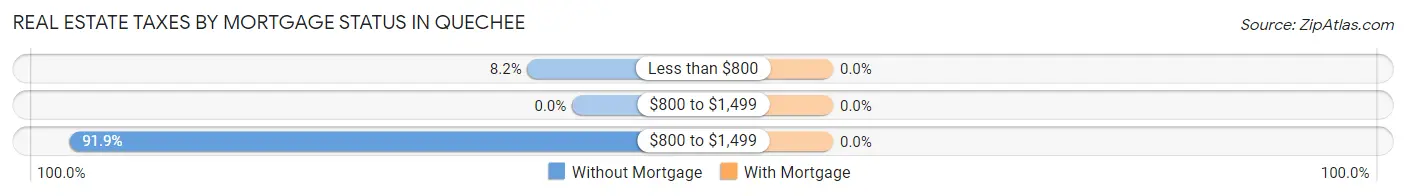
| Property Taxes | Without Mortgage | With Mortgage |
| Less than $800 | 11 (8.2%) | 0 (0.0%) |
| $800 to $1,499 | 0 (0.0%) | 0 (0.0%) |
| $800 to $1,499 | 124 (91.8%) | 0 (0.0%) |
| Total | 135 (100.0%) | 60 (100.0%) |
Health & Disability in Quechee
Health Insurance Coverage by Age in Quechee
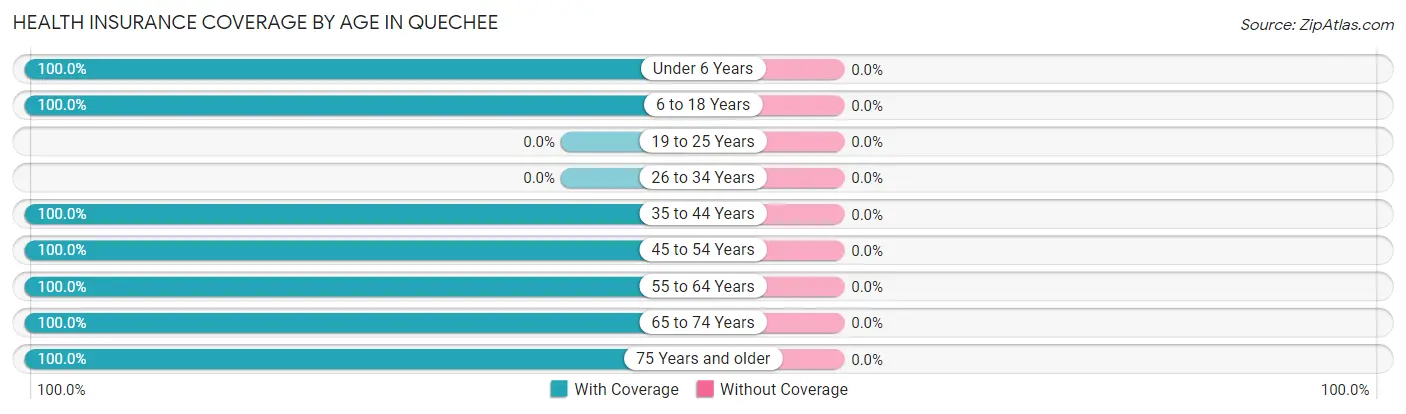
| Age Bracket | With Coverage | Without Coverage |
| Under 6 Years | 18 (100.0%) | 0 (0.0%) |
| 6 to 18 Years | 17 (100.0%) | 0 (0.0%) |
| 19 to 25 Years | 0 (0.0%) | 0 (0.0%) |
| 26 to 34 Years | 0 (0.0%) | 0 (0.0%) |
| 35 to 44 Years | 64 (100.0%) | 0 (0.0%) |
| 45 to 54 Years | 13 (100.0%) | 0 (0.0%) |
| 55 to 64 Years | 72 (100.0%) | 0 (0.0%) |
| 65 to 74 Years | 36 (100.0%) | 0 (0.0%) |
| 75 Years and older | 120 (100.0%) | 0 (0.0%) |
| Total | 340 (100.0%) | 0 (0.0%) |
Health Insurance Coverage by Citizenship Status in Quechee
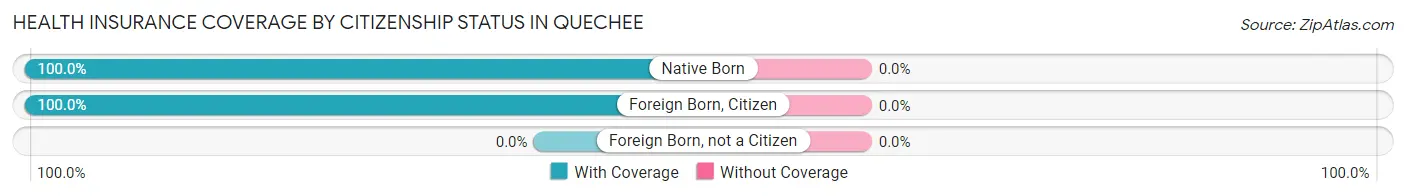
| Citizenship Status | With Coverage | Without Coverage |
| Native Born | 18 (100.0%) | 0 (0.0%) |
| Foreign Born, Citizen | 17 (100.0%) | 0 (0.0%) |
| Foreign Born, not a Citizen | 0 (0.0%) | 0 (0.0%) |
Health Insurance Coverage by Household Income in Quechee
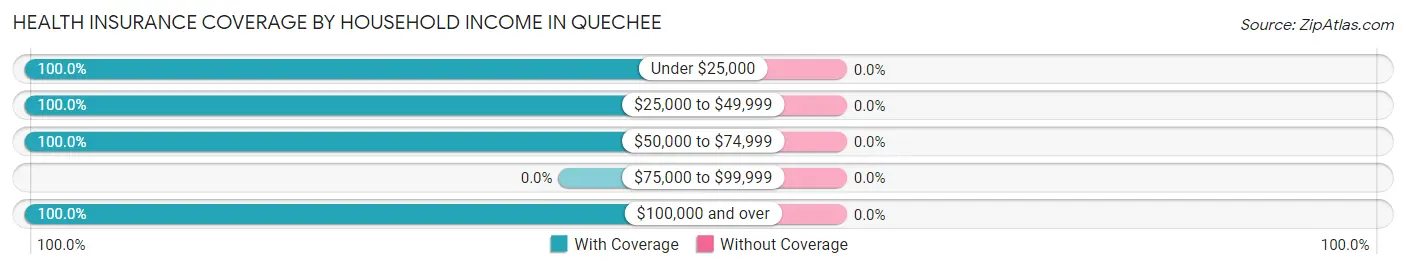
| Household Income | With Coverage | Without Coverage |
| Under $25,000 | 11 (100.0%) | 0 (0.0%) |
| $25,000 to $49,999 | 166 (100.0%) | 0 (0.0%) |
| $50,000 to $74,999 | 68 (100.0%) | 0 (0.0%) |
| $75,000 to $99,999 | 0 (0.0%) | 0 (0.0%) |
| $100,000 and over | 95 (100.0%) | 0 (0.0%) |
Public vs Private Health Insurance Coverage by Age in Quechee
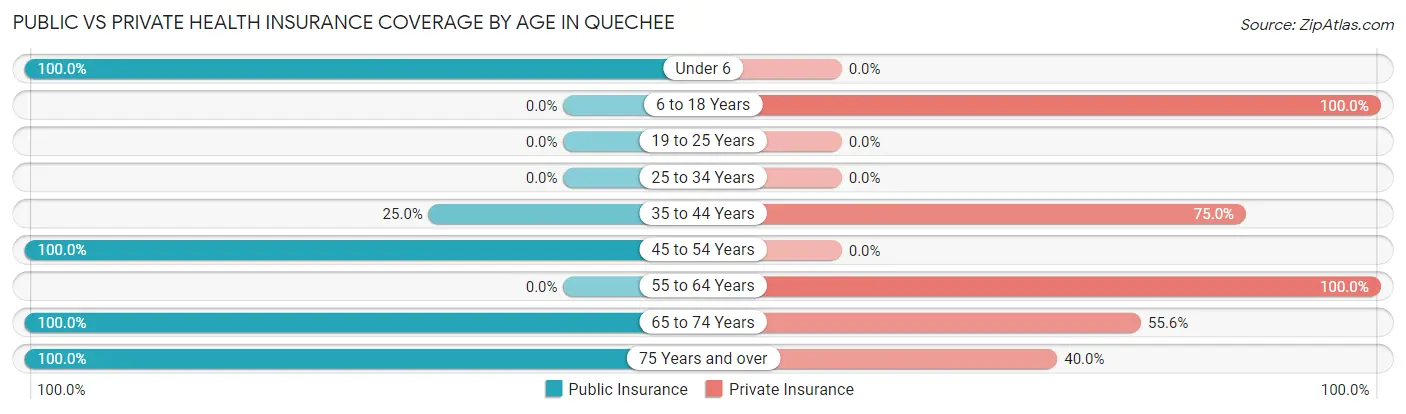
| Age Bracket | Public Insurance | Private Insurance |
| Under 6 | 18 (100.0%) | 0 (0.0%) |
| 6 to 18 Years | 0 (0.0%) | 17 (100.0%) |
| 19 to 25 Years | 0 (0.0%) | 0 (0.0%) |
| 25 to 34 Years | 0 (0.0%) | 0 (0.0%) |
| 35 to 44 Years | 16 (25.0%) | 48 (75.0%) |
| 45 to 54 Years | 13 (100.0%) | 0 (0.0%) |
| 55 to 64 Years | 0 (0.0%) | 72 (100.0%) |
| 65 to 74 Years | 36 (100.0%) | 20 (55.6%) |
| 75 Years and over | 120 (100.0%) | 48 (40.0%) |
| Total | 203 (59.7%) | 205 (60.3%) |
Disability Status by Sex by Age in Quechee
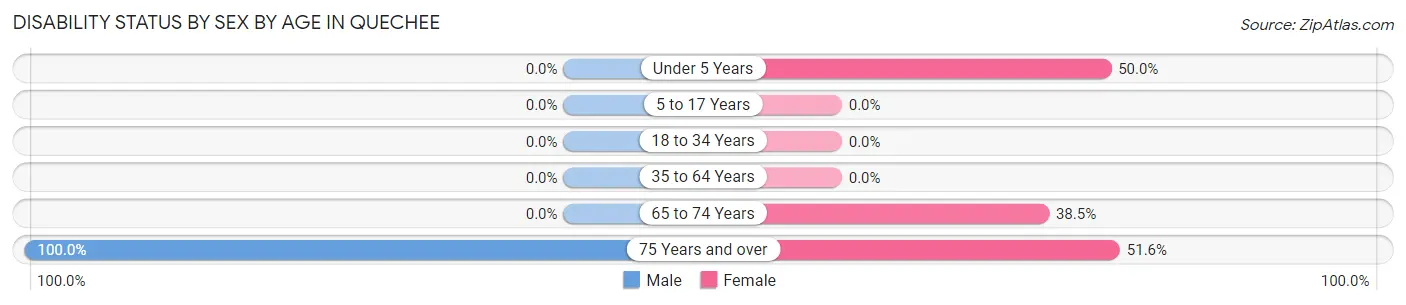
| Age Bracket | Male | Female |
| Under 5 Years | 0 (0.0%) | 9 (50.0%) |
| 5 to 17 Years | 0 (0.0%) | 0 (0.0%) |
| 18 to 34 Years | 0 (0.0%) | 0 (0.0%) |
| 35 to 64 Years | 0 (0.0%) | 0 (0.0%) |
| 65 to 74 Years | 0 (0.0%) | 10 (38.5%) |
| 75 Years and over | 27 (100.0%) | 48 (51.6%) |
Disability Class by Sex by Age in Quechee
Disability Class: Hearing Difficulty
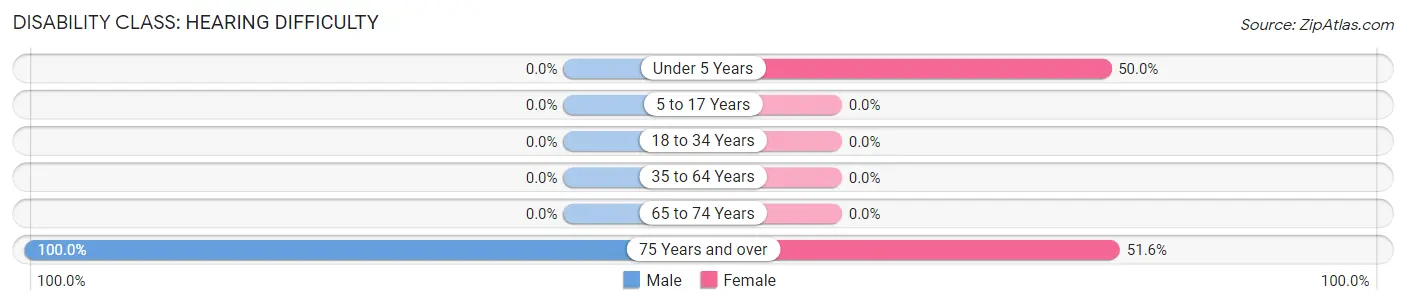
| Age Bracket | Male | Female |
| Under 5 Years | 0 (0.0%) | 9 (50.0%) |
| 5 to 17 Years | 0 (0.0%) | 0 (0.0%) |
| 18 to 34 Years | 0 (0.0%) | 0 (0.0%) |
| 35 to 64 Years | 0 (0.0%) | 0 (0.0%) |
| 65 to 74 Years | 0 (0.0%) | 0 (0.0%) |
| 75 Years and over | 27 (100.0%) | 48 (51.6%) |
Disability Class: Vision Difficulty
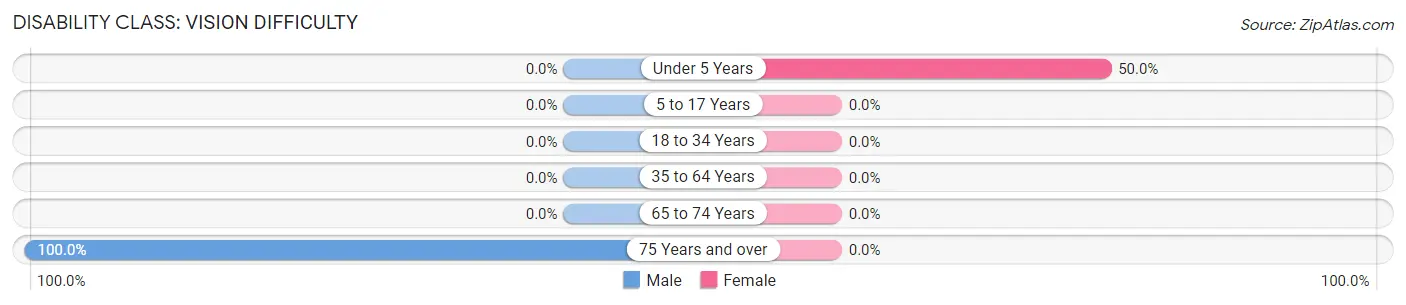
| Age Bracket | Male | Female |
| Under 5 Years | 0 (0.0%) | 9 (50.0%) |
| 5 to 17 Years | 0 (0.0%) | 0 (0.0%) |
| 18 to 34 Years | 0 (0.0%) | 0 (0.0%) |
| 35 to 64 Years | 0 (0.0%) | 0 (0.0%) |
| 65 to 74 Years | 0 (0.0%) | 0 (0.0%) |
| 75 Years and over | 27 (100.0%) | 0 (0.0%) |
Disability Class: Cognitive Difficulty
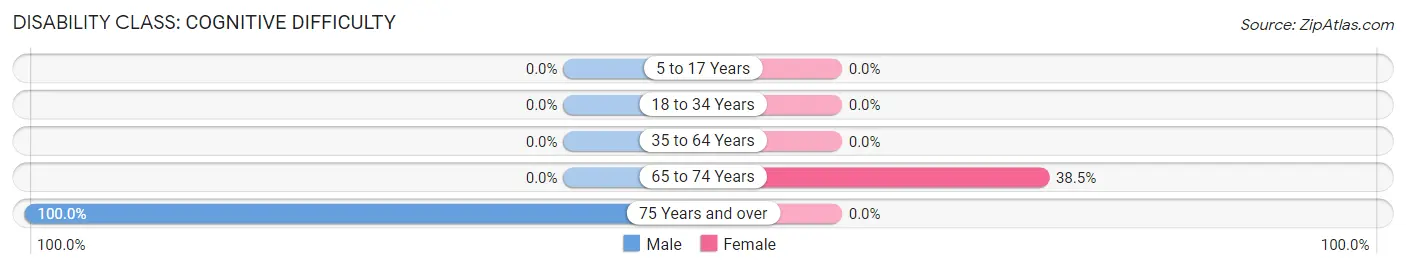
| Age Bracket | Male | Female |
| 5 to 17 Years | 0 (0.0%) | 0 (0.0%) |
| 18 to 34 Years | 0 (0.0%) | 0 (0.0%) |
| 35 to 64 Years | 0 (0.0%) | 0 (0.0%) |
| 65 to 74 Years | 0 (0.0%) | 10 (38.5%) |
| 75 Years and over | 27 (100.0%) | 0 (0.0%) |
Disability Class: Ambulatory Difficulty
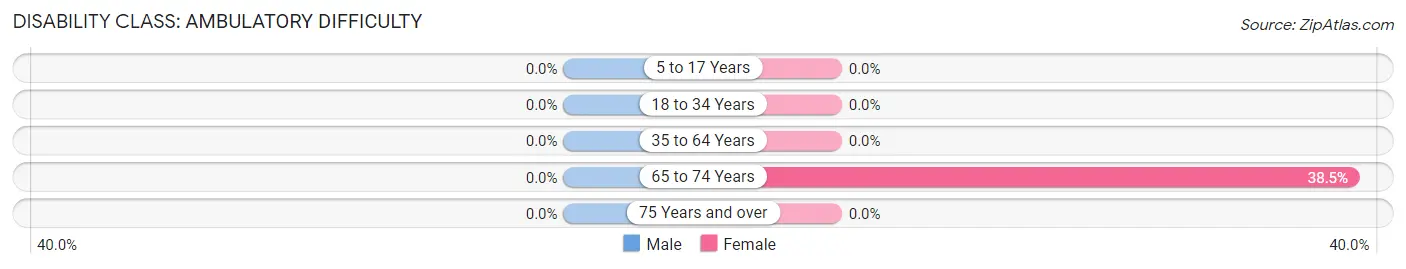
| Age Bracket | Male | Female |
| 5 to 17 Years | 0 (0.0%) | 0 (0.0%) |
| 18 to 34 Years | 0 (0.0%) | 0 (0.0%) |
| 35 to 64 Years | 0 (0.0%) | 0 (0.0%) |
| 65 to 74 Years | 0 (0.0%) | 10 (38.5%) |
| 75 Years and over | 0 (0.0%) | 0 (0.0%) |
Disability Class: Self-Care Difficulty
| Age Bracket | Male | Female |
| 5 to 17 Years | 0 (0.0%) | 0 (0.0%) |
| 18 to 34 Years | 0 (0.0%) | 0 (0.0%) |
| 35 to 64 Years | 0 (0.0%) | 0 (0.0%) |
| 65 to 74 Years | 0 (0.0%) | 0 (0.0%) |
| 75 Years and over | 0 (0.0%) | 0 (0.0%) |
Technology Access in Quechee
Computing Device Access in Quechee
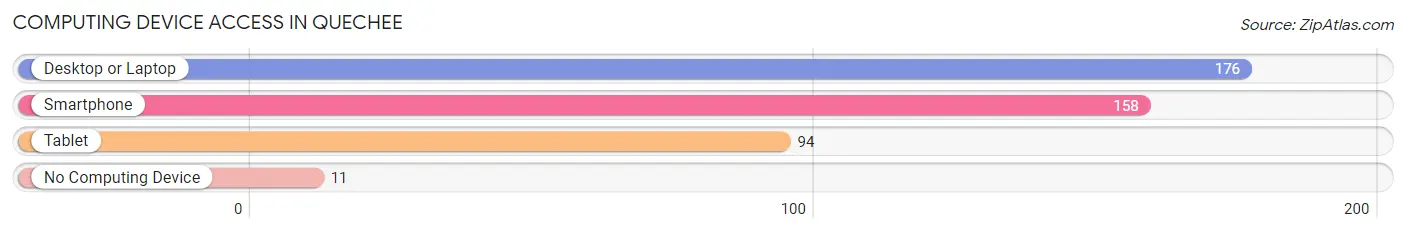
| Device Type | # Households | % Households |
| Desktop or Laptop | 176 | 79.6% |
| Smartphone | 158 | 71.5% |
| Tablet | 94 | 42.5% |
| No Computing Device | 11 | 5.0% |
| Total | 221 | 100.0% |
Internet Access in Quechee
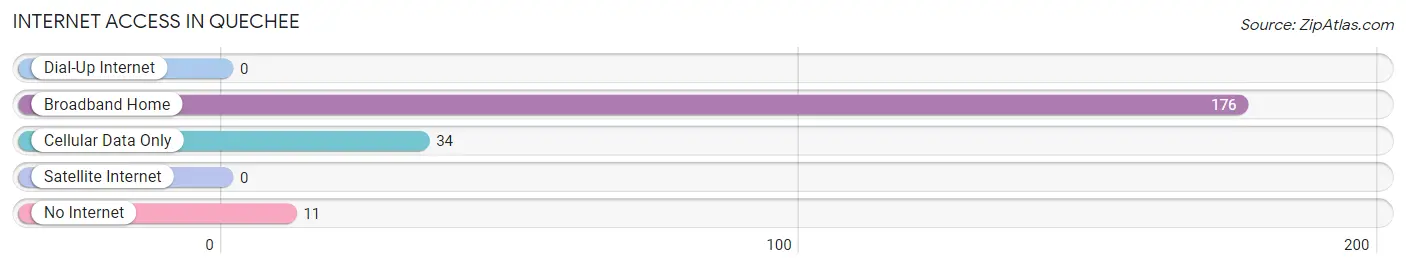
| Internet Type | # Households | % Households |
| Dial-Up Internet | 0 | 0.0% |
| Broadband Home | 176 | 79.6% |
| Cellular Data Only | 34 | 15.4% |
| Satellite Internet | 0 | 0.0% |
| No Internet | 11 | 5.0% |
| Total | 221 | 100.0% |
Quechee Summary
Quechee is a small village located in the town of Hartford, Vermont, in the United States. It is situated in the Upper Valley region of the state, along the Ottauquechee River. The village is known for its picturesque scenery, its historic buildings, and its recreational activities.
History
The area that is now Quechee was first settled in 1761 by a group of settlers from Connecticut. The settlers named the area Quechee, which is derived from the Abenaki word for “bend in the river.” The village was incorporated in 1761 and was an important stop on the stagecoach route between Boston and Montreal.
In the 19th century, Quechee became a popular summer resort destination for wealthy families from Boston and New York. The village was home to several grand hotels, including the Quechee Inn, which was built in 1876. The inn was destroyed by fire in 1891, but was rebuilt and is still in operation today.
In the late 19th century, Quechee became a center for the production of woolen goods. The Quechee Woolen Mill, which was established in 1876, was one of the largest woolen mills in the country. The mill closed in the 1950s, but the building still stands today and is listed on the National Register of Historic Places.
Geography
Quechee is located in the Upper Valley region of Vermont, along the Ottauquechee River. The village is situated in a valley surrounded by the Green Mountains to the east and the White Mountains to the west. The village is located approximately 10 miles south of the city of White River Junction and 25 miles north of the city of Rutland.
The climate in Quechee is typical of the New England region, with cold winters and warm summers. The average annual temperature is around 40 degrees Fahrenheit, and the average annual precipitation is around 40 inches.
Economy
The economy of Quechee is largely based on tourism and recreation. The village is home to several popular attractions, including the Quechee Gorge, the Quechee State Park, and the Quechee Lakes Golf Club. The village is also home to several restaurants, shops, and galleries.
The Quechee Lakes Resort is a popular destination for visitors to the area. The resort offers a variety of recreational activities, including golf, tennis, swimming, and boating. The resort also features a variety of lodging options, including villas, cottages, and condominiums.
Demographics
As of the 2010 census, the population of Quechee was 1,867. The racial makeup of the village was 97.3% White, 0.7% African American, 0.3% Native American, 0.3% Asian, 0.1% Pacific Islander, and 1.3% from other races. The median household income in Quechee was $50,938, and the median family income was $60,938. The per capita income in Quechee was $27,938.
Quechee is a small village with a rich history and a vibrant economy. The village is home to a variety of attractions and recreational activities, and is a popular destination for visitors to the area. The village is also home to a diverse population, with a variety of racial and ethnic backgrounds.
Common Questions
What is Per Capita Income in Quechee?
Per Capita income in Quechee is $55,235.
What is the Median Family Income in Quechee?
Median Family Income in Quechee is $39,118.
What is the Median Household income in Quechee?
Median Household Income in Quechee is $50,547.
What is Inequality or Gini Index in Quechee?
Inequality or Gini Index in Quechee is 0.44.
What is the Total Population of Quechee?
Total Population of Quechee is 340.
What is the Total Male Population of Quechee?
Total Male Population of Quechee is 102.
What is the Total Female Population of Quechee?
Total Female Population of Quechee is 238.
What is the Ratio of Males per 100 Females in Quechee?
There are 42.86 Males per 100 Females in Quechee.
What is the Ratio of Females per 100 Males in Quechee?
There are 233.33 Females per 100 Males in Quechee.
What is the Median Population Age in Quechee?
Median Population Age in Quechee is 64.7 Years.
What is the Average Family Size in Quechee
Average Family Size in Quechee is 2.5 People.
What is the Average Household Size in Quechee
Average Household Size in Quechee is 1.5 People.
How Large is the Labor Force in Quechee?
There are 133 People in the Labor Forcein in Quechee.
What is the Percentage of People in the Labor Force in Quechee?
43.6% of People are in the Labor Force in Quechee.
What is the Unemployment Rate in Quechee?
Unemployment Rate in Quechee is 9.8%.