Zip Codes with the Highest Percentage of Population Employed in Arts, Media & Entertainment in Utah
RELATED REPORTS & OPTIONS
Arts, Media & Entertainment
Utah
Compare Zip Codes
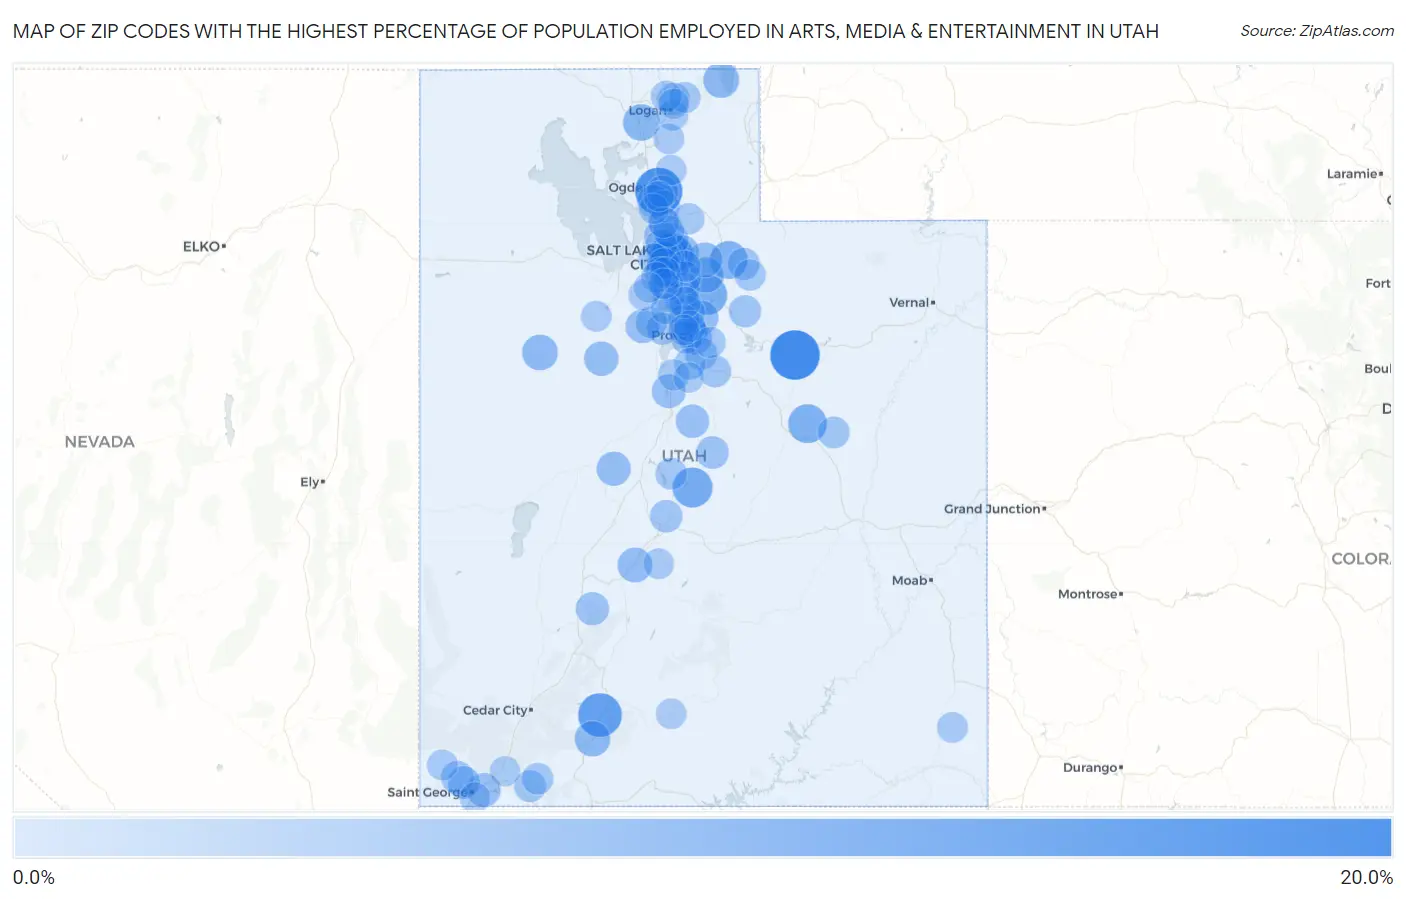
Map of Zip Codes with the Highest Percentage of Population Employed in Arts, Media & Entertainment in Utah
0.0%
20.0%
Zip Codes with the Highest Percentage of Population Employed in Arts, Media & Entertainment in Utah
| Zip Code | % Employed | vs State | vs National | |
| 1. | 84027 | 16.0% | 2.3%(+13.7)#1 | 2.1%(+14.0)#148 |
| 2. | 84408 | 14.3% | 2.3%(+12.0)#2 | 2.1%(+12.2)#186 |
| 3. | 84113 | 12.3% | 2.3%(+10.0)#3 | 2.1%(+10.3)#243 |
| 4. | 84735 | 11.6% | 2.3%(+9.31)#4 | 2.1%(+9.57)#276 |
| 5. | 84665 | 9.0% | 2.3%(+6.68)#5 | 2.1%(+6.94)#451 |
| 6. | 84049 | 8.5% | 2.3%(+6.17)#6 | 2.1%(+6.43)#489 |
| 7. | 84542 | 8.0% | 2.3%(+5.67)#7 | 2.1%(+5.93)#556 |
| 8. | 84061 | 7.2% | 2.3%(+4.93)#8 | 2.1%(+5.19)#703 |
| 9. | 84314 | 6.4% | 2.3%(+4.05)#9 | 2.1%(+4.31)#903 |
| 10. | 84112 | 6.3% | 2.3%(+3.98)#10 | 2.1%(+4.24)#928 |
| 11. | 84028 | 5.9% | 2.3%(+3.56)#11 | 2.1%(+3.82)#1,083 |
| 12. | 84022 | 5.8% | 2.3%(+3.44)#12 | 2.1%(+3.70)#1,135 |
| 13. | 84710 | 5.6% | 2.3%(+3.31)#13 | 2.1%(+3.57)#1,182 |
| 14. | 84060 | 5.5% | 2.3%(+3.16)#14 | 2.1%(+3.42)#1,259 |
| 15. | 84098 | 5.2% | 2.3%(+2.88)#15 | 2.1%(+3.14)#1,402 |
| 16. | 84724 | 5.1% | 2.3%(+2.83)#16 | 2.1%(+3.09)#1,423 |
| 17. | 84080 | 4.8% | 2.3%(+2.50)#17 | 2.1%(+2.76)#1,602 |
| 18. | 84103 | 4.8% | 2.3%(+2.45)#18 | 2.1%(+2.71)#1,643 |
| 19. | 84604 | 4.7% | 2.3%(+2.42)#19 | 2.1%(+2.68)#1,665 |
| 20. | 84105 | 4.7% | 2.3%(+2.41)#20 | 2.1%(+2.67)#1,670 |
| 21. | 84649 | 4.7% | 2.3%(+2.39)#21 | 2.1%(+2.65)#1,684 |
| 22. | 84108 | 4.5% | 2.3%(+2.15)#22 | 2.1%(+2.41)#1,874 |
| 23. | 84780 | 4.5% | 2.3%(+2.15)#23 | 2.1%(+2.41)#1,875 |
| 24. | 84645 | 4.4% | 2.3%(+2.09)#24 | 2.1%(+2.35)#1,926 |
| 25. | 84606 | 4.4% | 2.3%(+2.06)#25 | 2.1%(+2.32)#1,956 |
| 26. | 84013 | 4.4% | 2.3%(+2.04)#26 | 2.1%(+2.30)#1,974 |
| 27. | 84602 | 4.1% | 2.3%(+1.75)#27 | 2.1%(+2.01)#2,277 |
| 28. | 84632 | 4.1% | 2.3%(+1.75)#28 | 2.1%(+2.01)#2,281 |
| 29. | 84101 | 4.1% | 2.3%(+1.75)#29 | 2.1%(+2.01)#2,282 |
| 30. | 84713 | 4.0% | 2.3%(+1.65)#30 | 2.1%(+1.91)#2,399 |
| 31. | 84004 | 3.9% | 2.3%(+1.54)#31 | 2.1%(+1.80)#2,537 |
| 32. | 84056 | 3.9% | 2.3%(+1.53)#32 | 2.1%(+1.79)#2,554 |
| 33. | 84102 | 3.8% | 2.3%(+1.53)#33 | 2.1%(+1.79)#2,560 |
| 34. | 84738 | 3.8% | 2.3%(+1.51)#34 | 2.1%(+1.77)#2,586 |
| 35. | 84106 | 3.8% | 2.3%(+1.49)#35 | 2.1%(+1.75)#2,608 |
| 36. | 84662 | 3.6% | 2.3%(+1.28)#36 | 2.1%(+1.54)#2,909 |
| 37. | 84770 | 3.6% | 2.3%(+1.25)#37 | 2.1%(+1.51)#2,952 |
| 38. | 84062 | 3.6% | 2.3%(+1.23)#38 | 2.1%(+1.49)#2,986 |
| 39. | 84010 | 3.5% | 2.3%(+1.22)#39 | 2.1%(+1.48)#3,017 |
| 40. | 84652 | 3.4% | 2.3%(+1.11)#40 | 2.1%(+1.37)#3,160 |
| 41. | 84025 | 3.4% | 2.3%(+1.08)#41 | 2.1%(+1.34)#3,243 |
| 42. | 84124 | 3.4% | 2.3%(+1.07)#42 | 2.1%(+1.33)#3,256 |
| 43. | 84092 | 3.3% | 2.3%(+1.00)#43 | 2.1%(+1.26)#3,391 |
| 44. | 84121 | 3.3% | 2.3%(+0.939)#44 | 2.1%(+1.20)#3,493 |
| 45. | 84087 | 3.2% | 2.3%(+0.922)#45 | 2.1%(+1.18)#3,522 |
| 46. | 84664 | 3.2% | 2.3%(+0.919)#46 | 2.1%(+1.18)#3,527 |
| 47. | 84032 | 3.2% | 2.3%(+0.912)#47 | 2.1%(+1.17)#3,541 |
| 48. | 84660 | 3.2% | 2.3%(+0.908)#48 | 2.1%(+1.17)#3,547 |
| 49. | 84601 | 3.2% | 2.3%(+0.901)#49 | 2.1%(+1.16)#3,568 |
| 50. | 84045 | 3.2% | 2.3%(+0.895)#50 | 2.1%(+1.15)#3,579 |
| 51. | 84111 | 3.2% | 2.3%(+0.851)#51 | 2.1%(+1.11)#3,687 |
| 52. | 84020 | 3.1% | 2.3%(+0.752)#52 | 2.1%(+1.01)#3,912 |
| 53. | 84055 | 3.1% | 2.3%(+0.749)#53 | 2.1%(+1.01)#3,922 |
| 54. | 84040 | 3.1% | 2.3%(+0.741)#54 | 2.1%(+1.00)#3,944 |
| 55. | 84054 | 3.0% | 2.3%(+0.690)#55 | 2.1%(+0.950)#4,049 |
| 56. | 84318 | 3.0% | 2.3%(+0.668)#56 | 2.1%(+0.928)#4,111 |
| 57. | 84005 | 2.9% | 2.3%(+0.621)#57 | 2.1%(+0.881)#4,225 |
| 58. | 84539 | 2.9% | 2.3%(+0.620)#58 | 2.1%(+0.880)#4,229 |
| 59. | 84763 | 2.9% | 2.3%(+0.620)#59 | 2.1%(+0.880)#4,230 |
| 60. | 84094 | 2.9% | 2.3%(+0.588)#60 | 2.1%(+0.847)#4,330 |
| 61. | 84630 | 2.9% | 2.3%(+0.586)#61 | 2.1%(+0.846)#4,335 |
| 62. | 84403 | 2.9% | 2.3%(+0.571)#62 | 2.1%(+0.830)#4,371 |
| 63. | 84767 | 2.9% | 2.3%(+0.555)#63 | 2.1%(+0.814)#4,411 |
| 64. | 84042 | 2.8% | 2.3%(+0.445)#64 | 2.1%(+0.705)#4,711 |
| 65. | 84109 | 2.7% | 2.3%(+0.422)#65 | 2.1%(+0.682)#4,779 |
| 66. | 84097 | 2.7% | 2.3%(+0.394)#66 | 2.1%(+0.654)#4,866 |
| 67. | 84003 | 2.7% | 2.3%(+0.370)#67 | 2.1%(+0.630)#4,942 |
| 68. | 84653 | 2.7% | 2.3%(+0.370)#68 | 2.1%(+0.630)#4,944 |
| 69. | 84036 | 2.7% | 2.3%(+0.344)#69 | 2.1%(+0.604)#5,017 |
| 70. | 84663 | 2.6% | 2.3%(+0.322)#70 | 2.1%(+0.582)#5,089 |
| 71. | 84050 | 2.6% | 2.3%(+0.282)#71 | 2.1%(+0.542)#5,219 |
| 72. | 84332 | 2.6% | 2.3%(+0.253)#72 | 2.1%(+0.513)#5,321 |
| 73. | 84655 | 2.6% | 2.3%(+0.233)#73 | 2.1%(+0.493)#5,386 |
| 74. | 84104 | 2.5% | 2.3%(+0.139)#74 | 2.1%(+0.399)#5,686 |
| 75. | 84014 | 2.4% | 2.3%(+0.123)#75 | 2.1%(+0.383)#5,768 |
| 76. | 84043 | 2.4% | 2.3%(+0.110)#76 | 2.1%(+0.370)#5,819 |
| 77. | 84321 | 2.4% | 2.3%(+0.080)#77 | 2.1%(+0.339)#5,936 |
| 78. | 84335 | 2.4% | 2.3%(+0.073)#78 | 2.1%(+0.332)#5,964 |
| 79. | 84058 | 2.4% | 2.3%(+0.049)#79 | 2.1%(+0.309)#6,056 |
| 80. | 84115 | 2.4% | 2.3%(+0.032)#80 | 2.1%(+0.292)#6,118 |
| 81. | 84765 | 2.3% | 2.3%(+0.022)#81 | 2.1%(+0.282)#6,171 |
| 82. | 84037 | 2.3% | 2.3%(+0.022)#82 | 2.1%(+0.282)#6,175 |
| 83. | 84123 | 2.3% | 2.3%(+0.008)#83 | 2.1%(+0.268)#6,250 |
| 84. | 84096 | 2.3% | 2.3%(-0.003)#84 | 2.1%(+0.257)#6,304 |
| 85. | 84328 | 2.3% | 2.3%(-0.033)#85 | 2.1%(+0.227)#6,422 |
| 86. | 84511 | 2.3% | 2.3%(-0.054)#86 | 2.1%(+0.206)#6,524 |
| 87. | 84107 | 2.3% | 2.3%(-0.070)#87 | 2.1%(+0.189)#6,604 |
| 88. | 84084 | 2.2% | 2.3%(-0.099)#88 | 2.1%(+0.161)#6,725 |
| 89. | 84069 | 2.2% | 2.3%(-0.123)#89 | 2.1%(+0.137)#6,833 |
| 90. | 84070 | 2.2% | 2.3%(-0.133)#90 | 2.1%(+0.127)#6,884 |
| 91. | 84701 | 2.1% | 2.3%(-0.177)#91 | 2.1%(+0.082)#7,078 |
| 92. | 84790 | 2.1% | 2.3%(-0.210)#92 | 2.1%(+0.050)#7,211 |
| 93. | 84310 | 2.1% | 2.3%(-0.235)#93 | 2.1%(+0.025)#7,351 |
| 94. | 84736 | 2.1% | 2.3%(-0.252)#94 | 2.1%(+0.008)#7,443 |
| 95. | 84651 | 2.0% | 2.3%(-0.288)#95 | 2.1%(-0.028)#7,642 |
| 96. | 84041 | 2.0% | 2.3%(-0.313)#96 | 2.1%(-0.054)#7,780 |
| 97. | 84341 | 2.0% | 2.3%(-0.338)#97 | 2.1%(-0.078)#7,902 |
| 98. | 84774 | 2.0% | 2.3%(-0.360)#98 | 2.1%(-0.100)#8,022 |
| 99. | 84009 | 2.0% | 2.3%(-0.369)#99 | 2.1%(-0.110)#8,079 |
| 100. | 84405 | 2.0% | 2.3%(-0.370)#100 | 2.1%(-0.110)#8,086 |
Common Questions
What are the Top 10 Zip Codes with the Highest Percentage of Population Employed in Arts, Media & Entertainment in Utah?
Top 10 Zip Codes with the Highest Percentage of Population Employed in Arts, Media & Entertainment in Utah are:
What zip code has the Highest Percentage of Population Employed in Arts, Media & Entertainment in Utah?
84027 has the Highest Percentage of Population Employed in Arts, Media & Entertainment in Utah with 16.0%.
What is the Percentage of Population Employed in Arts, Media & Entertainment in the State of Utah?
Percentage of Population Employed in Arts, Media & Entertainment in Utah is 2.3%.
What is the Percentage of Population Employed in Arts, Media & Entertainment in the United States?
Percentage of Population Employed in Arts, Media & Entertainment in the United States is 2.1%.