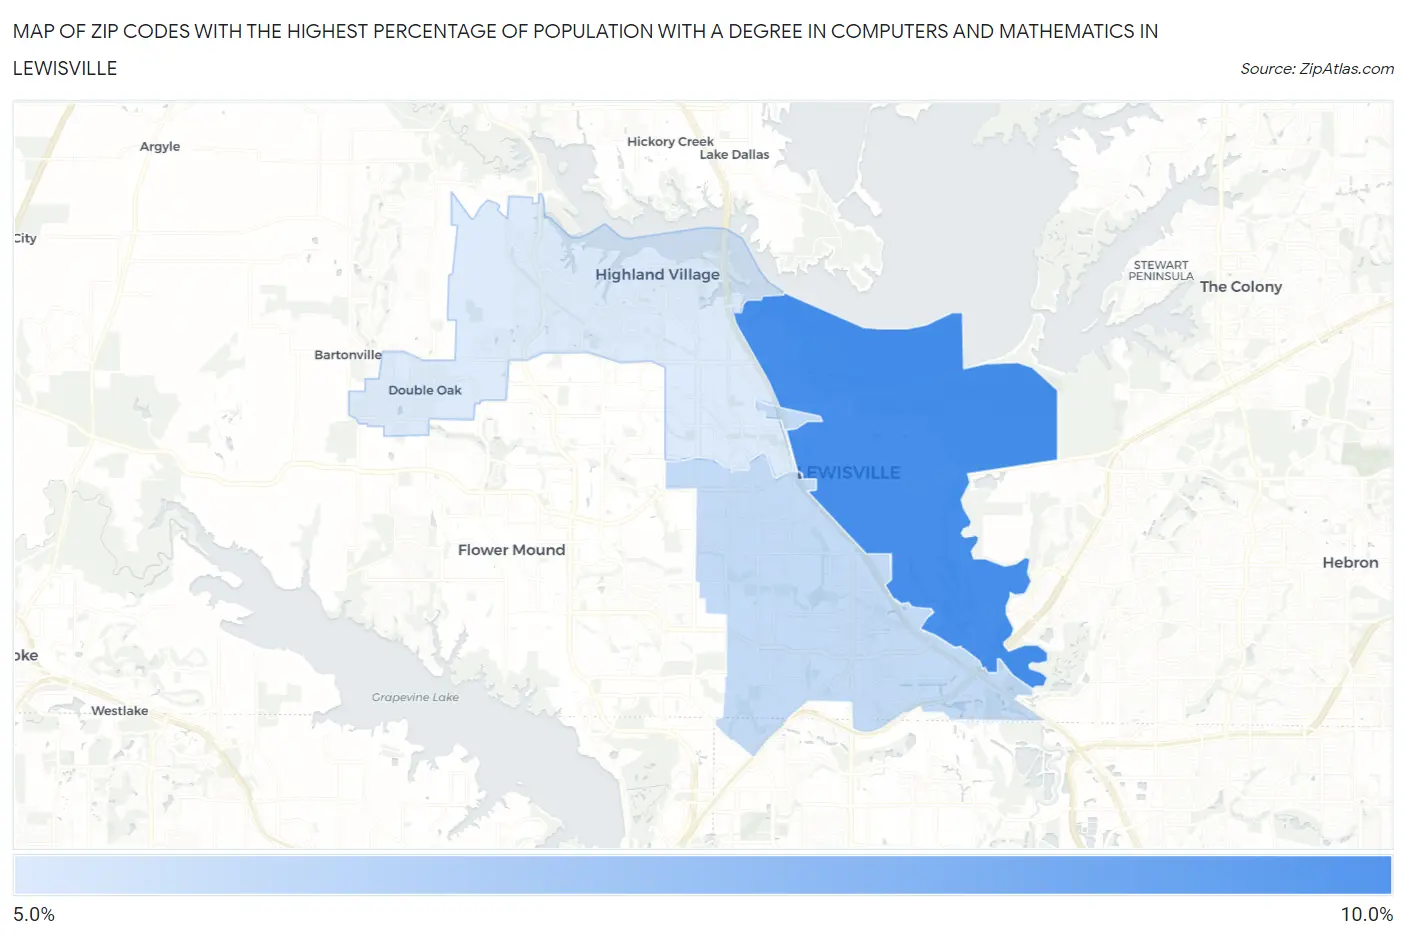
Zip Codes with the Highest Percentage of Population with a Degree in Computers and Mathematics in Lewisville, TX
RELATED REPORTS & OPTIONS
Computers and Mathematics
Lewisville
Compare Zip Codes
Map of Zip Codes with the Highest Percentage of Population with a Degree in Computers and Mathematics in Lewisville
5.5%
9.5%
Zip Codes with the Highest Percentage of Population with a Degree in Computers and Mathematics in Lewisville, TX
| Zip Code | % Graduates | vs State | vs National | |
| 1. | 75057 | 9.5% | 5.2%(+4.31)#127 | 4.9%(+4.60)#1,971 |
| 2. | 75067 | 6.1% | 5.2%(+0.951)#351 | 4.9%(+1.23)#5,063 |
| 3. | 75077 | 5.5% | 5.2%(+0.285)#441 | 4.9%(+0.569)#6,375 |
1
Common Questions
What are the Top Zip Codes with the Highest Percentage of Population with a Degree in Computers and Mathematics in Lewisville, TX?
Top Zip Codes with the Highest Percentage of Population with a Degree in Computers and Mathematics in Lewisville, TX are:
What zip code has the Highest Percentage of Population with a Degree in Computers and Mathematics in Lewisville, TX?
75057 has the Highest Percentage of Population with a Degree in Computers and Mathematics in Lewisville, TX with 9.5%.
What is the Percentage of Population with a Degree in Computers and Mathematics in Lewisville, TX?
Percentage of Population with a Degree in Computers and Mathematics in Lewisville is 6.9%.
What is the Percentage of Population with a Degree in Computers and Mathematics in Texas?
Percentage of Population with a Degree in Computers and Mathematics in Texas is 5.2%.
What is the Percentage of Population with a Degree in Computers and Mathematics in the United States?
Percentage of Population with a Degree in Computers and Mathematics in the United States is 4.9%.