Pleasant Hill, TX Map & Demographics
Pleasant Hill Map
Pleasant Hill Overview
$21,193
PER CAPITA INCOME
$67,500
AVG FAMILY INCOME
$50,147
AVG HOUSEHOLD INCOME
0.37
INEQUALITY / GINI INDEX
975
TOTAL POPULATION
645
MALE POPULATION
330
FEMALE POPULATION
195.45
MALES / 100 FEMALES
51.16
FEMALES / 100 MALES
38.9
MEDIAN AGE
6.4
AVG FAMILY SIZE
4.5
AVG HOUSEHOLD SIZE
534
LABOR FORCE [ PEOPLE ]
62.7%
PERCENT IN LABOR FORCE
19.3%
UNEMPLOYMENT RATE
Income in Pleasant Hill
Income Overview in Pleasant Hill
Per Capita Income in Pleasant Hill is $21,193, while median incomes of families and households are $67,500 and $50,147 respectively.
| Characteristic | Number | Measure |
| Per Capita Income | 975 | $21,193 |
| Median Family Income | 140 | $67,500 |
| Mean Family Income | 140 | $76,240 |
| Median Household Income | 218 | $50,147 |
| Mean Household Income | 218 | $57,724 |
| Income Deficit | 140 | $0 |
| Wage / Income Gap (%) | 975 | 0.00% |
| Wage / Income Gap ($) | 975 | 100.00¢ per $1 |
| Gini / Inequality Index | 975 | 0.37 |
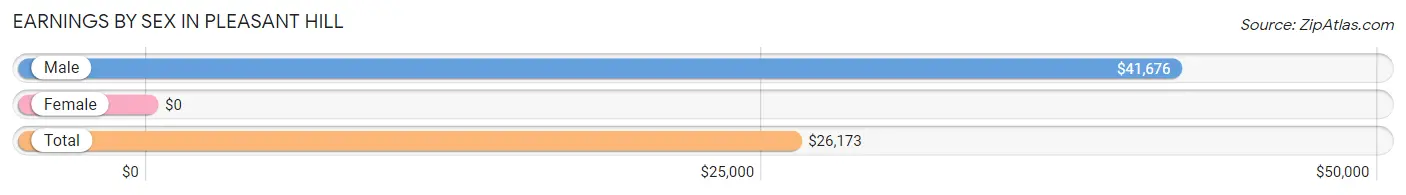
Earnings by Sex in Pleasant Hill
| Sex | Number | Average Earnings |
| Male | 267 (57.5%) | $41,676 |
| Female | 197 (42.5%) | $0 |
| Total | 464 (100.0%) | $26,173 |
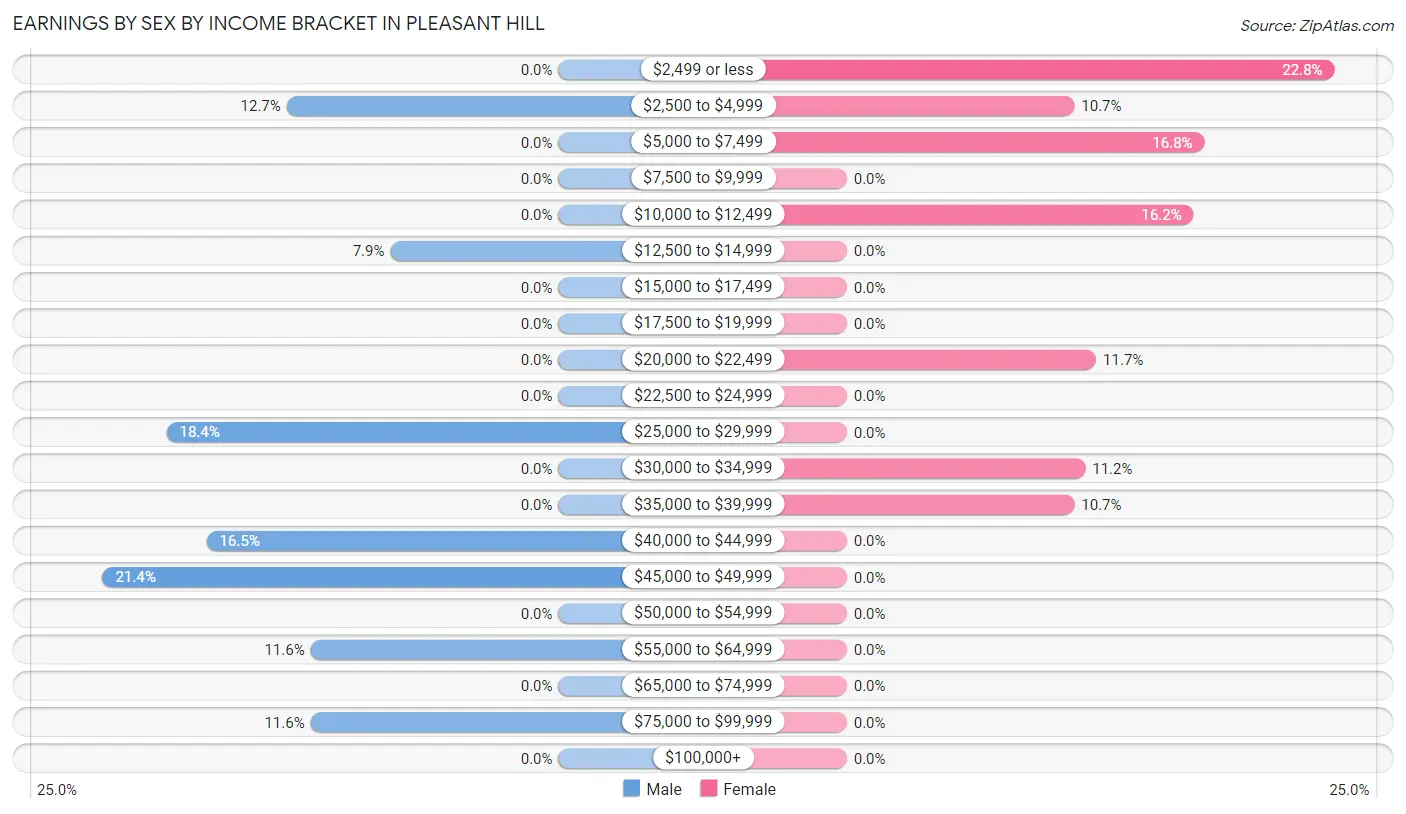
Earnings by Sex by Income Bracket in Pleasant Hill
The most common earnings brackets in Pleasant Hill are $45,000 to $49,999 for men (57 | 21.3%) and $2,499 or less for women (45 | 22.8%).
| Income | Male | Female |
| $2,499 or less | 0 (0.0%) | 45 (22.8%) |
| $2,500 to $4,999 | 34 (12.7%) | 21 (10.7%) |
| $5,000 to $7,499 | 0 (0.0%) | 33 (16.8%) |
| $7,500 to $9,999 | 0 (0.0%) | 0 (0.0%) |
| $10,000 to $12,499 | 0 (0.0%) | 32 (16.2%) |
| $12,500 to $14,999 | 21 (7.9%) | 0 (0.0%) |
| $15,000 to $17,499 | 0 (0.0%) | 0 (0.0%) |
| $17,500 to $19,999 | 0 (0.0%) | 0 (0.0%) |
| $20,000 to $22,499 | 0 (0.0%) | 23 (11.7%) |
| $22,500 to $24,999 | 0 (0.0%) | 0 (0.0%) |
| $25,000 to $29,999 | 49 (18.3%) | 0 (0.0%) |
| $30,000 to $34,999 | 0 (0.0%) | 22 (11.2%) |
| $35,000 to $39,999 | 0 (0.0%) | 21 (10.7%) |
| $40,000 to $44,999 | 44 (16.5%) | 0 (0.0%) |
| $45,000 to $49,999 | 57 (21.3%) | 0 (0.0%) |
| $50,000 to $54,999 | 0 (0.0%) | 0 (0.0%) |
| $55,000 to $64,999 | 31 (11.6%) | 0 (0.0%) |
| $65,000 to $74,999 | 0 (0.0%) | 0 (0.0%) |
| $75,000 to $99,999 | 31 (11.6%) | 0 (0.0%) |
| $100,000+ | 0 (0.0%) | 0 (0.0%) |
| Total | 267 (100.0%) | 197 (100.0%) |
Earnings by Sex by Educational Attainment in Pleasant Hill
| Educational Attainment | Male Income | Female Income |
| Less than High School | - | - |
| High School Diploma | - | - |
| College or Associate's Degree | - | - |
| Bachelor's Degree | - | - |
| Graduate Degree | - | - |
| Total | $48,447 | $0 |
Family Income in Pleasant Hill
Family Income Brackets in Pleasant Hill
According to the Pleasant Hill family income data, there are 62 families falling into the $50,000 to $74,999 income range, which is the most common income bracket and makes up 44.3% of all families.
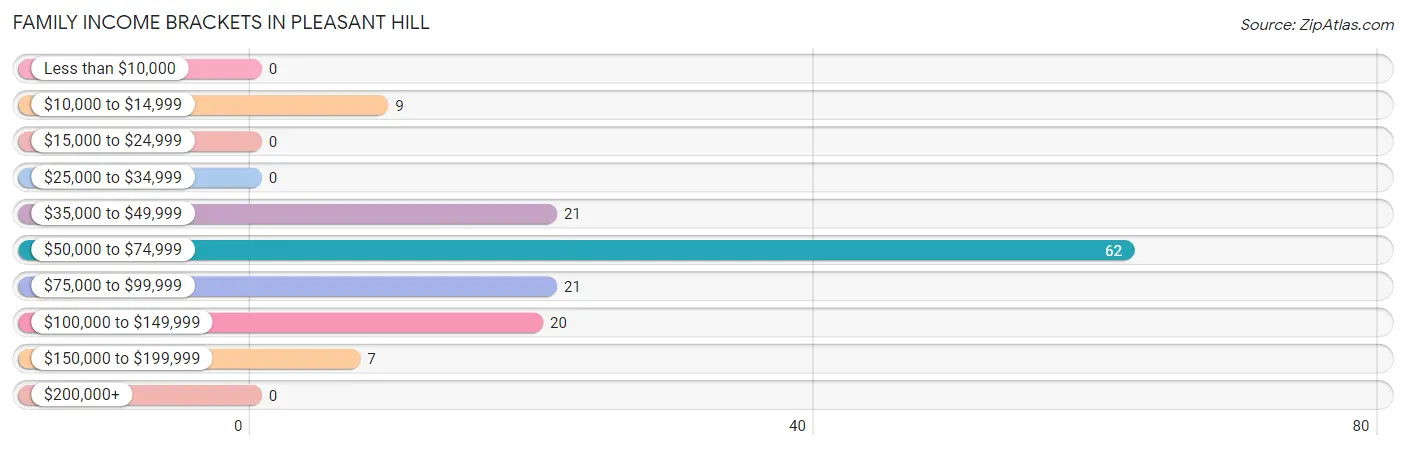
| Income Bracket | # Families | % Families |
| Less than $10,000 | 0 | 0.0% |
| $10,000 to $14,999 | 9 | 6.4% |
| $15,000 to $24,999 | 0 | 0.0% |
| $25,000 to $34,999 | 0 | 0.0% |
| $35,000 to $49,999 | 21 | 15.0% |
| $50,000 to $74,999 | 62 | 44.3% |
| $75,000 to $99,999 | 21 | 15.0% |
| $100,000 to $149,999 | 20 | 14.3% |
| $150,000 to $199,999 | 7 | 5.0% |
| $200,000+ | 0 | 0.0% |
Family Income by Famaliy Size in Pleasant Hill
2-person families (53 | 37.9%) account for the highest median family income in Pleasant Hill with $61,902 per family, while 2-person families (53 | 37.9%) have the highest median income of $30,951 per family member.
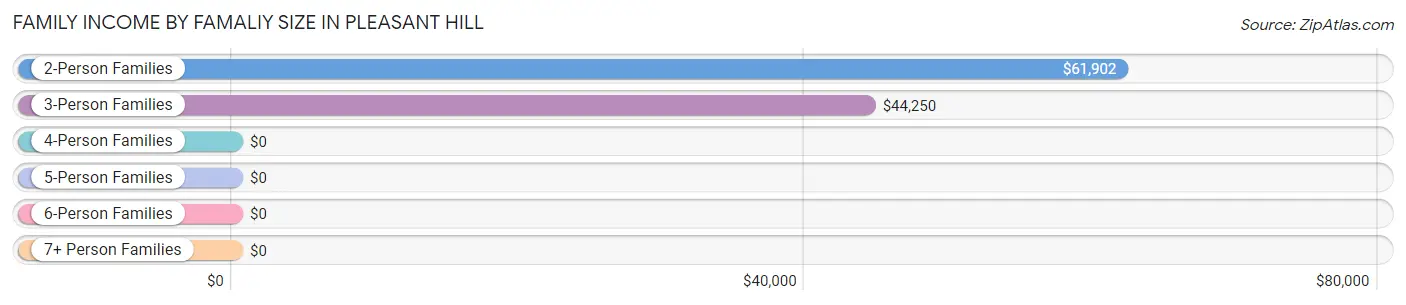
| Income Bracket | # Families | Median Income |
| 2-Person Families | 53 (37.9%) | $61,902 |
| 3-Person Families | 21 (15.0%) | $44,250 |
| 4-Person Families | 17 (12.1%) | $0 |
| 5-Person Families | 20 (14.3%) | $0 |
| 6-Person Families | 0 (0.0%) | $0 |
| 7+ Person Families | 29 (20.7%) | $0 |
| Total | 140 (100.0%) | $67,500 |
Family Income by Number of Earners in Pleasant Hill
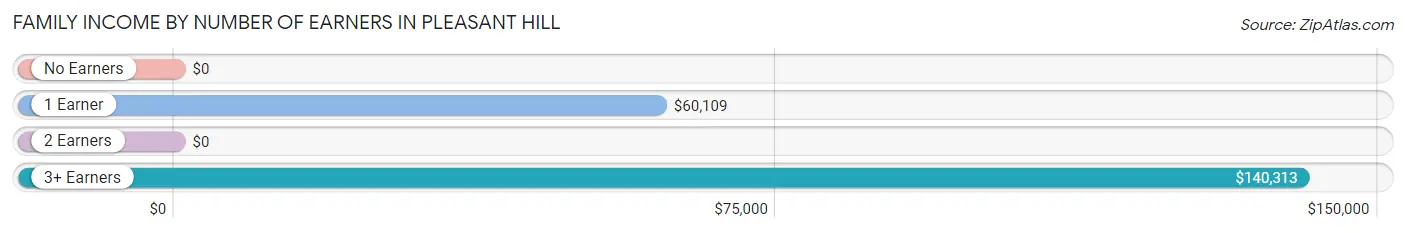
| Number of Earners | # Families | Median Income |
| No Earners | 9 (6.4%) | $0 |
| 1 Earner | 44 (31.4%) | $60,109 |
| 2 Earners | 38 (27.1%) | $0 |
| 3+ Earners | 49 (35.0%) | $140,313 |
| Total | 140 (100.0%) | $67,500 |
Household Income in Pleasant Hill
Household Income Brackets in Pleasant Hill
With 62 households falling in the category, the $50,000 to $74,999 income range is the most frequent in Pleasant Hill, accounting for 28.4% of all households.
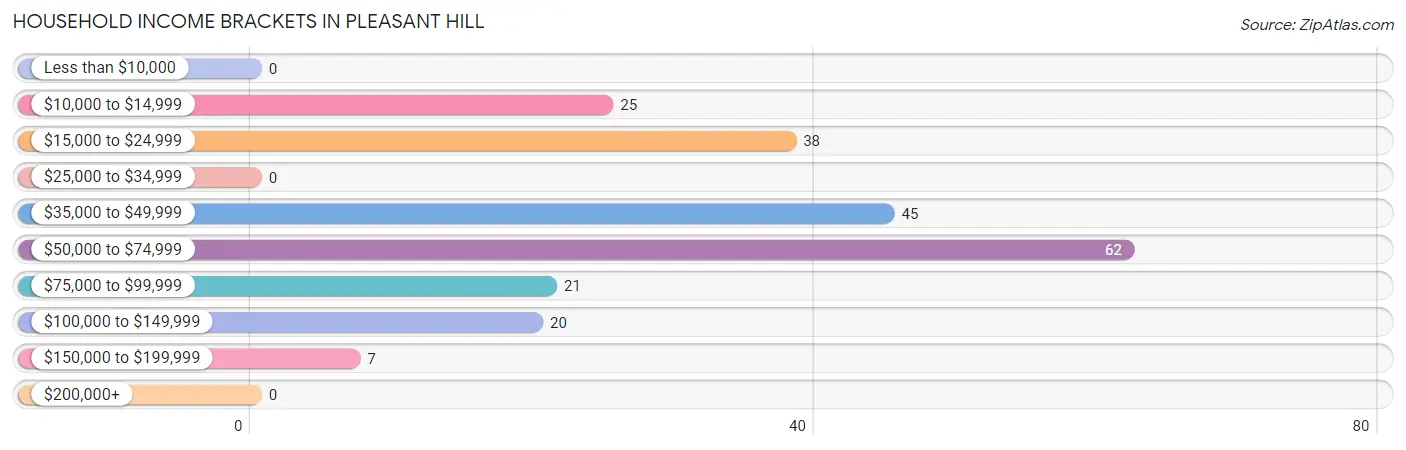
| Income Bracket | # Households | % Households |
| Less than $10,000 | 0 | 0.0% |
| $10,000 to $14,999 | 25 | 11.5% |
| $15,000 to $24,999 | 38 | 17.4% |
| $25,000 to $34,999 | 0 | 0.0% |
| $35,000 to $49,999 | 45 | 20.6% |
| $50,000 to $74,999 | 62 | 28.4% |
| $75,000 to $99,999 | 21 | 9.6% |
| $100,000 to $149,999 | 20 | 9.2% |
| $150,000 to $199,999 | 7 | 3.2% |
| $200,000+ | 0 | 0.0% |
Household Income by Householder Age in Pleasant Hill
The median household income in Pleasant Hill is $50,147, with the highest median household income of $51,397 found in the 25 to 44 years age bracket for the primary householder. A total of 59 households (27.1%) fall into this category.
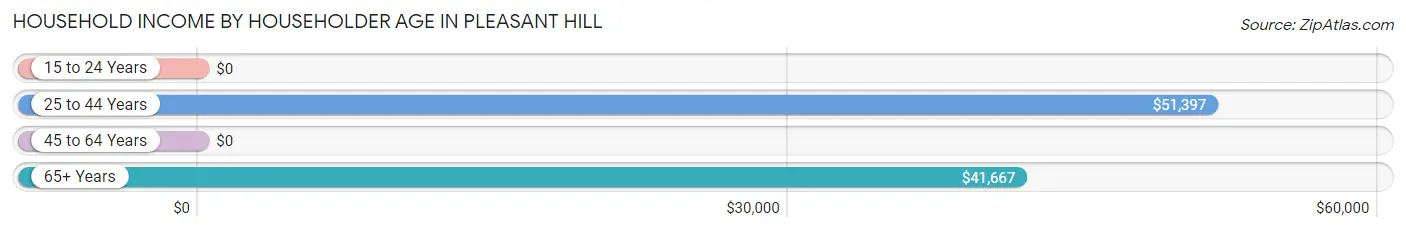
| Income Bracket | # Households | Median Income |
| 15 to 24 Years | 0 (0.0%) | $0 |
| 25 to 44 Years | 59 (27.1%) | $51,397 |
| 45 to 64 Years | 41 (18.8%) | $0 |
| 65+ Years | 118 (54.1%) | $41,667 |
| Total | 218 (100.0%) | $50,147 |
Poverty in Pleasant Hill
Income Below Poverty by Sex and Age in Pleasant Hill
With 4.2% poverty level for males and 2.7% for females among the residents of Pleasant Hill, 75 year old and over males and 65 to 74 year old females are the most vulnerable to poverty, with 16 males (50.0%) and 9 females (10.6%) in their respective age groups living below the poverty level.
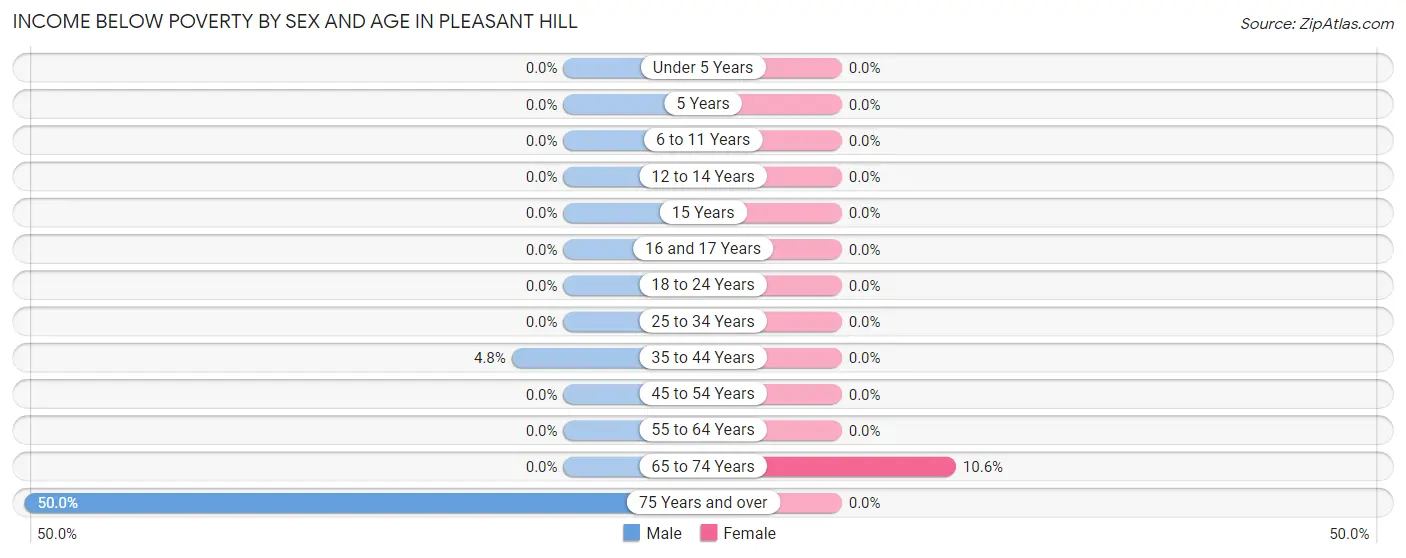
| Age Bracket | Male | Female |
| Under 5 Years | 0 (0.0%) | 0 (0.0%) |
| 5 Years | 0 (0.0%) | 0 (0.0%) |
| 6 to 11 Years | 0 (0.0%) | 0 (0.0%) |
| 12 to 14 Years | 0 (0.0%) | 0 (0.0%) |
| 15 Years | 0 (0.0%) | 0 (0.0%) |
| 16 and 17 Years | 0 (0.0%) | 0 (0.0%) |
| 18 to 24 Years | 0 (0.0%) | 0 (0.0%) |
| 25 to 34 Years | 0 (0.0%) | 0 (0.0%) |
| 35 to 44 Years | 11 (4.8%) | 0 (0.0%) |
| 45 to 54 Years | 0 (0.0%) | 0 (0.0%) |
| 55 to 64 Years | 0 (0.0%) | 0 (0.0%) |
| 65 to 74 Years | 0 (0.0%) | 9 (10.6%) |
| 75 Years and over | 16 (50.0%) | 0 (0.0%) |
| Total | 27 (4.2%) | 9 (2.7%) |
Income Above Poverty by Sex and Age in Pleasant Hill
According to the poverty statistics in Pleasant Hill, males aged 6 to 11 years and females aged 6 to 11 years are the age groups that are most secure financially, with 100.0% of males and 100.0% of females in these age groups living above the poverty line.
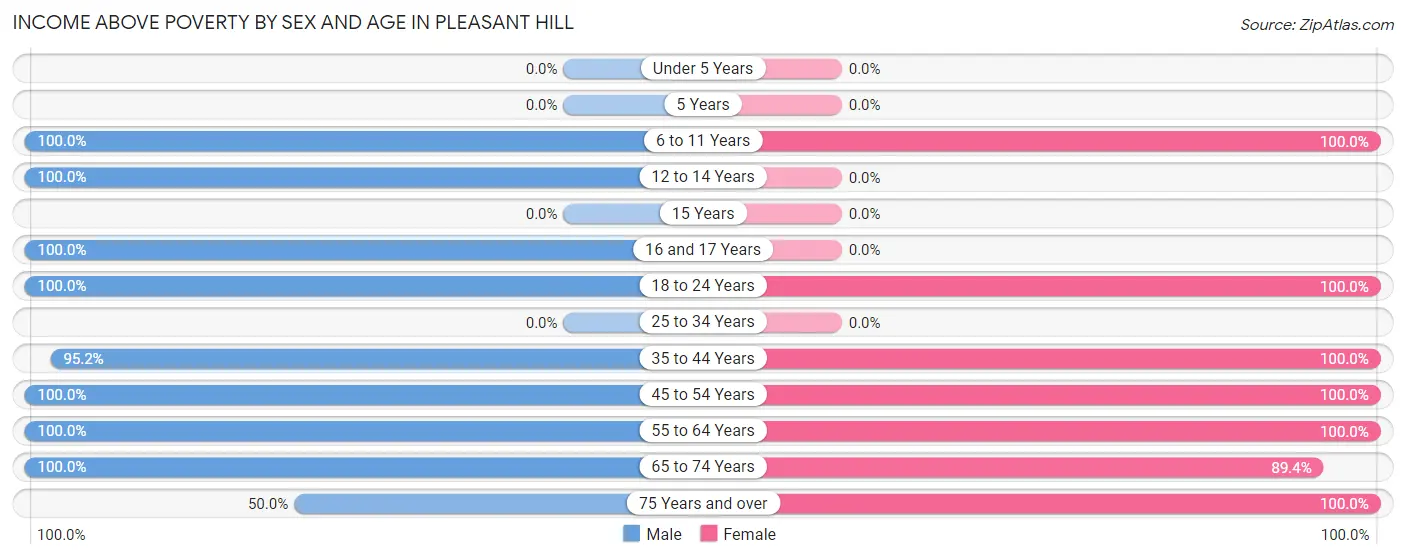
| Age Bracket | Male | Female |
| Under 5 Years | 0 (0.0%) | 0 (0.0%) |
| 5 Years | 0 (0.0%) | 0 (0.0%) |
| 6 to 11 Years | 29 (100.0%) | 23 (100.0%) |
| 12 to 14 Years | 71 (100.0%) | 0 (0.0%) |
| 15 Years | 0 (0.0%) | 0 (0.0%) |
| 16 and 17 Years | 34 (100.0%) | 0 (0.0%) |
| 18 to 24 Years | 135 (100.0%) | 39 (100.0%) |
| 25 to 34 Years | 0 (0.0%) | 0 (0.0%) |
| 35 to 44 Years | 218 (95.2%) | 89 (100.0%) |
| 45 to 54 Years | 58 (100.0%) | 41 (100.0%) |
| 55 to 64 Years | 21 (100.0%) | 35 (100.0%) |
| 65 to 74 Years | 36 (100.0%) | 76 (89.4%) |
| 75 Years and over | 16 (50.0%) | 18 (100.0%) |
| Total | 618 (95.8%) | 321 (97.3%) |
Income Below Poverty Among Married-Couple Families in Pleasant Hill
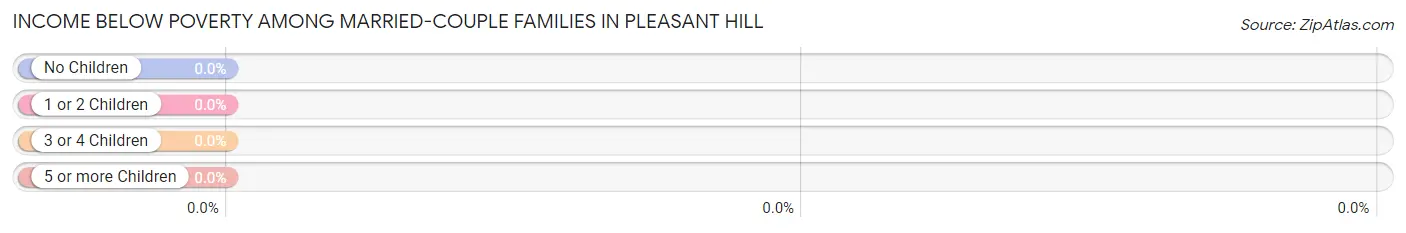
| Children | Above Poverty | Below Poverty |
| No Children | 62 (100.0%) | 0 (0.0%) |
| 1 or 2 Children | 24 (100.0%) | 0 (0.0%) |
| 3 or 4 Children | 22 (100.0%) | 0 (0.0%) |
| 5 or more Children | 0 (0.0%) | 0 (0.0%) |
| Total | 108 (100.0%) | 0 (0.0%) |
Income Below Poverty Among Single-Parent Households in Pleasant Hill
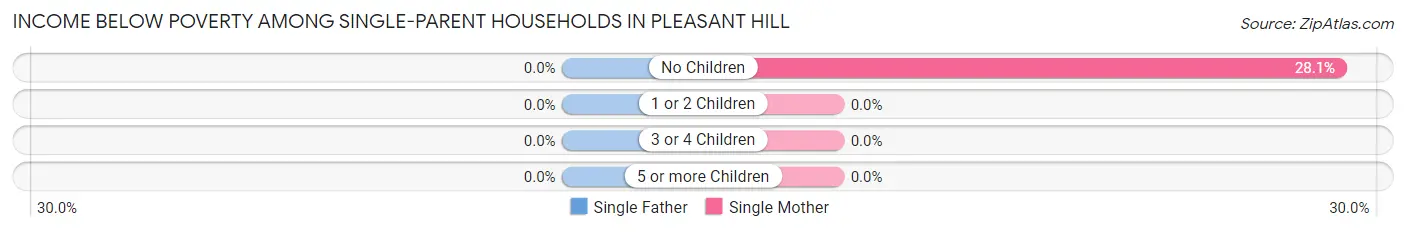
| Children | Single Father | Single Mother |
| No Children | 0 (0.0%) | 9 (28.1%) |
| 1 or 2 Children | 0 (0.0%) | 0 (0.0%) |
| 3 or 4 Children | 0 (0.0%) | 0 (0.0%) |
| 5 or more Children | 0 (0.0%) | 0 (0.0%) |
| Total | 0 (0.0%) | 9 (28.1%) |
Income Below Poverty Among Married-Couple vs Single-Parent Households in Pleasant Hill
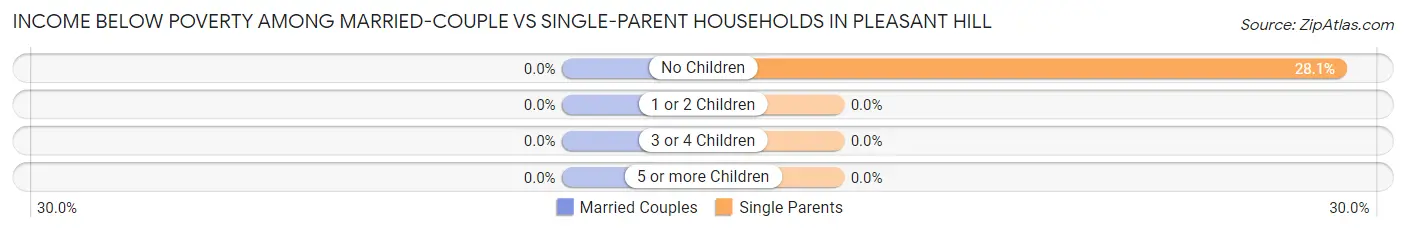
| Children | Married-Couple Families | Single-Parent Households |
| No Children | 0 (0.0%) | 9 (28.1%) |
| 1 or 2 Children | 0 (0.0%) | 0 (0.0%) |
| 3 or 4 Children | 0 (0.0%) | 0 (0.0%) |
| 5 or more Children | 0 (0.0%) | 0 (0.0%) |
| Total | 0 (0.0%) | 9 (28.1%) |
Race in Pleasant Hill
The most populous races in Pleasant Hill are Hispanic or Latino (647 | 66.4%), White / Caucasian (596 | 61.1%), and Two or more Races (379 | 38.9%).
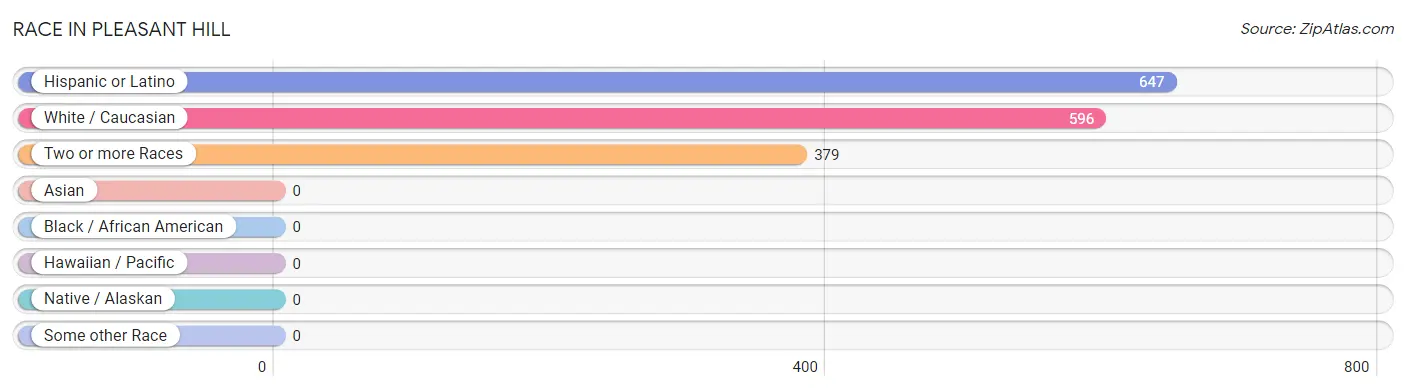
| Race | # Population | % Population |
| Asian | 0 | 0.0% |
| Black / African American | 0 | 0.0% |
| Hawaiian / Pacific | 0 | 0.0% |
| Hispanic or Latino | 647 | 66.4% |
| Native / Alaskan | 0 | 0.0% |
| White / Caucasian | 596 | 61.1% |
| Two or more Races | 379 | 38.9% |
| Some other Race | 0 | 0.0% |
| Total | 975 | 100.0% |
Ancestry in Pleasant Hill
The most populous ancestries reported in Pleasant Hill are Mexican (631 | 64.7%), Blackfeet (108 | 11.1%), American (49 | 5.0%), English (41 | 4.2%), and Irish (26 | 2.7%), together accounting for 87.7% of all Pleasant Hill residents.
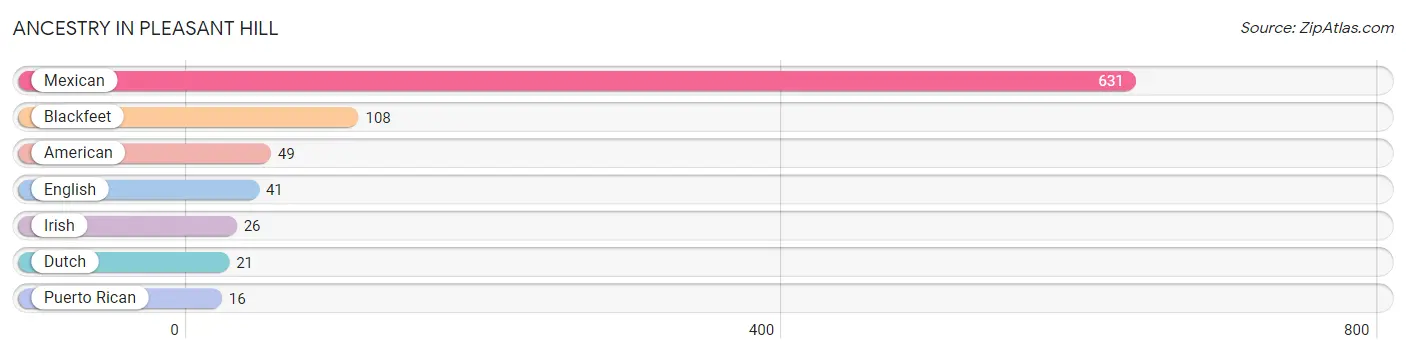
| Ancestry | # Population | % Population |
| American | 49 | 5.0% |
| Blackfeet | 108 | 11.1% |
| Dutch | 21 | 2.1% |
| English | 41 | 4.2% |
| Irish | 26 | 2.7% |
| Mexican | 631 | 64.7% |
| Puerto Rican | 16 | 1.6% | View All 7 Rows |
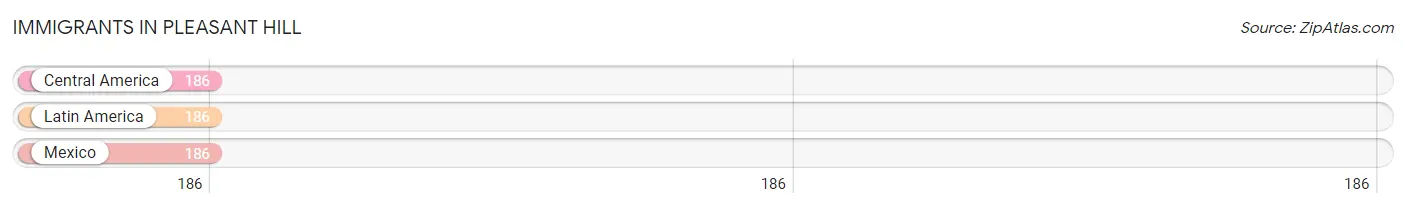
Immigrants in Pleasant Hill
The most numerous immigrant groups reported in Pleasant Hill came from Central America (186 | 19.1%), Latin America (186 | 19.1%), and Mexico (186 | 19.1%), together accounting for 57.2% of all Pleasant Hill residents.
| Immigration Origin | # Population | % Population |
| Central America | 186 | 19.1% |
| Latin America | 186 | 19.1% |
| Mexico | 186 | 19.1% | View All 3 Rows |
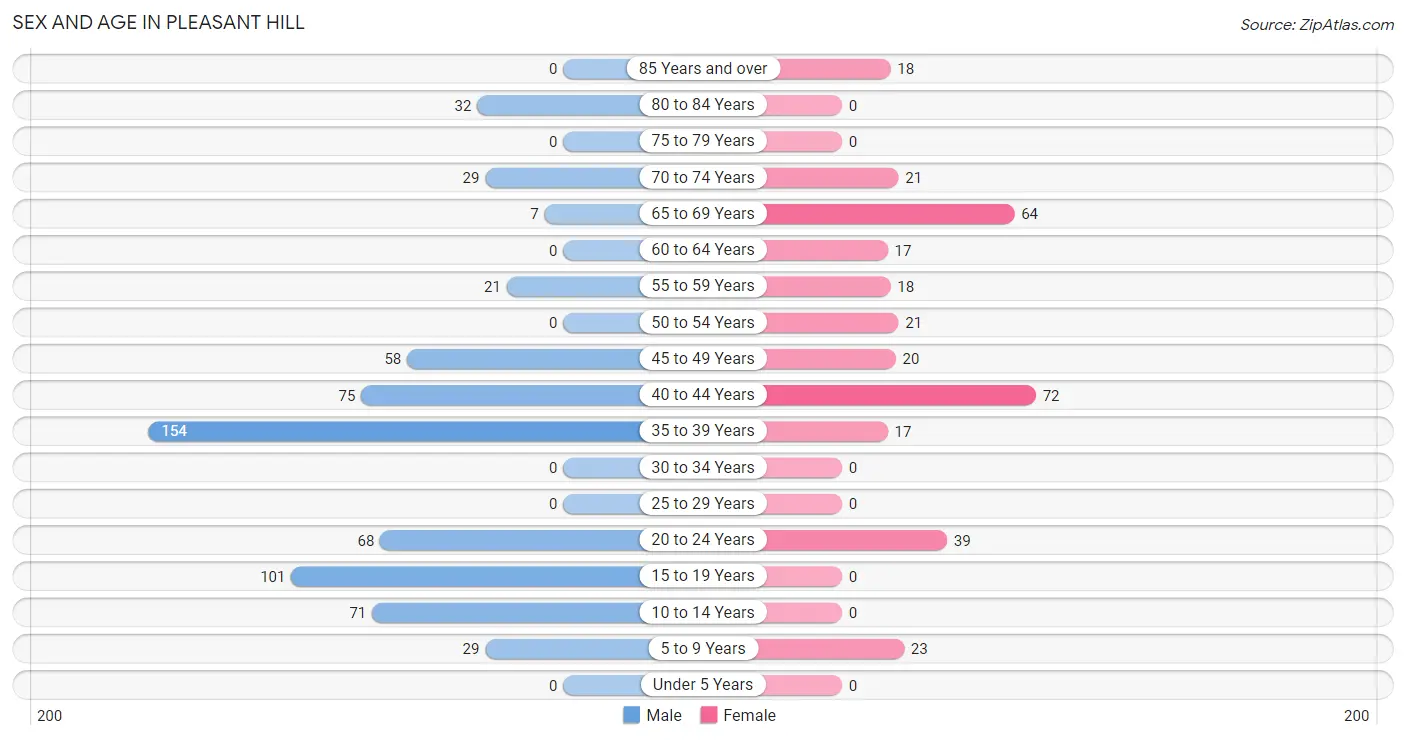
Sex and Age in Pleasant Hill
Sex and Age in Pleasant Hill
The most populous age groups in Pleasant Hill are 35 to 39 Years (154 | 23.9%) for men and 40 to 44 Years (72 | 21.8%) for women.
| Age Bracket | Male | Female |
| Under 5 Years | 0 (0.0%) | 0 (0.0%) |
| 5 to 9 Years | 29 (4.5%) | 23 (7.0%) |
| 10 to 14 Years | 71 (11.0%) | 0 (0.0%) |
| 15 to 19 Years | 101 (15.7%) | 0 (0.0%) |
| 20 to 24 Years | 68 (10.5%) | 39 (11.8%) |
| 25 to 29 Years | 0 (0.0%) | 0 (0.0%) |
| 30 to 34 Years | 0 (0.0%) | 0 (0.0%) |
| 35 to 39 Years | 154 (23.9%) | 17 (5.1%) |
| 40 to 44 Years | 75 (11.6%) | 72 (21.8%) |
| 45 to 49 Years | 58 (9.0%) | 20 (6.1%) |
| 50 to 54 Years | 0 (0.0%) | 21 (6.4%) |
| 55 to 59 Years | 21 (3.3%) | 18 (5.4%) |
| 60 to 64 Years | 0 (0.0%) | 17 (5.1%) |
| 65 to 69 Years | 7 (1.1%) | 64 (19.4%) |
| 70 to 74 Years | 29 (4.5%) | 21 (6.4%) |
| 75 to 79 Years | 0 (0.0%) | 0 (0.0%) |
| 80 to 84 Years | 32 (5.0%) | 0 (0.0%) |
| 85 Years and over | 0 (0.0%) | 18 (5.4%) |
| Total | 645 (100.0%) | 330 (100.0%) |
Families and Households in Pleasant Hill
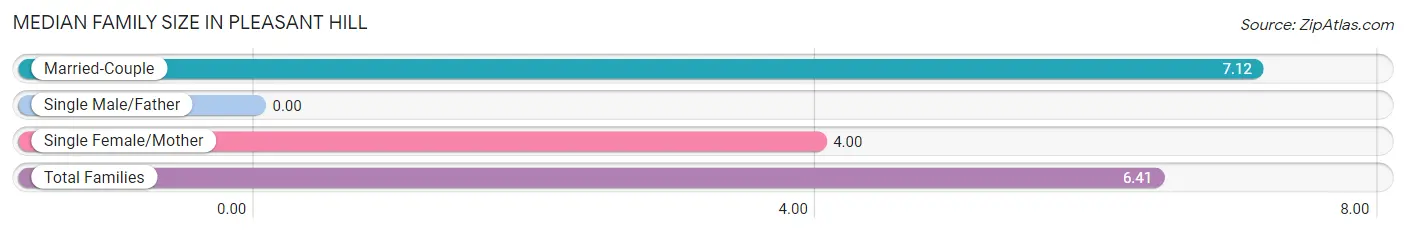
Median Family Size in Pleasant Hill
| Family Type | # Families | Family Size |
| Married-Couple | 108 (77.1%) | 7.12 |
| Single Male/Father | 0 (0.0%) | - |
| Single Female/Mother | 32 (22.9%) | 4.00 |
| Total Families | 140 (100.0%) | 6.41 |
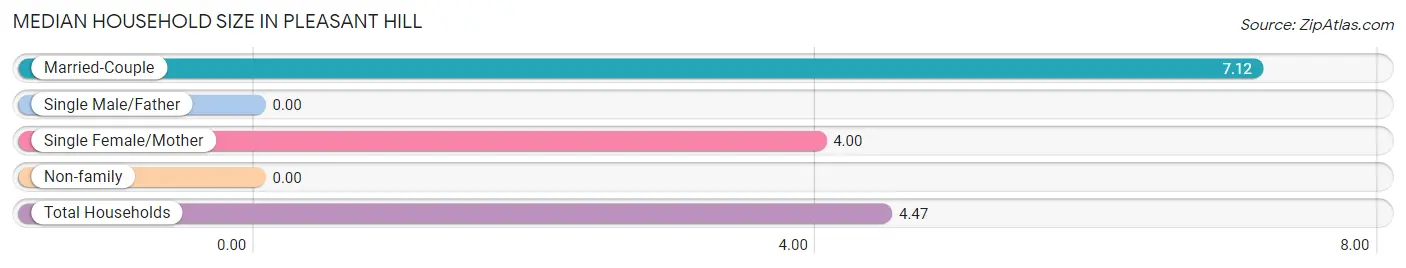
Median Household Size in Pleasant Hill
| Household Type | # Households | Household Size |
| Married-Couple | 108 (49.5%) | 7.12 |
| Single Male/Father | 0 (0.0%) | - |
| Single Female/Mother | 32 (14.7%) | 4.00 |
| Non-family | 78 (35.8%) | - |
| Total Households | 218 (100.0%) | 4.47 |
Household Size by Marriage Status in Pleasant Hill
Out of a total of 218 households in Pleasant Hill, 140 (64.2%) are family households, while 78 (35.8%) are nonfamily households. The most numerous type of family households are 2-person households, comprising 53, and the most common type of nonfamily households are 1-person households, comprising 78.
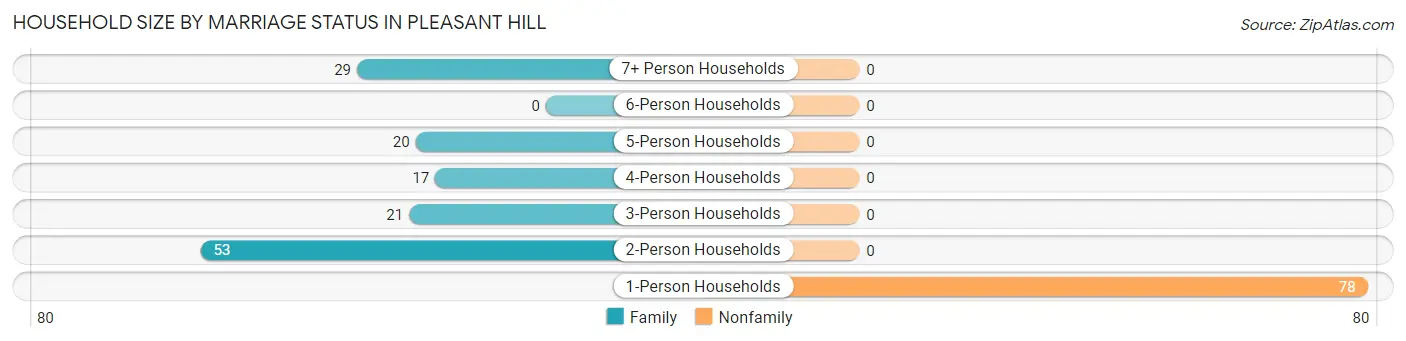
| Household Size | Family Households | Nonfamily Households |
| 1-Person Households | - | 78 (35.8%) |
| 2-Person Households | 53 (24.3%) | 0 (0.0%) |
| 3-Person Households | 21 (9.6%) | 0 (0.0%) |
| 4-Person Households | 17 (7.8%) | 0 (0.0%) |
| 5-Person Households | 20 (9.2%) | 0 (0.0%) |
| 6-Person Households | 0 (0.0%) | 0 (0.0%) |
| 7+ Person Households | 29 (13.3%) | 0 (0.0%) |
| Total | 140 (64.2%) | 78 (35.8%) |
Female Fertility in Pleasant Hill
Fertility by Age in Pleasant Hill
| Age Bracket | Women with Births | Births / 1,000 Women |
| 15 to 19 years | 0 (0.0%) | 0.0 |
| 20 to 34 years | 0 (0.0%) | 0.0 |
| 35 to 50 years | 0 (0.0%) | 0.0 |
| Total | 0 (0.0%) | 0.0 |
Fertility by Age by Marriage Status in Pleasant Hill
| Age Bracket | Married | Unmarried |
| 15 to 19 years | 0 (0.0%) | 0 (0.0%) |
| 20 to 34 years | 0 (0.0%) | 0 (0.0%) |
| 35 to 50 years | 0 (0.0%) | 0 (0.0%) |
| Total | 0 (0.0%) | 0 (0.0%) |
Fertility by Education in Pleasant Hill
| Educational Attainment | Women with Births | Births / 1,000 Women |
| Less than High School | 0 (0.0%) | 0.0 |
| High School Diploma | 0 (0.0%) | 0.0 |
| College or Associate's Degree | 0 (0.0%) | 0.0 |
| Bachelor's Degree | 0 (0.0%) | 0.0 |
| Graduate Degree | 0 (0.0%) | 0.0 |
| Total | 0 (0.0%) | 0.0 |
Fertility by Education by Marriage Status in Pleasant Hill
| Educational Attainment | Married | Unmarried |
| Less than High School | 0 (0.0%) | 0 (0.0%) |
| High School Diploma | 0 (0.0%) | 0 (0.0%) |
| College or Associate's Degree | 0 (0.0%) | 0 (0.0%) |
| Bachelor's Degree | 0 (0.0%) | 0 (0.0%) |
| Graduate Degree | 0 (0.0%) | 0 (0.0%) |
| Total | 0 (0.0%) | 0 (0.0%) |
Employment Characteristics in Pleasant Hill
Employment by Class of Employer in Pleasant Hill
Among the 431 employed individuals in Pleasant Hill, private company employees (315 | 73.1%), not-for-profit organizations (49 | 11.4%), and self-employed (not incorporated) (27 | 6.3%) make up the most common classes of employment.
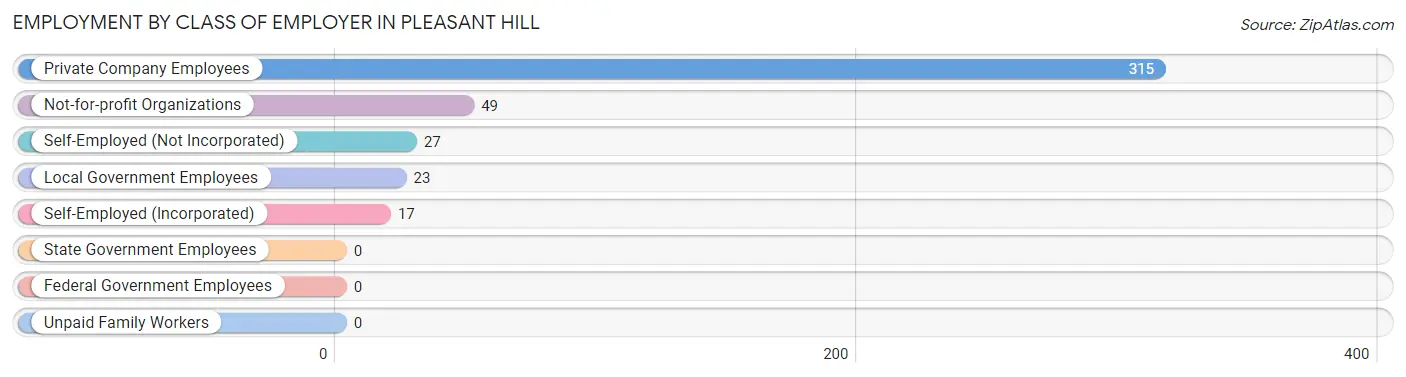
| Employer Class | # Employees | % Employees |
| Private Company Employees | 315 | 73.1% |
| Self-Employed (Incorporated) | 17 | 3.9% |
| Self-Employed (Not Incorporated) | 27 | 6.3% |
| Not-for-profit Organizations | 49 | 11.4% |
| Local Government Employees | 23 | 5.3% |
| State Government Employees | 0 | 0.0% |
| Federal Government Employees | 0 | 0.0% |
| Unpaid Family Workers | 0 | 0.0% |
| Total | 431 | 100.0% |
Employment Status by Age in Pleasant Hill
According to the labor force statistics for Pleasant Hill, out of the total population over 16 years of age (852), 62.7% or 534 individuals are in the labor force, with 19.3% or 103 of them unemployed. The age group with the highest labor force participation rate is 20 to 24 years, with 100.0% or 107 individuals in the labor force. Within the labor force, the 55 to 59 years age range has the highest percentage of unemployed individuals, with 46.2% or 18 of them being unemployed.
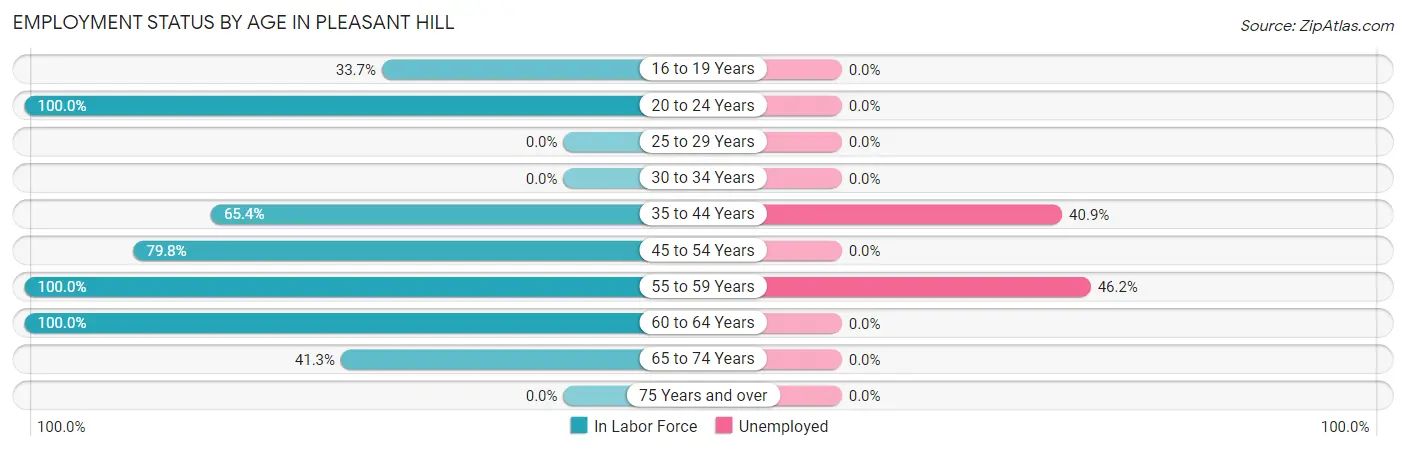
| Age Bracket | In Labor Force | Unemployed |
| 16 to 19 Years | 34 (33.7%) | 0 (0.0%) |
| 20 to 24 Years | 107 (100.0%) | 0 (0.0%) |
| 25 to 29 Years | 0 (0.0%) | 0 (0.0%) |
| 30 to 34 Years | 0 (0.0%) | 0 (0.0%) |
| 35 to 44 Years | 208 (65.4%) | 85 (40.9%) |
| 45 to 54 Years | 79 (79.8%) | 0 (0.0%) |
| 55 to 59 Years | 39 (100.0%) | 18 (46.2%) |
| 60 to 64 Years | 17 (100.0%) | 0 (0.0%) |
| 65 to 74 Years | 50 (41.3%) | 0 (0.0%) |
| 75 Years and over | 0 (0.0%) | 0 (0.0%) |
| Total | 534 (62.7%) | 103 (19.3%) |
Employment Status by Educational Attainment in Pleasant Hill
According to labor force statistics for Pleasant Hill, 72.5% of individuals (343) out of the total population between 25 and 64 years of age (473) are in the labor force, with 30.0% or 103 of them being unemployed. The group with the highest labor force participation rate are those with the educational attainment of less than high school, with 89.1% or 90 individuals in the labor force. Within the labor force, individuals with bachelor's degree or higher education have the highest percentage of unemployment, with 80.2% or 85 of them being unemployed.
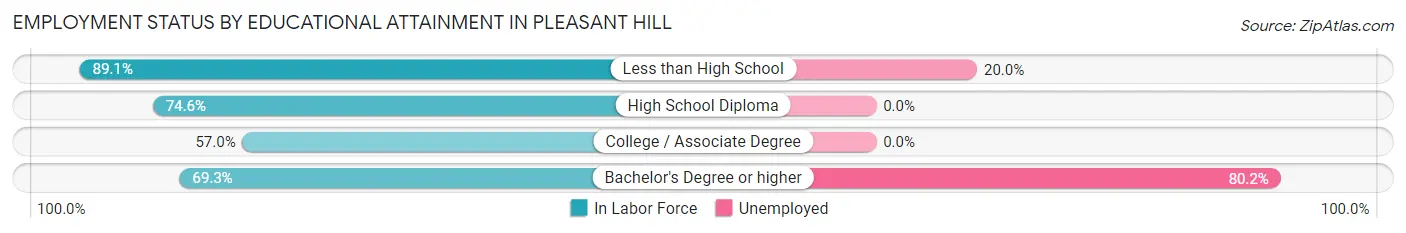
| Educational Attainment | In Labor Force | Unemployed |
| Less than High School | 90 (89.1%) | 20 (20.0%) |
| High School Diploma | 94 (74.6%) | 0 (0.0%) |
| College / Associate Degree | 53 (57.0%) | 0 (0.0%) |
| Bachelor's Degree or higher | 106 (69.3%) | 123 (80.2%) |
| Total | 343 (72.5%) | 142 (30.0%) |
Employment Occupations by Sex in Pleasant Hill
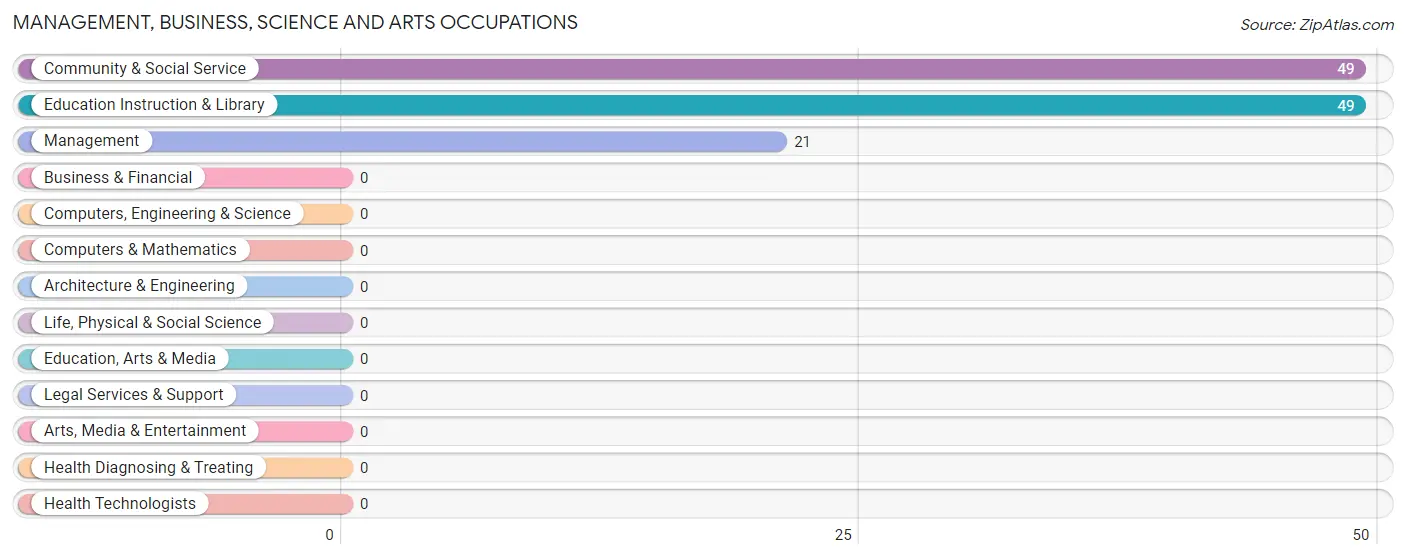
Management, Business, Science and Arts Occupations
The most common Management, Business, Science and Arts occupations in Pleasant Hill are Community & Social Service (49 | 11.4%), Education Instruction & Library (49 | 11.4%), and Management (21 | 4.9%).
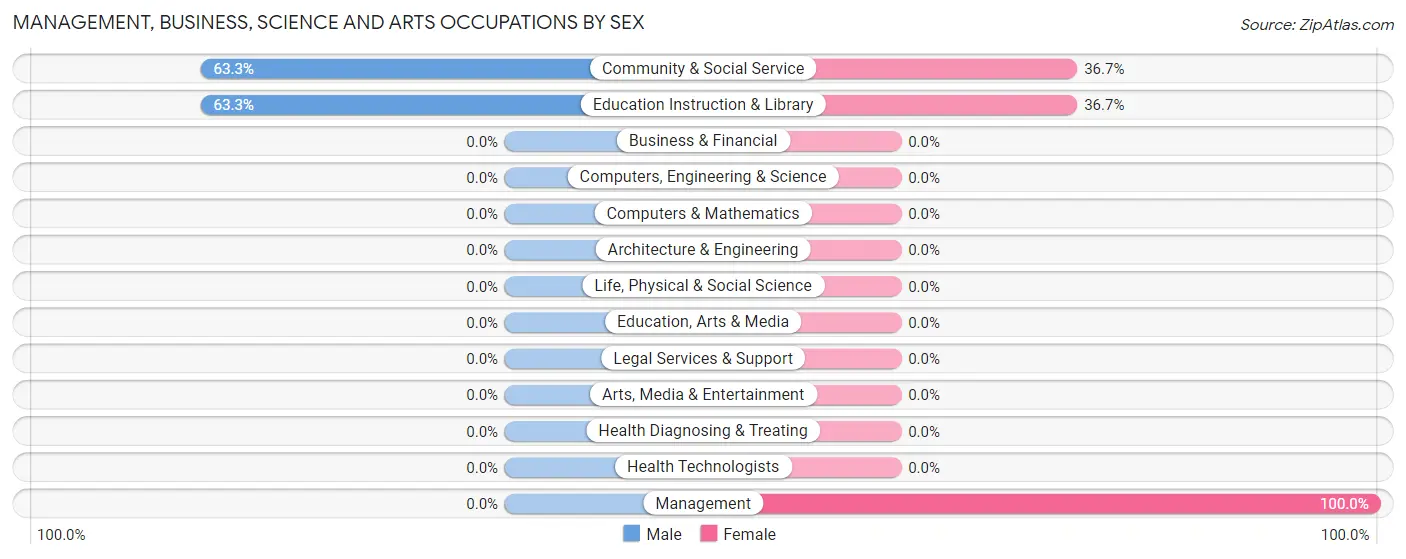
Management, Business, Science and Arts Occupations by Sex
Within the Management, Business, Science and Arts occupations in Pleasant Hill, the most male-oriented occupations are Community & Social Service (63.3%), and Education Instruction & Library (63.3%), while the most female-oriented occupations are Management (100.0%), Community & Social Service (36.7%), and Education Instruction & Library (36.7%).
| Occupation | Male | Female |
| Management | 0 (0.0%) | 21 (100.0%) |
| Business & Financial | 0 (0.0%) | 0 (0.0%) |
| Computers, Engineering & Science | 0 (0.0%) | 0 (0.0%) |
| Computers & Mathematics | 0 (0.0%) | 0 (0.0%) |
| Architecture & Engineering | 0 (0.0%) | 0 (0.0%) |
| Life, Physical & Social Science | 0 (0.0%) | 0 (0.0%) |
| Community & Social Service | 31 (63.3%) | 18 (36.7%) |
| Education, Arts & Media | 0 (0.0%) | 0 (0.0%) |
| Legal Services & Support | 0 (0.0%) | 0 (0.0%) |
| Education Instruction & Library | 31 (63.3%) | 18 (36.7%) |
| Arts, Media & Entertainment | 0 (0.0%) | 0 (0.0%) |
| Health Diagnosing & Treating | 0 (0.0%) | 0 (0.0%) |
| Health Technologists | 0 (0.0%) | 0 (0.0%) |
| Total (Category) | 31 (44.3%) | 39 (55.7%) |
| Total (Overall) | 267 (62.0%) | 164 (38.1%) |
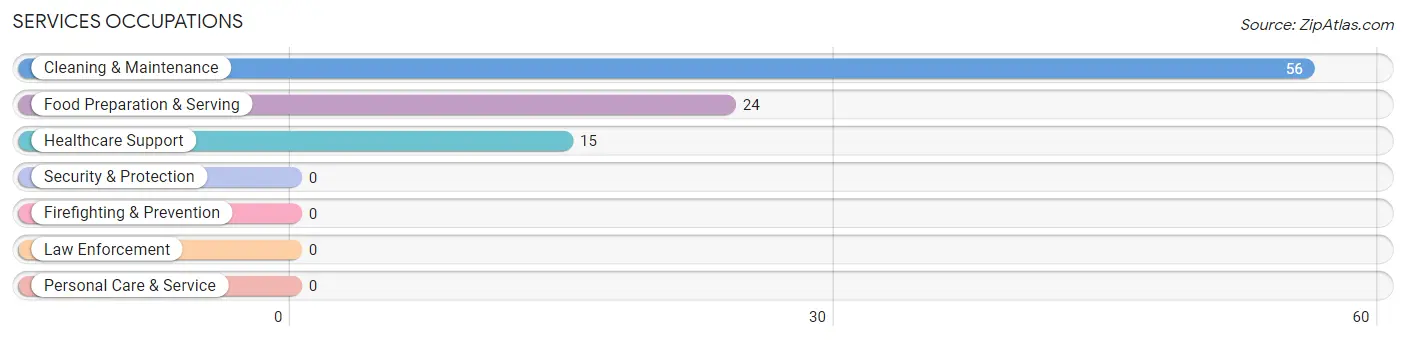
Services Occupations
The most common Services occupations in Pleasant Hill are Cleaning & Maintenance (56 | 13.0%), Food Preparation & Serving (24 | 5.6%), and Healthcare Support (15 | 3.5%).
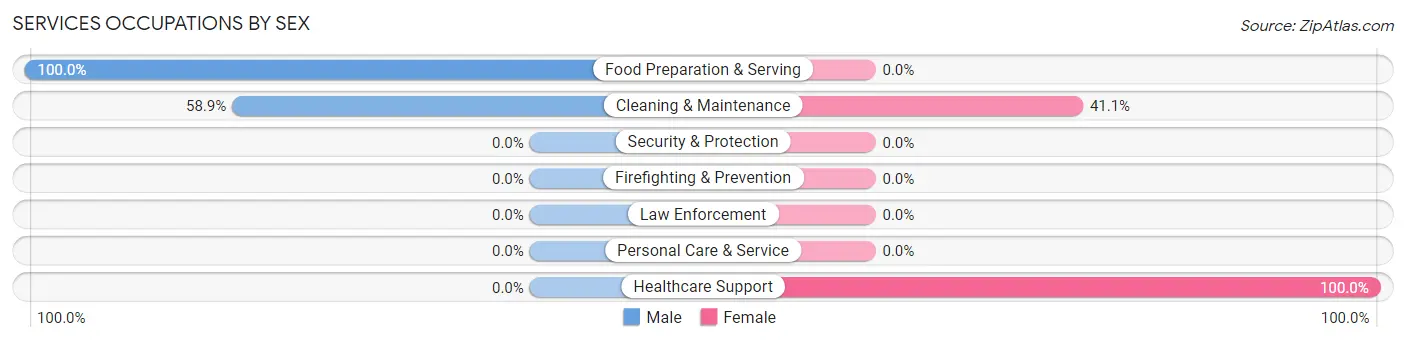
Services Occupations by Sex
Within the Services occupations in Pleasant Hill, the most male-oriented occupations are Food Preparation & Serving (100.0%), and Cleaning & Maintenance (58.9%), while the most female-oriented occupations are Healthcare Support (100.0%), and Cleaning & Maintenance (41.1%).
| Occupation | Male | Female |
| Healthcare Support | 0 (0.0%) | 15 (100.0%) |
| Security & Protection | 0 (0.0%) | 0 (0.0%) |
| Firefighting & Prevention | 0 (0.0%) | 0 (0.0%) |
| Law Enforcement | 0 (0.0%) | 0 (0.0%) |
| Food Preparation & Serving | 24 (100.0%) | 0 (0.0%) |
| Cleaning & Maintenance | 33 (58.9%) | 23 (41.1%) |
| Personal Care & Service | 0 (0.0%) | 0 (0.0%) |
| Total (Category) | 57 (60.0%) | 38 (40.0%) |
| Total (Overall) | 267 (62.0%) | 164 (38.1%) |
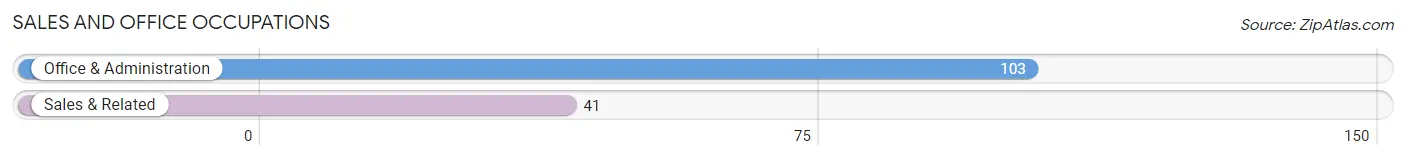
Sales and Office Occupations
The most common Sales and Office occupations in Pleasant Hill are Office & Administration (103 | 23.9%), and Sales & Related (41 | 9.5%).
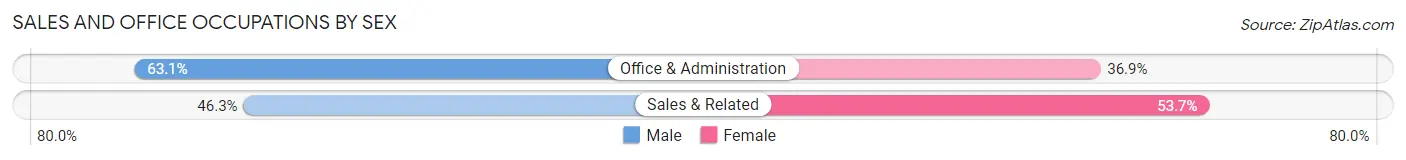
Sales and Office Occupations by Sex
| Occupation | Male | Female |
| Sales & Related | 19 (46.3%) | 22 (53.7%) |
| Office & Administration | 65 (63.1%) | 38 (36.9%) |
| Total (Category) | 84 (58.3%) | 60 (41.7%) |
| Total (Overall) | 267 (62.0%) | 164 (38.1%) |
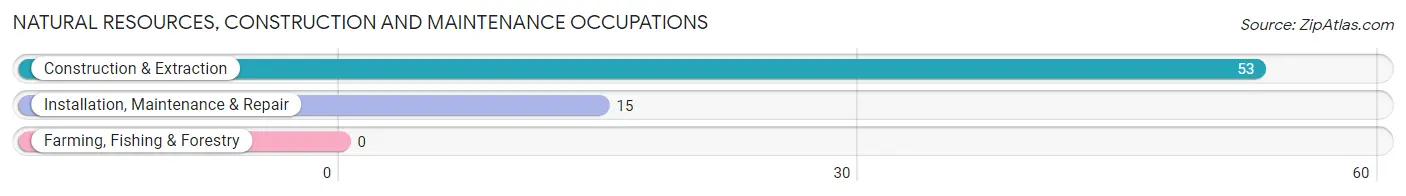
Natural Resources, Construction and Maintenance Occupations
The most common Natural Resources, Construction and Maintenance occupations in Pleasant Hill are Construction & Extraction (53 | 12.3%), and Installation, Maintenance & Repair (15 | 3.5%).
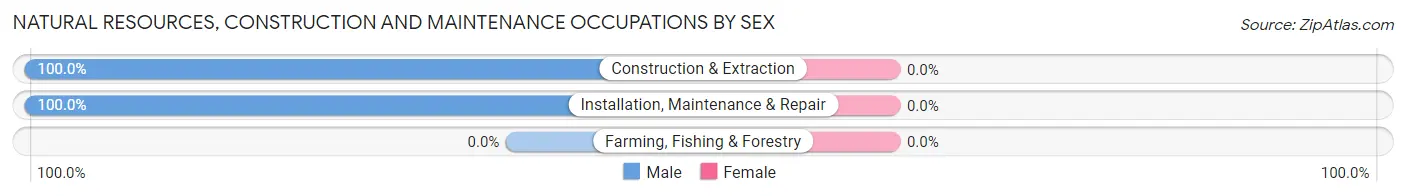
Natural Resources, Construction and Maintenance Occupations by Sex
| Occupation | Male | Female |
| Farming, Fishing & Forestry | 0 (0.0%) | 0 (0.0%) |
| Construction & Extraction | 53 (100.0%) | 0 (0.0%) |
| Installation, Maintenance & Repair | 15 (100.0%) | 0 (0.0%) |
| Total (Category) | 68 (100.0%) | 0 (0.0%) |
| Total (Overall) | 267 (62.0%) | 164 (38.1%) |
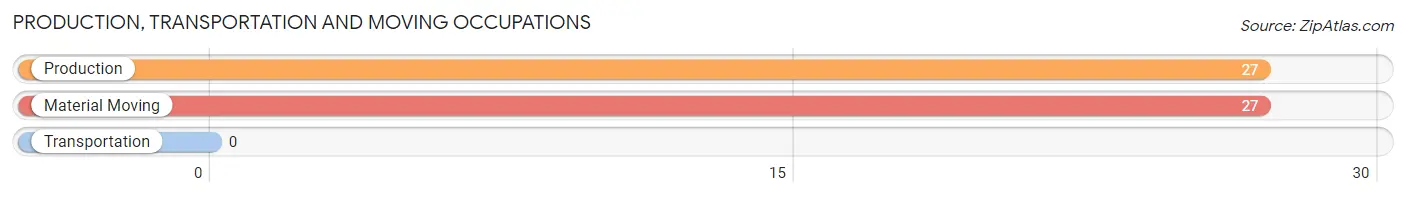
Production, Transportation and Moving Occupations
The most common Production, Transportation and Moving occupations in Pleasant Hill are Production (27 | 6.3%), and Material Moving (27 | 6.3%).
Production, Transportation and Moving Occupations by Sex
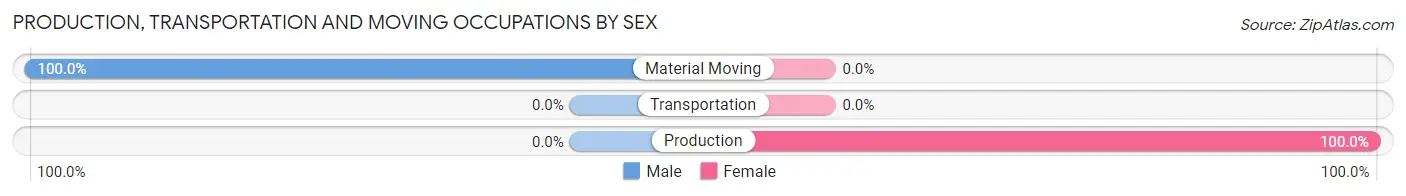
| Occupation | Male | Female |
| Production | 0 (0.0%) | 27 (100.0%) |
| Transportation | 0 (0.0%) | 0 (0.0%) |
| Material Moving | 27 (100.0%) | 0 (0.0%) |
| Total (Category) | 27 (50.0%) | 27 (50.0%) |
| Total (Overall) | 267 (62.0%) | 164 (38.1%) |
Employment Industries by Sex in Pleasant Hill
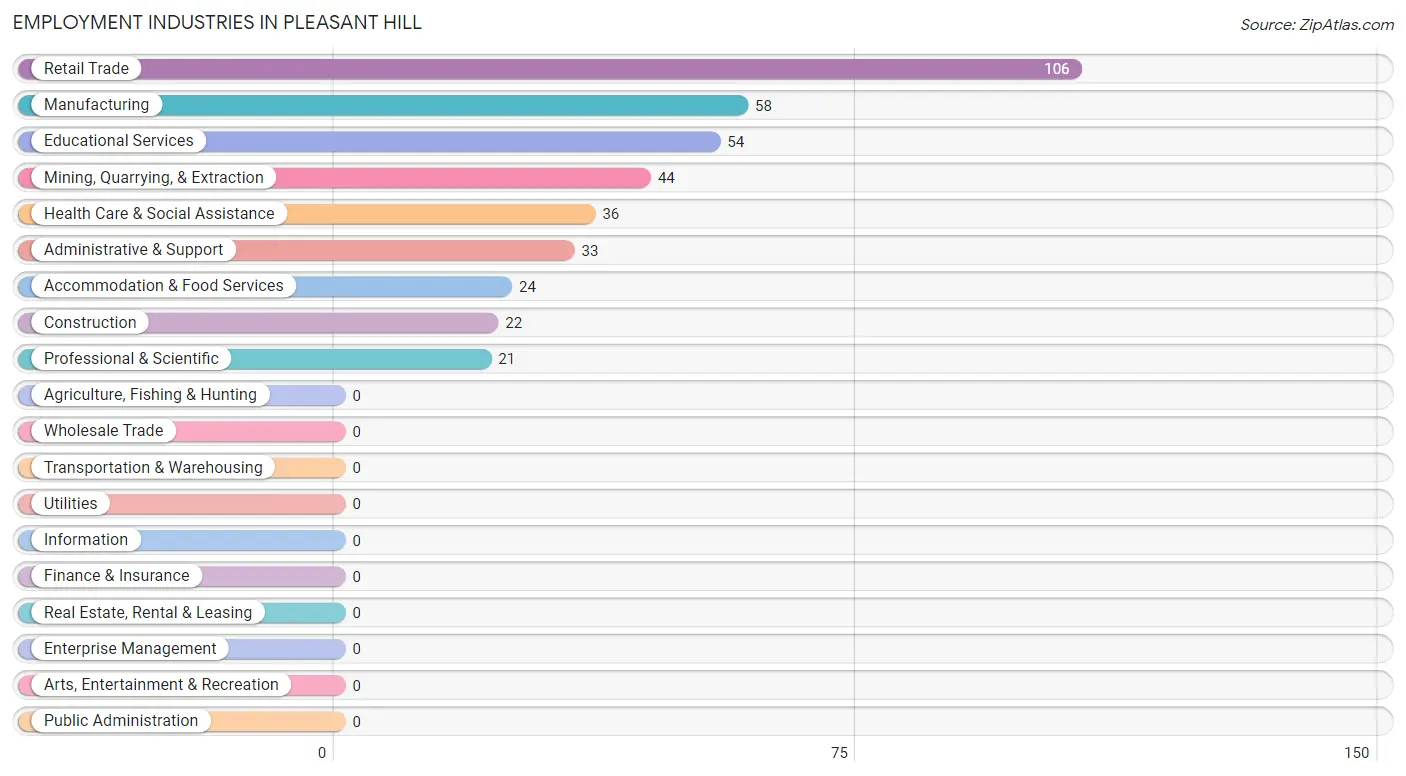
Employment Industries in Pleasant Hill
The major employment industries in Pleasant Hill include Retail Trade (106 | 24.6%), Manufacturing (58 | 13.5%), Educational Services (54 | 12.5%), Mining, Quarrying, & Extraction (44 | 10.2%), and Health Care & Social Assistance (36 | 8.4%).
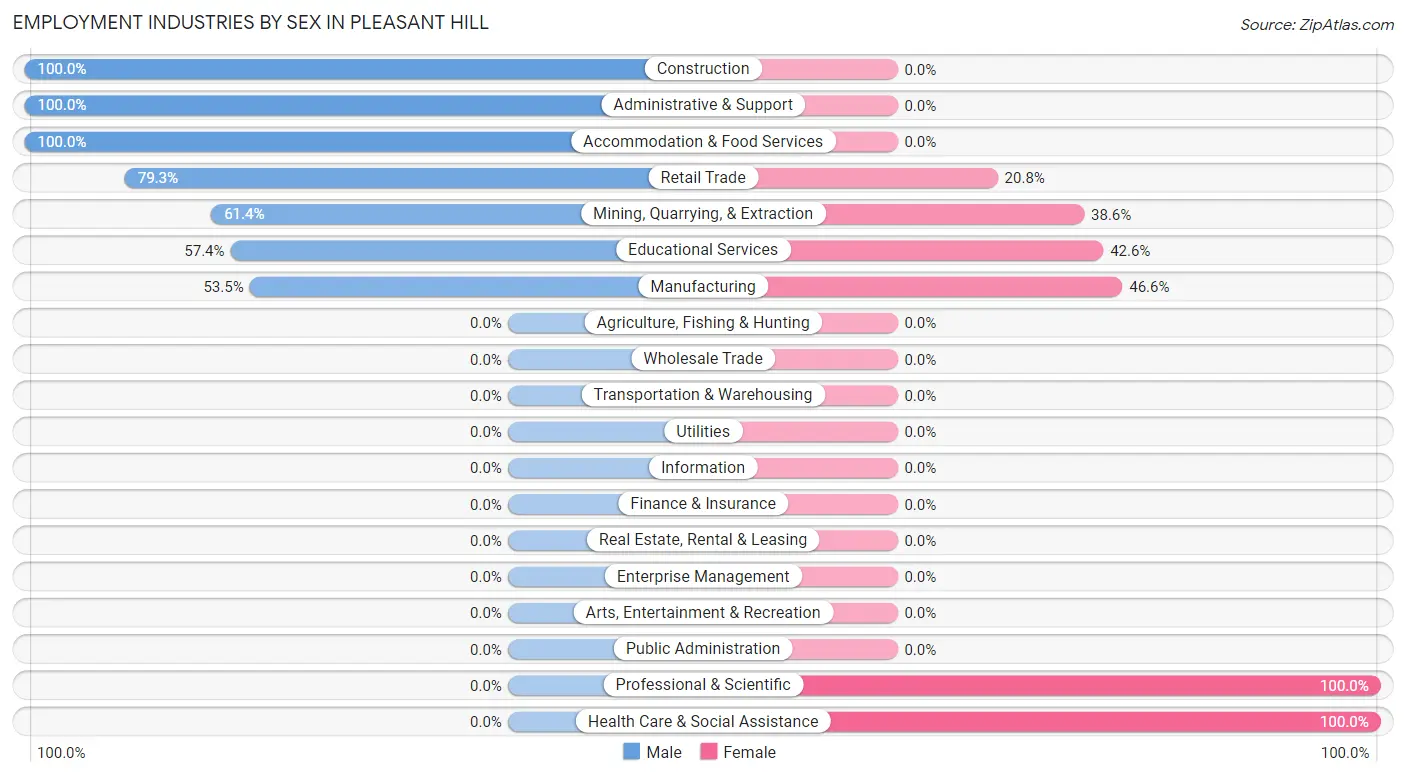
Employment Industries by Sex in Pleasant Hill
The Pleasant Hill industries that see more men than women are Construction (100.0%), Administrative & Support (100.0%), and Accommodation & Food Services (100.0%), whereas the industries that tend to have a higher number of women are Professional & Scientific (100.0%), Health Care & Social Assistance (100.0%), and Manufacturing (46.6%).
| Industry | Male | Female |
| Agriculture, Fishing & Hunting | 0 (0.0%) | 0 (0.0%) |
| Mining, Quarrying, & Extraction | 27 (61.4%) | 17 (38.6%) |
| Construction | 22 (100.0%) | 0 (0.0%) |
| Manufacturing | 31 (53.4%) | 27 (46.6%) |
| Wholesale Trade | 0 (0.0%) | 0 (0.0%) |
| Retail Trade | 84 (79.2%) | 22 (20.7%) |
| Transportation & Warehousing | 0 (0.0%) | 0 (0.0%) |
| Utilities | 0 (0.0%) | 0 (0.0%) |
| Information | 0 (0.0%) | 0 (0.0%) |
| Finance & Insurance | 0 (0.0%) | 0 (0.0%) |
| Real Estate, Rental & Leasing | 0 (0.0%) | 0 (0.0%) |
| Professional & Scientific | 0 (0.0%) | 21 (100.0%) |
| Enterprise Management | 0 (0.0%) | 0 (0.0%) |
| Administrative & Support | 33 (100.0%) | 0 (0.0%) |
| Educational Services | 31 (57.4%) | 23 (42.6%) |
| Health Care & Social Assistance | 0 (0.0%) | 36 (100.0%) |
| Arts, Entertainment & Recreation | 0 (0.0%) | 0 (0.0%) |
| Accommodation & Food Services | 24 (100.0%) | 0 (0.0%) |
| Public Administration | 0 (0.0%) | 0 (0.0%) |
| Total | 267 (62.0%) | 164 (38.1%) |
Education in Pleasant Hill
School Enrollment in Pleasant Hill
The most common levels of schooling among the 310 students in Pleasant Hill are high school (101 | 32.6%), college / undergraduate (86 | 27.7%), and middle school (71 | 22.9%).
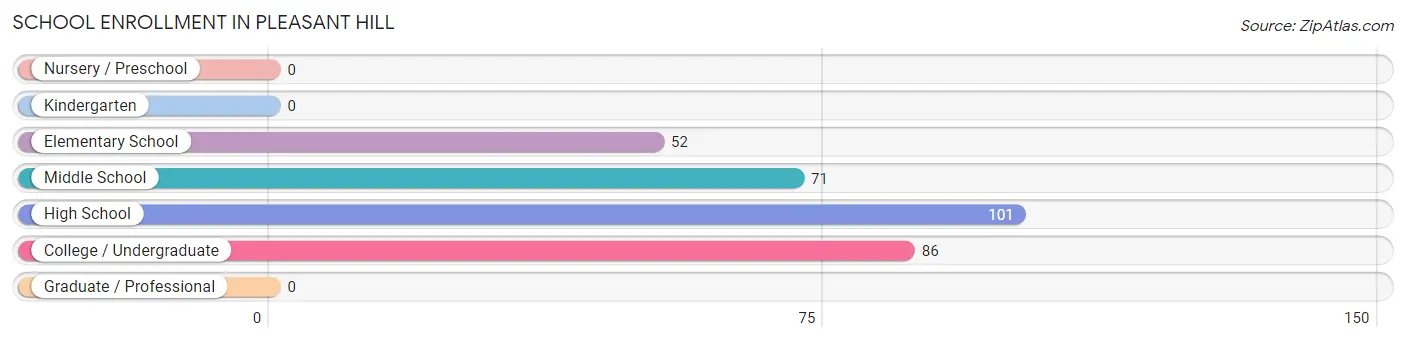
| School Level | # Students | % Students |
| Nursery / Preschool | 0 | 0.0% |
| Kindergarten | 0 | 0.0% |
| Elementary School | 52 | 16.8% |
| Middle School | 71 | 22.9% |
| High School | 101 | 32.6% |
| College / Undergraduate | 86 | 27.7% |
| Graduate / Professional | 0 | 0.0% |
| Total | 310 | 100.0% |
School Enrollment by Age by Funding Source in Pleasant Hill
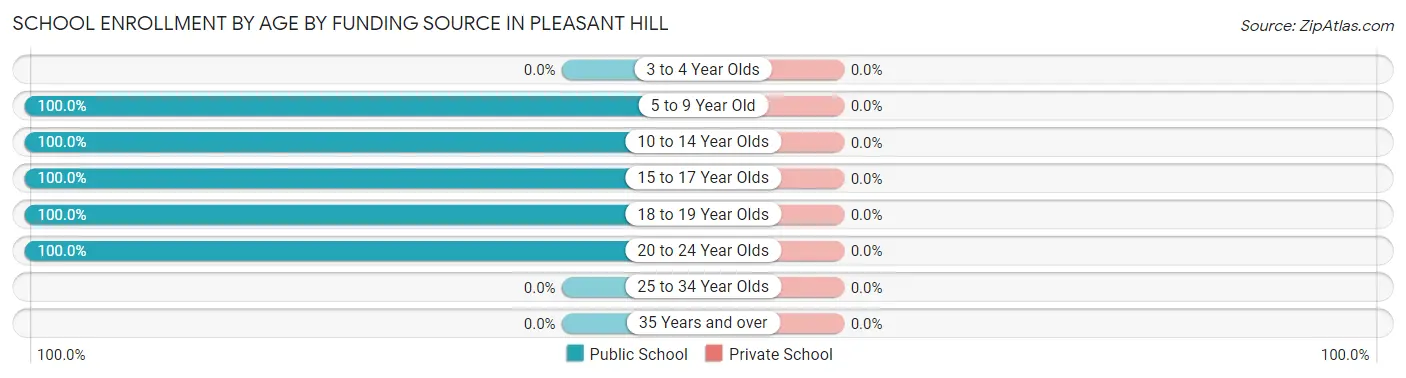
| Age Bracket | Public School | Private School |
| 3 to 4 Year Olds | 0 (0.0%) | 0 (0.0%) |
| 5 to 9 Year Old | 52 (100.0%) | 0 (0.0%) |
| 10 to 14 Year Olds | 71 (100.0%) | 0 (0.0%) |
| 15 to 17 Year Olds | 34 (100.0%) | 0 (0.0%) |
| 18 to 19 Year Olds | 67 (100.0%) | 0 (0.0%) |
| 20 to 24 Year Olds | 86 (100.0%) | 0 (0.0%) |
| 25 to 34 Year Olds | 0 (0.0%) | 0 (0.0%) |
| 35 Years and over | 0 (0.0%) | 0 (0.0%) |
| Total | 310 (100.0%) | 0 (0.0%) |
Educational Attainment by Field of Study in Pleasant Hill
Business (85 | 55.6%), computers & mathematics (47 | 30.7%), and arts & humanities (21 | 13.7%) are the most common fields of study among 153 individuals in Pleasant Hill who have obtained a bachelor's degree or higher.
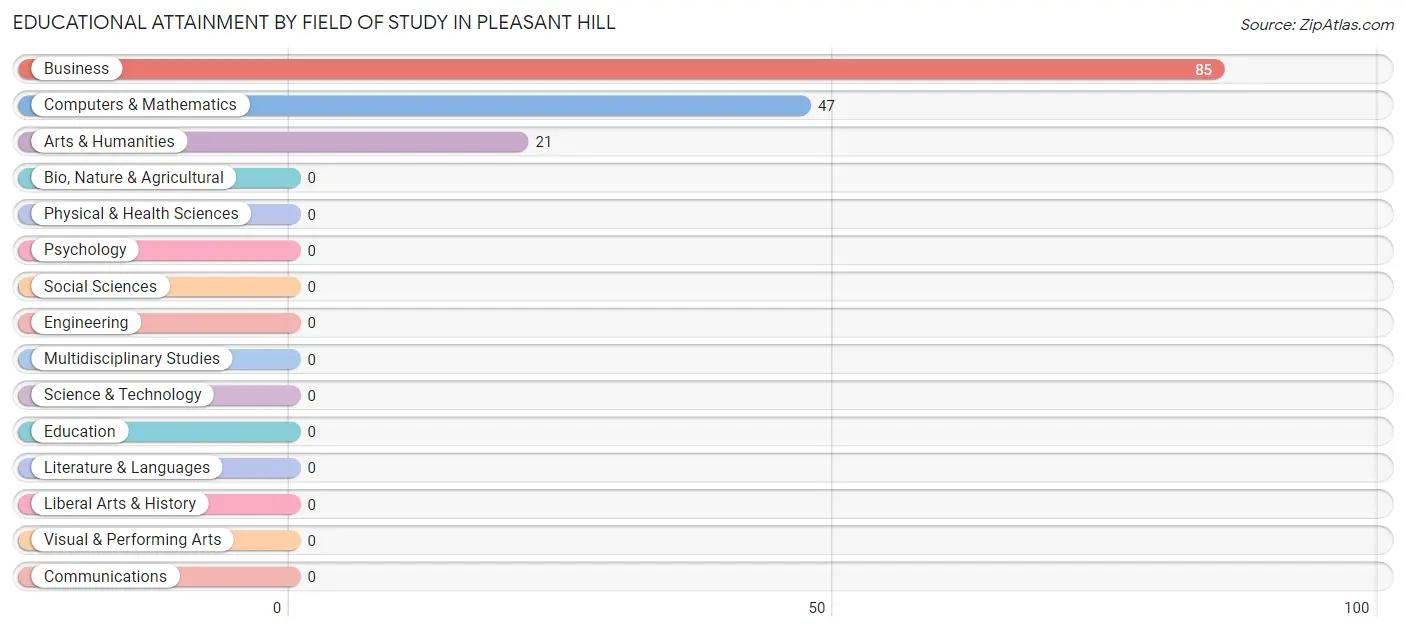
| Field of Study | # Graduates | % Graduates |
| Computers & Mathematics | 47 | 30.7% |
| Bio, Nature & Agricultural | 0 | 0.0% |
| Physical & Health Sciences | 0 | 0.0% |
| Psychology | 0 | 0.0% |
| Social Sciences | 0 | 0.0% |
| Engineering | 0 | 0.0% |
| Multidisciplinary Studies | 0 | 0.0% |
| Science & Technology | 0 | 0.0% |
| Business | 85 | 55.6% |
| Education | 0 | 0.0% |
| Literature & Languages | 0 | 0.0% |
| Liberal Arts & History | 0 | 0.0% |
| Visual & Performing Arts | 0 | 0.0% |
| Communications | 0 | 0.0% |
| Arts & Humanities | 21 | 13.7% |
| Total | 153 | 100.0% |
Transportation & Commute in Pleasant Hill
Vehicle Availability by Sex in Pleasant Hill
The most prevalent vehicle ownership categories in Pleasant Hill are males with 5 or more vehicles (77, accounting for 28.8%) and females with 5 or more vehicles (32, making up 46.9%).
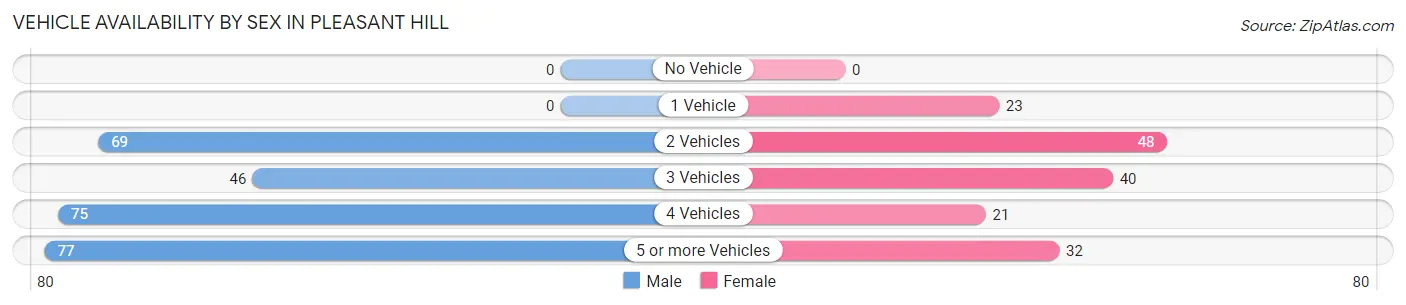
| Vehicles Available | Male | Female |
| No Vehicle | 0 (0.0%) | 0 (0.0%) |
| 1 Vehicle | 0 (0.0%) | 23 (14.0%) |
| 2 Vehicles | 69 (25.8%) | 48 (29.3%) |
| 3 Vehicles | 46 (17.2%) | 40 (24.4%) |
| 4 Vehicles | 75 (28.1%) | 21 (12.8%) |
| 5 or more Vehicles | 77 (28.8%) | 32 (19.5%) |
| Total | 267 (100.0%) | 164 (100.0%) |
Commute Time in Pleasant Hill
The most frequently occuring commute durations in Pleasant Hill are 20 to 24 minutes (82 commuters, 20.1%), 30 to 34 minutes (82 commuters, 20.1%), and 25 to 29 minutes (75 commuters, 18.4%).
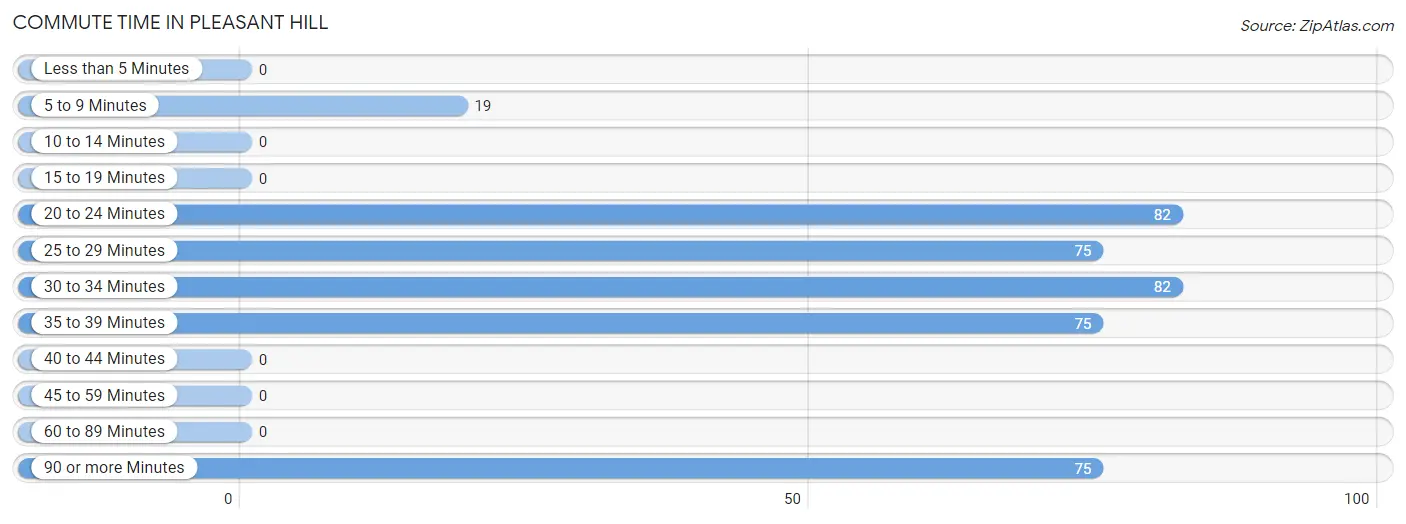
| Commute Time | # Commuters | % Commuters |
| Less than 5 Minutes | 0 | 0.0% |
| 5 to 9 Minutes | 19 | 4.7% |
| 10 to 14 Minutes | 0 | 0.0% |
| 15 to 19 Minutes | 0 | 0.0% |
| 20 to 24 Minutes | 82 | 20.1% |
| 25 to 29 Minutes | 75 | 18.4% |
| 30 to 34 Minutes | 82 | 20.1% |
| 35 to 39 Minutes | 75 | 18.4% |
| 40 to 44 Minutes | 0 | 0.0% |
| 45 to 59 Minutes | 0 | 0.0% |
| 60 to 89 Minutes | 0 | 0.0% |
| 90 or more Minutes | 75 | 18.4% |
Commute Time by Sex in Pleasant Hill
The most common commute times in Pleasant Hill are 35 to 39 minutes (75 commuters, 28.1%) for males and 30 to 34 minutes (61 commuters, 43.3%) for females.
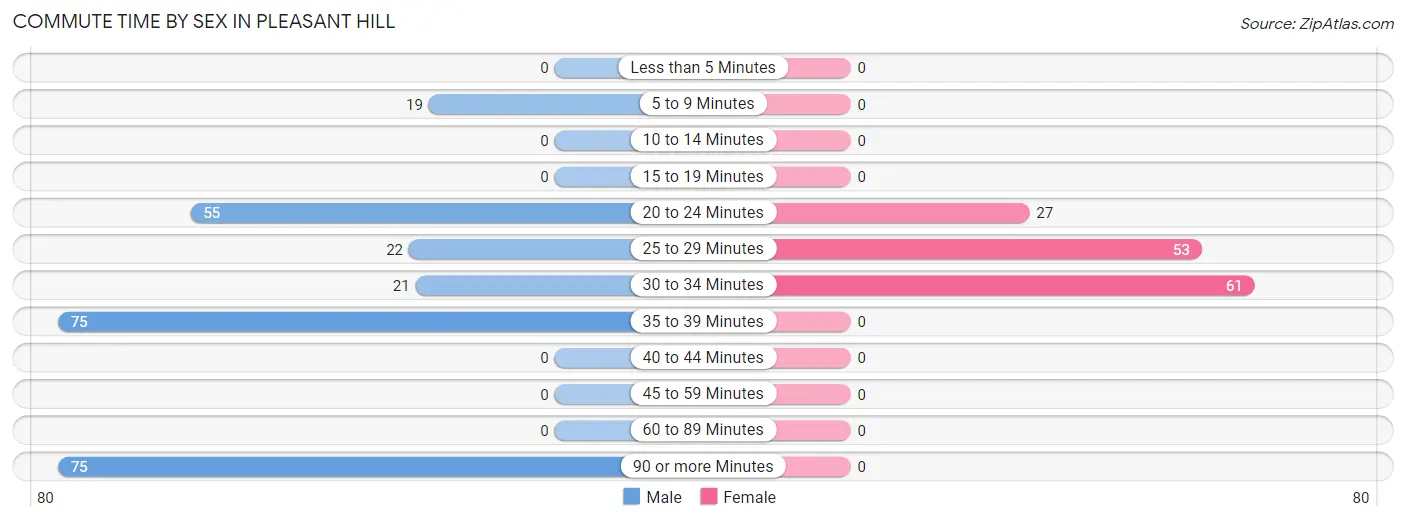
| Commute Time | Male | Female |
| Less than 5 Minutes | 0 (0.0%) | 0 (0.0%) |
| 5 to 9 Minutes | 19 (7.1%) | 0 (0.0%) |
| 10 to 14 Minutes | 0 (0.0%) | 0 (0.0%) |
| 15 to 19 Minutes | 0 (0.0%) | 0 (0.0%) |
| 20 to 24 Minutes | 55 (20.6%) | 27 (19.2%) |
| 25 to 29 Minutes | 22 (8.2%) | 53 (37.6%) |
| 30 to 34 Minutes | 21 (7.9%) | 61 (43.3%) |
| 35 to 39 Minutes | 75 (28.1%) | 0 (0.0%) |
| 40 to 44 Minutes | 0 (0.0%) | 0 (0.0%) |
| 45 to 59 Minutes | 0 (0.0%) | 0 (0.0%) |
| 60 to 89 Minutes | 0 (0.0%) | 0 (0.0%) |
| 90 or more Minutes | 75 (28.1%) | 0 (0.0%) |
Time of Departure to Work by Sex in Pleasant Hill
The most frequent times of departure to work in Pleasant Hill are 8:30 AM to 8:59 AM (75, 28.1%) for males and 7:30 AM to 7:59 AM (58, 41.1%) for females.
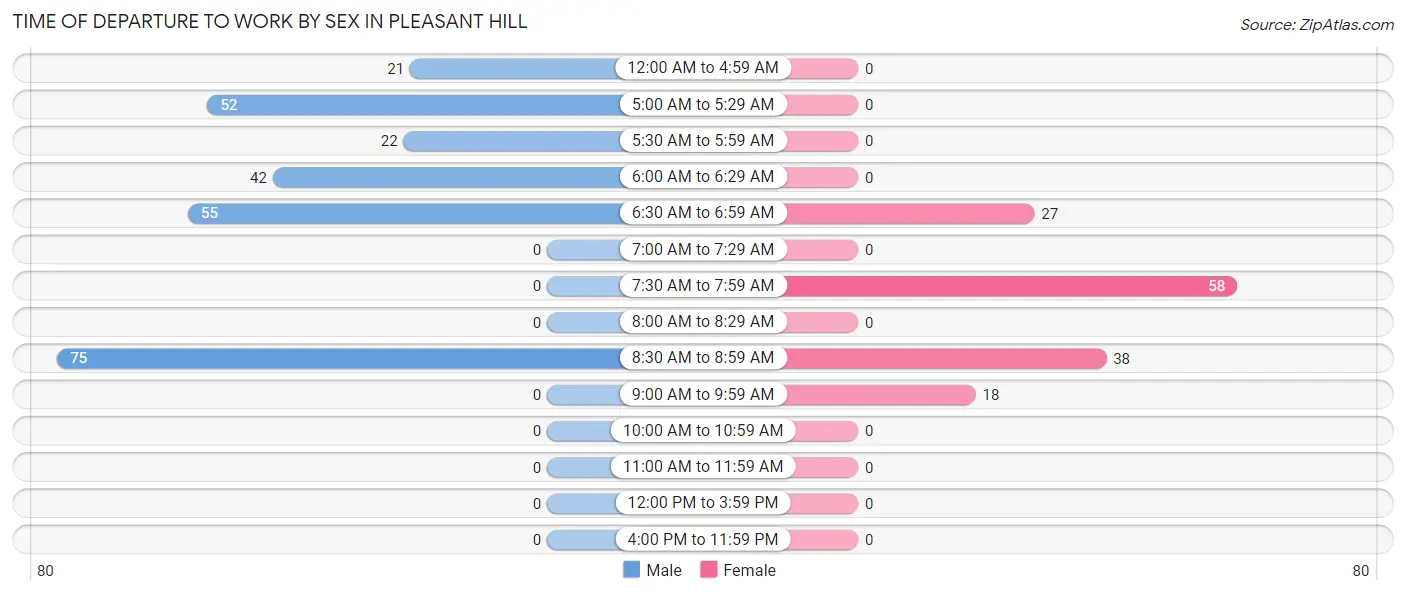
| Time of Departure | Male | Female |
| 12:00 AM to 4:59 AM | 21 (7.9%) | 0 (0.0%) |
| 5:00 AM to 5:29 AM | 52 (19.5%) | 0 (0.0%) |
| 5:30 AM to 5:59 AM | 22 (8.2%) | 0 (0.0%) |
| 6:00 AM to 6:29 AM | 42 (15.7%) | 0 (0.0%) |
| 6:30 AM to 6:59 AM | 55 (20.6%) | 27 (19.2%) |
| 7:00 AM to 7:29 AM | 0 (0.0%) | 0 (0.0%) |
| 7:30 AM to 7:59 AM | 0 (0.0%) | 58 (41.1%) |
| 8:00 AM to 8:29 AM | 0 (0.0%) | 0 (0.0%) |
| 8:30 AM to 8:59 AM | 75 (28.1%) | 38 (27.0%) |
| 9:00 AM to 9:59 AM | 0 (0.0%) | 18 (12.8%) |
| 10:00 AM to 10:59 AM | 0 (0.0%) | 0 (0.0%) |
| 11:00 AM to 11:59 AM | 0 (0.0%) | 0 (0.0%) |
| 12:00 PM to 3:59 PM | 0 (0.0%) | 0 (0.0%) |
| 4:00 PM to 11:59 PM | 0 (0.0%) | 0 (0.0%) |
| Total | 267 (100.0%) | 141 (100.0%) |
Housing Occupancy in Pleasant Hill
Occupancy by Ownership in Pleasant Hill
Of the total 218 dwellings in Pleasant Hill, owner-occupied units account for 218 (100.0%), while renter-occupied units make up 0 (0.0%).
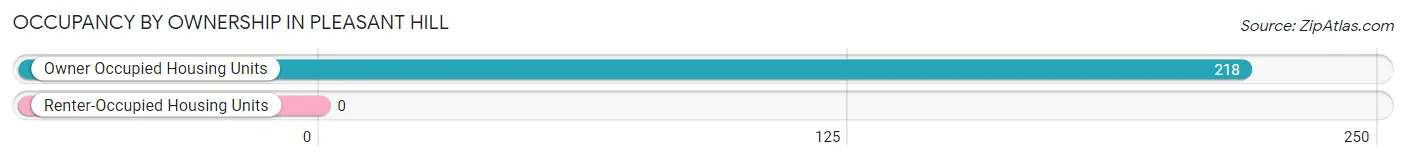
| Occupancy | # Housing Units | % Housing Units |
| Owner Occupied Housing Units | 218 | 100.0% |
| Renter-Occupied Housing Units | 0 | 0.0% |
| Total Occupied Housing Units | 218 | 100.0% |
Occupancy by Household Size in Pleasant Hill
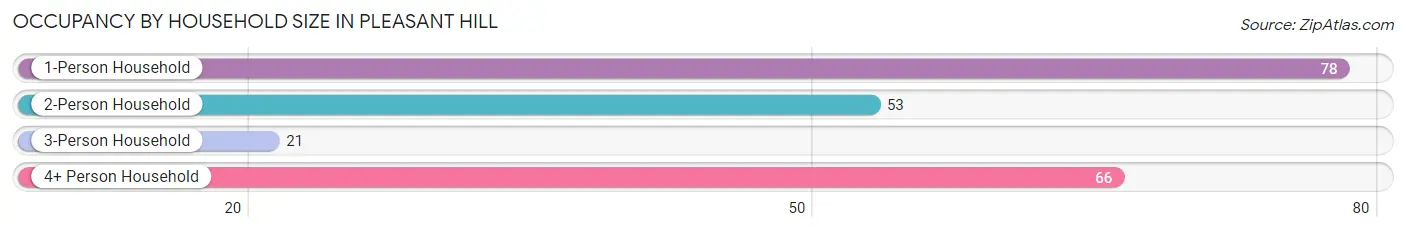
| Household Size | # Housing Units | % Housing Units |
| 1-Person Household | 78 | 35.8% |
| 2-Person Household | 53 | 24.3% |
| 3-Person Household | 21 | 9.6% |
| 4+ Person Household | 66 | 30.3% |
| Total Housing Units | 218 | 100.0% |
Occupancy by Ownership by Household Size in Pleasant Hill
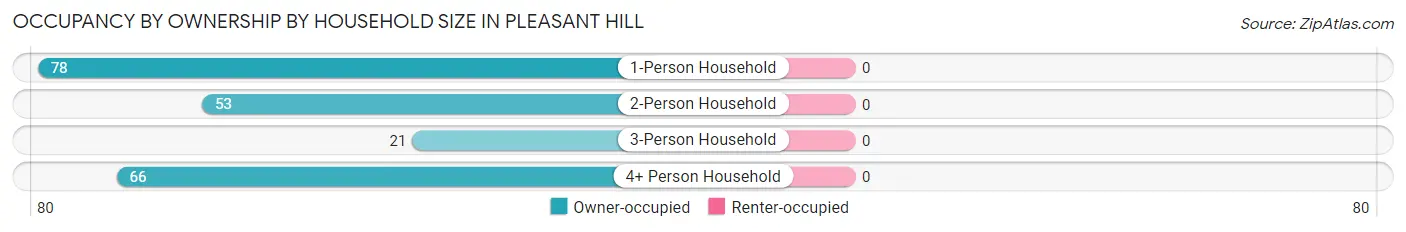
| Household Size | Owner-occupied | Renter-occupied |
| 1-Person Household | 78 (100.0%) | 0 (0.0%) |
| 2-Person Household | 53 (100.0%) | 0 (0.0%) |
| 3-Person Household | 21 (100.0%) | 0 (0.0%) |
| 4+ Person Household | 66 (100.0%) | 0 (0.0%) |
| Total Housing Units | 218 (100.0%) | 0 (0.0%) |
Occupancy by Educational Attainment in Pleasant Hill
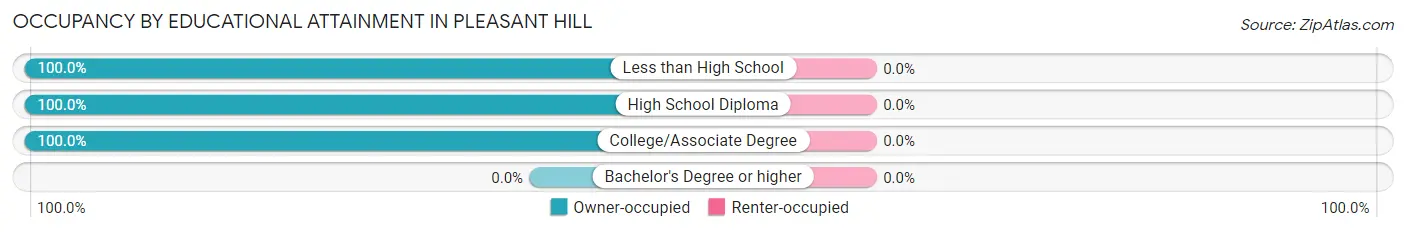
| Household Size | Owner-occupied | Renter-occupied |
| Less than High School | 59 (100.0%) | 0 (0.0%) |
| High School Diploma | 79 (100.0%) | 0 (0.0%) |
| College/Associate Degree | 80 (100.0%) | 0 (0.0%) |
| Bachelor's Degree or higher | 0 (0.0%) | 0 (0.0%) |
Occupancy by Age of Householder in Pleasant Hill
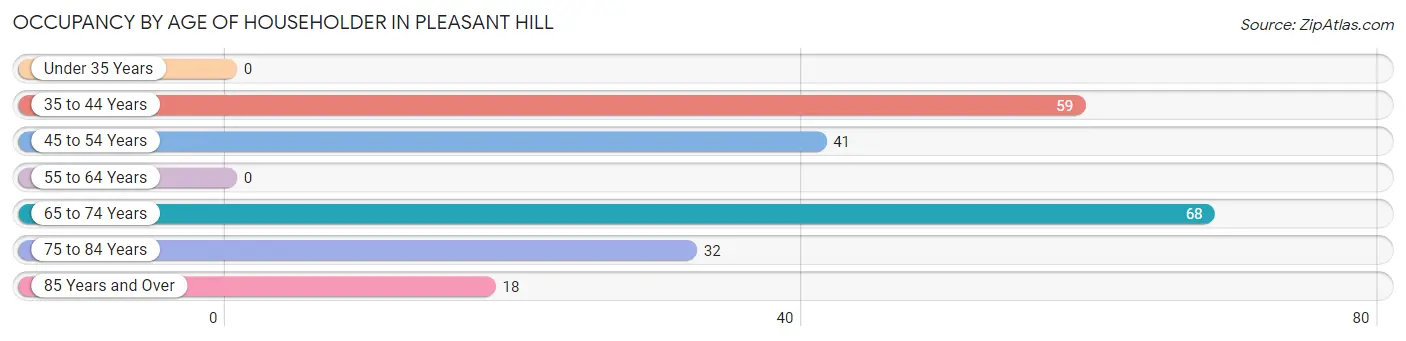
| Age Bracket | # Households | % Households |
| Under 35 Years | 0 | 0.0% |
| 35 to 44 Years | 59 | 27.1% |
| 45 to 54 Years | 41 | 18.8% |
| 55 to 64 Years | 0 | 0.0% |
| 65 to 74 Years | 68 | 31.2% |
| 75 to 84 Years | 32 | 14.7% |
| 85 Years and Over | 18 | 8.3% |
| Total | 218 | 100.0% |
Housing Finances in Pleasant Hill
Median Income by Occupancy in Pleasant Hill
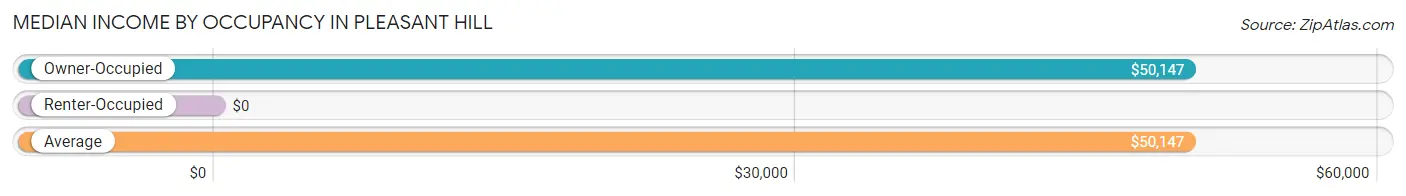
| Occupancy Type | # Households | Median Income |
| Owner-Occupied | 218 (100.0%) | $50,147 |
| Renter-Occupied | 0 (0.0%) | $0 |
| Average | 218 (100.0%) | $50,147 |
Occupancy by Householder Income Bracket in Pleasant Hill
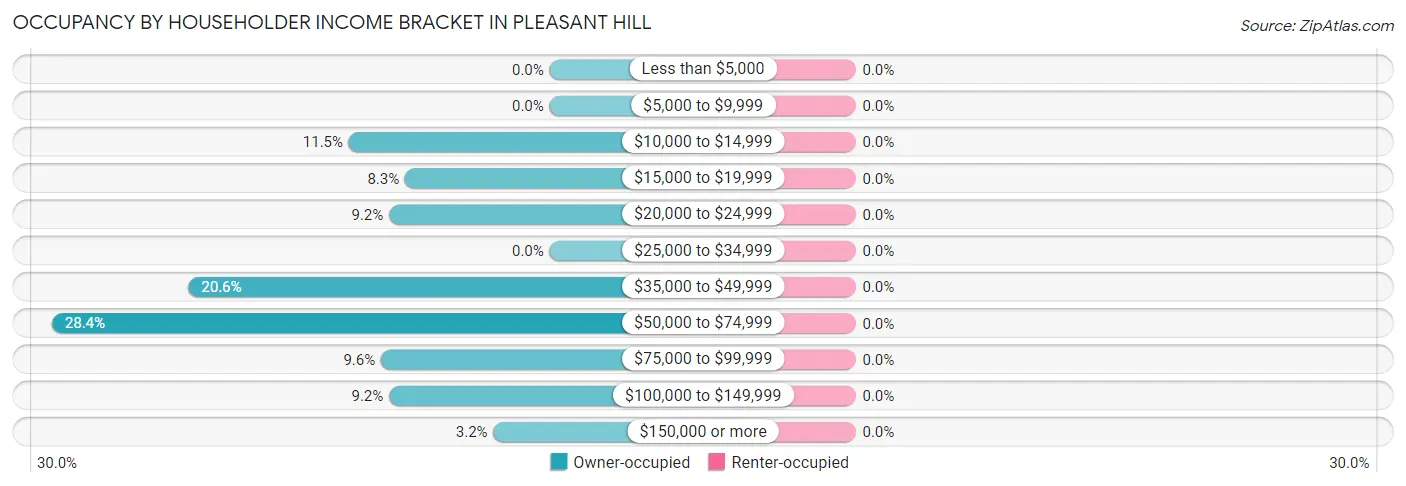
| Income Bracket | Owner-occupied | Renter-occupied |
| Less than $5,000 | 0 (0.0%) | 0 (0.0%) |
| $5,000 to $9,999 | 0 (0.0%) | 0 (0.0%) |
| $10,000 to $14,999 | 25 (11.5%) | 0 (0.0%) |
| $15,000 to $19,999 | 18 (8.3%) | 0 (0.0%) |
| $20,000 to $24,999 | 20 (9.2%) | 0 (0.0%) |
| $25,000 to $34,999 | 0 (0.0%) | 0 (0.0%) |
| $35,000 to $49,999 | 45 (20.6%) | 0 (0.0%) |
| $50,000 to $74,999 | 62 (28.4%) | 0 (0.0%) |
| $75,000 to $99,999 | 21 (9.6%) | 0 (0.0%) |
| $100,000 to $149,999 | 20 (9.2%) | 0 (0.0%) |
| $150,000 or more | 7 (3.2%) | 0 (0.0%) |
| Total | 218 (100.0%) | 0 (0.0%) |
Monthly Housing Cost Tiers in Pleasant Hill
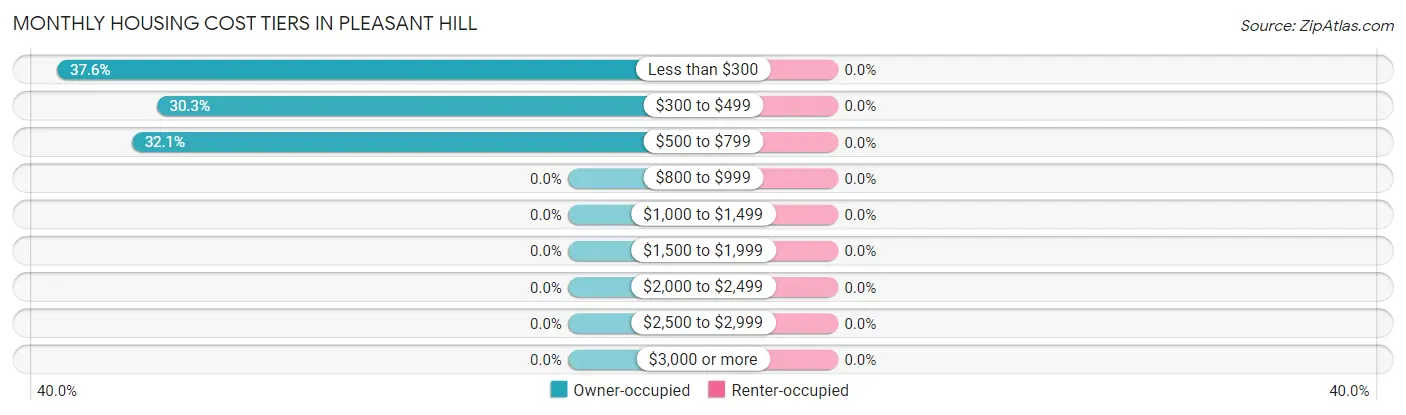
| Monthly Cost | Owner-occupied | Renter-occupied |
| Less than $300 | 82 (37.6%) | 0 (0.0%) |
| $300 to $499 | 66 (30.3%) | 0 (0.0%) |
| $500 to $799 | 70 (32.1%) | 0 (0.0%) |
| $800 to $999 | 0 (0.0%) | 0 (0.0%) |
| $1,000 to $1,499 | 0 (0.0%) | 0 (0.0%) |
| $1,500 to $1,999 | 0 (0.0%) | 0 (0.0%) |
| $2,000 to $2,499 | 0 (0.0%) | 0 (0.0%) |
| $2,500 to $2,999 | 0 (0.0%) | 0 (0.0%) |
| $3,000 or more | 0 (0.0%) | 0 (0.0%) |
| Total | 218 (100.0%) | 0 (0.0%) |
Physical Housing Characteristics in Pleasant Hill
Housing Structures in Pleasant Hill
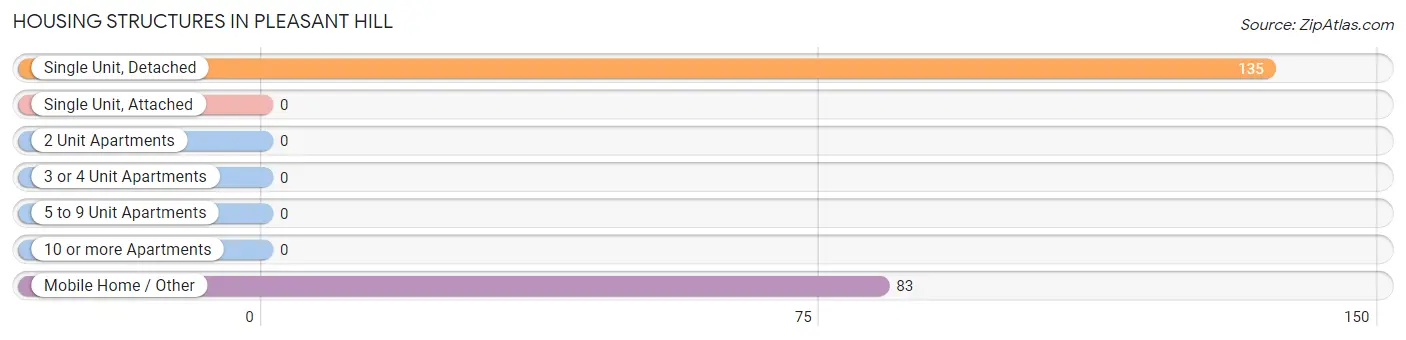
| Structure Type | # Housing Units | % Housing Units |
| Single Unit, Detached | 135 | 61.9% |
| Single Unit, Attached | 0 | 0.0% |
| 2 Unit Apartments | 0 | 0.0% |
| 3 or 4 Unit Apartments | 0 | 0.0% |
| 5 to 9 Unit Apartments | 0 | 0.0% |
| 10 or more Apartments | 0 | 0.0% |
| Mobile Home / Other | 83 | 38.1% |
| Total | 218 | 100.0% |
Housing Structures by Occupancy in Pleasant Hill
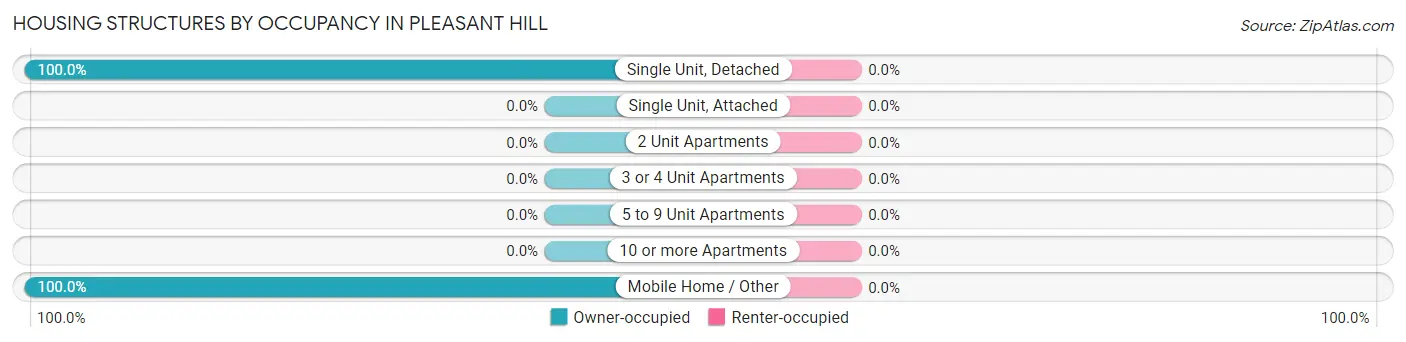
| Structure Type | Owner-occupied | Renter-occupied |
| Single Unit, Detached | 135 (100.0%) | 0 (0.0%) |
| Single Unit, Attached | 0 (0.0%) | 0 (0.0%) |
| 2 Unit Apartments | 0 (0.0%) | 0 (0.0%) |
| 3 or 4 Unit Apartments | 0 (0.0%) | 0 (0.0%) |
| 5 to 9 Unit Apartments | 0 (0.0%) | 0 (0.0%) |
| 10 or more Apartments | 0 (0.0%) | 0 (0.0%) |
| Mobile Home / Other | 83 (100.0%) | 0 (0.0%) |
| Total | 218 (100.0%) | 0 (0.0%) |
Housing Structures by Number of Rooms in Pleasant Hill
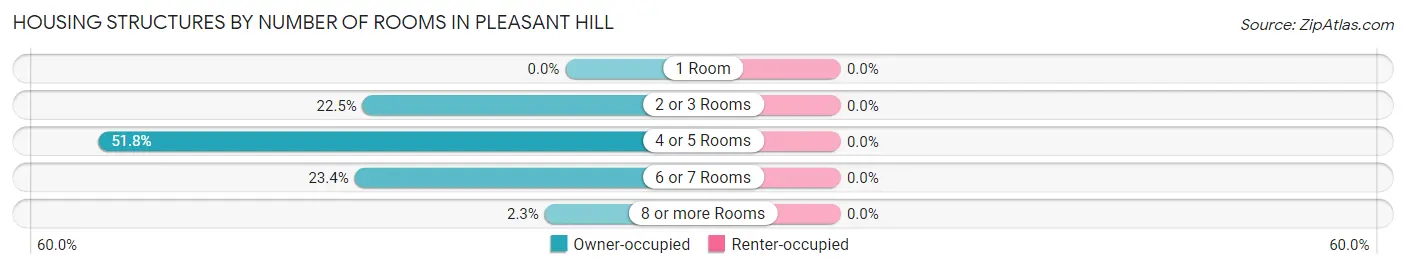
| Number of Rooms | Owner-occupied | Renter-occupied |
| 1 Room | 0 (0.0%) | 0 (0.0%) |
| 2 or 3 Rooms | 49 (22.5%) | 0 (0.0%) |
| 4 or 5 Rooms | 113 (51.8%) | 0 (0.0%) |
| 6 or 7 Rooms | 51 (23.4%) | 0 (0.0%) |
| 8 or more Rooms | 5 (2.3%) | 0 (0.0%) |
| Total | 218 (100.0%) | 0 (0.0%) |
Housing Structure by Heating Type in Pleasant Hill
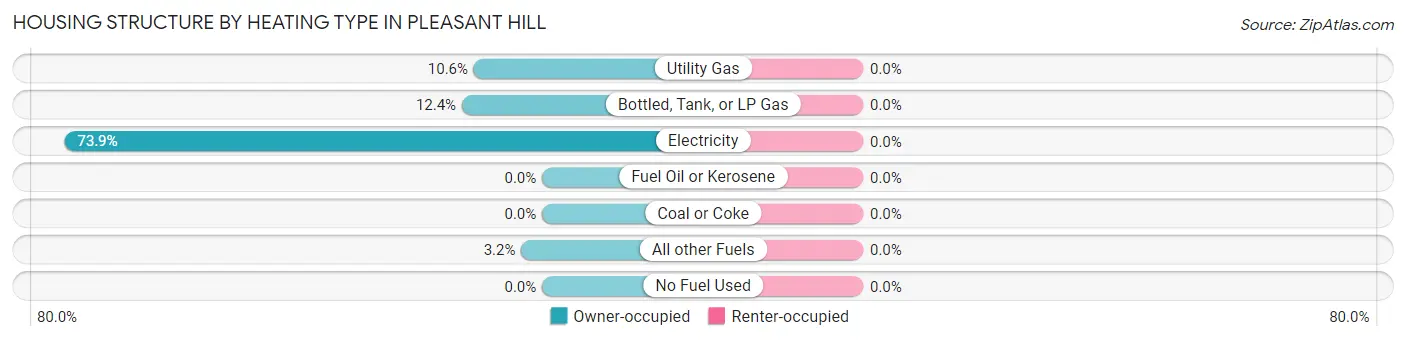
| Heating Type | Owner-occupied | Renter-occupied |
| Utility Gas | 23 (10.5%) | 0 (0.0%) |
| Bottled, Tank, or LP Gas | 27 (12.4%) | 0 (0.0%) |
| Electricity | 161 (73.9%) | 0 (0.0%) |
| Fuel Oil or Kerosene | 0 (0.0%) | 0 (0.0%) |
| Coal or Coke | 0 (0.0%) | 0 (0.0%) |
| All other Fuels | 7 (3.2%) | 0 (0.0%) |
| No Fuel Used | 0 (0.0%) | 0 (0.0%) |
| Total | 218 (100.0%) | 0 (0.0%) |
Household Vehicle Usage in Pleasant Hill
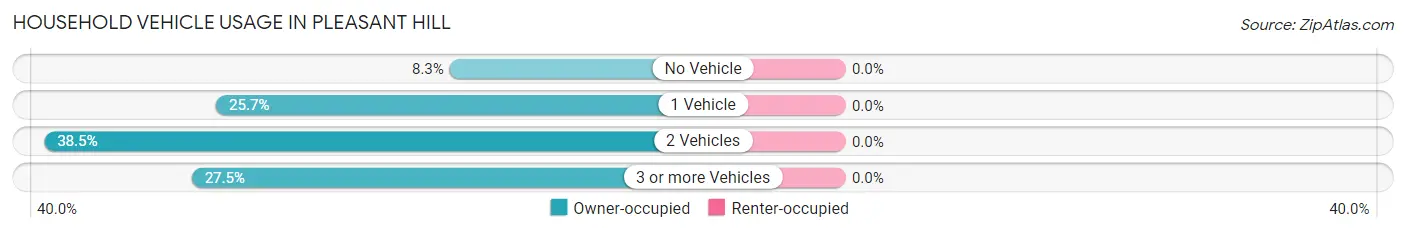
| Vehicles per Household | Owner-occupied | Renter-occupied |
| No Vehicle | 18 (8.3%) | 0 (0.0%) |
| 1 Vehicle | 56 (25.7%) | 0 (0.0%) |
| 2 Vehicles | 84 (38.5%) | 0 (0.0%) |
| 3 or more Vehicles | 60 (27.5%) | 0 (0.0%) |
| Total | 218 (100.0%) | 0 (0.0%) |
Real Estate & Mortgages in Pleasant Hill
Real Estate and Mortgage Overview in Pleasant Hill
| Characteristic | Without Mortgage | With Mortgage |
| Housing Units | 198 | 20 |
| Median Property Value | $75,600 | $0 |
| Median Household Income | $51,618 | $0 |
| Monthly Housing Costs | $329 | $0 |
| Real Estate Taxes | $795 | $0 |
Property Value by Mortgage Status in Pleasant Hill
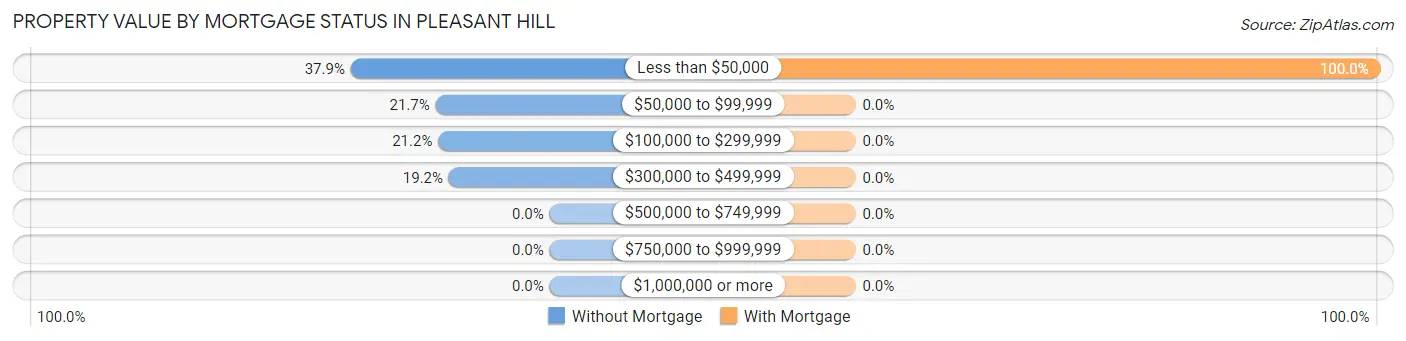
| Property Value | Without Mortgage | With Mortgage |
| Less than $50,000 | 75 (37.9%) | 20 (100.0%) |
| $50,000 to $99,999 | 43 (21.7%) | 0 (0.0%) |
| $100,000 to $299,999 | 42 (21.2%) | 0 (0.0%) |
| $300,000 to $499,999 | 38 (19.2%) | 0 (0.0%) |
| $500,000 to $749,999 | 0 (0.0%) | 0 (0.0%) |
| $750,000 to $999,999 | 0 (0.0%) | 0 (0.0%) |
| $1,000,000 or more | 0 (0.0%) | 0 (0.0%) |
| Total | 198 (100.0%) | 20 (100.0%) |
Household Income by Mortgage Status in Pleasant Hill
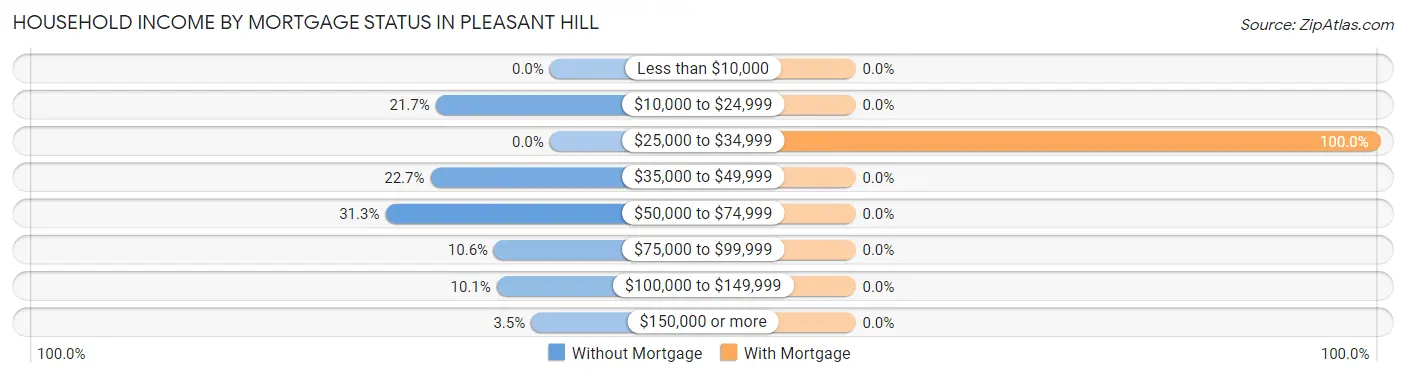
| Household Income | Without Mortgage | With Mortgage |
| Less than $10,000 | 0 (0.0%) | 0 (0.0%) |
| $10,000 to $24,999 | 43 (21.7%) | 0 (0.0%) |
| $25,000 to $34,999 | 0 (0.0%) | 20 (100.0%) |
| $35,000 to $49,999 | 45 (22.7%) | 0 (0.0%) |
| $50,000 to $74,999 | 62 (31.3%) | 0 (0.0%) |
| $75,000 to $99,999 | 21 (10.6%) | 0 (0.0%) |
| $100,000 to $149,999 | 20 (10.1%) | 0 (0.0%) |
| $150,000 or more | 7 (3.5%) | 0 (0.0%) |
| Total | 198 (100.0%) | 20 (100.0%) |
Property Value to Household Income Ratio in Pleasant Hill
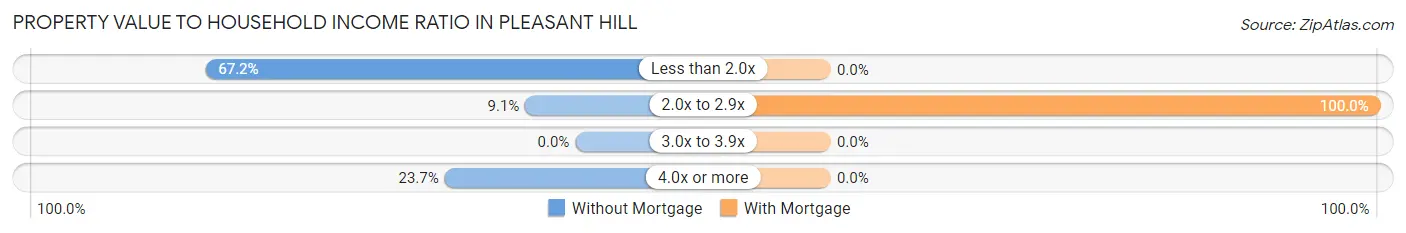
| Value-to-Income Ratio | Without Mortgage | With Mortgage |
| Less than 2.0x | 133 (67.2%) | 0 (0.0%) |
| 2.0x to 2.9x | 18 (9.1%) | 20 (100.0%) |
| 3.0x to 3.9x | 0 (0.0%) | 0 (0.0%) |
| 4.0x or more | 47 (23.7%) | 0 (0.0%) |
| Total | 198 (100.0%) | 20 (100.0%) |
Real Estate Taxes by Mortgage Status in Pleasant Hill
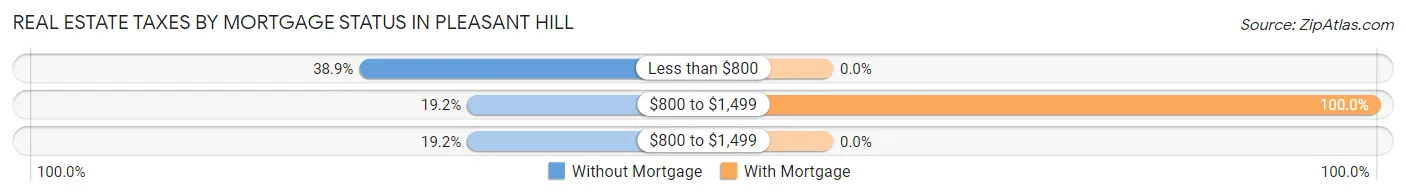
| Property Taxes | Without Mortgage | With Mortgage |
| Less than $800 | 77 (38.9%) | 0 (0.0%) |
| $800 to $1,499 | 38 (19.2%) | 20 (100.0%) |
| $800 to $1,499 | 38 (19.2%) | 0 (0.0%) |
| Total | 198 (100.0%) | 20 (100.0%) |
Health & Disability in Pleasant Hill
Health Insurance Coverage by Age in Pleasant Hill
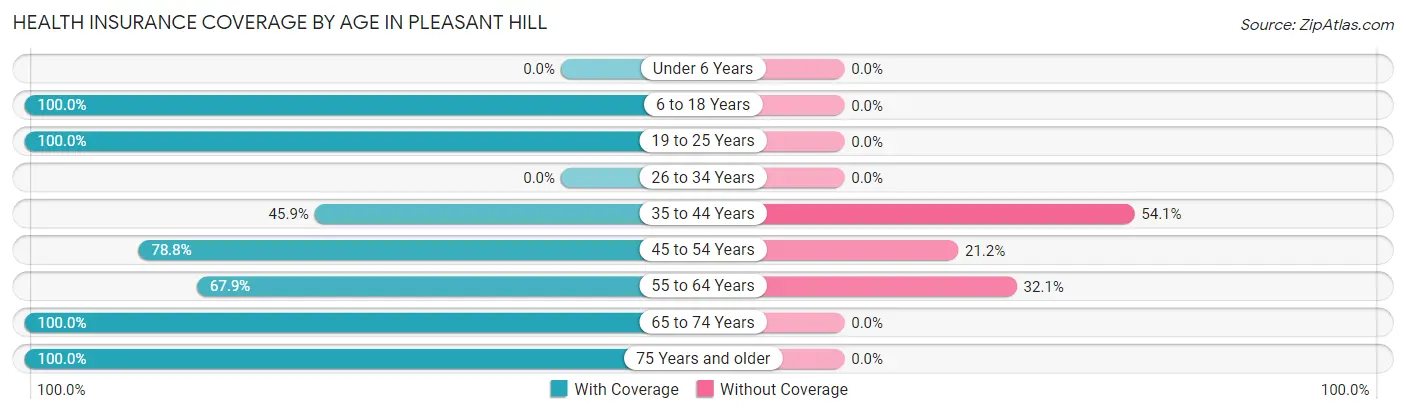
| Age Bracket | With Coverage | Without Coverage |
| Under 6 Years | 0 (0.0%) | 0 (0.0%) |
| 6 to 18 Years | 224 (100.0%) | 0 (0.0%) |
| 19 to 25 Years | 107 (100.0%) | 0 (0.0%) |
| 26 to 34 Years | 0 (0.0%) | 0 (0.0%) |
| 35 to 44 Years | 146 (45.9%) | 172 (54.1%) |
| 45 to 54 Years | 78 (78.8%) | 21 (21.2%) |
| 55 to 64 Years | 38 (67.9%) | 18 (32.1%) |
| 65 to 74 Years | 121 (100.0%) | 0 (0.0%) |
| 75 Years and older | 50 (100.0%) | 0 (0.0%) |
| Total | 764 (78.4%) | 211 (21.6%) |
Health Insurance Coverage by Citizenship Status in Pleasant Hill
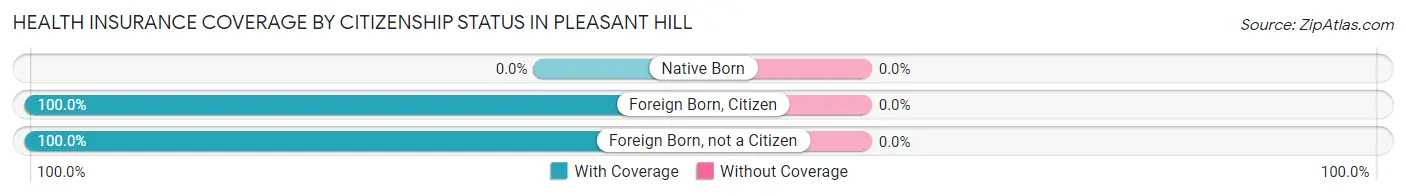
| Citizenship Status | With Coverage | Without Coverage |
| Native Born | 0 (0.0%) | 0 (0.0%) |
| Foreign Born, Citizen | 224 (100.0%) | 0 (0.0%) |
| Foreign Born, not a Citizen | 107 (100.0%) | 0 (0.0%) |
Health Insurance Coverage by Household Income in Pleasant Hill
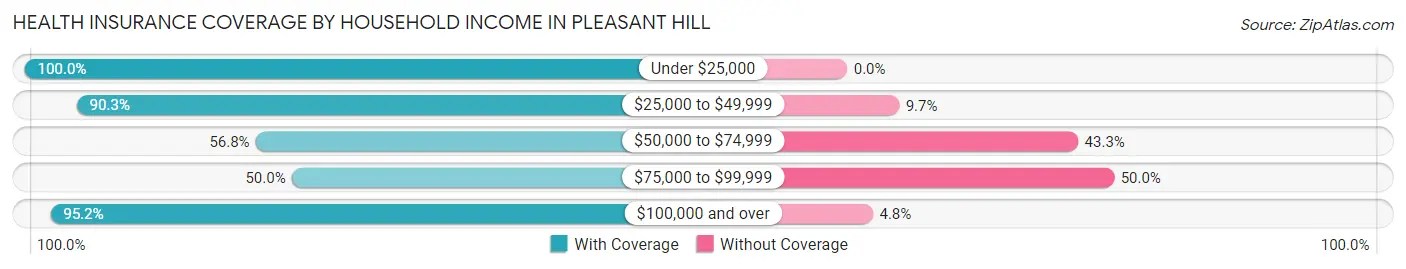
| Household Income | With Coverage | Without Coverage |
| Under $25,000 | 74 (100.0%) | 0 (0.0%) |
| $25,000 to $49,999 | 167 (90.3%) | 18 (9.7%) |
| $50,000 to $74,999 | 206 (56.8%) | 157 (43.2%) |
| $75,000 to $99,999 | 21 (50.0%) | 21 (50.0%) |
| $100,000 and over | 296 (95.2%) | 15 (4.8%) |
Public vs Private Health Insurance Coverage by Age in Pleasant Hill
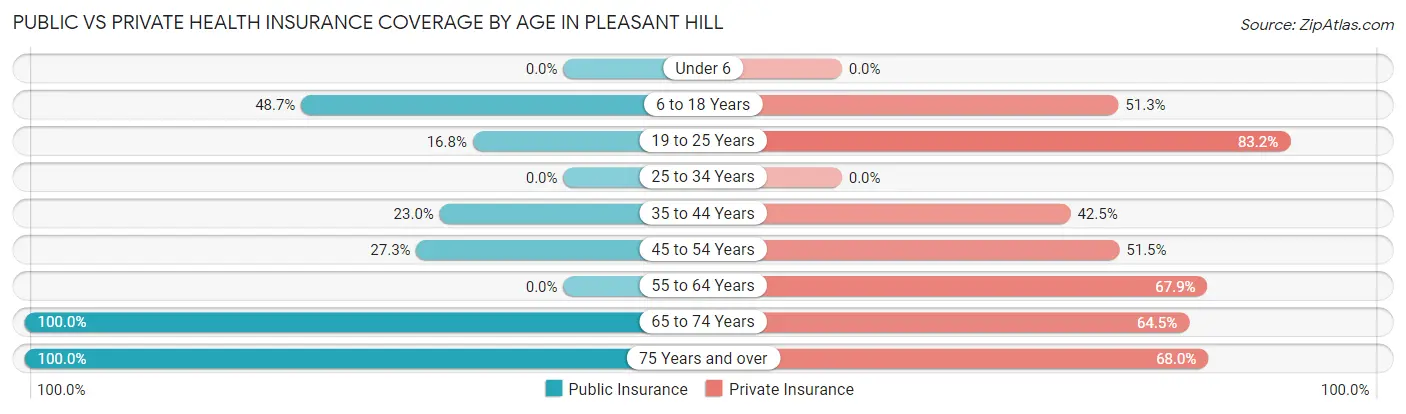
| Age Bracket | Public Insurance | Private Insurance |
| Under 6 | 0 (0.0%) | 0 (0.0%) |
| 6 to 18 Years | 109 (48.7%) | 115 (51.3%) |
| 19 to 25 Years | 18 (16.8%) | 89 (83.2%) |
| 25 to 34 Years | 0 (0.0%) | 0 (0.0%) |
| 35 to 44 Years | 73 (23.0%) | 135 (42.4%) |
| 45 to 54 Years | 27 (27.3%) | 51 (51.5%) |
| 55 to 64 Years | 0 (0.0%) | 38 (67.9%) |
| 65 to 74 Years | 121 (100.0%) | 78 (64.5%) |
| 75 Years and over | 50 (100.0%) | 34 (68.0%) |
| Total | 398 (40.8%) | 540 (55.4%) |
Disability Status by Sex by Age in Pleasant Hill
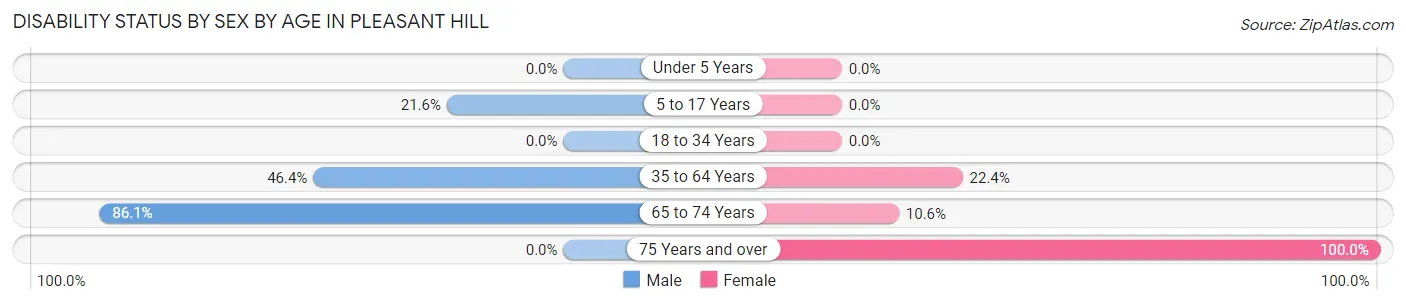
| Age Bracket | Male | Female |
| Under 5 Years | 0 (0.0%) | 0 (0.0%) |
| 5 to 17 Years | 29 (21.6%) | 0 (0.0%) |
| 18 to 34 Years | 0 (0.0%) | 0 (0.0%) |
| 35 to 64 Years | 143 (46.4%) | 37 (22.4%) |
| 65 to 74 Years | 31 (86.1%) | 9 (10.6%) |
| 75 Years and over | 0 (0.0%) | 18 (100.0%) |
Disability Class by Sex by Age in Pleasant Hill
Disability Class: Hearing Difficulty
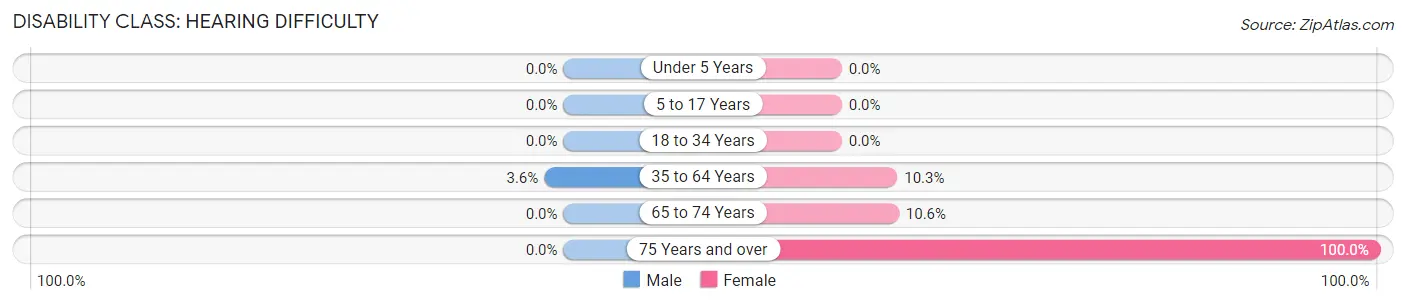
| Age Bracket | Male | Female |
| Under 5 Years | 0 (0.0%) | 0 (0.0%) |
| 5 to 17 Years | 0 (0.0%) | 0 (0.0%) |
| 18 to 34 Years | 0 (0.0%) | 0 (0.0%) |
| 35 to 64 Years | 11 (3.6%) | 17 (10.3%) |
| 65 to 74 Years | 0 (0.0%) | 9 (10.6%) |
| 75 Years and over | 0 (0.0%) | 18 (100.0%) |
Disability Class: Vision Difficulty
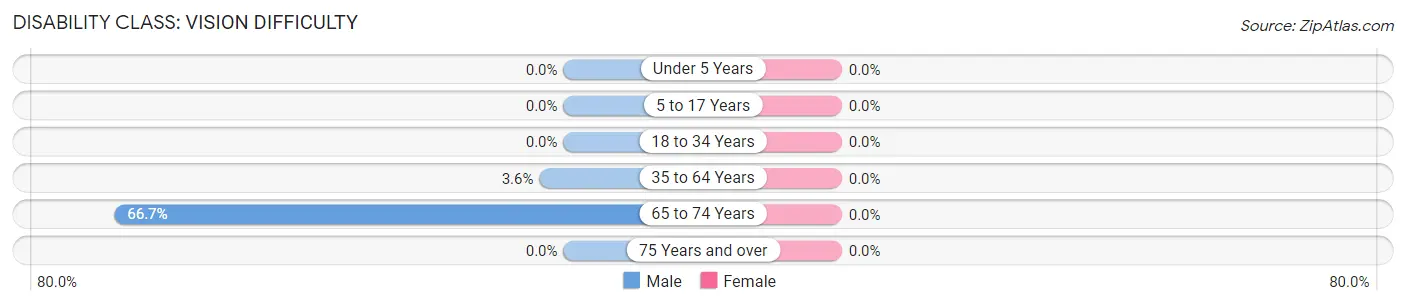
| Age Bracket | Male | Female |
| Under 5 Years | 0 (0.0%) | 0 (0.0%) |
| 5 to 17 Years | 0 (0.0%) | 0 (0.0%) |
| 18 to 34 Years | 0 (0.0%) | 0 (0.0%) |
| 35 to 64 Years | 11 (3.6%) | 0 (0.0%) |
| 65 to 74 Years | 24 (66.7%) | 0 (0.0%) |
| 75 Years and over | 0 (0.0%) | 0 (0.0%) |
Disability Class: Cognitive Difficulty
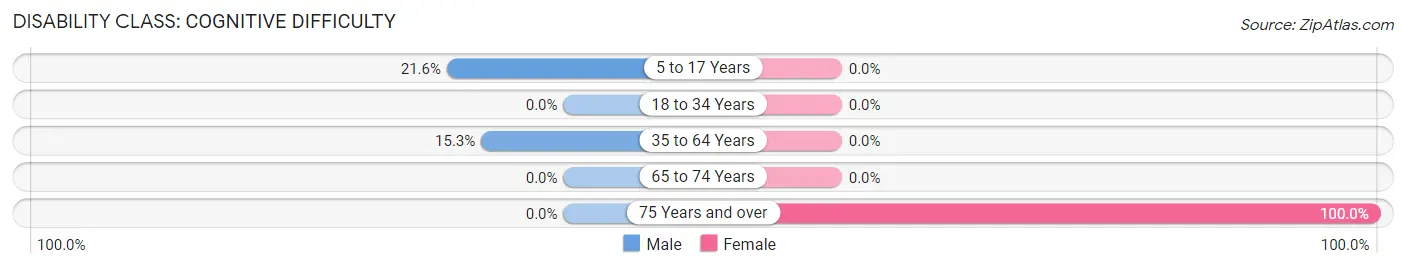
| Age Bracket | Male | Female |
| 5 to 17 Years | 29 (21.6%) | 0 (0.0%) |
| 18 to 34 Years | 0 (0.0%) | 0 (0.0%) |
| 35 to 64 Years | 47 (15.3%) | 0 (0.0%) |
| 65 to 74 Years | 0 (0.0%) | 0 (0.0%) |
| 75 Years and over | 0 (0.0%) | 18 (100.0%) |
Disability Class: Ambulatory Difficulty
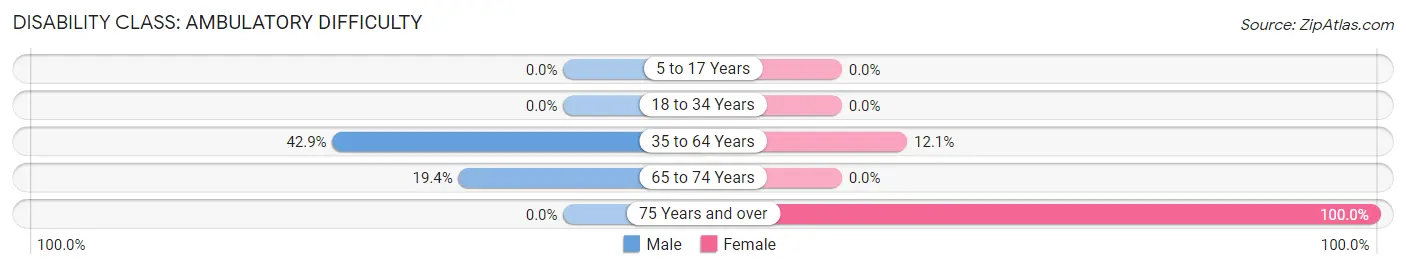
| Age Bracket | Male | Female |
| 5 to 17 Years | 0 (0.0%) | 0 (0.0%) |
| 18 to 34 Years | 0 (0.0%) | 0 (0.0%) |
| 35 to 64 Years | 132 (42.9%) | 20 (12.1%) |
| 65 to 74 Years | 7 (19.4%) | 0 (0.0%) |
| 75 Years and over | 0 (0.0%) | 18 (100.0%) |
Disability Class: Self-Care Difficulty
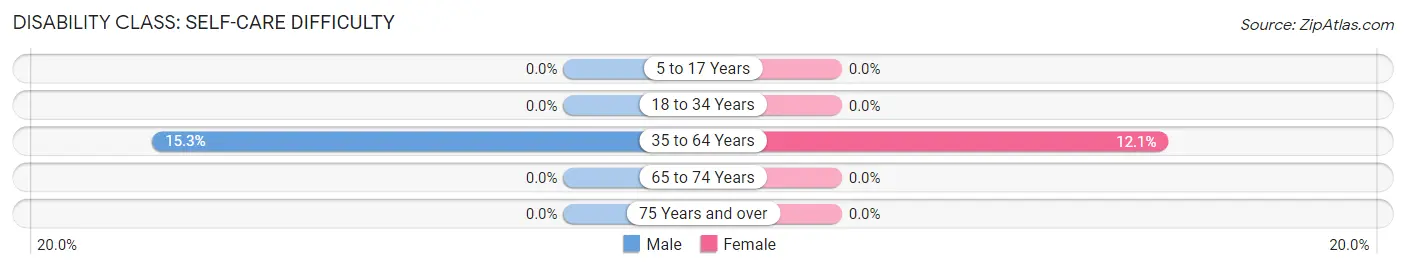
| Age Bracket | Male | Female |
| 5 to 17 Years | 0 (0.0%) | 0 (0.0%) |
| 18 to 34 Years | 0 (0.0%) | 0 (0.0%) |
| 35 to 64 Years | 47 (15.3%) | 20 (12.1%) |
| 65 to 74 Years | 0 (0.0%) | 0 (0.0%) |
| 75 Years and over | 0 (0.0%) | 0 (0.0%) |
Technology Access in Pleasant Hill
Computing Device Access in Pleasant Hill
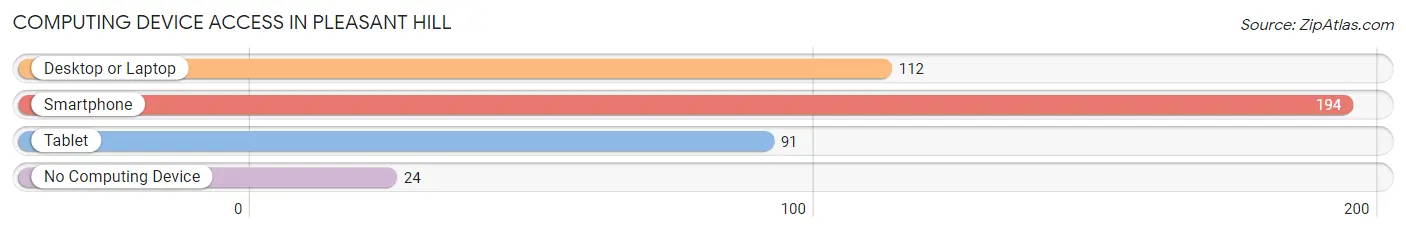
| Device Type | # Households | % Households |
| Desktop or Laptop | 112 | 51.4% |
| Smartphone | 194 | 89.0% |
| Tablet | 91 | 41.7% |
| No Computing Device | 24 | 11.0% |
| Total | 218 | 100.0% |
Internet Access in Pleasant Hill
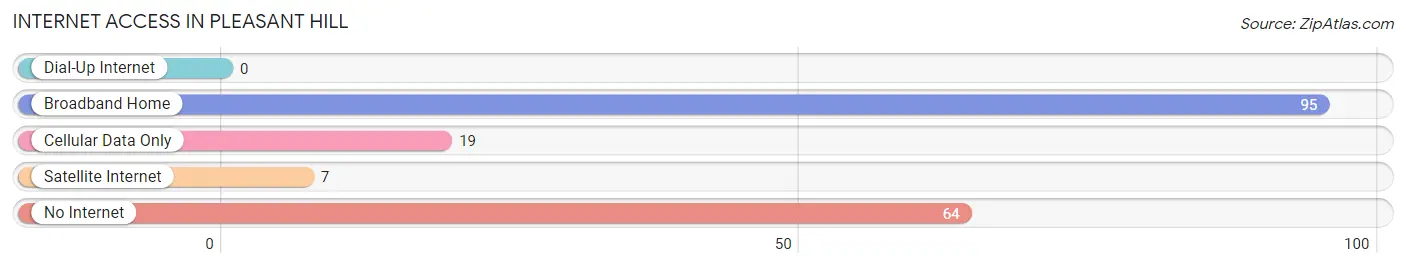
| Internet Type | # Households | % Households |
| Dial-Up Internet | 0 | 0.0% |
| Broadband Home | 95 | 43.6% |
| Cellular Data Only | 19 | 8.7% |
| Satellite Internet | 7 | 3.2% |
| No Internet | 64 | 29.4% |
| Total | 218 | 100.0% |
Pleasant Hill Summary
Pleasant Hill is a small unincorporated community located in the state of Texas, United States. It is situated in the southeastern part of the state, in the county of Smith. The population of Pleasant Hill was estimated to be around 1,000 people in the year 2000.
History
Pleasant Hill was first settled in the late 1800s by a group of settlers from the nearby town of Tyler. The settlers were looking for a place to settle and start a new life. They chose Pleasant Hill because of its fertile soil and abundant natural resources. The settlers built a small church and a school, and the community began to grow.
In the early 1900s, the town was incorporated and the first mayor was elected. The town was named after the pleasant hill that overlooked the town. The town grew slowly but steadily, and by the mid-1900s, it had become a thriving community.
Geography
Pleasant Hill is located in the southeastern part of the state of Texas, in the county of Smith. It is situated at the intersection of State Highway 64 and County Road 441. The town is surrounded by rolling hills and lush green fields. The climate in Pleasant Hill is mild and humid, with temperatures ranging from the mid-50s in the winter to the mid-80s in the summer.
Economy
The economy of Pleasant Hill is largely based on agriculture. The town is home to several farms and ranches, which produce a variety of crops and livestock. The town also has a few small businesses, such as a grocery store, a hardware store, and a few restaurants.
Demographics
As of the year 2000, the population of Pleasant Hill was estimated to be around 1,000 people. The majority of the population is white, with a small percentage of African Americans and Hispanics. The median household income in Pleasant Hill is around $30,000, and the median home value is around $90,000. The town has a low unemployment rate and a high rate of homeownership.
Conclusion
Pleasant Hill is a small unincorporated community located in the southeastern part of the state of Texas. It has a population of around 1,000 people and is largely based on agriculture. The town has a mild climate and a low unemployment rate. The median household income is around $30,000 and the median home value is around $90,000. Pleasant Hill is a peaceful and pleasant place to live, and it is a great place to raise a family.
Common Questions
What is Per Capita Income in Pleasant Hill?
Per Capita income in Pleasant Hill is $21,193.
What is the Median Family Income in Pleasant Hill?
Median Family Income in Pleasant Hill is $67,500.
What is the Median Household income in Pleasant Hill?
Median Household Income in Pleasant Hill is $50,147.
What is Inequality or Gini Index in Pleasant Hill?
Inequality or Gini Index in Pleasant Hill is 0.37.
What is the Total Population of Pleasant Hill?
Total Population of Pleasant Hill is 975.
What is the Total Male Population of Pleasant Hill?
Total Male Population of Pleasant Hill is 645.
What is the Total Female Population of Pleasant Hill?
Total Female Population of Pleasant Hill is 330.
What is the Ratio of Males per 100 Females in Pleasant Hill?
There are 195.45 Males per 100 Females in Pleasant Hill.
What is the Ratio of Females per 100 Males in Pleasant Hill?
There are 51.16 Females per 100 Males in Pleasant Hill.
What is the Median Population Age in Pleasant Hill?
Median Population Age in Pleasant Hill is 38.9 Years.
What is the Average Family Size in Pleasant Hill
Average Family Size in Pleasant Hill is 6.4 People.
What is the Average Household Size in Pleasant Hill
Average Household Size in Pleasant Hill is 4.5 People.
How Large is the Labor Force in Pleasant Hill?
There are 534 People in the Labor Forcein in Pleasant Hill.
What is the Percentage of People in the Labor Force in Pleasant Hill?
62.7% of People are in the Labor Force in Pleasant Hill.
What is the Unemployment Rate in Pleasant Hill?
Unemployment Rate in Pleasant Hill is 19.3%.