Zip Codes with the Highest Percentage of Population with a Degree in Computers and Mathematics in Texas
RELATED REPORTS & OPTIONS
Computers and Mathematics
Texas
Compare Zip Codes
Map of Zip Codes with the Highest Percentage of Population with a Degree in Computers and Mathematics in Texas
0.0%
80.0%
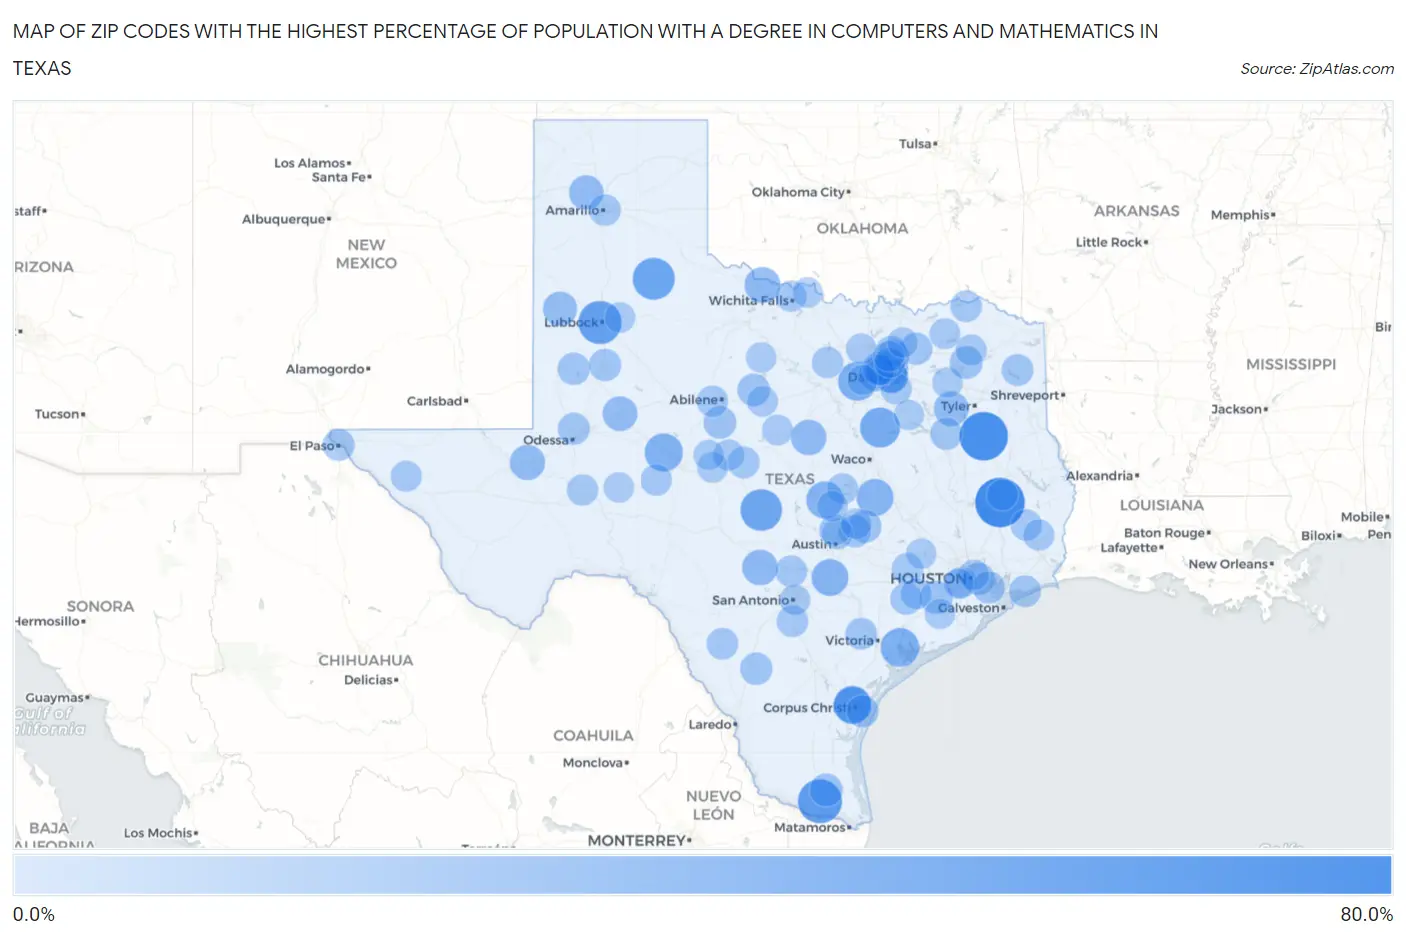
Zip Codes with the Highest Percentage of Population with a Degree in Computers and Mathematics in Texas
| Zip Code | % Graduates | vs State | vs National | |
| 1. | 75960 | 70.0% | 5.2%(+64.8)#1 | 4.9%(+65.1)#36 |
| 2. | 75764 | 66.7% | 5.2%(+61.5)#2 | 4.9%(+61.8)#41 |
| 3. | 78558 | 53.0% | 5.2%(+47.9)#3 | 4.9%(+48.1)#66 |
| 4. | 79406 | 50.0% | 5.2%(+44.8)#4 | 4.9%(+45.1)#74 |
| 5. | 79234 | 46.2% | 5.2%(+41.0)#5 | 4.9%(+41.3)#102 |
| 6. | 76820 | 45.2% | 5.2%(+40.0)#6 | 4.9%(+40.3)#108 |
| 7. | 76628 | 40.0% | 5.2%(+34.8)#7 | 4.9%(+35.1)#135 |
| 8. | 76129 | 36.8% | 5.2%(+31.7)#8 | 4.9%(+31.9)#152 |
| 9. | 77978 | 36.0% | 5.2%(+30.8)#9 | 4.9%(+31.1)#159 |
| 10. | 78408 | 34.7% | 5.2%(+29.5)#10 | 4.9%(+29.8)#170 |
| 11. | 76958 | 34.3% | 5.2%(+29.1)#11 | 4.9%(+29.4)#175 |
| 12. | 78608 | 32.0% | 5.2%(+26.8)#12 | 4.9%(+27.1)#201 |
| 13. | 76519 | 30.8% | 5.2%(+25.7)#13 | 4.9%(+25.9)#213 |
| 14. | 78670 | 30.3% | 5.2%(+25.1)#14 | 4.9%(+25.4)#217 |
| 15. | 78407 | 30.0% | 5.2%(+24.8)#15 | 4.9%(+25.1)#224 |
| 16. | 76364 | 27.1% | 5.2%(+21.9)#16 | 4.9%(+22.2)#262 |
| 17. | 78010 | 26.5% | 5.2%(+21.3)#17 | 4.9%(+21.6)#277 |
| 18. | 76436 | 26.1% | 5.2%(+20.9)#18 | 4.9%(+21.2)#283 |
| 19. | 79777 | 25.4% | 5.2%(+20.2)#19 | 4.9%(+20.5)#293 |
| 20. | 79721 | 24.1% | 5.2%(+19.0)#20 | 4.9%(+19.2)#322 |
| 21. | 75778 | 24.0% | 5.2%(+18.8)#21 | 4.9%(+19.1)#331 |
| 22. | 79010 | 23.2% | 5.2%(+18.0)#22 | 4.9%(+18.3)#354 |
| 23. | 79353 | 22.2% | 5.2%(+17.0)#23 | 4.9%(+17.3)#387 |
| 24. | 75251 | 21.4% | 5.2%(+16.2)#24 | 4.9%(+16.5)#417 |
| 25. | 75246 | 21.1% | 5.2%(+15.9)#25 | 4.9%(+16.2)#425 |
| 26. | 75063 | 19.1% | 5.2%(+13.9)#26 | 4.9%(+14.2)#501 |
| 27. | 78561 | 18.6% | 5.2%(+13.5)#27 | 4.9%(+13.8)#524 |
| 28. | 77417 | 18.5% | 5.2%(+13.3)#28 | 4.9%(+13.6)#533 |
| 29. | 75431 | 18.2% | 5.2%(+13.0)#29 | 4.9%(+13.3)#552 |
| 30. | 75226 | 18.1% | 5.2%(+13.0)#30 | 4.9%(+13.2)#558 |
| 31. | 76578 | 18.0% | 5.2%(+12.8)#31 | 4.9%(+13.1)#562 |
| 32. | 76155 | 17.7% | 5.2%(+12.5)#32 | 4.9%(+12.8)#577 |
| 33. | 79530 | 17.5% | 5.2%(+12.4)#33 | 4.9%(+12.6)#584 |
| 34. | 76464 | 17.3% | 5.2%(+12.1)#34 | 4.9%(+12.4)#608 |
| 35. | 78615 | 17.0% | 5.2%(+11.9)#35 | 4.9%(+12.2)#626 |
| 36. | 78014 | 16.8% | 5.2%(+11.6)#36 | 4.9%(+11.9)#635 |
| 37. | 79342 | 16.7% | 5.2%(+11.5)#37 | 4.9%(+11.8)#649 |
| 38. | 79351 | 16.3% | 5.2%(+11.1)#38 | 4.9%(+11.4)#676 |
| 39. | 77547 | 16.2% | 5.2%(+11.1)#39 | 4.9%(+11.3)#682 |
| 40. | 75442 | 16.2% | 5.2%(+11.0)#40 | 4.9%(+11.3)#683 |
| 41. | 78419 | 16.0% | 5.2%(+10.8)#41 | 4.9%(+11.1)#702 |
| 42. | 77507 | 16.0% | 5.2%(+10.8)#42 | 4.9%(+11.1)#706 |
| 43. | 75853 | 15.8% | 5.2%(+10.7)#43 | 4.9%(+10.9)#714 |
| 44. | 79758 | 15.6% | 5.2%(+10.4)#44 | 4.9%(+10.7)#742 |
| 45. | 77442 | 15.3% | 5.2%(+10.1)#45 | 4.9%(+10.4)#765 |
| 46. | 79901 | 15.2% | 5.2%(+9.99)#46 | 4.9%(+10.3)#771 |
| 47. | 77623 | 15.1% | 5.2%(+9.95)#47 | 4.9%(+10.2)#776 |
| 48. | 75630 | 15.0% | 5.2%(+9.87)#48 | 4.9%(+10.2)#784 |
| 49. | 77974 | 14.7% | 5.2%(+9.53)#49 | 4.9%(+9.81)#818 |
| 50. | 78004 | 14.7% | 5.2%(+9.49)#50 | 4.9%(+9.77)#825 |
| 51. | 78839 | 14.6% | 5.2%(+9.47)#51 | 4.9%(+9.75)#827 |
| 52. | 76873 | 14.6% | 5.2%(+9.46)#52 | 4.9%(+9.74)#829 |
| 53. | 75473 | 14.5% | 5.2%(+9.36)#53 | 4.9%(+9.64)#841 |
| 54. | 78050 | 14.3% | 5.2%(+9.11)#54 | 4.9%(+9.39)#867 |
| 55. | 79104 | 14.2% | 5.2%(+9.07)#55 | 4.9%(+9.35)#886 |
| 56. | 78950 | 14.1% | 5.2%(+8.90)#56 | 4.9%(+9.18)#900 |
| 57. | 76941 | 14.0% | 5.2%(+8.83)#57 | 4.9%(+9.12)#906 |
| 58. | 75025 | 14.0% | 5.2%(+8.82)#58 | 4.9%(+9.10)#908 |
| 59. | 75172 | 13.8% | 5.2%(+8.59)#59 | 4.9%(+8.87)#935 |
| 60. | 79563 | 13.7% | 5.2%(+8.55)#60 | 4.9%(+8.83)#941 |
| 61. | 75039 | 13.6% | 5.2%(+8.38)#61 | 4.9%(+8.67)#969 |
| 62. | 79752 | 13.5% | 5.2%(+8.34)#62 | 4.9%(+8.62)#977 |
| 63. | 76487 | 13.4% | 5.2%(+8.23)#63 | 4.9%(+8.52)#994 |
| 64. | 77664 | 13.2% | 5.2%(+8.04)#64 | 4.9%(+8.32)#1,017 |
| 65. | 76888 | 13.2% | 5.2%(+7.98)#65 | 4.9%(+8.26)#1,031 |
| 66. | 77656 | 13.1% | 5.2%(+7.87)#66 | 4.9%(+8.16)#1,046 |
| 67. | 78727 | 13.0% | 5.2%(+7.80)#67 | 4.9%(+8.08)#1,060 |
| 68. | 78717 | 12.9% | 5.2%(+7.75)#68 | 4.9%(+8.03)#1,065 |
| 69. | 77036 | 12.8% | 5.2%(+7.66)#69 | 4.9%(+7.95)#1,073 |
| 70. | 79851 | 12.8% | 5.2%(+7.64)#70 | 4.9%(+7.93)#1,077 |
| 71. | 75035 | 12.8% | 5.2%(+7.60)#71 | 4.9%(+7.89)#1,080 |
| 72. | 76543 | 12.7% | 5.2%(+7.56)#72 | 4.9%(+7.84)#1,085 |
| 73. | 77434 | 12.7% | 5.2%(+7.53)#73 | 4.9%(+7.82)#1,090 |
| 74. | 76306 | 12.6% | 5.2%(+7.43)#74 | 4.9%(+7.71)#1,109 |
| 75. | 75478 | 12.6% | 5.2%(+7.43)#75 | 4.9%(+7.71)#1,111 |
| 76. | 75939 | 12.6% | 5.2%(+7.39)#76 | 4.9%(+7.67)#1,114 |
| 77. | 75038 | 12.3% | 5.2%(+7.16)#77 | 4.9%(+7.44)#1,157 |
| 78. | 75469 | 12.2% | 5.2%(+7.02)#78 | 4.9%(+7.30)#1,185 |
| 79. | 76437 | 12.1% | 5.2%(+6.95)#79 | 4.9%(+7.23)#1,194 |
| 80. | 76474 | 12.0% | 5.2%(+6.82)#80 | 4.9%(+7.11)#1,217 |
| 81. | 76527 | 11.9% | 5.2%(+6.67)#81 | 4.9%(+6.96)#1,241 |
| 82. | 75252 | 11.7% | 5.2%(+6.49)#82 | 4.9%(+6.77)#1,290 |
| 83. | 76574 | 11.6% | 5.2%(+6.44)#83 | 4.9%(+6.72)#1,304 |
| 84. | 75024 | 11.6% | 5.2%(+6.41)#84 | 4.9%(+6.69)#1,314 |
| 85. | 76866 | 11.5% | 5.2%(+6.28)#85 | 4.9%(+6.56)#1,338 |
| 86. | 77026 | 11.4% | 5.2%(+6.24)#86 | 4.9%(+6.52)#1,343 |
| 87. | 78202 | 11.4% | 5.2%(+6.23)#87 | 4.9%(+6.52)#1,345 |
| 88. | 76259 | 11.4% | 5.2%(+6.23)#88 | 4.9%(+6.51)#1,348 |
| 89. | 75127 | 11.2% | 5.2%(+5.99)#89 | 4.9%(+6.27)#1,407 |
| 90. | 75454 | 11.1% | 5.2%(+5.96)#90 | 4.9%(+6.24)#1,414 |
| 91. | 79343 | 11.1% | 5.2%(+5.88)#91 | 4.9%(+6.17)#1,441 |
| 92. | 76491 | 11.0% | 5.2%(+5.81)#92 | 4.9%(+6.10)#1,460 |
| 93. | 77420 | 10.9% | 5.2%(+5.77)#93 | 4.9%(+6.05)#1,468 |
| 94. | 76105 | 10.9% | 5.2%(+5.76)#94 | 4.9%(+6.05)#1,469 |
| 95. | 76932 | 10.9% | 5.2%(+5.75)#95 | 4.9%(+6.03)#1,474 |
| 96. | 77426 | 10.9% | 5.2%(+5.74)#96 | 4.9%(+6.02)#1,475 |
| 97. | 75155 | 10.8% | 5.2%(+5.65)#97 | 4.9%(+5.93)#1,498 |
| 98. | 76875 | 10.8% | 5.2%(+5.59)#98 | 4.9%(+5.88)#1,510 |
| 99. | 76377 | 10.6% | 5.2%(+5.43)#99 | 4.9%(+5.71)#1,553 |
| 100. | 77099 | 10.5% | 5.2%(+5.37)#100 | 4.9%(+5.65)#1,568 |
Common Questions
What are the Top 10 Zip Codes with the Highest Percentage of Population with a Degree in Computers and Mathematics in Texas?
Top 10 Zip Codes with the Highest Percentage of Population with a Degree in Computers and Mathematics in Texas are:
What zip code has the Highest Percentage of Population with a Degree in Computers and Mathematics in Texas?
75960 has the Highest Percentage of Population with a Degree in Computers and Mathematics in Texas with 70.0%.
What is the Percentage of Population with a Degree in Computers and Mathematics in the State of Texas?
Percentage of Population with a Degree in Computers and Mathematics in Texas is 5.2%.
What is the Percentage of Population with a Degree in Computers and Mathematics in the United States?
Percentage of Population with a Degree in Computers and Mathematics in the United States is 4.9%.