Laguna Seca, TX Map & Demographics
Laguna Seca Map
Laguna Seca Overview
$27,395
PER CAPITA INCOME
$75,179
AVG FAMILY INCOME
$71,750
AVG HOUSEHOLD INCOME
3.5%
WAGE / INCOME GAP [ % ]
96.5¢/ $1
WAGE / INCOME GAP [ $ ]
0.42
INEQUALITY / GINI INDEX
277
TOTAL POPULATION
159
MALE POPULATION
118
FEMALE POPULATION
134.75
MALES / 100 FEMALES
74.21
FEMALES / 100 MALES
28.4
MEDIAN AGE
4.0
AVG FAMILY SIZE
3.9
AVG HOUSEHOLD SIZE
187
LABOR FORCE [ PEOPLE ]
76.6%
PERCENT IN LABOR FORCE
3.2%
UNEMPLOYMENT RATE
Income in Laguna Seca
Income Overview in Laguna Seca
Per Capita Income in Laguna Seca is $27,395, while median incomes of families and households are $75,179 and $71,750 respectively.
| Characteristic | Number | Measure |
| Per Capita Income | 277 | $27,395 |
| Median Family Income | 67 | $75,179 |
| Mean Family Income | 67 | $98,042 |
| Median Household Income | 71 | $71,750 |
| Mean Household Income | 71 | $92,825 |
| Income Deficit | 67 | $0 |
| Wage / Income Gap (%) | 277 | 3.48% |
| Wage / Income Gap ($) | 277 | 96.52¢ per $1 |
| Gini / Inequality Index | 277 | 0.42 |
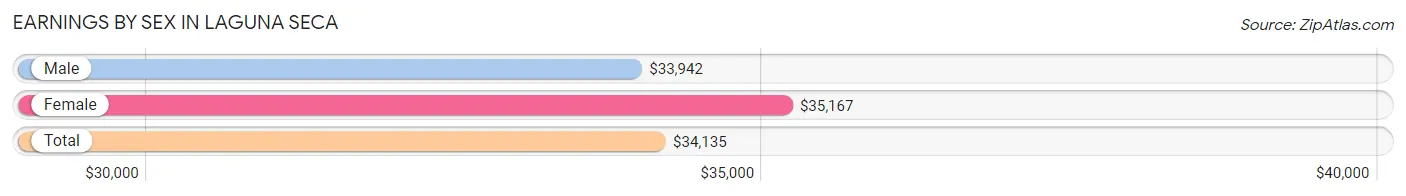
Earnings by Sex in Laguna Seca
Average Earnings in Laguna Seca are $34,135, $33,942 for men and $35,167 for women, a difference of 3.5%.
| Sex | Number | Average Earnings |
| Male | 129 (67.5%) | $33,942 |
| Female | 62 (32.5%) | $35,167 |
| Total | 191 (100.0%) | $34,135 |
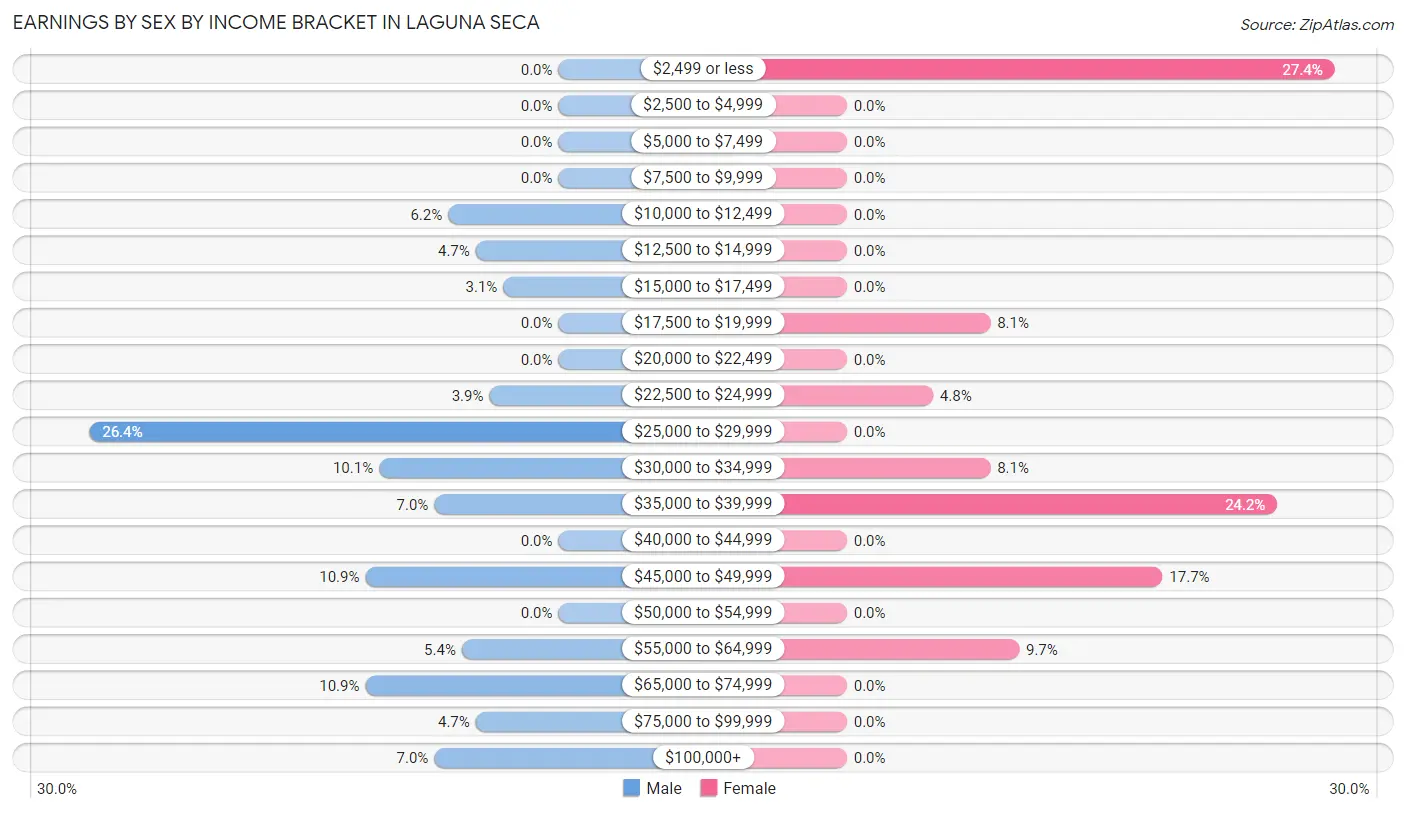
Earnings by Sex by Income Bracket in Laguna Seca
The most common earnings brackets in Laguna Seca are $25,000 to $29,999 for men (34 | 26.4%) and $2,499 or less for women (17 | 27.4%).
| Income | Male | Female |
| $2,499 or less | 0 (0.0%) | 17 (27.4%) |
| $2,500 to $4,999 | 0 (0.0%) | 0 (0.0%) |
| $5,000 to $7,499 | 0 (0.0%) | 0 (0.0%) |
| $7,500 to $9,999 | 0 (0.0%) | 0 (0.0%) |
| $10,000 to $12,499 | 8 (6.2%) | 0 (0.0%) |
| $12,500 to $14,999 | 6 (4.6%) | 0 (0.0%) |
| $15,000 to $17,499 | 4 (3.1%) | 0 (0.0%) |
| $17,500 to $19,999 | 0 (0.0%) | 5 (8.1%) |
| $20,000 to $22,499 | 0 (0.0%) | 0 (0.0%) |
| $22,500 to $24,999 | 5 (3.9%) | 3 (4.8%) |
| $25,000 to $29,999 | 34 (26.4%) | 0 (0.0%) |
| $30,000 to $34,999 | 13 (10.1%) | 5 (8.1%) |
| $35,000 to $39,999 | 9 (7.0%) | 15 (24.2%) |
| $40,000 to $44,999 | 0 (0.0%) | 0 (0.0%) |
| $45,000 to $49,999 | 14 (10.8%) | 11 (17.7%) |
| $50,000 to $54,999 | 0 (0.0%) | 0 (0.0%) |
| $55,000 to $64,999 | 7 (5.4%) | 6 (9.7%) |
| $65,000 to $74,999 | 14 (10.8%) | 0 (0.0%) |
| $75,000 to $99,999 | 6 (4.6%) | 0 (0.0%) |
| $100,000+ | 9 (7.0%) | 0 (0.0%) |
| Total | 129 (100.0%) | 62 (100.0%) |
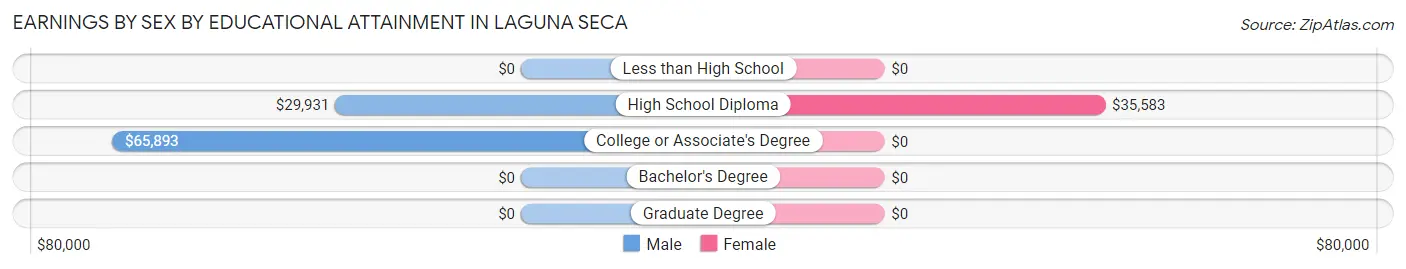
Earnings by Sex by Educational Attainment in Laguna Seca
Average earnings in Laguna Seca are $36,944 for men and $36,250 for women, a difference of 1.9%. Men with an educational attainment of college or associate's degree enjoy the highest average annual earnings of $65,893, while those with high school diploma education earn the least with $29,931. Women with an educational attainment of high school diploma earn the most with the average annual earnings of $35,583, while those with high school diploma education have the smallest earnings of $35,583.
| Educational Attainment | Male Income | Female Income |
| Less than High School | - | - |
| High School Diploma | $29,931 | $35,583 |
| College or Associate's Degree | $65,893 | $0 |
| Bachelor's Degree | - | - |
| Graduate Degree | - | - |
| Total | $36,944 | $36,250 |
Family Income in Laguna Seca
Family Income Brackets in Laguna Seca
According to the Laguna Seca family income data, there are 17 families falling into the $100,000 to $149,999 income range, which is the most common income bracket and makes up 25.4% of all families.
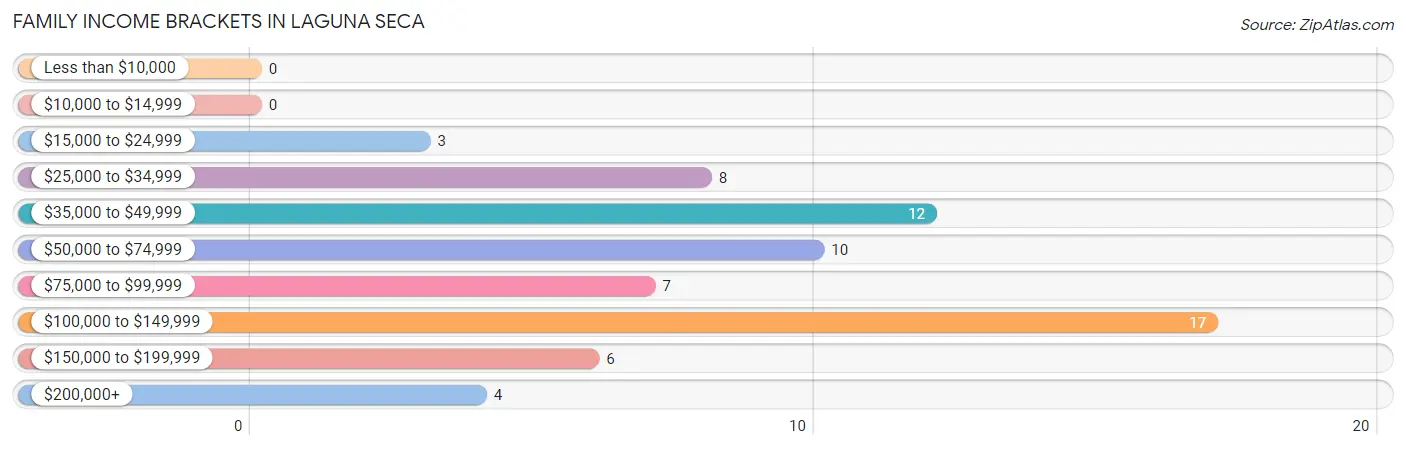
| Income Bracket | # Families | % Families |
| Less than $10,000 | 0 | 0.0% |
| $10,000 to $14,999 | 0 | 0.0% |
| $15,000 to $24,999 | 3 | 4.5% |
| $25,000 to $34,999 | 8 | 11.9% |
| $35,000 to $49,999 | 12 | 17.9% |
| $50,000 to $74,999 | 10 | 14.9% |
| $75,000 to $99,999 | 7 | 10.4% |
| $100,000 to $149,999 | 17 | 25.4% |
| $150,000 to $199,999 | 6 | 9.0% |
| $200,000+ | 4 | 6.0% |
Family Income by Famaliy Size in Laguna Seca
4-person families (20 | 29.8%) account for the highest median family income in Laguna Seca with $149,091 per family, while 4-person families (20 | 29.8%) have the highest median income of $37,273 per family member.
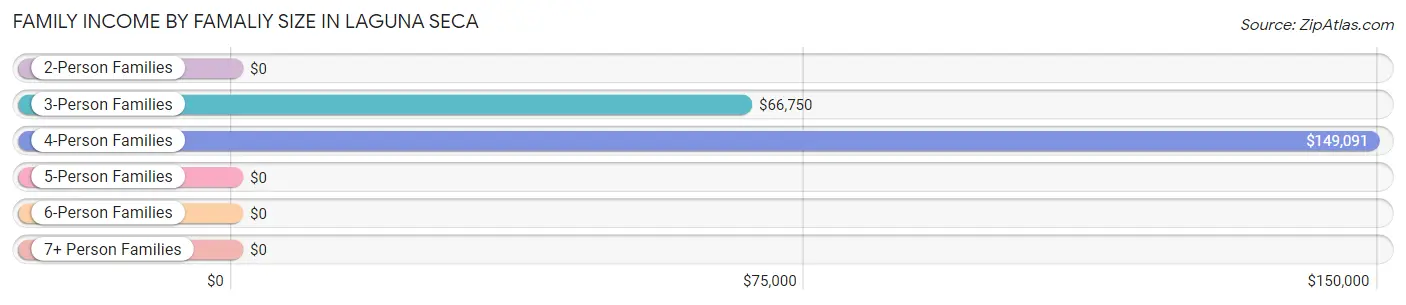
| Income Bracket | # Families | Median Income |
| 2-Person Families | 4 (6.0%) | $0 |
| 3-Person Families | 39 (58.2%) | $66,750 |
| 4-Person Families | 20 (29.8%) | $149,091 |
| 5-Person Families | 0 (0.0%) | $0 |
| 6-Person Families | 0 (0.0%) | $0 |
| 7+ Person Families | 4 (6.0%) | $0 |
| Total | 67 (100.0%) | $75,179 |
Family Income by Number of Earners in Laguna Seca
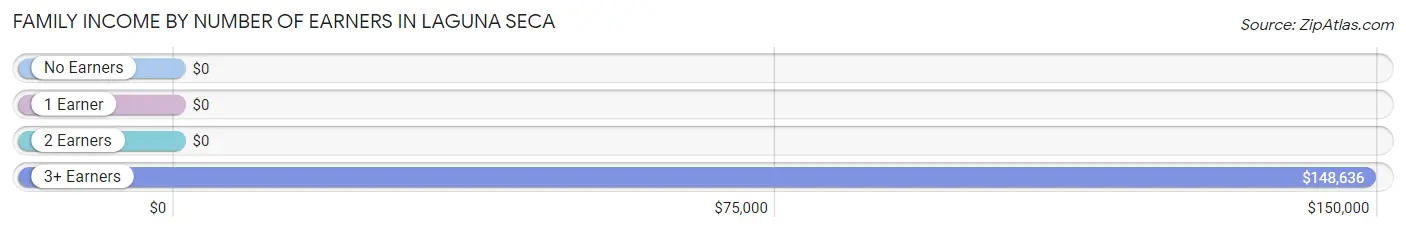
| Number of Earners | # Families | Median Income |
| No Earners | 4 (6.0%) | $0 |
| 1 Earner | 3 (4.5%) | $0 |
| 2 Earners | 28 (41.8%) | $0 |
| 3+ Earners | 32 (47.8%) | $148,636 |
| Total | 67 (100.0%) | $75,179 |
Household Income in Laguna Seca
Household Income Brackets in Laguna Seca
With 17 households falling in the category, the $100,000 to $149,999 income range is the most frequent in Laguna Seca, accounting for 23.9% of all households.
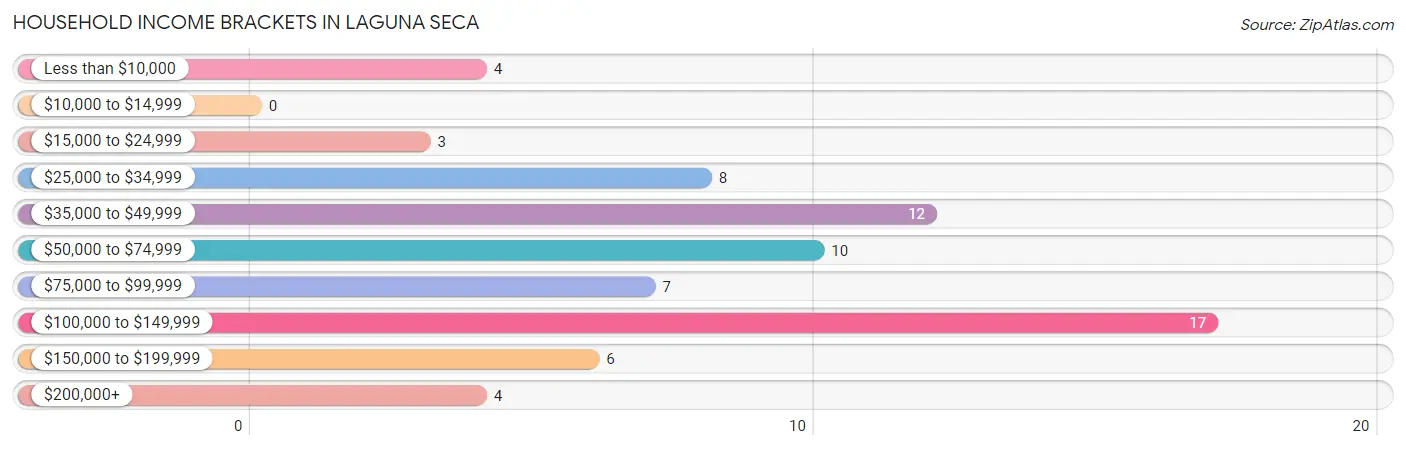
| Income Bracket | # Households | % Households |
| Less than $10,000 | 4 | 5.6% |
| $10,000 to $14,999 | 0 | 0.0% |
| $15,000 to $24,999 | 3 | 4.2% |
| $25,000 to $34,999 | 8 | 11.3% |
| $35,000 to $49,999 | 12 | 16.9% |
| $50,000 to $74,999 | 10 | 14.1% |
| $75,000 to $99,999 | 7 | 9.9% |
| $100,000 to $149,999 | 17 | 23.9% |
| $150,000 to $199,999 | 6 | 8.5% |
| $200,000+ | 4 | 5.6% |
Household Income by Householder Age in Laguna Seca
| Income Bracket | # Households | Median Income |
| 15 to 24 Years | 0 (0.0%) | $0 |
| 25 to 44 Years | 3 (4.2%) | $0 |
| 45 to 64 Years | 60 (84.5%) | $0 |
| 65+ Years | 8 (11.3%) | $0 |
| Total | 71 (100.0%) | $71,750 |
Poverty in Laguna Seca
Income Below Poverty by Sex and Age in Laguna Seca
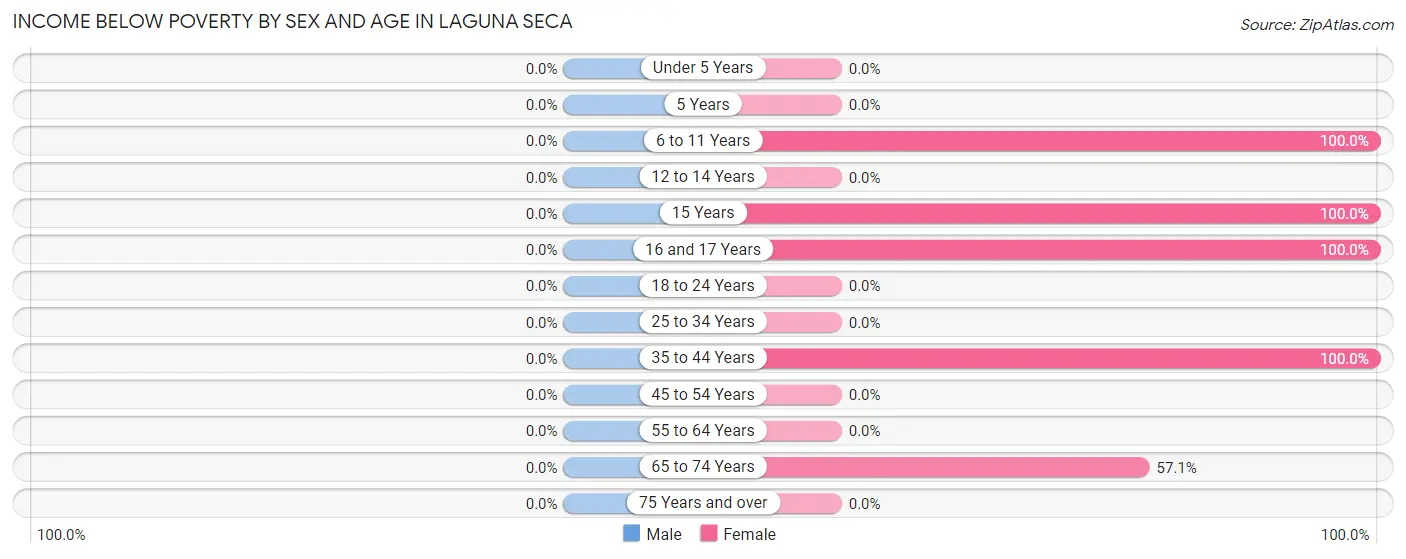
| Age Bracket | Male | Female |
| Under 5 Years | 0 (0.0%) | 0 (0.0%) |
| 5 Years | 0 (0.0%) | 0 (0.0%) |
| 6 to 11 Years | 0 (0.0%) | 4 (100.0%) |
| 12 to 14 Years | 0 (0.0%) | 0 (0.0%) |
| 15 Years | 0 (0.0%) | 3 (100.0%) |
| 16 and 17 Years | 0 (0.0%) | 3 (100.0%) |
| 18 to 24 Years | 0 (0.0%) | 0 (0.0%) |
| 25 to 34 Years | 0 (0.0%) | 0 (0.0%) |
| 35 to 44 Years | 0 (0.0%) | 3 (100.0%) |
| 45 to 54 Years | 0 (0.0%) | 0 (0.0%) |
| 55 to 64 Years | 0 (0.0%) | 0 (0.0%) |
| 65 to 74 Years | 0 (0.0%) | 4 (57.1%) |
| 75 Years and over | 0 (0.0%) | 0 (0.0%) |
| Total | 0 (0.0%) | 17 (14.9%) |
Income Above Poverty by Sex and Age in Laguna Seca
According to the poverty statistics in Laguna Seca, males aged under 5 years and females aged under 5 years are the age groups that are most secure financially, with 100.0% of males and 100.0% of females in these age groups living above the poverty line.
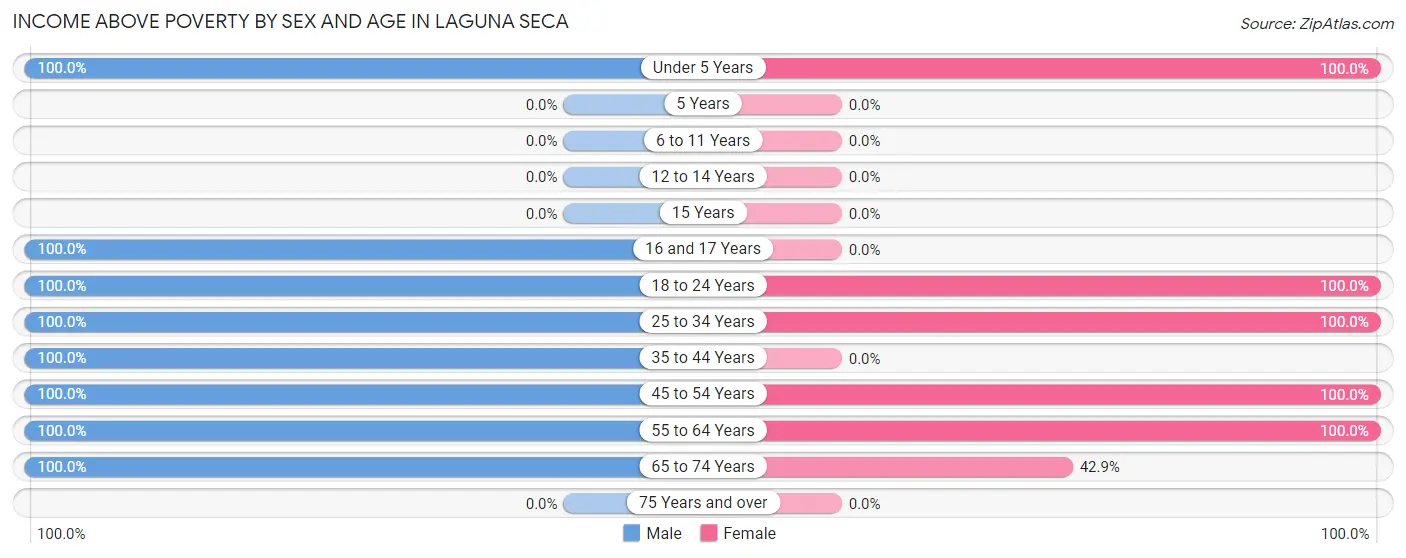
| Age Bracket | Male | Female |
| Under 5 Years | 17 (100.0%) | 5 (100.0%) |
| 5 Years | 0 (0.0%) | 0 (0.0%) |
| 6 to 11 Years | 0 (0.0%) | 0 (0.0%) |
| 12 to 14 Years | 0 (0.0%) | 0 (0.0%) |
| 15 Years | 0 (0.0%) | 0 (0.0%) |
| 16 and 17 Years | 3 (100.0%) | 0 (0.0%) |
| 18 to 24 Years | 31 (100.0%) | 23 (100.0%) |
| 25 to 34 Years | 44 (100.0%) | 20 (100.0%) |
| 35 to 44 Years | 7 (100.0%) | 0 (0.0%) |
| 45 to 54 Years | 29 (100.0%) | 32 (100.0%) |
| 55 to 64 Years | 18 (100.0%) | 14 (100.0%) |
| 65 to 74 Years | 10 (100.0%) | 3 (42.9%) |
| 75 Years and over | 0 (0.0%) | 0 (0.0%) |
| Total | 159 (100.0%) | 97 (85.1%) |
Income Below Poverty Among Married-Couple Families in Laguna Seca
| Children | Above Poverty | Below Poverty |
| No Children | 32 (100.0%) | 0 (0.0%) |
| 1 or 2 Children | 15 (100.0%) | 0 (0.0%) |
| 3 or 4 Children | 0 (0.0%) | 0 (0.0%) |
| 5 or more Children | 0 (0.0%) | 0 (0.0%) |
| Total | 47 (100.0%) | 0 (0.0%) |
Income Below Poverty Among Single-Parent Households in Laguna Seca
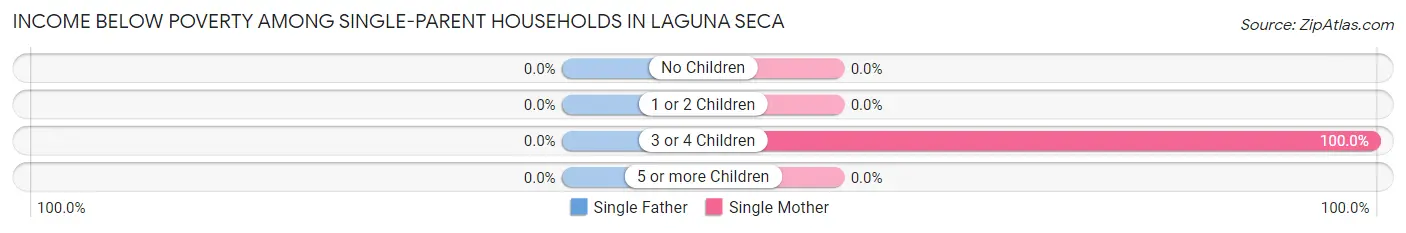
| Children | Single Father | Single Mother |
| No Children | 0 (0.0%) | 0 (0.0%) |
| 1 or 2 Children | 0 (0.0%) | 0 (0.0%) |
| 3 or 4 Children | 0 (0.0%) | 3 (100.0%) |
| 5 or more Children | 0 (0.0%) | 0 (0.0%) |
| Total | 0 (0.0%) | 3 (42.9%) |
Income Below Poverty Among Married-Couple vs Single-Parent Households in Laguna Seca
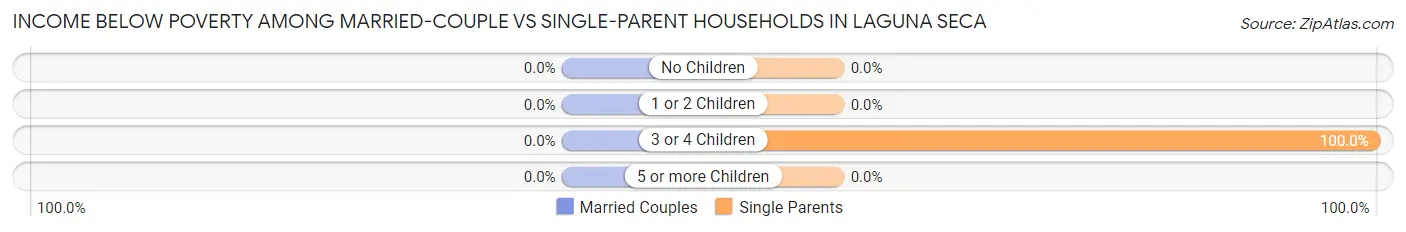
| Children | Married-Couple Families | Single-Parent Households |
| No Children | 0 (0.0%) | 0 (0.0%) |
| 1 or 2 Children | 0 (0.0%) | 0 (0.0%) |
| 3 or 4 Children | 0 (0.0%) | 3 (100.0%) |
| 5 or more Children | 0 (0.0%) | 0 (0.0%) |
| Total | 0 (0.0%) | 3 (15.0%) |
Race in Laguna Seca
The most populous races in Laguna Seca are Hispanic or Latino (270 | 97.5%), White / Caucasian (197 | 71.1%), and Two or more Races (70 | 25.3%).
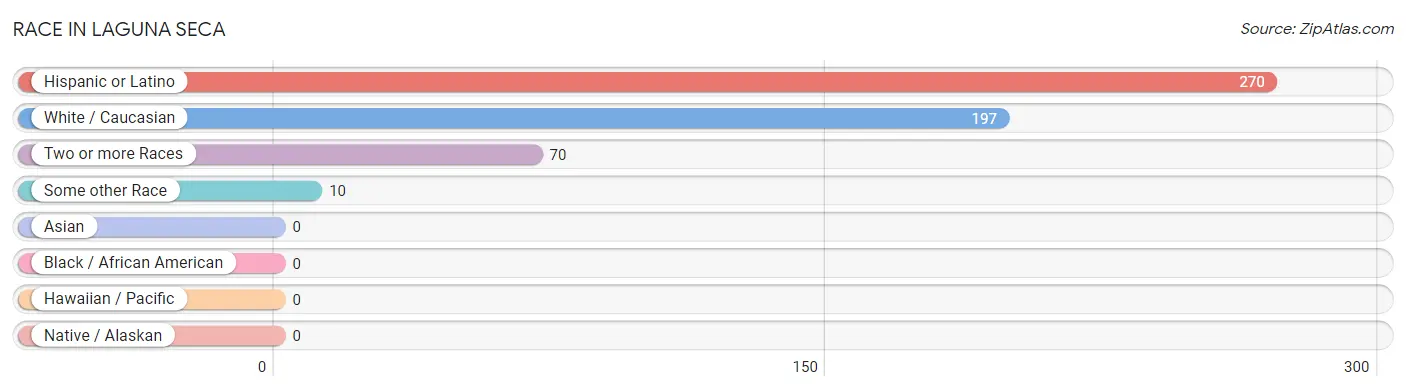
| Race | # Population | % Population |
| Asian | 0 | 0.0% |
| Black / African American | 0 | 0.0% |
| Hawaiian / Pacific | 0 | 0.0% |
| Hispanic or Latino | 270 | 97.5% |
| Native / Alaskan | 0 | 0.0% |
| White / Caucasian | 197 | 71.1% |
| Two or more Races | 70 | 25.3% |
| Some other Race | 10 | 3.6% |
| Total | 277 | 100.0% |
Ancestry in Laguna Seca
The most populous ancestries reported in Laguna Seca are Mexican (213 | 76.9%), German (24 | 8.7%), and Spaniard (4 | 1.4%), together accounting for 87.0% of all Laguna Seca residents.
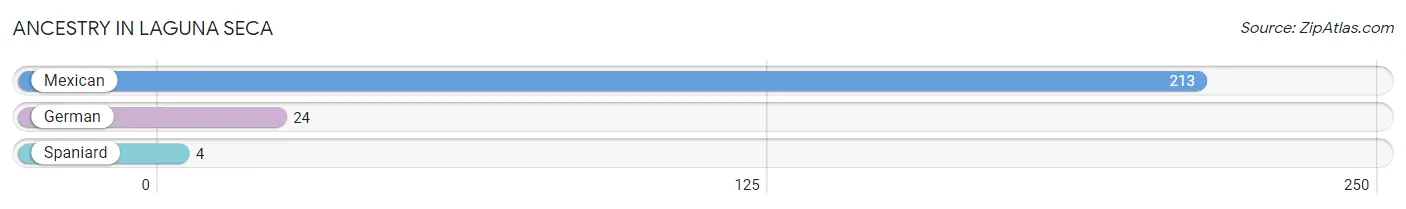
| Ancestry | # Population | % Population |
| German | 24 | 8.7% |
| Mexican | 213 | 76.9% |
| Spaniard | 4 | 1.4% | View All 3 Rows |
Immigrants in Laguna Seca
The most numerous immigrant groups reported in Laguna Seca came from Latin America (21 | 7.6%), Central America (17 | 6.1%), Mexico (17 | 6.1%), South America (4 | 1.4%), and Venezuela (4 | 1.4%), together accounting for 22.7% of all Laguna Seca residents.
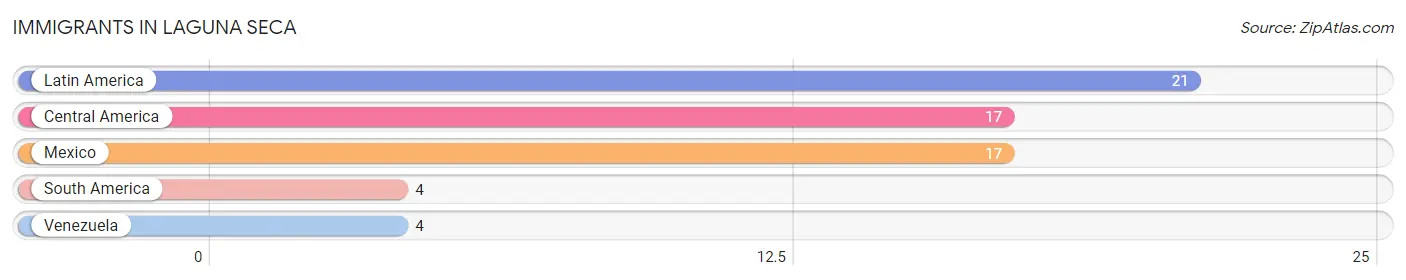
| Immigration Origin | # Population | % Population |
| Central America | 17 | 6.1% |
| Latin America | 21 | 7.6% |
| Mexico | 17 | 6.1% |
| South America | 4 | 1.4% |
| Venezuela | 4 | 1.4% | View All 5 Rows |
Sex and Age in Laguna Seca
Sex and Age in Laguna Seca
The most populous age groups in Laguna Seca are 25 to 29 Years (44 | 27.7%) for men and 50 to 54 Years (32 | 27.1%) for women.
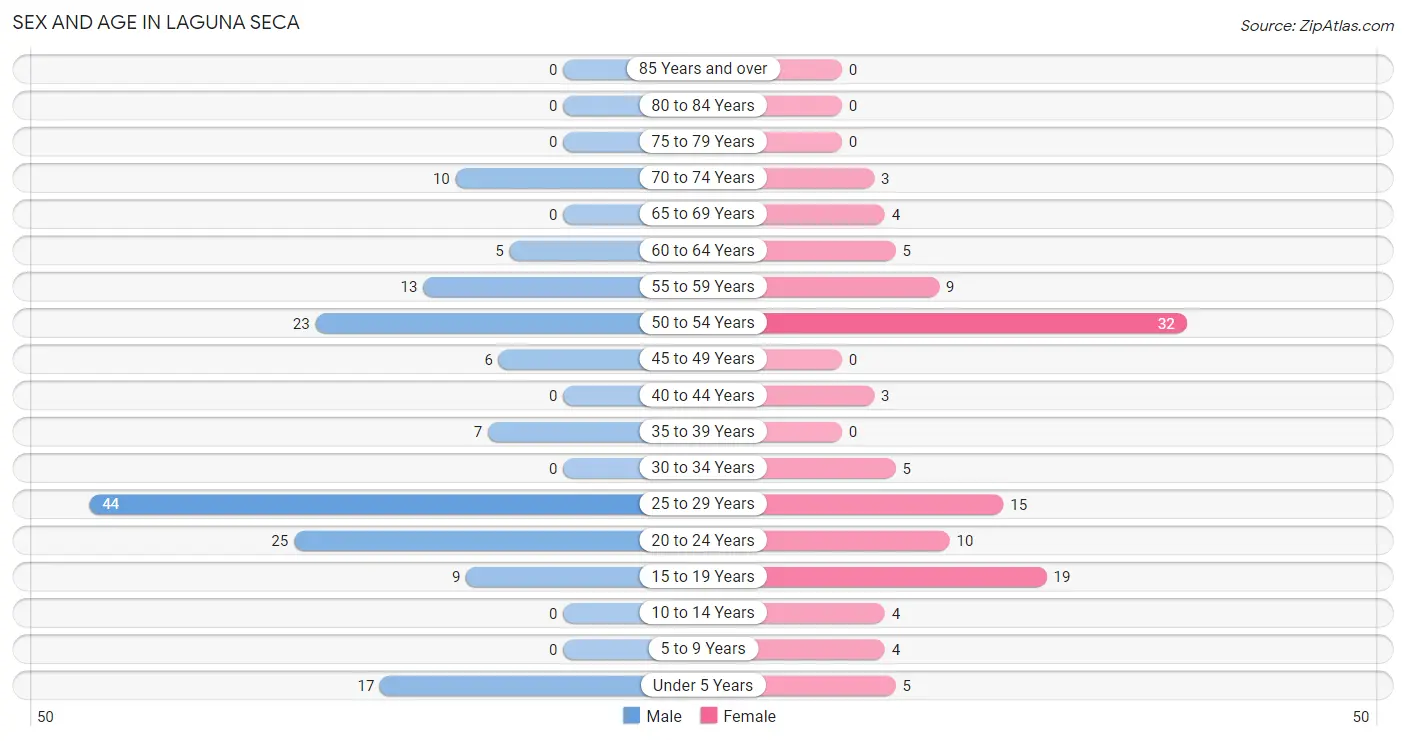
| Age Bracket | Male | Female |
| Under 5 Years | 17 (10.7%) | 5 (4.2%) |
| 5 to 9 Years | 0 (0.0%) | 4 (3.4%) |
| 10 to 14 Years | 0 (0.0%) | 4 (3.4%) |
| 15 to 19 Years | 9 (5.7%) | 19 (16.1%) |
| 20 to 24 Years | 25 (15.7%) | 10 (8.5%) |
| 25 to 29 Years | 44 (27.7%) | 15 (12.7%) |
| 30 to 34 Years | 0 (0.0%) | 5 (4.2%) |
| 35 to 39 Years | 7 (4.4%) | 0 (0.0%) |
| 40 to 44 Years | 0 (0.0%) | 3 (2.5%) |
| 45 to 49 Years | 6 (3.8%) | 0 (0.0%) |
| 50 to 54 Years | 23 (14.5%) | 32 (27.1%) |
| 55 to 59 Years | 13 (8.2%) | 9 (7.6%) |
| 60 to 64 Years | 5 (3.1%) | 5 (4.2%) |
| 65 to 69 Years | 0 (0.0%) | 4 (3.4%) |
| 70 to 74 Years | 10 (6.3%) | 3 (2.5%) |
| 75 to 79 Years | 0 (0.0%) | 0 (0.0%) |
| 80 to 84 Years | 0 (0.0%) | 0 (0.0%) |
| 85 Years and over | 0 (0.0%) | 0 (0.0%) |
| Total | 159 (100.0%) | 118 (100.0%) |
Families and Households in Laguna Seca
Median Family Size in Laguna Seca
The median family size in Laguna Seca is 4.01 persons per family, with married-couple families (47 | 70.2%) accounting for the largest median family size of 4.23 persons per family. On the other hand, single male/father families (13 | 19.4%) represent the smallest median family size with 3.31 persons per family.
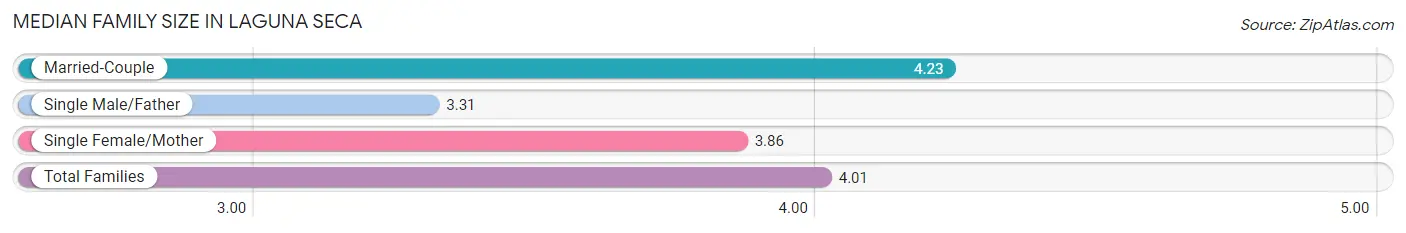
| Family Type | # Families | Family Size |
| Married-Couple | 47 (70.2%) | 4.23 |
| Single Male/Father | 13 (19.4%) | 3.31 |
| Single Female/Mother | 7 (10.4%) | 3.86 |
| Total Families | 67 (100.0%) | 4.01 |
Median Household Size in Laguna Seca
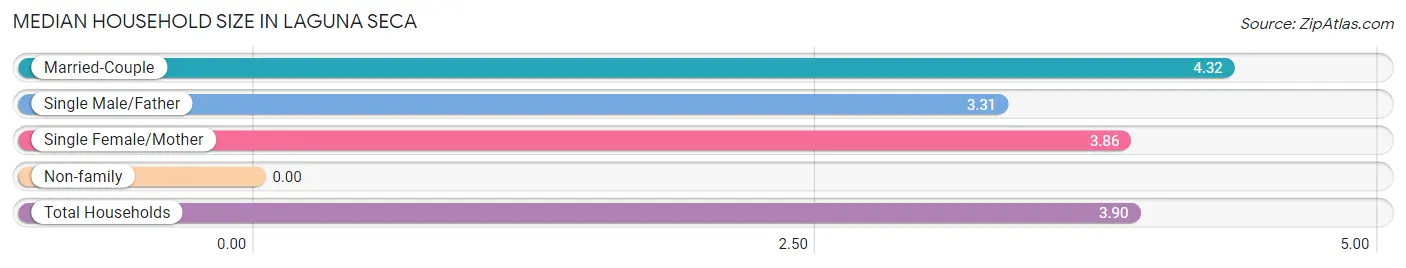
| Household Type | # Households | Household Size |
| Married-Couple | 47 (66.2%) | 4.32 |
| Single Male/Father | 13 (18.3%) | 3.31 |
| Single Female/Mother | 7 (9.9%) | 3.86 |
| Non-family | 4 (5.6%) | - |
| Total Households | 71 (100.0%) | 3.90 |
Household Size by Marriage Status in Laguna Seca
Out of a total of 71 households in Laguna Seca, 67 (94.4%) are family households, while 4 (5.6%) are nonfamily households. The most numerous type of family households are 3-person households, comprising 39, and the most common type of nonfamily households are 1-person households, comprising 4.
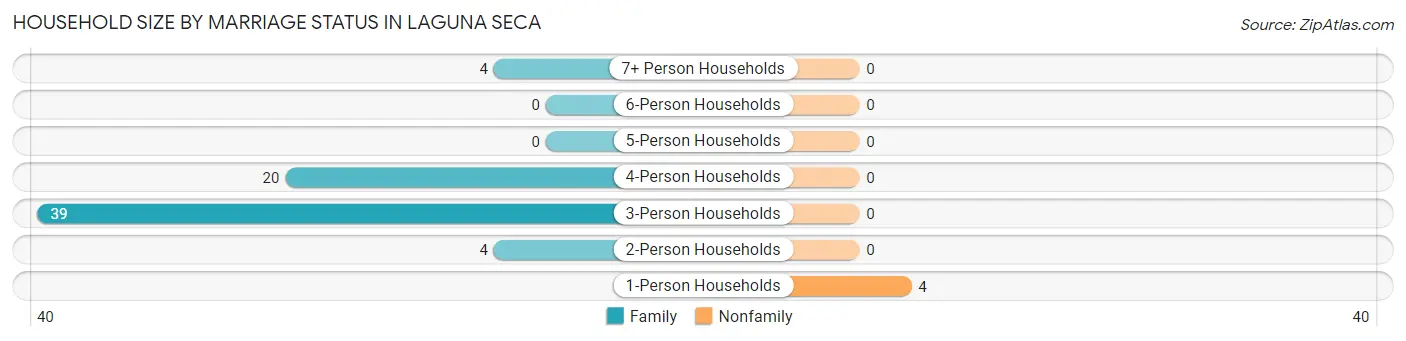
| Household Size | Family Households | Nonfamily Households |
| 1-Person Households | - | 4 (5.6%) |
| 2-Person Households | 4 (5.6%) | 0 (0.0%) |
| 3-Person Households | 39 (54.9%) | 0 (0.0%) |
| 4-Person Households | 20 (28.2%) | 0 (0.0%) |
| 5-Person Households | 0 (0.0%) | 0 (0.0%) |
| 6-Person Households | 0 (0.0%) | 0 (0.0%) |
| 7+ Person Households | 4 (5.6%) | 0 (0.0%) |
| Total | 67 (94.4%) | 4 (5.6%) |
Female Fertility in Laguna Seca
Fertility by Age in Laguna Seca
| Age Bracket | Women with Births | Births / 1,000 Women |
| 15 to 19 years | 0 (0.0%) | 0.0 |
| 20 to 34 years | 0 (0.0%) | 0.0 |
| 35 to 50 years | 0 (0.0%) | 0.0 |
| Total | 0 (0.0%) | 0.0 |
Fertility by Age by Marriage Status in Laguna Seca
| Age Bracket | Married | Unmarried |
| 15 to 19 years | 0 (0.0%) | 0 (0.0%) |
| 20 to 34 years | 0 (0.0%) | 0 (0.0%) |
| 35 to 50 years | 0 (0.0%) | 0 (0.0%) |
| Total | 0 (0.0%) | 0 (0.0%) |
Fertility by Education in Laguna Seca
| Educational Attainment | Women with Births | Births / 1,000 Women |
| Less than High School | 0 (0.0%) | 0.0 |
| High School Diploma | 0 (0.0%) | 0.0 |
| College or Associate's Degree | 0 (0.0%) | 0.0 |
| Bachelor's Degree | 0 (0.0%) | 0.0 |
| Graduate Degree | 0 (0.0%) | 0.0 |
| Total | 0 (0.0%) | 0.0 |
Fertility by Education by Marriage Status in Laguna Seca
| Educational Attainment | Married | Unmarried |
| Less than High School | 0 (0.0%) | 0 (0.0%) |
| High School Diploma | 0 (0.0%) | 0 (0.0%) |
| College or Associate's Degree | 0 (0.0%) | 0 (0.0%) |
| Bachelor's Degree | 0 (0.0%) | 0 (0.0%) |
| Graduate Degree | 0 (0.0%) | 0 (0.0%) |
| Total | 0 (0.0%) | 0 (0.0%) |
Employment Characteristics in Laguna Seca
Employment by Class of Employer in Laguna Seca
Among the 181 employed individuals in Laguna Seca, state government employees (61 | 33.7%), private company employees (53 | 29.3%), and federal government employees (39 | 21.5%) make up the most common classes of employment.
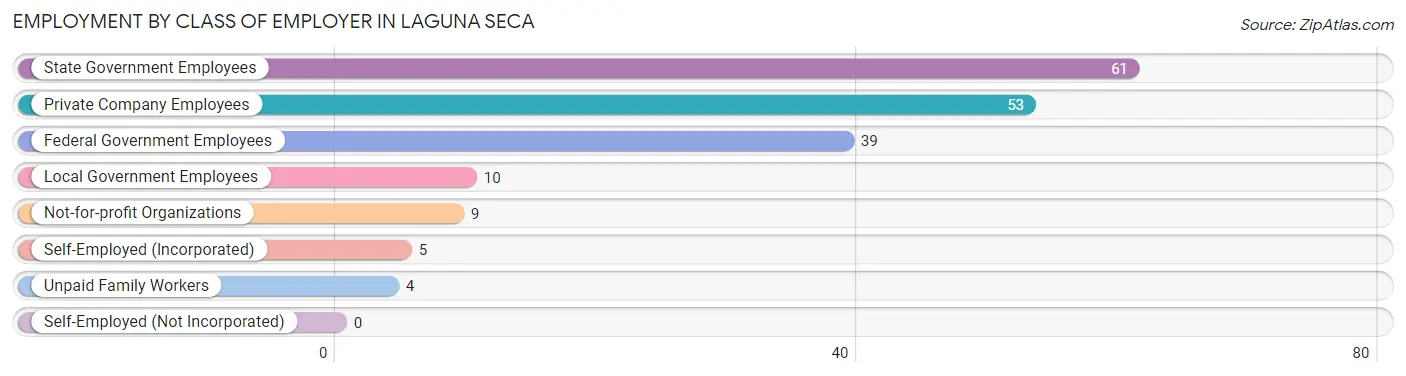
| Employer Class | # Employees | % Employees |
| Private Company Employees | 53 | 29.3% |
| Self-Employed (Incorporated) | 5 | 2.8% |
| Self-Employed (Not Incorporated) | 0 | 0.0% |
| Not-for-profit Organizations | 9 | 5.0% |
| Local Government Employees | 10 | 5.5% |
| State Government Employees | 61 | 33.7% |
| Federal Government Employees | 39 | 21.5% |
| Unpaid Family Workers | 4 | 2.2% |
| Total | 181 | 100.0% |
Employment Status by Age in Laguna Seca
According to the labor force statistics for Laguna Seca, out of the total population over 16 years of age (244), 76.6% or 187 individuals are in the labor force, with 3.2% or 6 of them unemployed. The age group with the highest labor force participation rate is 25 to 29 years, with 100.0% or 59 individuals in the labor force. Within the labor force, the 16 to 19 years age range has the highest percentage of unemployed individuals, with 31.6% or 6 of them being unemployed.
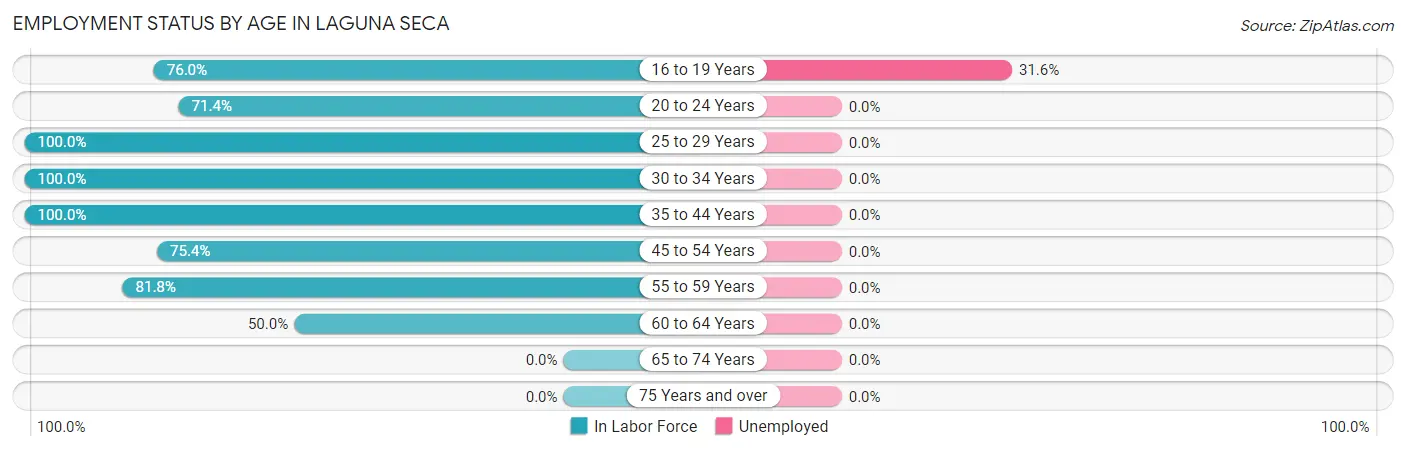
| Age Bracket | In Labor Force | Unemployed |
| 16 to 19 Years | 19 (76.0%) | 6 (31.6%) |
| 20 to 24 Years | 25 (71.4%) | 0 (0.0%) |
| 25 to 29 Years | 59 (100.0%) | 0 (0.0%) |
| 30 to 34 Years | 5 (100.0%) | 0 (0.0%) |
| 35 to 44 Years | 10 (100.0%) | 0 (0.0%) |
| 45 to 54 Years | 46 (75.4%) | 0 (0.0%) |
| 55 to 59 Years | 18 (81.8%) | 0 (0.0%) |
| 60 to 64 Years | 5 (50.0%) | 0 (0.0%) |
| 65 to 74 Years | 0 (0.0%) | 0 (0.0%) |
| 75 Years and over | 0 (0.0%) | 0 (0.0%) |
| Total | 187 (76.6%) | 6 (3.2%) |
Employment Status by Educational Attainment in Laguna Seca
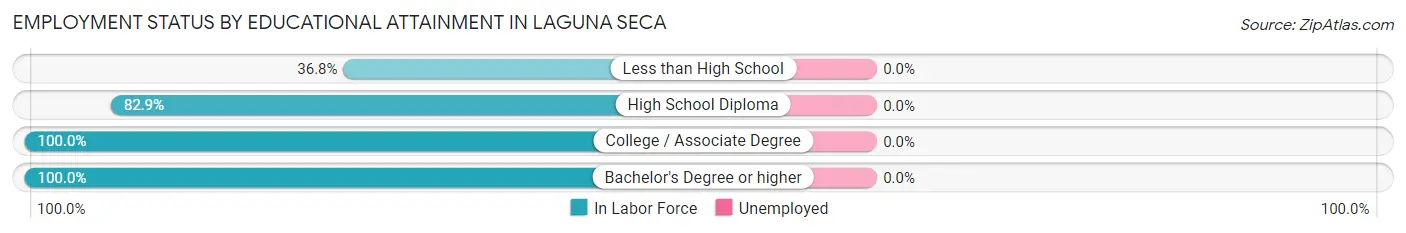
| Educational Attainment | In Labor Force | Unemployed |
| Less than High School | 7 (36.8%) | 0 (0.0%) |
| High School Diploma | 58 (82.9%) | 0 (0.0%) |
| College / Associate Degree | 51 (100.0%) | 0 (0.0%) |
| Bachelor's Degree or higher | 27 (100.0%) | 0 (0.0%) |
| Total | 143 (85.6%) | 0 (0.0%) |
Employment Occupations by Sex in Laguna Seca
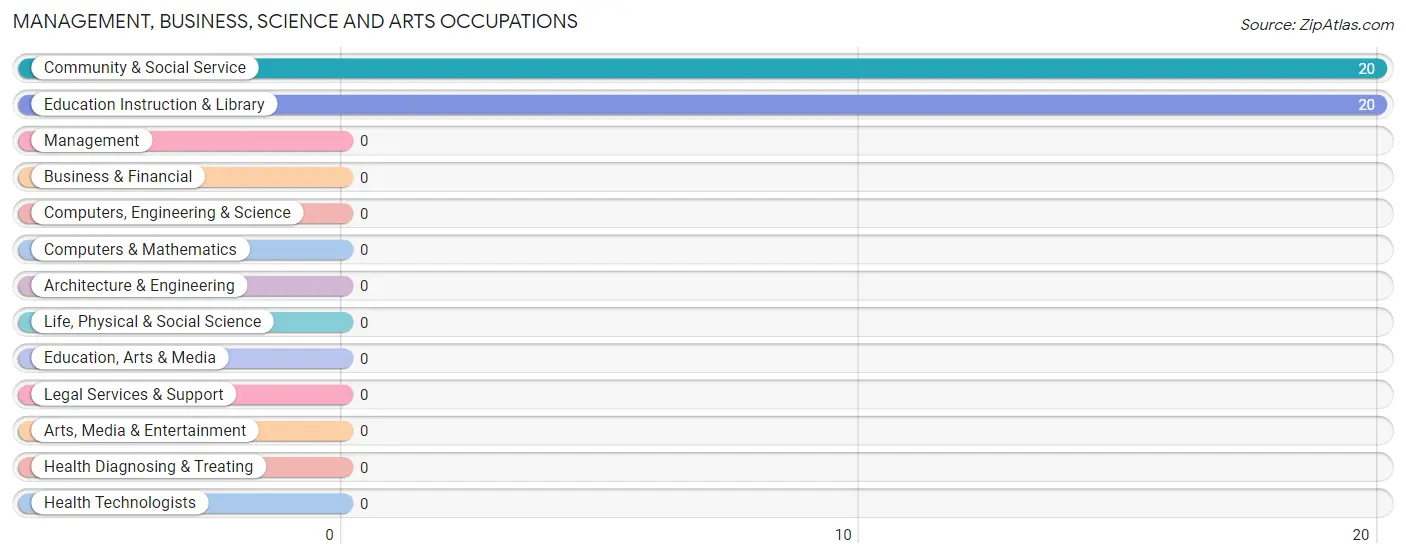
Management, Business, Science and Arts Occupations
The most common Management, Business, Science and Arts occupations in Laguna Seca are Community & Social Service (20 | 11.1%), and Education Instruction & Library (20 | 11.1%).
Management, Business, Science and Arts Occupations by Sex
Within the Management, Business, Science and Arts occupations in Laguna Seca, the most male-oriented occupations are Community & Social Service (70.0%), and Education Instruction & Library (70.0%), while the most female-oriented occupations are Community & Social Service (30.0%), and Education Instruction & Library (30.0%).
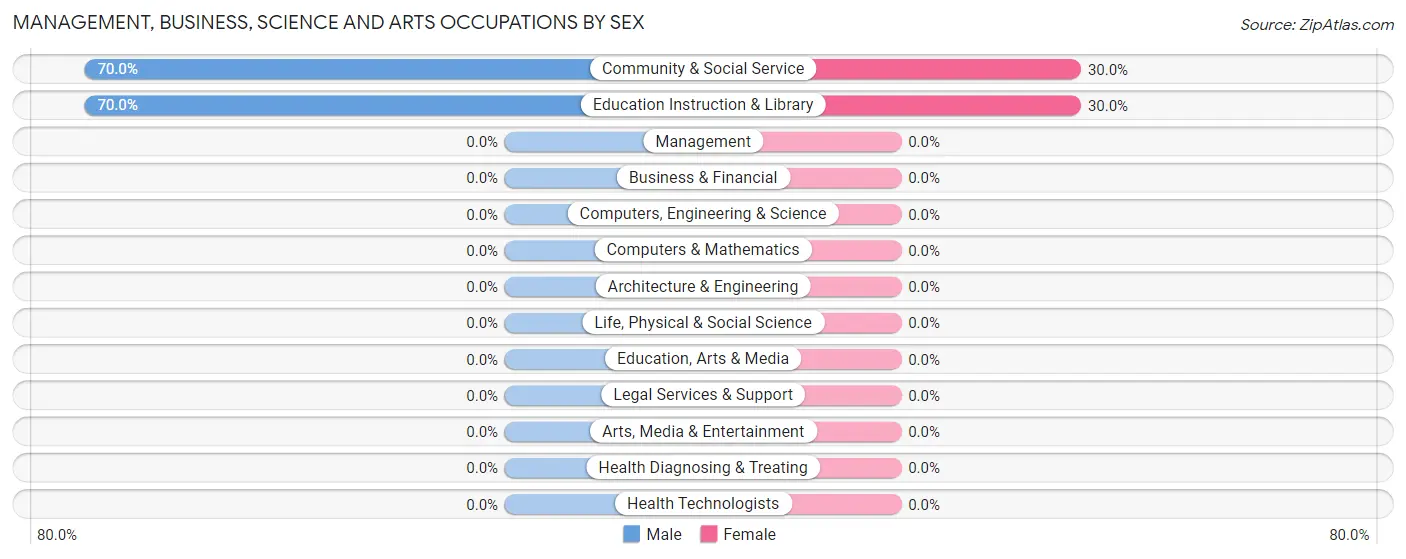
| Occupation | Male | Female |
| Management | 0 (0.0%) | 0 (0.0%) |
| Business & Financial | 0 (0.0%) | 0 (0.0%) |
| Computers, Engineering & Science | 0 (0.0%) | 0 (0.0%) |
| Computers & Mathematics | 0 (0.0%) | 0 (0.0%) |
| Architecture & Engineering | 0 (0.0%) | 0 (0.0%) |
| Life, Physical & Social Science | 0 (0.0%) | 0 (0.0%) |
| Community & Social Service | 14 (70.0%) | 6 (30.0%) |
| Education, Arts & Media | 0 (0.0%) | 0 (0.0%) |
| Legal Services & Support | 0 (0.0%) | 0 (0.0%) |
| Education Instruction & Library | 14 (70.0%) | 6 (30.0%) |
| Arts, Media & Entertainment | 0 (0.0%) | 0 (0.0%) |
| Health Diagnosing & Treating | 0 (0.0%) | 0 (0.0%) |
| Health Technologists | 0 (0.0%) | 0 (0.0%) |
| Total (Category) | 14 (70.0%) | 6 (30.0%) |
| Total (Overall) | 123 (68.0%) | 58 (32.0%) |
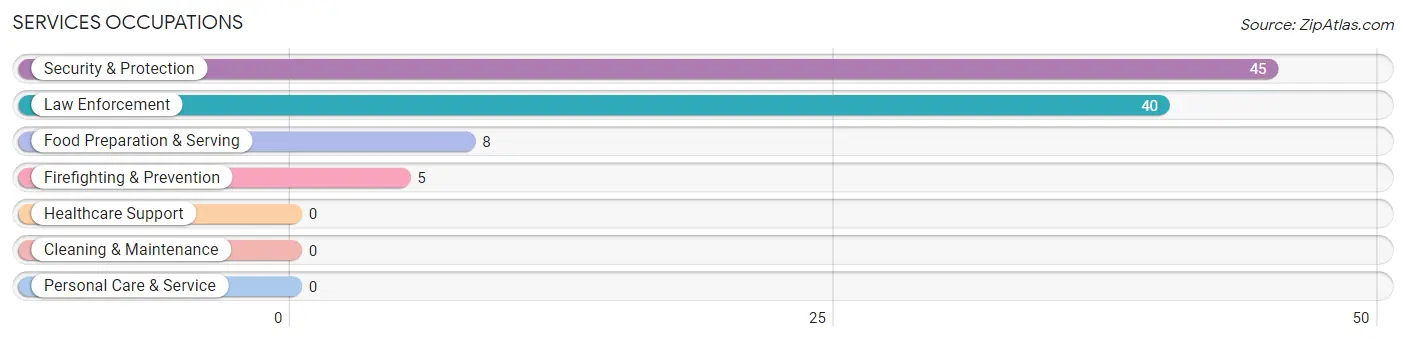
Services Occupations
The most common Services occupations in Laguna Seca are Security & Protection (45 | 24.9%), Law Enforcement (40 | 22.1%), Food Preparation & Serving (8 | 4.4%), and Firefighting & Prevention (5 | 2.8%).
Services Occupations by Sex
Within the Services occupations in Laguna Seca, the most male-oriented occupations are Firefighting & Prevention (100.0%), Food Preparation & Serving (100.0%), and Security & Protection (42.2%), while the most female-oriented occupations are Law Enforcement (65.0%), and Security & Protection (57.8%).
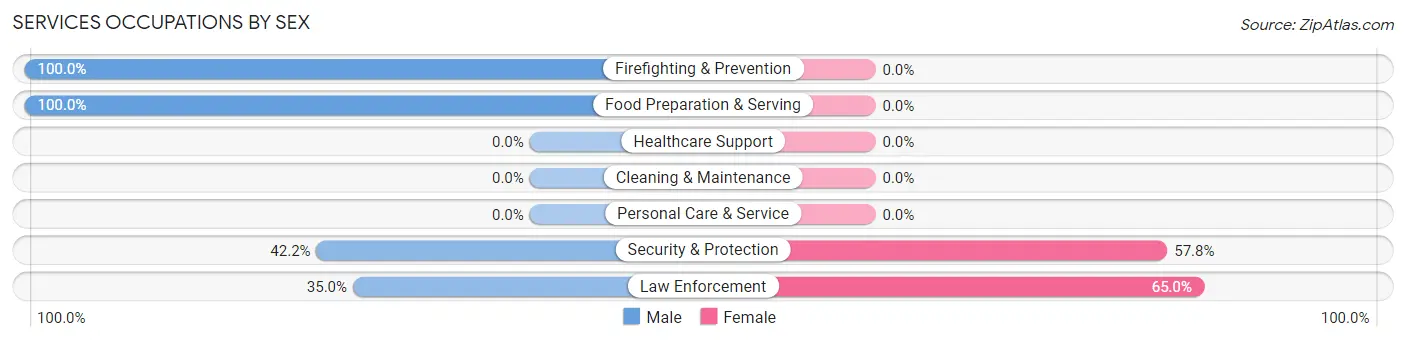
| Occupation | Male | Female |
| Healthcare Support | 0 (0.0%) | 0 (0.0%) |
| Security & Protection | 19 (42.2%) | 26 (57.8%) |
| Firefighting & Prevention | 5 (100.0%) | 0 (0.0%) |
| Law Enforcement | 14 (35.0%) | 26 (65.0%) |
| Food Preparation & Serving | 8 (100.0%) | 0 (0.0%) |
| Cleaning & Maintenance | 0 (0.0%) | 0 (0.0%) |
| Personal Care & Service | 0 (0.0%) | 0 (0.0%) |
| Total (Category) | 27 (50.9%) | 26 (49.1%) |
| Total (Overall) | 123 (68.0%) | 58 (32.0%) |
Sales and Office Occupations
The most common Sales and Office occupations in Laguna Seca are Office & Administration (46 | 25.4%), and Sales & Related (11 | 6.1%).
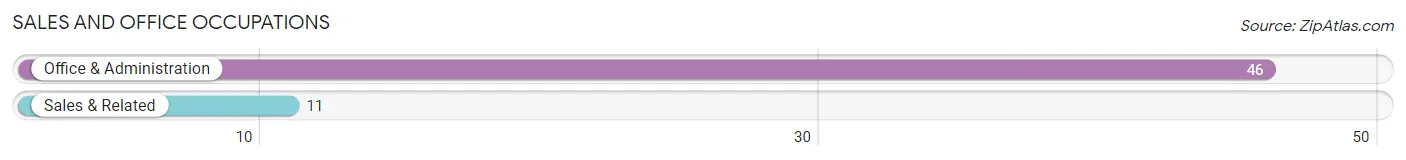
Sales and Office Occupations by Sex
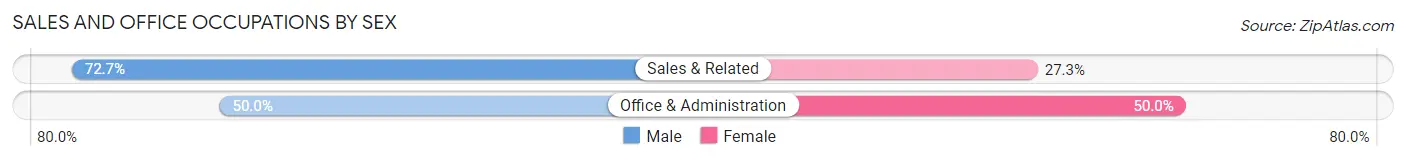
| Occupation | Male | Female |
| Sales & Related | 8 (72.7%) | 3 (27.3%) |
| Office & Administration | 23 (50.0%) | 23 (50.0%) |
| Total (Category) | 31 (54.4%) | 26 (45.6%) |
| Total (Overall) | 123 (68.0%) | 58 (32.0%) |
Natural Resources, Construction and Maintenance Occupations
The most common Natural Resources, Construction and Maintenance occupations in Laguna Seca are Construction & Extraction (27 | 14.9%), and Installation, Maintenance & Repair (13 | 7.2%).
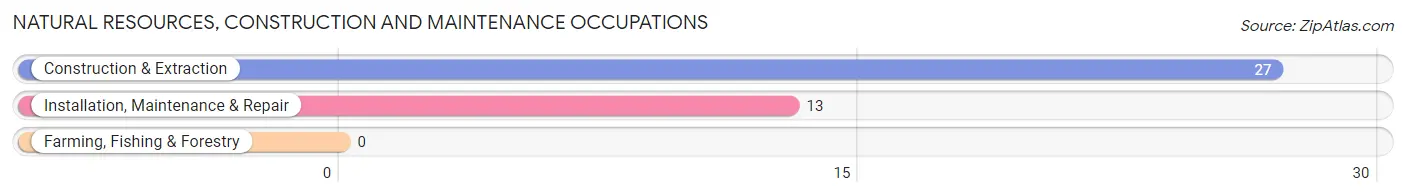
Natural Resources, Construction and Maintenance Occupations by Sex
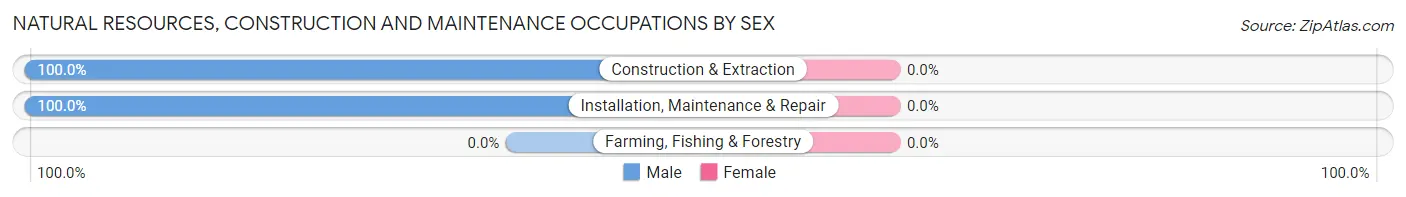
| Occupation | Male | Female |
| Farming, Fishing & Forestry | 0 (0.0%) | 0 (0.0%) |
| Construction & Extraction | 27 (100.0%) | 0 (0.0%) |
| Installation, Maintenance & Repair | 13 (100.0%) | 0 (0.0%) |
| Total (Category) | 40 (100.0%) | 0 (0.0%) |
| Total (Overall) | 123 (68.0%) | 58 (32.0%) |
Production, Transportation and Moving Occupations
The most common Production, Transportation and Moving occupations in Laguna Seca are Transportation (7 | 3.9%), and Material Moving (4 | 2.2%).
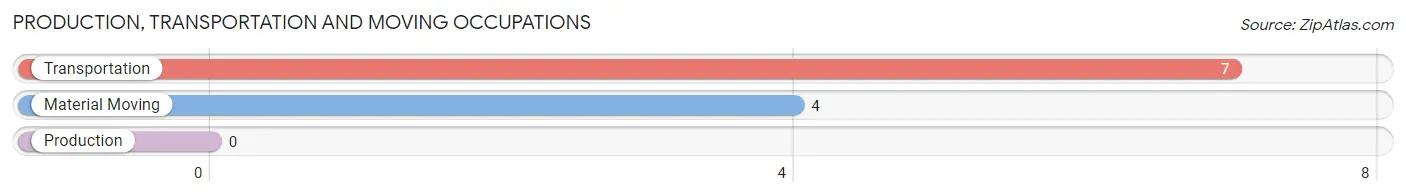
Production, Transportation and Moving Occupations by Sex
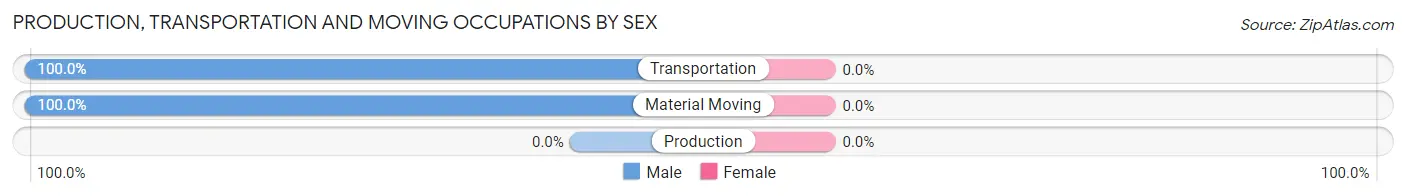
| Occupation | Male | Female |
| Production | 0 (0.0%) | 0 (0.0%) |
| Transportation | 7 (100.0%) | 0 (0.0%) |
| Material Moving | 4 (100.0%) | 0 (0.0%) |
| Total (Category) | 11 (100.0%) | 0 (0.0%) |
| Total (Overall) | 123 (68.0%) | 58 (32.0%) |
Employment Industries by Sex in Laguna Seca
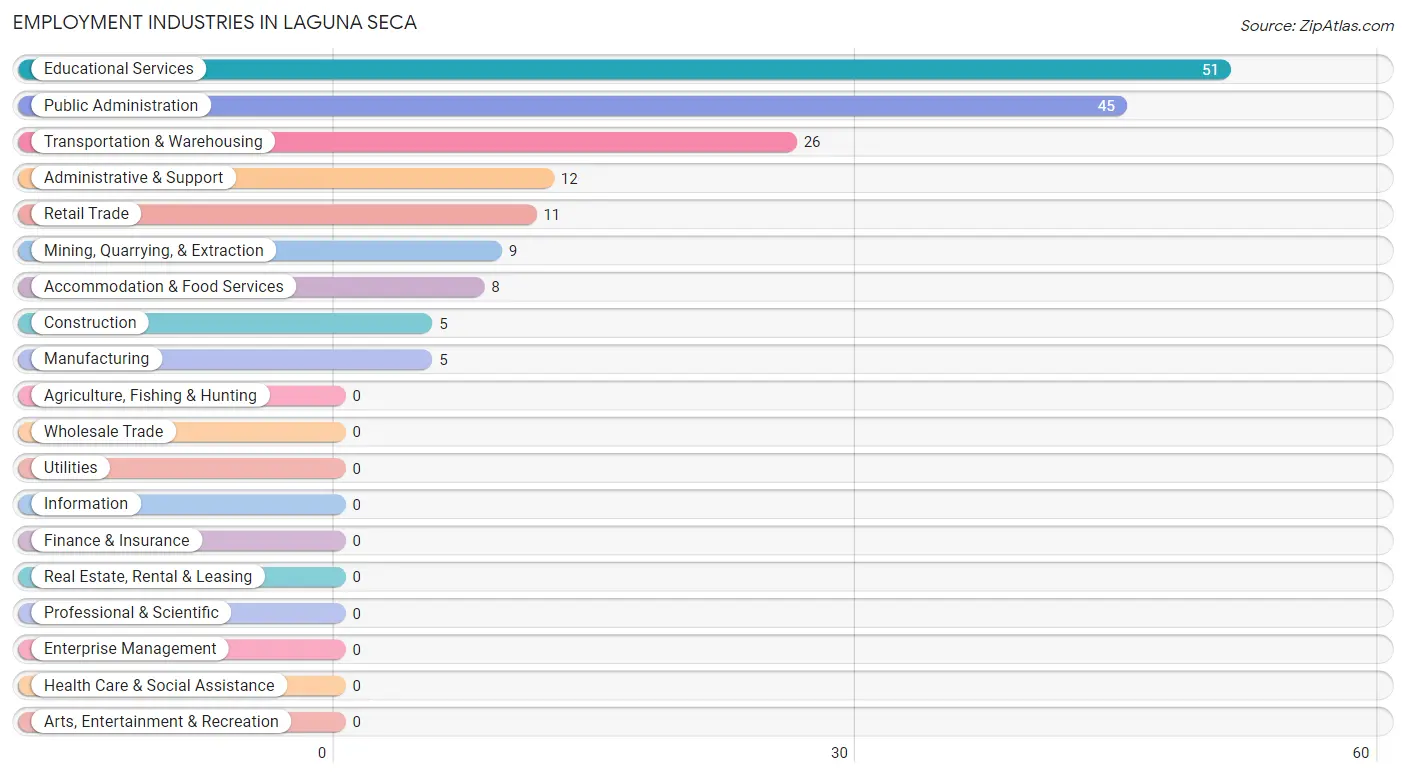
Employment Industries in Laguna Seca
The major employment industries in Laguna Seca include Educational Services (51 | 28.2%), Public Administration (45 | 24.9%), Transportation & Warehousing (26 | 14.4%), Administrative & Support (12 | 6.6%), and Retail Trade (11 | 6.1%).
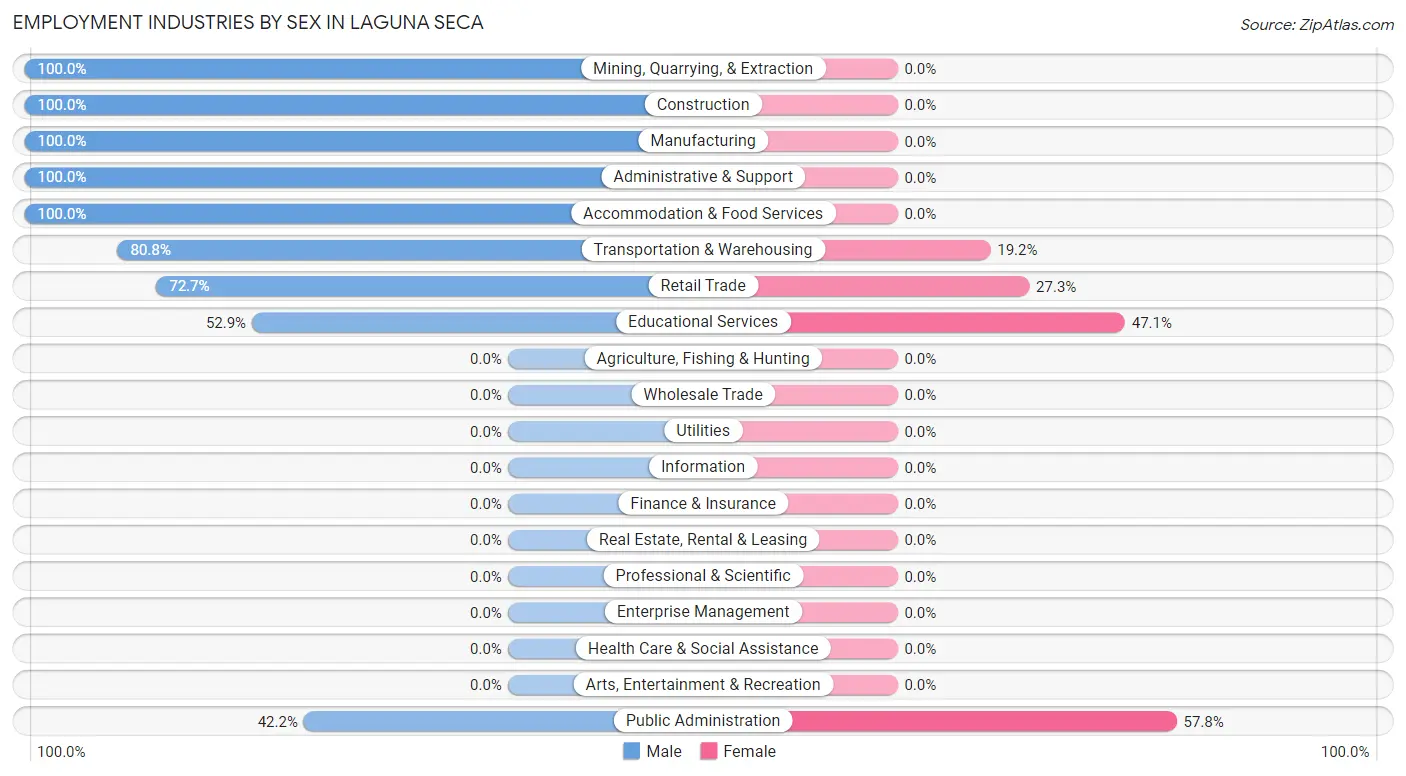
Employment Industries by Sex in Laguna Seca
The Laguna Seca industries that see more men than women are Mining, Quarrying, & Extraction (100.0%), Construction (100.0%), and Manufacturing (100.0%), whereas the industries that tend to have a higher number of women are Public Administration (57.8%), Educational Services (47.1%), and Retail Trade (27.3%).
| Industry | Male | Female |
| Agriculture, Fishing & Hunting | 0 (0.0%) | 0 (0.0%) |
| Mining, Quarrying, & Extraction | 9 (100.0%) | 0 (0.0%) |
| Construction | 5 (100.0%) | 0 (0.0%) |
| Manufacturing | 5 (100.0%) | 0 (0.0%) |
| Wholesale Trade | 0 (0.0%) | 0 (0.0%) |
| Retail Trade | 8 (72.7%) | 3 (27.3%) |
| Transportation & Warehousing | 21 (80.8%) | 5 (19.2%) |
| Utilities | 0 (0.0%) | 0 (0.0%) |
| Information | 0 (0.0%) | 0 (0.0%) |
| Finance & Insurance | 0 (0.0%) | 0 (0.0%) |
| Real Estate, Rental & Leasing | 0 (0.0%) | 0 (0.0%) |
| Professional & Scientific | 0 (0.0%) | 0 (0.0%) |
| Enterprise Management | 0 (0.0%) | 0 (0.0%) |
| Administrative & Support | 12 (100.0%) | 0 (0.0%) |
| Educational Services | 27 (52.9%) | 24 (47.1%) |
| Health Care & Social Assistance | 0 (0.0%) | 0 (0.0%) |
| Arts, Entertainment & Recreation | 0 (0.0%) | 0 (0.0%) |
| Accommodation & Food Services | 8 (100.0%) | 0 (0.0%) |
| Public Administration | 19 (42.2%) | 26 (57.8%) |
| Total | 123 (68.0%) | 58 (32.0%) |
Education in Laguna Seca
School Enrollment in Laguna Seca
The most common levels of schooling among the 57 students in Laguna Seca are college / undergraduate (34 | 59.7%), high school (15 | 26.3%), and elementary school (4 | 7.0%).
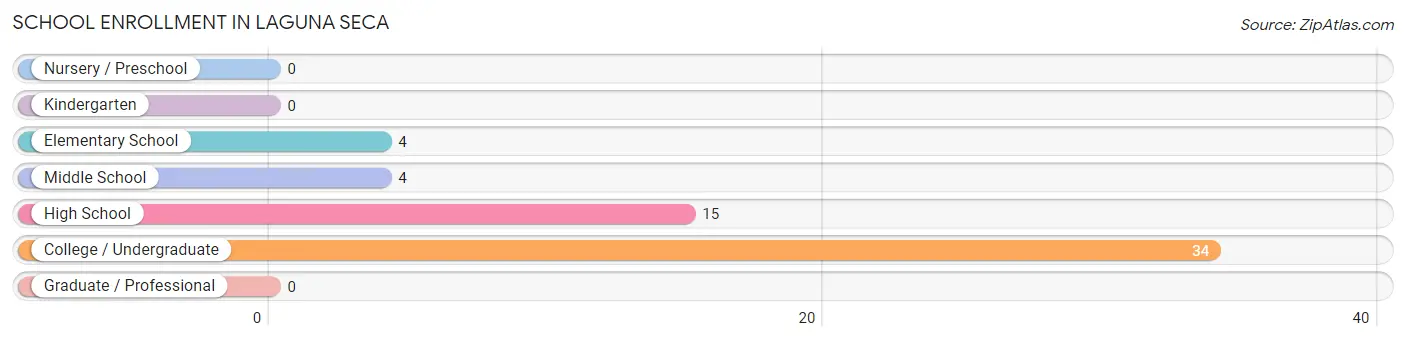
| School Level | # Students | % Students |
| Nursery / Preschool | 0 | 0.0% |
| Kindergarten | 0 | 0.0% |
| Elementary School | 4 | 7.0% |
| Middle School | 4 | 7.0% |
| High School | 15 | 26.3% |
| College / Undergraduate | 34 | 59.7% |
| Graduate / Professional | 0 | 0.0% |
| Total | 57 | 100.0% |
School Enrollment by Age by Funding Source in Laguna Seca
Out of a total of 57 students who are enrolled in schools in Laguna Seca, 29 (50.9%) attend a private institution, while the remaining 28 (49.1%) are enrolled in public schools. The age group of 20 to 24 year olds has the highest likelihood of being enrolled in private schools, with 16 (76.2% in the age bracket) enrolled. Conversely, the age group of 5 to 9 year old has the lowest likelihood of being enrolled in a private school, with 4 (100.0% in the age bracket) attending a public institution.
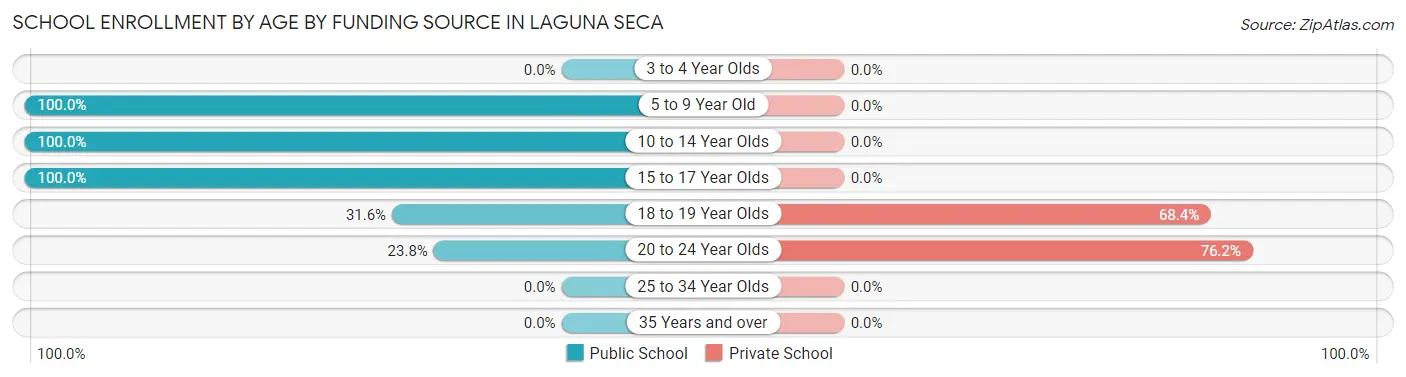
| Age Bracket | Public School | Private School |
| 3 to 4 Year Olds | 0 (0.0%) | 0 (0.0%) |
| 5 to 9 Year Old | 4 (100.0%) | 0 (0.0%) |
| 10 to 14 Year Olds | 4 (100.0%) | 0 (0.0%) |
| 15 to 17 Year Olds | 9 (100.0%) | 0 (0.0%) |
| 18 to 19 Year Olds | 6 (31.6%) | 13 (68.4%) |
| 20 to 24 Year Olds | 5 (23.8%) | 16 (76.2%) |
| 25 to 34 Year Olds | 0 (0.0%) | 0 (0.0%) |
| 35 Years and over | 0 (0.0%) | 0 (0.0%) |
| Total | 28 (49.1%) | 29 (50.9%) |
Educational Attainment by Field of Study in Laguna Seca
Computers & mathematics (14 | 45.2%), education (13 | 41.9%), and visual & performing arts (4 | 12.9%) are the most common fields of study among 31 individuals in Laguna Seca who have obtained a bachelor's degree or higher.
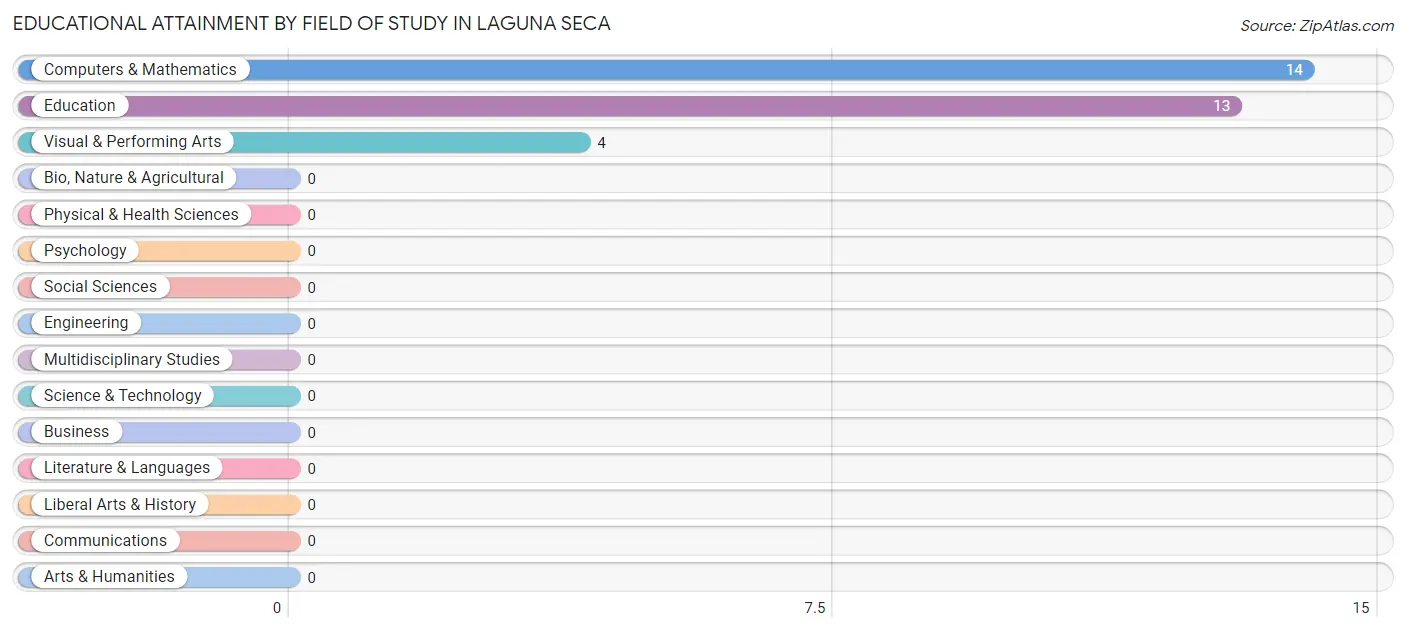
| Field of Study | # Graduates | % Graduates |
| Computers & Mathematics | 14 | 45.2% |
| Bio, Nature & Agricultural | 0 | 0.0% |
| Physical & Health Sciences | 0 | 0.0% |
| Psychology | 0 | 0.0% |
| Social Sciences | 0 | 0.0% |
| Engineering | 0 | 0.0% |
| Multidisciplinary Studies | 0 | 0.0% |
| Science & Technology | 0 | 0.0% |
| Business | 0 | 0.0% |
| Education | 13 | 41.9% |
| Literature & Languages | 0 | 0.0% |
| Liberal Arts & History | 0 | 0.0% |
| Visual & Performing Arts | 4 | 12.9% |
| Communications | 0 | 0.0% |
| Arts & Humanities | 0 | 0.0% |
| Total | 31 | 100.0% |
Transportation & Commute in Laguna Seca
Vehicle Availability by Sex in Laguna Seca
The most prevalent vehicle ownership categories in Laguna Seca are males with 3 vehicles (64, accounting for 52.0%) and females with 3 vehicles (44, making up 110.3%).
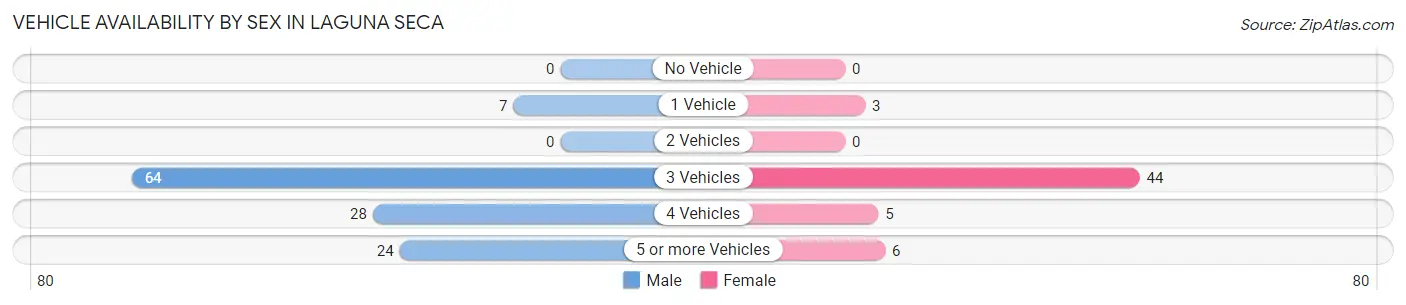
| Vehicles Available | Male | Female |
| No Vehicle | 0 (0.0%) | 0 (0.0%) |
| 1 Vehicle | 7 (5.7%) | 3 (5.2%) |
| 2 Vehicles | 0 (0.0%) | 0 (0.0%) |
| 3 Vehicles | 64 (52.0%) | 44 (75.9%) |
| 4 Vehicles | 28 (22.8%) | 5 (8.6%) |
| 5 or more Vehicles | 24 (19.5%) | 6 (10.3%) |
| Total | 123 (100.0%) | 58 (100.0%) |
Commute Time in Laguna Seca
The most frequently occuring commute durations in Laguna Seca are 5 to 9 minutes (43 commuters, 23.8%), 45 to 59 minutes (26 commuters, 14.4%), and 30 to 34 minutes (24 commuters, 13.3%).
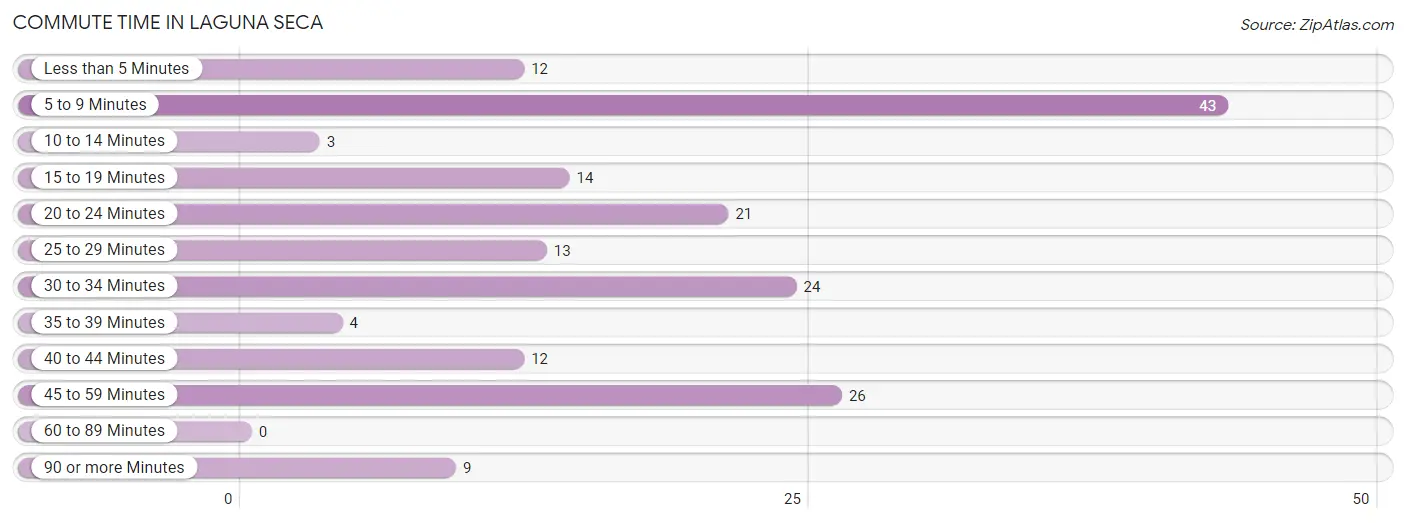
| Commute Time | # Commuters | % Commuters |
| Less than 5 Minutes | 12 | 6.6% |
| 5 to 9 Minutes | 43 | 23.8% |
| 10 to 14 Minutes | 3 | 1.7% |
| 15 to 19 Minutes | 14 | 7.7% |
| 20 to 24 Minutes | 21 | 11.6% |
| 25 to 29 Minutes | 13 | 7.2% |
| 30 to 34 Minutes | 24 | 13.3% |
| 35 to 39 Minutes | 4 | 2.2% |
| 40 to 44 Minutes | 12 | 6.6% |
| 45 to 59 Minutes | 26 | 14.4% |
| 60 to 89 Minutes | 0 | 0.0% |
| 90 or more Minutes | 9 | 5.0% |
Commute Time by Sex in Laguna Seca
The most common commute times in Laguna Seca are 5 to 9 minutes (27 commuters, 22.0%) for males and 45 to 59 minutes (18 commuters, 31.0%) for females.
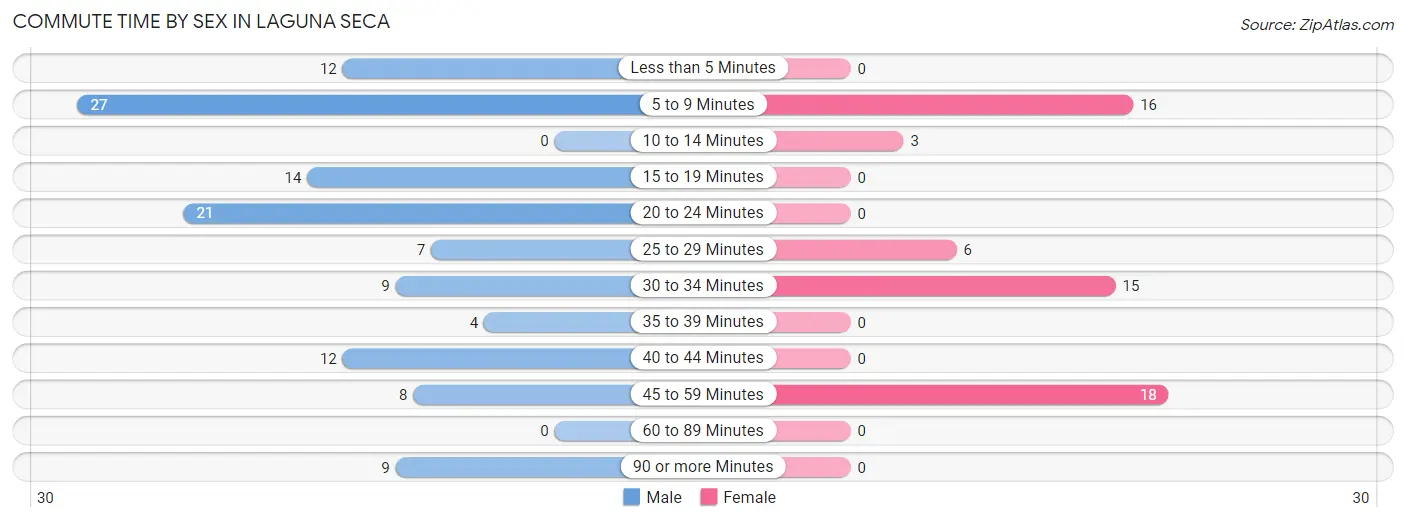
| Commute Time | Male | Female |
| Less than 5 Minutes | 12 (9.8%) | 0 (0.0%) |
| 5 to 9 Minutes | 27 (22.0%) | 16 (27.6%) |
| 10 to 14 Minutes | 0 (0.0%) | 3 (5.2%) |
| 15 to 19 Minutes | 14 (11.4%) | 0 (0.0%) |
| 20 to 24 Minutes | 21 (17.1%) | 0 (0.0%) |
| 25 to 29 Minutes | 7 (5.7%) | 6 (10.3%) |
| 30 to 34 Minutes | 9 (7.3%) | 15 (25.9%) |
| 35 to 39 Minutes | 4 (3.3%) | 0 (0.0%) |
| 40 to 44 Minutes | 12 (9.8%) | 0 (0.0%) |
| 45 to 59 Minutes | 8 (6.5%) | 18 (31.0%) |
| 60 to 89 Minutes | 0 (0.0%) | 0 (0.0%) |
| 90 or more Minutes | 9 (7.3%) | 0 (0.0%) |
Time of Departure to Work by Sex in Laguna Seca
The most frequent times of departure to work in Laguna Seca are 7:00 AM to 7:29 AM (26, 21.1%) for males and 7:30 AM to 7:59 AM (16, 27.6%) for females.
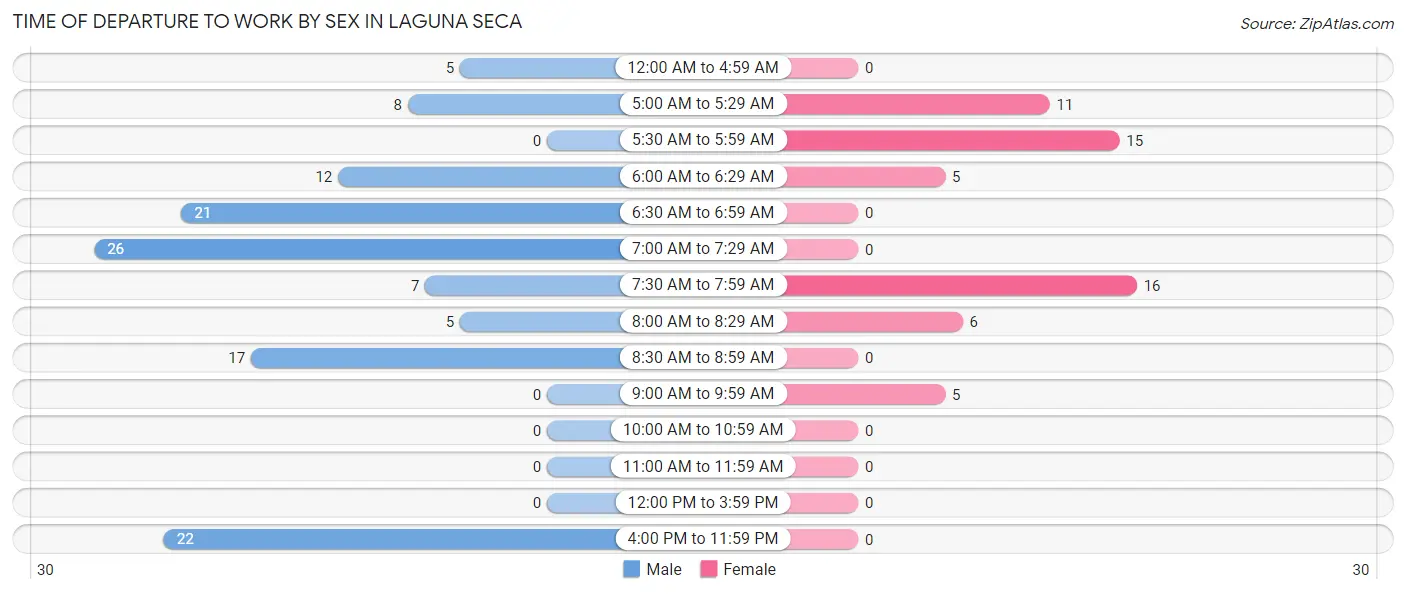
| Time of Departure | Male | Female |
| 12:00 AM to 4:59 AM | 5 (4.1%) | 0 (0.0%) |
| 5:00 AM to 5:29 AM | 8 (6.5%) | 11 (19.0%) |
| 5:30 AM to 5:59 AM | 0 (0.0%) | 15 (25.9%) |
| 6:00 AM to 6:29 AM | 12 (9.8%) | 5 (8.6%) |
| 6:30 AM to 6:59 AM | 21 (17.1%) | 0 (0.0%) |
| 7:00 AM to 7:29 AM | 26 (21.1%) | 0 (0.0%) |
| 7:30 AM to 7:59 AM | 7 (5.7%) | 16 (27.6%) |
| 8:00 AM to 8:29 AM | 5 (4.1%) | 6 (10.3%) |
| 8:30 AM to 8:59 AM | 17 (13.8%) | 0 (0.0%) |
| 9:00 AM to 9:59 AM | 0 (0.0%) | 5 (8.6%) |
| 10:00 AM to 10:59 AM | 0 (0.0%) | 0 (0.0%) |
| 11:00 AM to 11:59 AM | 0 (0.0%) | 0 (0.0%) |
| 12:00 PM to 3:59 PM | 0 (0.0%) | 0 (0.0%) |
| 4:00 PM to 11:59 PM | 22 (17.9%) | 0 (0.0%) |
| Total | 123 (100.0%) | 58 (100.0%) |
Housing Occupancy in Laguna Seca
Occupancy by Ownership in Laguna Seca
Of the total 71 dwellings in Laguna Seca, owner-occupied units account for 67 (94.4%), while renter-occupied units make up 4 (5.6%).
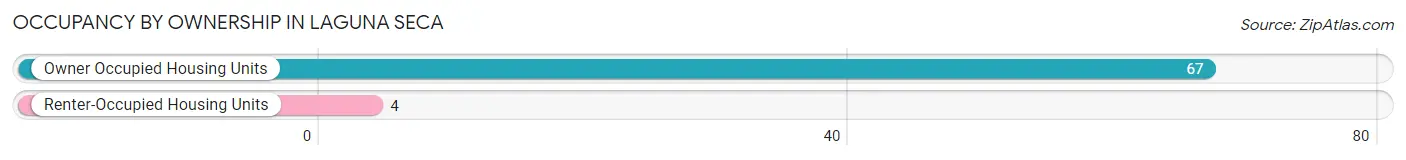
| Occupancy | # Housing Units | % Housing Units |
| Owner Occupied Housing Units | 67 | 94.4% |
| Renter-Occupied Housing Units | 4 | 5.6% |
| Total Occupied Housing Units | 71 | 100.0% |
Occupancy by Household Size in Laguna Seca
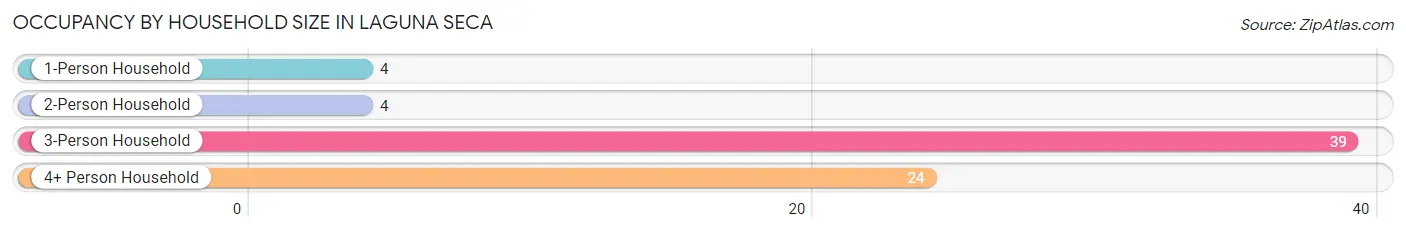
| Household Size | # Housing Units | % Housing Units |
| 1-Person Household | 4 | 5.6% |
| 2-Person Household | 4 | 5.6% |
| 3-Person Household | 39 | 54.9% |
| 4+ Person Household | 24 | 33.8% |
| Total Housing Units | 71 | 100.0% |
Occupancy by Ownership by Household Size in Laguna Seca
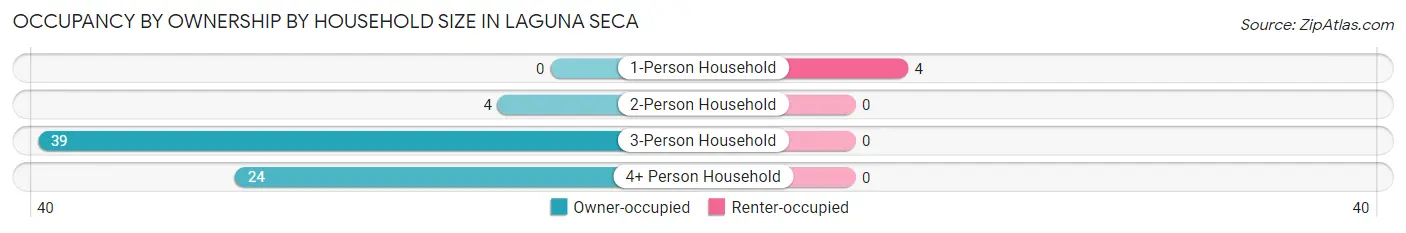
| Household Size | Owner-occupied | Renter-occupied |
| 1-Person Household | 0 (0.0%) | 4 (100.0%) |
| 2-Person Household | 4 (100.0%) | 0 (0.0%) |
| 3-Person Household | 39 (100.0%) | 0 (0.0%) |
| 4+ Person Household | 24 (100.0%) | 0 (0.0%) |
| Total Housing Units | 67 (94.4%) | 4 (5.6%) |
Occupancy by Educational Attainment in Laguna Seca
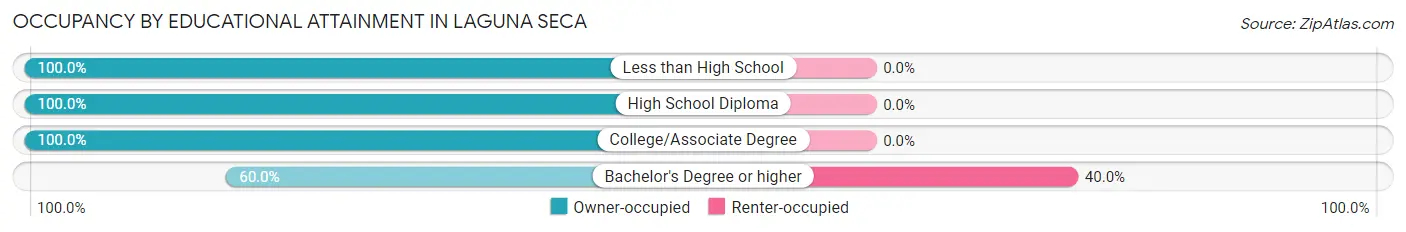
| Household Size | Owner-occupied | Renter-occupied |
| Less than High School | 16 (100.0%) | 0 (0.0%) |
| High School Diploma | 28 (100.0%) | 0 (0.0%) |
| College/Associate Degree | 17 (100.0%) | 0 (0.0%) |
| Bachelor's Degree or higher | 6 (60.0%) | 4 (40.0%) |
Occupancy by Age of Householder in Laguna Seca
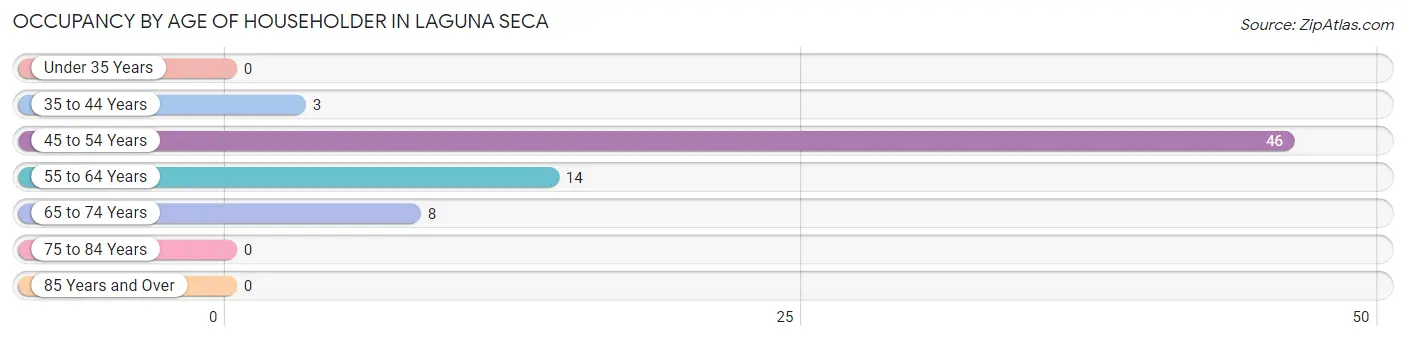
| Age Bracket | # Households | % Households |
| Under 35 Years | 0 | 0.0% |
| 35 to 44 Years | 3 | 4.2% |
| 45 to 54 Years | 46 | 64.8% |
| 55 to 64 Years | 14 | 19.7% |
| 65 to 74 Years | 8 | 11.3% |
| 75 to 84 Years | 0 | 0.0% |
| 85 Years and Over | 0 | 0.0% |
| Total | 71 | 100.0% |
Housing Finances in Laguna Seca
Median Income by Occupancy in Laguna Seca
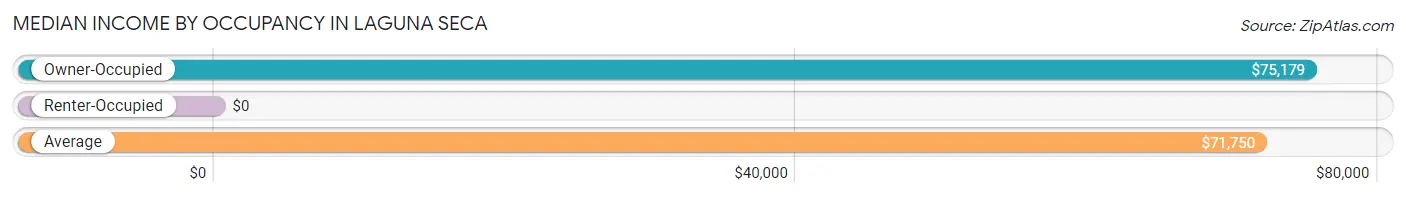
| Occupancy Type | # Households | Median Income |
| Owner-Occupied | 67 (94.4%) | $75,179 |
| Renter-Occupied | 4 (5.6%) | $0 |
| Average | 71 (100.0%) | $71,750 |
Occupancy by Householder Income Bracket in Laguna Seca
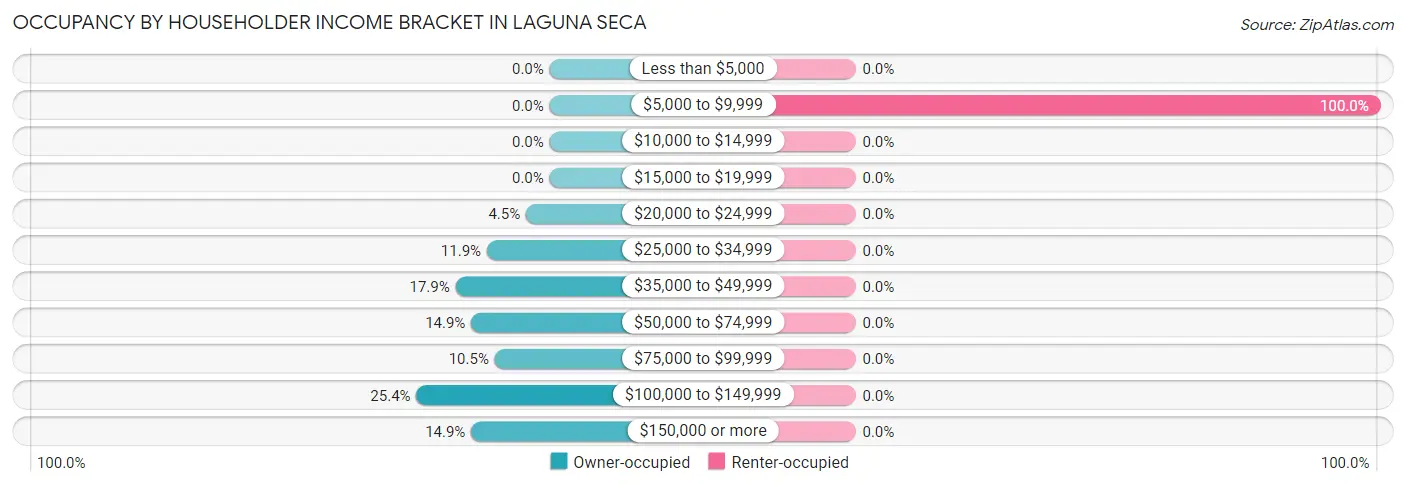
| Income Bracket | Owner-occupied | Renter-occupied |
| Less than $5,000 | 0 (0.0%) | 0 (0.0%) |
| $5,000 to $9,999 | 0 (0.0%) | 4 (100.0%) |
| $10,000 to $14,999 | 0 (0.0%) | 0 (0.0%) |
| $15,000 to $19,999 | 0 (0.0%) | 0 (0.0%) |
| $20,000 to $24,999 | 3 (4.5%) | 0 (0.0%) |
| $25,000 to $34,999 | 8 (11.9%) | 0 (0.0%) |
| $35,000 to $49,999 | 12 (17.9%) | 0 (0.0%) |
| $50,000 to $74,999 | 10 (14.9%) | 0 (0.0%) |
| $75,000 to $99,999 | 7 (10.4%) | 0 (0.0%) |
| $100,000 to $149,999 | 17 (25.4%) | 0 (0.0%) |
| $150,000 or more | 10 (14.9%) | 0 (0.0%) |
| Total | 67 (100.0%) | 4 (100.0%) |
Monthly Housing Cost Tiers in Laguna Seca
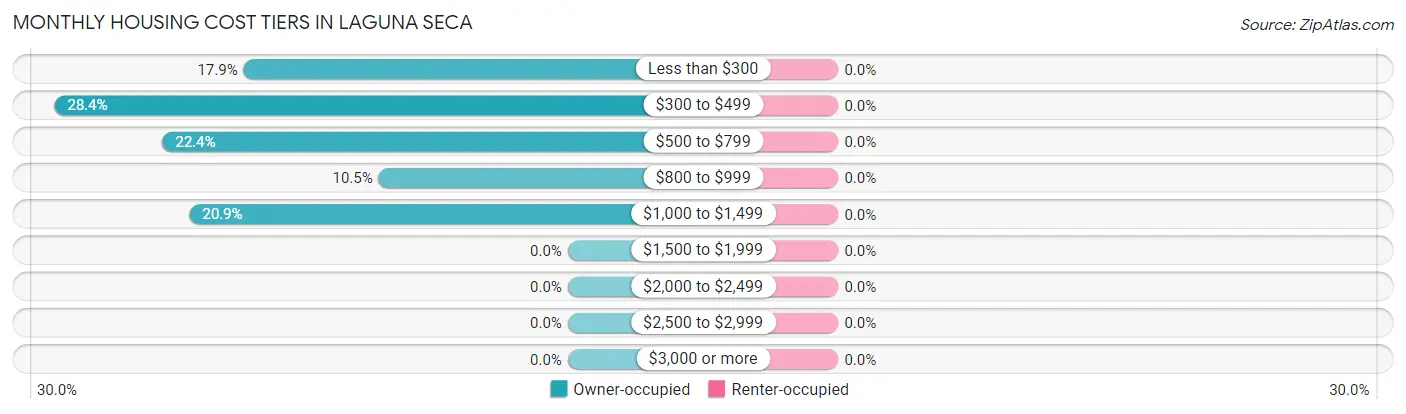
| Monthly Cost | Owner-occupied | Renter-occupied |
| Less than $300 | 12 (17.9%) | 0 (0.0%) |
| $300 to $499 | 19 (28.4%) | 0 (0.0%) |
| $500 to $799 | 15 (22.4%) | 0 (0.0%) |
| $800 to $999 | 7 (10.4%) | 0 (0.0%) |
| $1,000 to $1,499 | 14 (20.9%) | 0 (0.0%) |
| $1,500 to $1,999 | 0 (0.0%) | 0 (0.0%) |
| $2,000 to $2,499 | 0 (0.0%) | 0 (0.0%) |
| $2,500 to $2,999 | 0 (0.0%) | 0 (0.0%) |
| $3,000 or more | 0 (0.0%) | 0 (0.0%) |
| Total | 67 (100.0%) | 4 (100.0%) |
Physical Housing Characteristics in Laguna Seca
Housing Structures in Laguna Seca
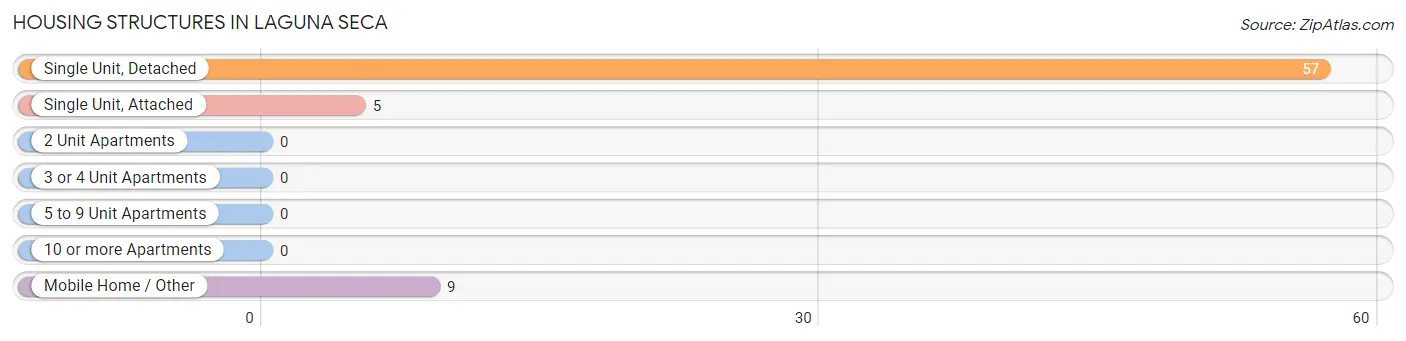
| Structure Type | # Housing Units | % Housing Units |
| Single Unit, Detached | 57 | 80.3% |
| Single Unit, Attached | 5 | 7.0% |
| 2 Unit Apartments | 0 | 0.0% |
| 3 or 4 Unit Apartments | 0 | 0.0% |
| 5 to 9 Unit Apartments | 0 | 0.0% |
| 10 or more Apartments | 0 | 0.0% |
| Mobile Home / Other | 9 | 12.7% |
| Total | 71 | 100.0% |
Housing Structures by Occupancy in Laguna Seca
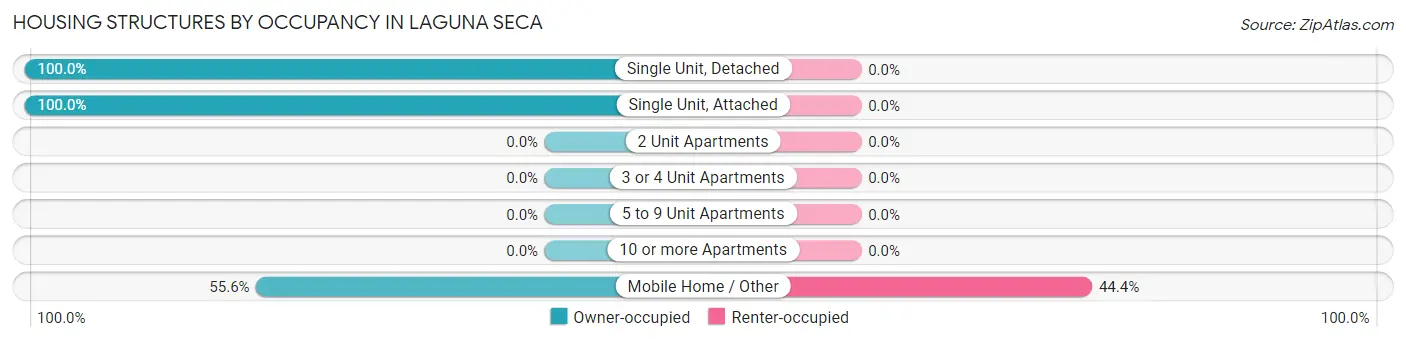
| Structure Type | Owner-occupied | Renter-occupied |
| Single Unit, Detached | 57 (100.0%) | 0 (0.0%) |
| Single Unit, Attached | 5 (100.0%) | 0 (0.0%) |
| 2 Unit Apartments | 0 (0.0%) | 0 (0.0%) |
| 3 or 4 Unit Apartments | 0 (0.0%) | 0 (0.0%) |
| 5 to 9 Unit Apartments | 0 (0.0%) | 0 (0.0%) |
| 10 or more Apartments | 0 (0.0%) | 0 (0.0%) |
| Mobile Home / Other | 5 (55.6%) | 4 (44.4%) |
| Total | 67 (94.4%) | 4 (5.6%) |
Housing Structures by Number of Rooms in Laguna Seca
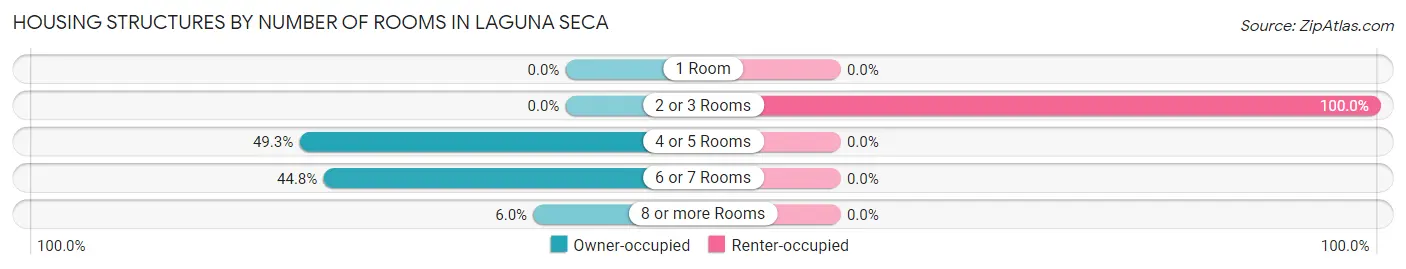
| Number of Rooms | Owner-occupied | Renter-occupied |
| 1 Room | 0 (0.0%) | 0 (0.0%) |
| 2 or 3 Rooms | 0 (0.0%) | 4 (100.0%) |
| 4 or 5 Rooms | 33 (49.2%) | 0 (0.0%) |
| 6 or 7 Rooms | 30 (44.8%) | 0 (0.0%) |
| 8 or more Rooms | 4 (6.0%) | 0 (0.0%) |
| Total | 67 (100.0%) | 4 (100.0%) |
Housing Structure by Heating Type in Laguna Seca
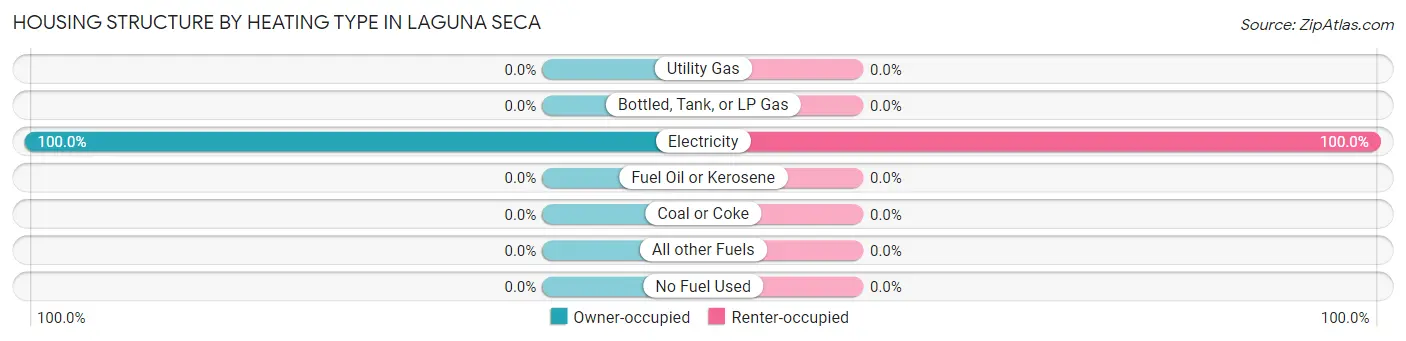
| Heating Type | Owner-occupied | Renter-occupied |
| Utility Gas | 0 (0.0%) | 0 (0.0%) |
| Bottled, Tank, or LP Gas | 0 (0.0%) | 0 (0.0%) |
| Electricity | 67 (100.0%) | 4 (100.0%) |
| Fuel Oil or Kerosene | 0 (0.0%) | 0 (0.0%) |
| Coal or Coke | 0 (0.0%) | 0 (0.0%) |
| All other Fuels | 0 (0.0%) | 0 (0.0%) |
| No Fuel Used | 0 (0.0%) | 0 (0.0%) |
| Total | 67 (100.0%) | 4 (100.0%) |
Household Vehicle Usage in Laguna Seca
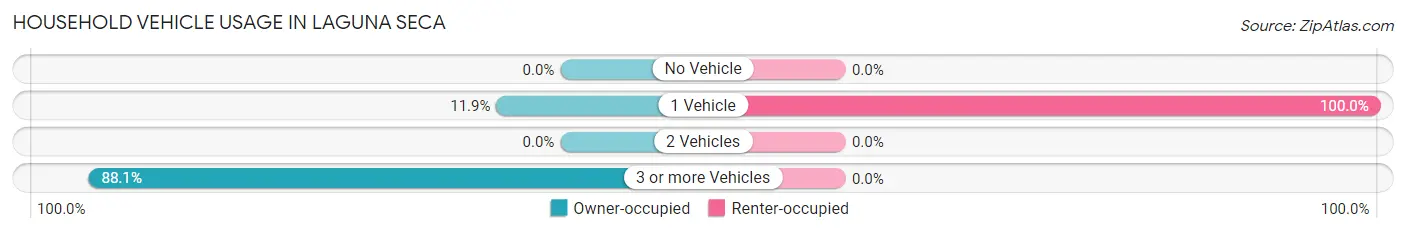
| Vehicles per Household | Owner-occupied | Renter-occupied |
| No Vehicle | 0 (0.0%) | 0 (0.0%) |
| 1 Vehicle | 8 (11.9%) | 4 (100.0%) |
| 2 Vehicles | 0 (0.0%) | 0 (0.0%) |
| 3 or more Vehicles | 59 (88.1%) | 0 (0.0%) |
| Total | 67 (100.0%) | 4 (100.0%) |
Real Estate & Mortgages in Laguna Seca
Real Estate and Mortgage Overview in Laguna Seca
| Characteristic | Without Mortgage | With Mortgage |
| Housing Units | 46 | 21 |
| Median Property Value | - | - |
| Median Household Income | - | - |
| Monthly Housing Costs | $411 | $0 |
| Real Estate Taxes | - | - |
Property Value by Mortgage Status in Laguna Seca
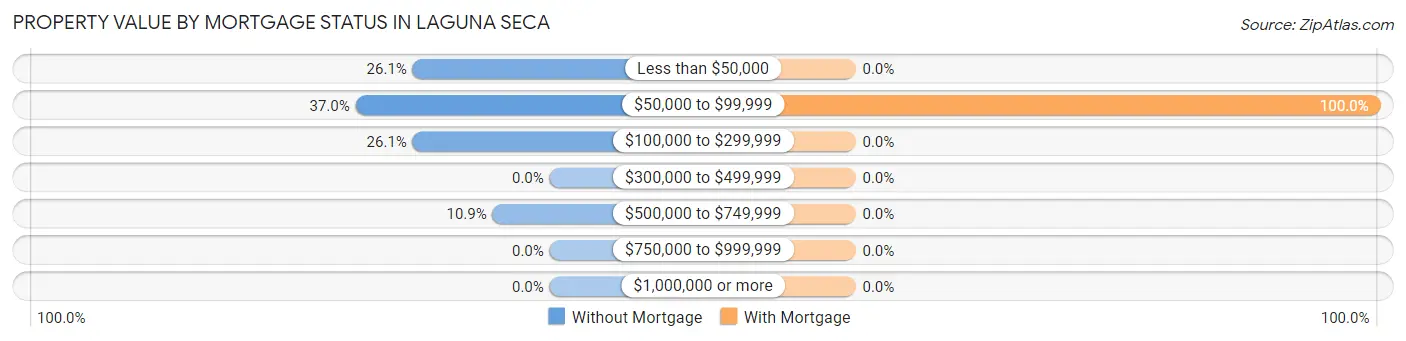
| Property Value | Without Mortgage | With Mortgage |
| Less than $50,000 | 12 (26.1%) | 0 (0.0%) |
| $50,000 to $99,999 | 17 (37.0%) | 21 (100.0%) |
| $100,000 to $299,999 | 12 (26.1%) | 0 (0.0%) |
| $300,000 to $499,999 | 0 (0.0%) | 0 (0.0%) |
| $500,000 to $749,999 | 5 (10.9%) | 0 (0.0%) |
| $750,000 to $999,999 | 0 (0.0%) | 0 (0.0%) |
| $1,000,000 or more | 0 (0.0%) | 0 (0.0%) |
| Total | 46 (100.0%) | 21 (100.0%) |
Household Income by Mortgage Status in Laguna Seca
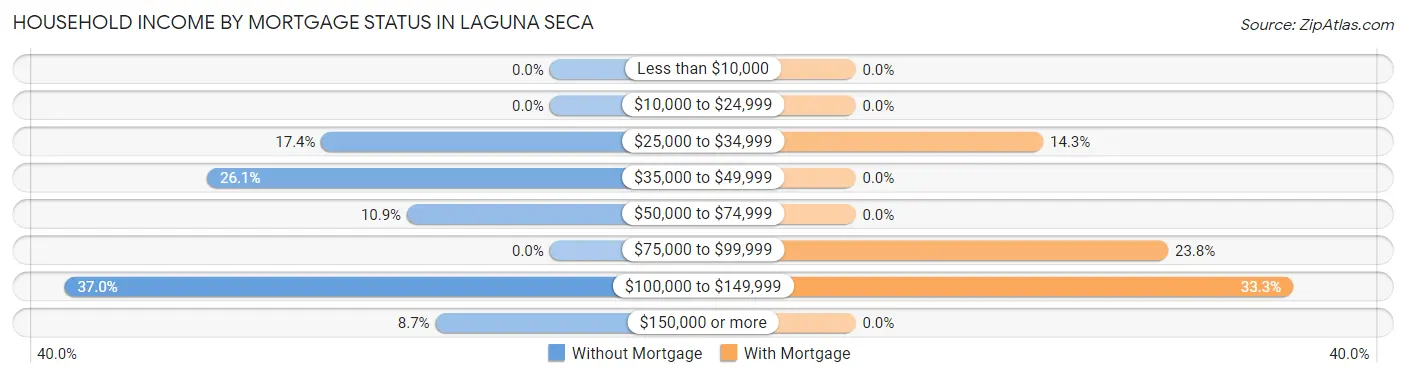
| Household Income | Without Mortgage | With Mortgage |
| Less than $10,000 | 0 (0.0%) | 0 (0.0%) |
| $10,000 to $24,999 | 0 (0.0%) | 0 (0.0%) |
| $25,000 to $34,999 | 8 (17.4%) | 3 (14.3%) |
| $35,000 to $49,999 | 12 (26.1%) | 0 (0.0%) |
| $50,000 to $74,999 | 5 (10.9%) | 0 (0.0%) |
| $75,000 to $99,999 | 0 (0.0%) | 5 (23.8%) |
| $100,000 to $149,999 | 17 (37.0%) | 7 (33.3%) |
| $150,000 or more | 4 (8.7%) | 0 (0.0%) |
| Total | 46 (100.0%) | 21 (100.0%) |
Property Value to Household Income Ratio in Laguna Seca
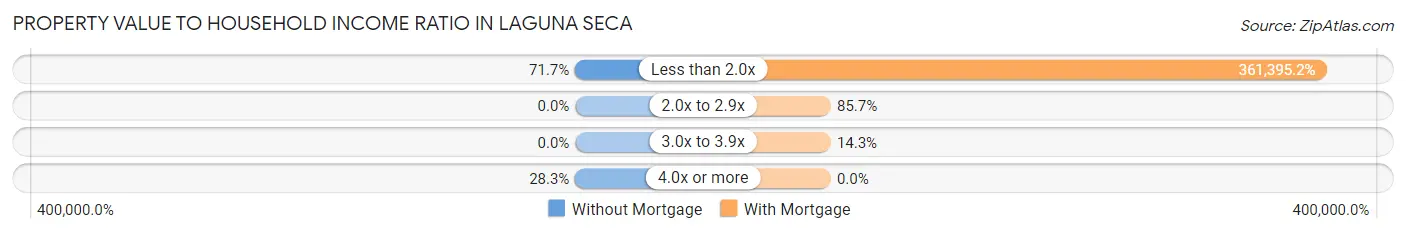
| Value-to-Income Ratio | Without Mortgage | With Mortgage |
| Less than 2.0x | 33 (71.7%) | 75,893 (361,395.2%) |
| 2.0x to 2.9x | 0 (0.0%) | 18 (85.7%) |
| 3.0x to 3.9x | 0 (0.0%) | 3 (14.3%) |
| 4.0x or more | 13 (28.3%) | 0 (0.0%) |
| Total | 46 (100.0%) | 21 (100.0%) |
Real Estate Taxes by Mortgage Status in Laguna Seca
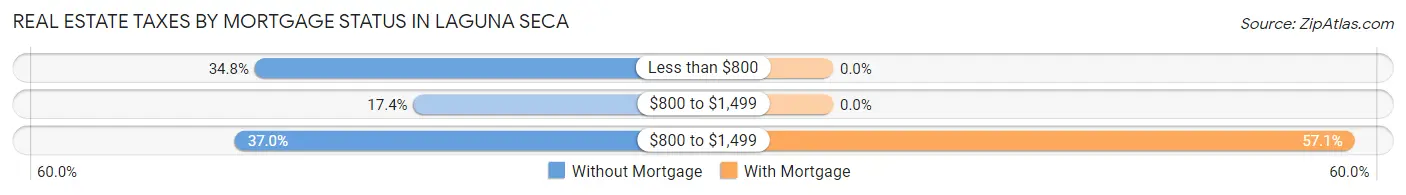
| Property Taxes | Without Mortgage | With Mortgage |
| Less than $800 | 16 (34.8%) | 0 (0.0%) |
| $800 to $1,499 | 8 (17.4%) | 0 (0.0%) |
| $800 to $1,499 | 17 (37.0%) | 12 (57.1%) |
| Total | 46 (100.0%) | 21 (100.0%) |
Health & Disability in Laguna Seca
Health Insurance Coverage by Age in Laguna Seca
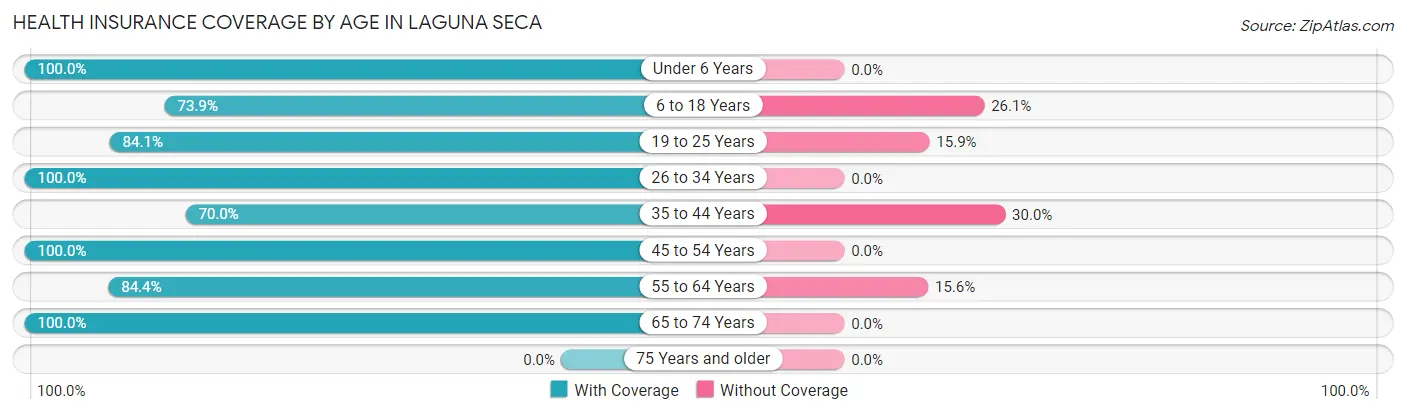
| Age Bracket | With Coverage | Without Coverage |
| Under 6 Years | 22 (100.0%) | 0 (0.0%) |
| 6 to 18 Years | 17 (73.9%) | 6 (26.1%) |
| 19 to 25 Years | 53 (84.1%) | 10 (15.9%) |
| 26 to 34 Years | 49 (100.0%) | 0 (0.0%) |
| 35 to 44 Years | 7 (70.0%) | 3 (30.0%) |
| 45 to 54 Years | 61 (100.0%) | 0 (0.0%) |
| 55 to 64 Years | 27 (84.4%) | 5 (15.6%) |
| 65 to 74 Years | 17 (100.0%) | 0 (0.0%) |
| 75 Years and older | 0 (0.0%) | 0 (0.0%) |
| Total | 253 (91.3%) | 24 (8.7%) |
Health Insurance Coverage by Citizenship Status in Laguna Seca
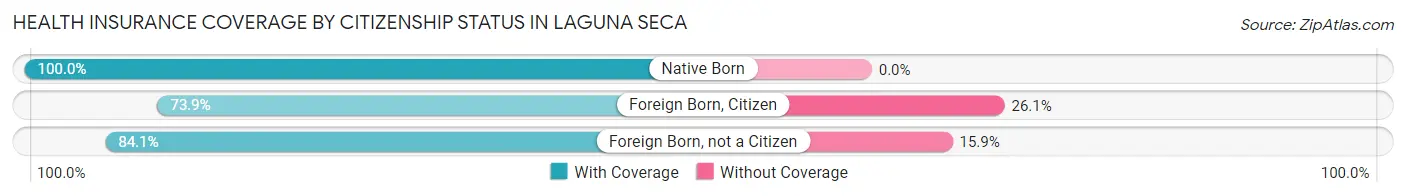
| Citizenship Status | With Coverage | Without Coverage |
| Native Born | 22 (100.0%) | 0 (0.0%) |
| Foreign Born, Citizen | 17 (73.9%) | 6 (26.1%) |
| Foreign Born, not a Citizen | 53 (84.1%) | 10 (15.9%) |
Health Insurance Coverage by Household Income in Laguna Seca
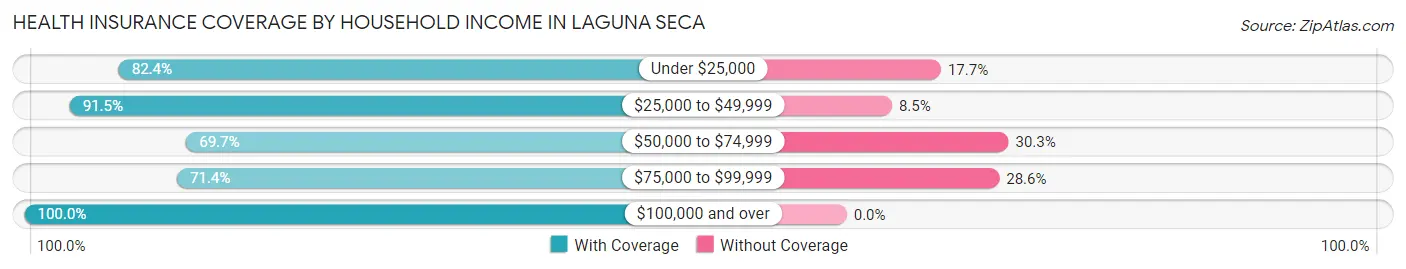
| Household Income | With Coverage | Without Coverage |
| Under $25,000 | 14 (82.4%) | 3 (17.6%) |
| $25,000 to $49,999 | 54 (91.5%) | 5 (8.5%) |
| $50,000 to $74,999 | 23 (69.7%) | 10 (30.3%) |
| $75,000 to $99,999 | 15 (71.4%) | 6 (28.6%) |
| $100,000 and over | 147 (100.0%) | 0 (0.0%) |
Public vs Private Health Insurance Coverage by Age in Laguna Seca
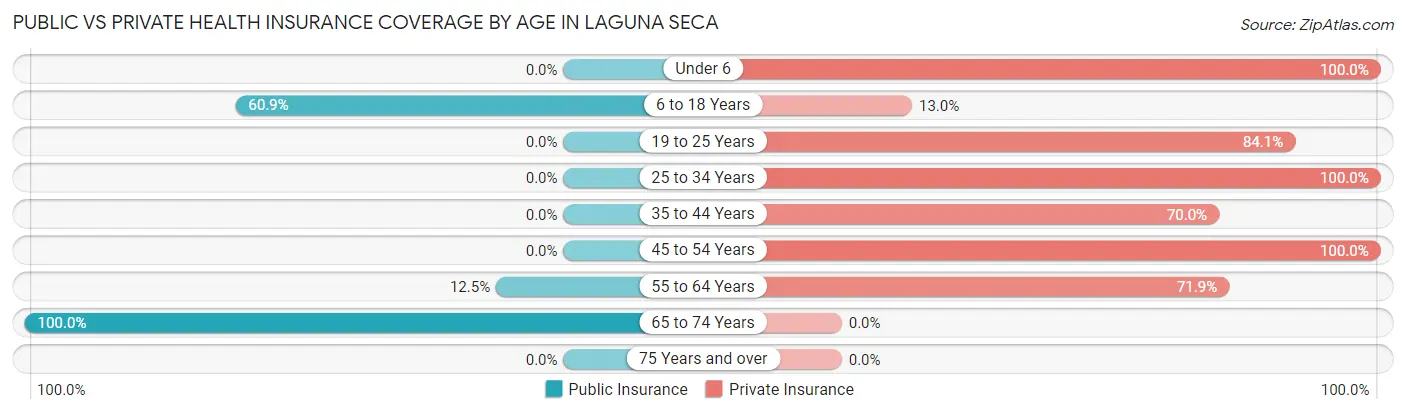
| Age Bracket | Public Insurance | Private Insurance |
| Under 6 | 0 (0.0%) | 22 (100.0%) |
| 6 to 18 Years | 14 (60.9%) | 3 (13.0%) |
| 19 to 25 Years | 0 (0.0%) | 53 (84.1%) |
| 25 to 34 Years | 0 (0.0%) | 49 (100.0%) |
| 35 to 44 Years | 0 (0.0%) | 7 (70.0%) |
| 45 to 54 Years | 0 (0.0%) | 61 (100.0%) |
| 55 to 64 Years | 4 (12.5%) | 23 (71.9%) |
| 65 to 74 Years | 17 (100.0%) | 0 (0.0%) |
| 75 Years and over | 0 (0.0%) | 0 (0.0%) |
| Total | 35 (12.6%) | 218 (78.7%) |
Disability Status by Sex by Age in Laguna Seca
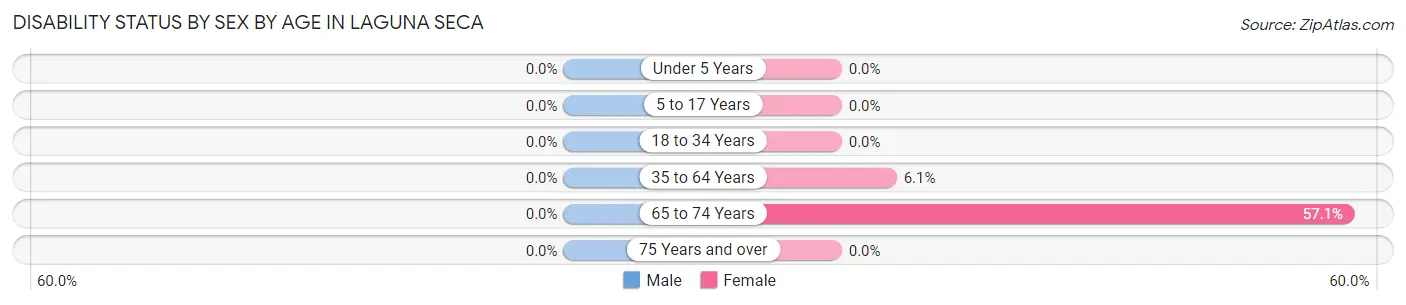
| Age Bracket | Male | Female |
| Under 5 Years | 0 (0.0%) | 0 (0.0%) |
| 5 to 17 Years | 0 (0.0%) | 0 (0.0%) |
| 18 to 34 Years | 0 (0.0%) | 0 (0.0%) |
| 35 to 64 Years | 0 (0.0%) | 3 (6.1%) |
| 65 to 74 Years | 0 (0.0%) | 4 (57.1%) |
| 75 Years and over | 0 (0.0%) | 0 (0.0%) |
Disability Class by Sex by Age in Laguna Seca
Disability Class: Hearing Difficulty
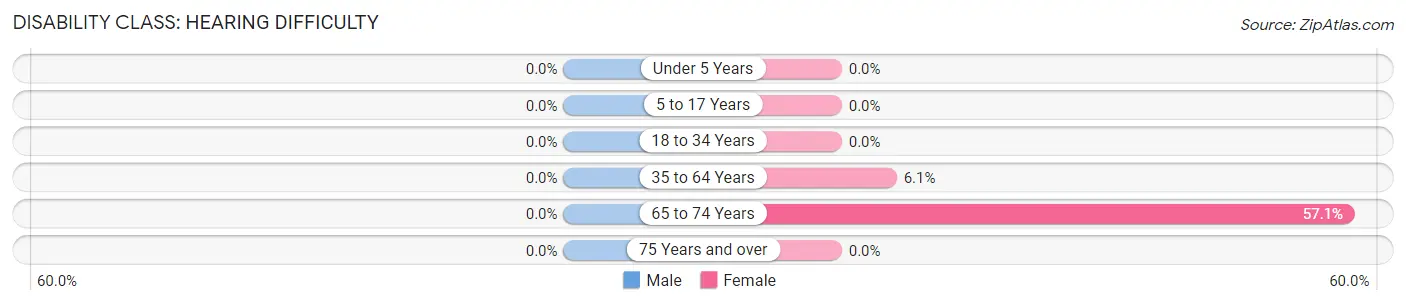
| Age Bracket | Male | Female |
| Under 5 Years | 0 (0.0%) | 0 (0.0%) |
| 5 to 17 Years | 0 (0.0%) | 0 (0.0%) |
| 18 to 34 Years | 0 (0.0%) | 0 (0.0%) |
| 35 to 64 Years | 0 (0.0%) | 3 (6.1%) |
| 65 to 74 Years | 0 (0.0%) | 4 (57.1%) |
| 75 Years and over | 0 (0.0%) | 0 (0.0%) |
Disability Class: Vision Difficulty
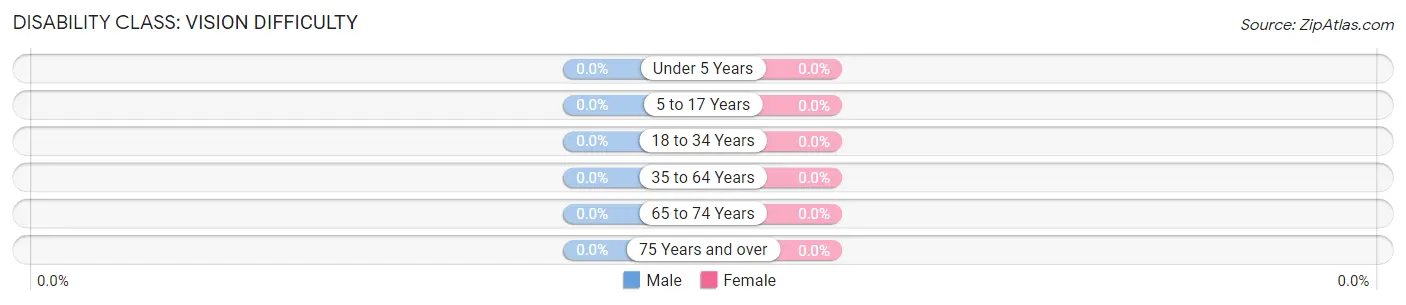
| Age Bracket | Male | Female |
| Under 5 Years | 0 (0.0%) | 0 (0.0%) |
| 5 to 17 Years | 0 (0.0%) | 0 (0.0%) |
| 18 to 34 Years | 0 (0.0%) | 0 (0.0%) |
| 35 to 64 Years | 0 (0.0%) | 0 (0.0%) |
| 65 to 74 Years | 0 (0.0%) | 0 (0.0%) |
| 75 Years and over | 0 (0.0%) | 0 (0.0%) |
Disability Class: Cognitive Difficulty
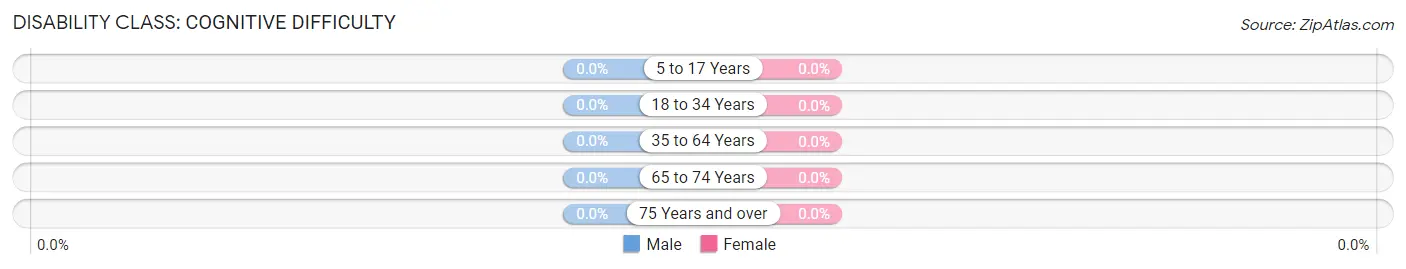
| Age Bracket | Male | Female |
| 5 to 17 Years | 0 (0.0%) | 0 (0.0%) |
| 18 to 34 Years | 0 (0.0%) | 0 (0.0%) |
| 35 to 64 Years | 0 (0.0%) | 0 (0.0%) |
| 65 to 74 Years | 0 (0.0%) | 0 (0.0%) |
| 75 Years and over | 0 (0.0%) | 0 (0.0%) |
Disability Class: Ambulatory Difficulty
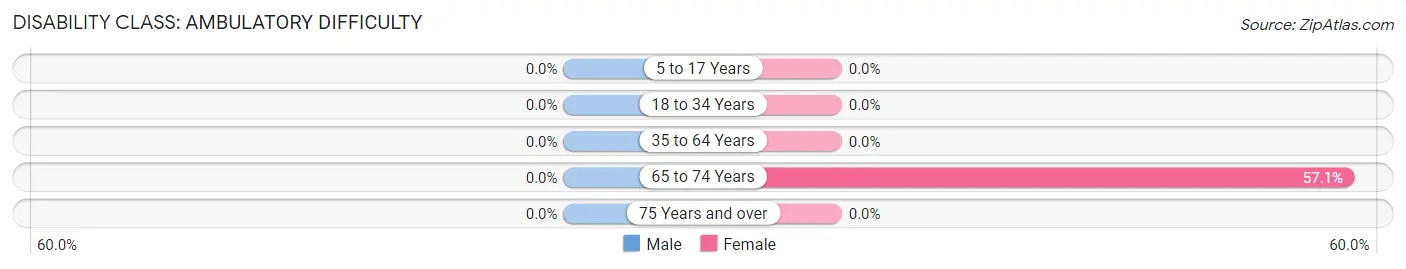
| Age Bracket | Male | Female |
| 5 to 17 Years | 0 (0.0%) | 0 (0.0%) |
| 18 to 34 Years | 0 (0.0%) | 0 (0.0%) |
| 35 to 64 Years | 0 (0.0%) | 0 (0.0%) |
| 65 to 74 Years | 0 (0.0%) | 4 (57.1%) |
| 75 Years and over | 0 (0.0%) | 0 (0.0%) |
Disability Class: Self-Care Difficulty
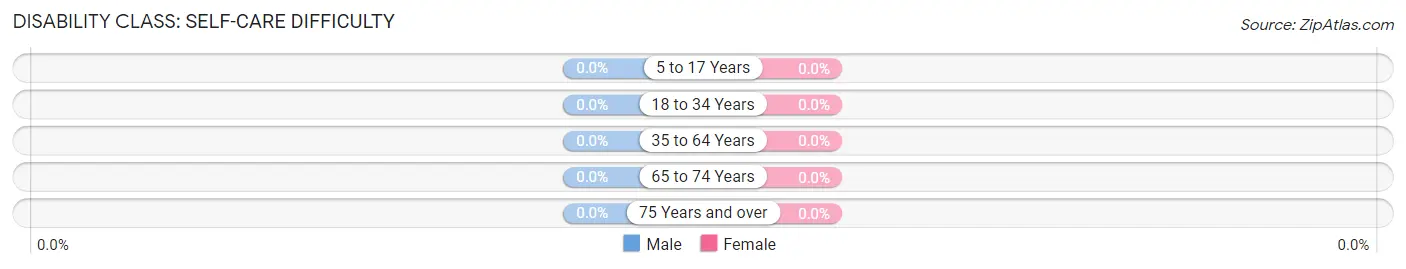
| Age Bracket | Male | Female |
| 5 to 17 Years | 0 (0.0%) | 0 (0.0%) |
| 18 to 34 Years | 0 (0.0%) | 0 (0.0%) |
| 35 to 64 Years | 0 (0.0%) | 0 (0.0%) |
| 65 to 74 Years | 0 (0.0%) | 0 (0.0%) |
| 75 Years and over | 0 (0.0%) | 0 (0.0%) |
Technology Access in Laguna Seca
Computing Device Access in Laguna Seca
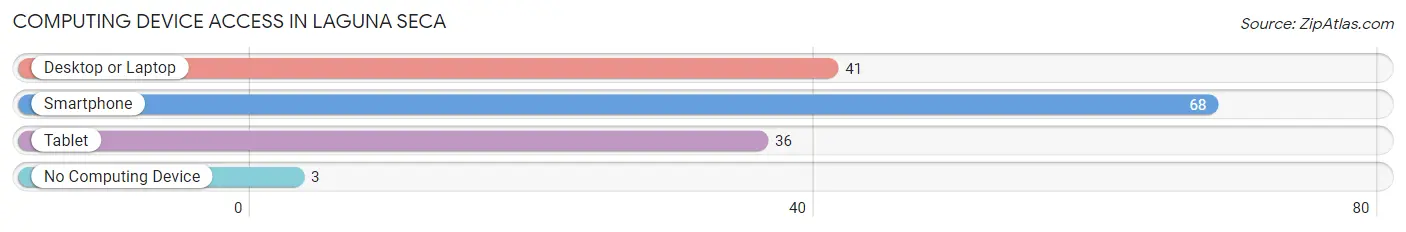
| Device Type | # Households | % Households |
| Desktop or Laptop | 41 | 57.8% |
| Smartphone | 68 | 95.8% |
| Tablet | 36 | 50.7% |
| No Computing Device | 3 | 4.2% |
| Total | 71 | 100.0% |
Internet Access in Laguna Seca
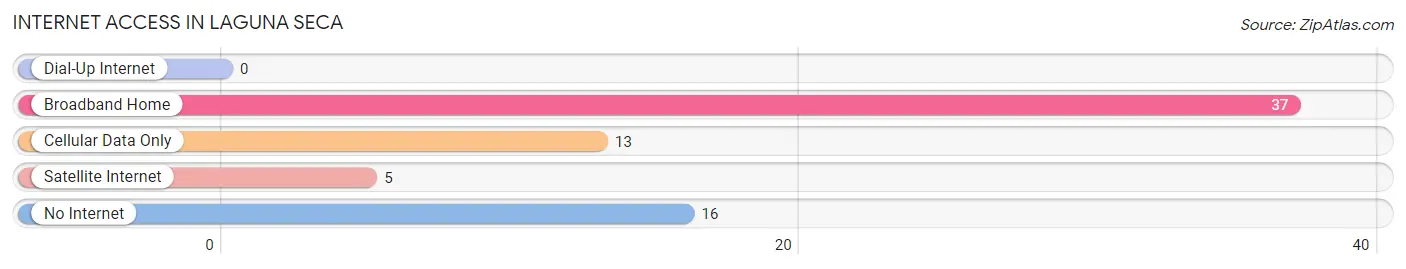
| Internet Type | # Households | % Households |
| Dial-Up Internet | 0 | 0.0% |
| Broadband Home | 37 | 52.1% |
| Cellular Data Only | 13 | 18.3% |
| Satellite Internet | 5 | 7.0% |
| No Internet | 16 | 22.5% |
| Total | 71 | 100.0% |
Laguna Seca Summary
Laguna Seca is a small unincorporated community located in Hidalgo County, Texas. It is situated on the banks of the Rio Grande, approximately 20 miles south of McAllen. The population of Laguna Seca was estimated to be 1,845 in 2019.
History
Laguna Seca was founded in the late 19th century by Mexican settlers who were attracted to the area by its fertile soil and abundant water supply. The name Laguna Seca translates to “dry lake” in Spanish, and is derived from the fact that the area was once a shallow lake that had dried up. The first settlers in the area were ranchers, who used the land to graze their cattle.
In the early 20th century, the area began to attract more settlers, and the population began to grow. The town was officially established in 1925, and the first post office was opened in 1927.
Geography
Laguna Seca is located in the Rio Grande Valley of South Texas, approximately 20 miles south of McAllen. The town is situated on the banks of the Rio Grande, and is surrounded by agricultural fields and ranches. The terrain is mostly flat, with some rolling hills in the area. The climate is subtropical, with hot summers and mild winters.
Economy
The economy of Laguna Seca is largely based on agriculture. The area is known for its production of cotton, sorghum, corn, and other crops. The town is also home to several small businesses, including restaurants, grocery stores, and auto repair shops.
Demographics
As of 2019, the population of Laguna Seca was estimated to be 1,845. The racial makeup of the town is predominantly Hispanic, with a small percentage of African Americans and other races. The median household income is $30,000, and the median age is 33. The town has a high rate of poverty, with nearly 40% of the population living below the poverty line.
Conclusion
Laguna Seca is a small unincorporated community located in Hidalgo County, Texas. It was founded in the late 19th century by Mexican settlers, and is situated on the banks of the Rio Grande. The economy of Laguna Seca is largely based on agriculture, and the population is predominantly Hispanic. The town has a high rate of poverty, with nearly 40% of the population living below the poverty line.
Common Questions
What is Per Capita Income in Laguna Seca?
Per Capita income in Laguna Seca is $27,395.
What is the Median Family Income in Laguna Seca?
Median Family Income in Laguna Seca is $75,179.
What is the Median Household income in Laguna Seca?
Median Household Income in Laguna Seca is $71,750.
What is Income or Wage Gap in Laguna Seca?
Income or Wage Gap in Laguna Seca is 3.5%.
Women in Laguna Seca earn 96.5 cents for every dollar earned by a man.
What is Inequality or Gini Index in Laguna Seca?
Inequality or Gini Index in Laguna Seca is 0.42.
What is the Total Population of Laguna Seca?
Total Population of Laguna Seca is 277.
What is the Total Male Population of Laguna Seca?
Total Male Population of Laguna Seca is 159.
What is the Total Female Population of Laguna Seca?
Total Female Population of Laguna Seca is 118.
What is the Ratio of Males per 100 Females in Laguna Seca?
There are 134.75 Males per 100 Females in Laguna Seca.
What is the Ratio of Females per 100 Males in Laguna Seca?
There are 74.21 Females per 100 Males in Laguna Seca.
What is the Median Population Age in Laguna Seca?
Median Population Age in Laguna Seca is 28.4 Years.
What is the Average Family Size in Laguna Seca
Average Family Size in Laguna Seca is 4.0 People.
What is the Average Household Size in Laguna Seca
Average Household Size in Laguna Seca is 3.9 People.
How Large is the Labor Force in Laguna Seca?
There are 187 People in the Labor Forcein in Laguna Seca.
What is the Percentage of People in the Labor Force in Laguna Seca?
76.6% of People are in the Labor Force in Laguna Seca.
What is the Unemployment Rate in Laguna Seca?
Unemployment Rate in Laguna Seca is 3.2%.