Cisco, TX Map & Demographics
Cisco Map
Cisco Overview
$29,668
PER CAPITA INCOME
$65,278
AVG FAMILY INCOME
$59,698
AVG HOUSEHOLD INCOME
26.3%
WAGE / INCOME GAP [ % ]
73.7¢/ $1
WAGE / INCOME GAP [ $ ]
0.36
INEQUALITY / GINI INDEX
3,901
TOTAL POPULATION
1,877
MALE POPULATION
2,024
FEMALE POPULATION
92.74
MALES / 100 FEMALES
107.83
FEMALES / 100 MALES
35.1
MEDIAN AGE
2.8
AVG FAMILY SIZE
2.4
AVG HOUSEHOLD SIZE
1,887
LABOR FORCE [ PEOPLE ]
58.2%
PERCENT IN LABOR FORCE
6.5%
UNEMPLOYMENT RATE
Cisco Zip Codes
Income in Cisco
Income Overview in Cisco
Per Capita Income in Cisco is $29,668, while median incomes of families and households are $65,278 and $59,698 respectively.
| Characteristic | Number | Measure |
| Per Capita Income | 3,901 | $29,668 |
| Median Family Income | 1,080 | $65,278 |
| Mean Family Income | 1,080 | $80,935 |
| Median Household Income | 1,468 | $59,698 |
| Mean Household Income | 1,468 | $74,617 |
| Income Deficit | 1,080 | $0 |
| Wage / Income Gap (%) | 3,901 | 26.26% |
| Wage / Income Gap ($) | 3,901 | 73.74¢ per $1 |
| Gini / Inequality Index | 3,901 | 0.36 |
Earnings by Sex in Cisco
Average Earnings in Cisco are $37,046, $43,807 for men and $32,303 for women, a difference of 26.3%.
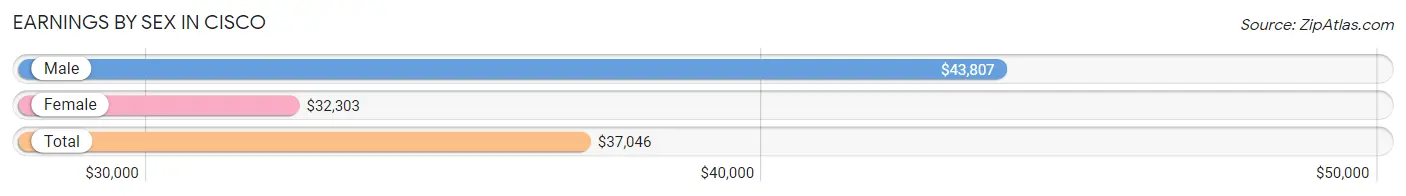
| Sex | Number | Average Earnings |
| Male | 1,239 (57.0%) | $43,807 |
| Female | 936 (43.0%) | $32,303 |
| Total | 2,175 (100.0%) | $37,046 |
Earnings by Sex by Income Bracket in Cisco
The most common earnings brackets in Cisco are $65,000 to $74,999 for men (167 | 13.5%) and $55,000 to $64,999 for women (138 | 14.7%).
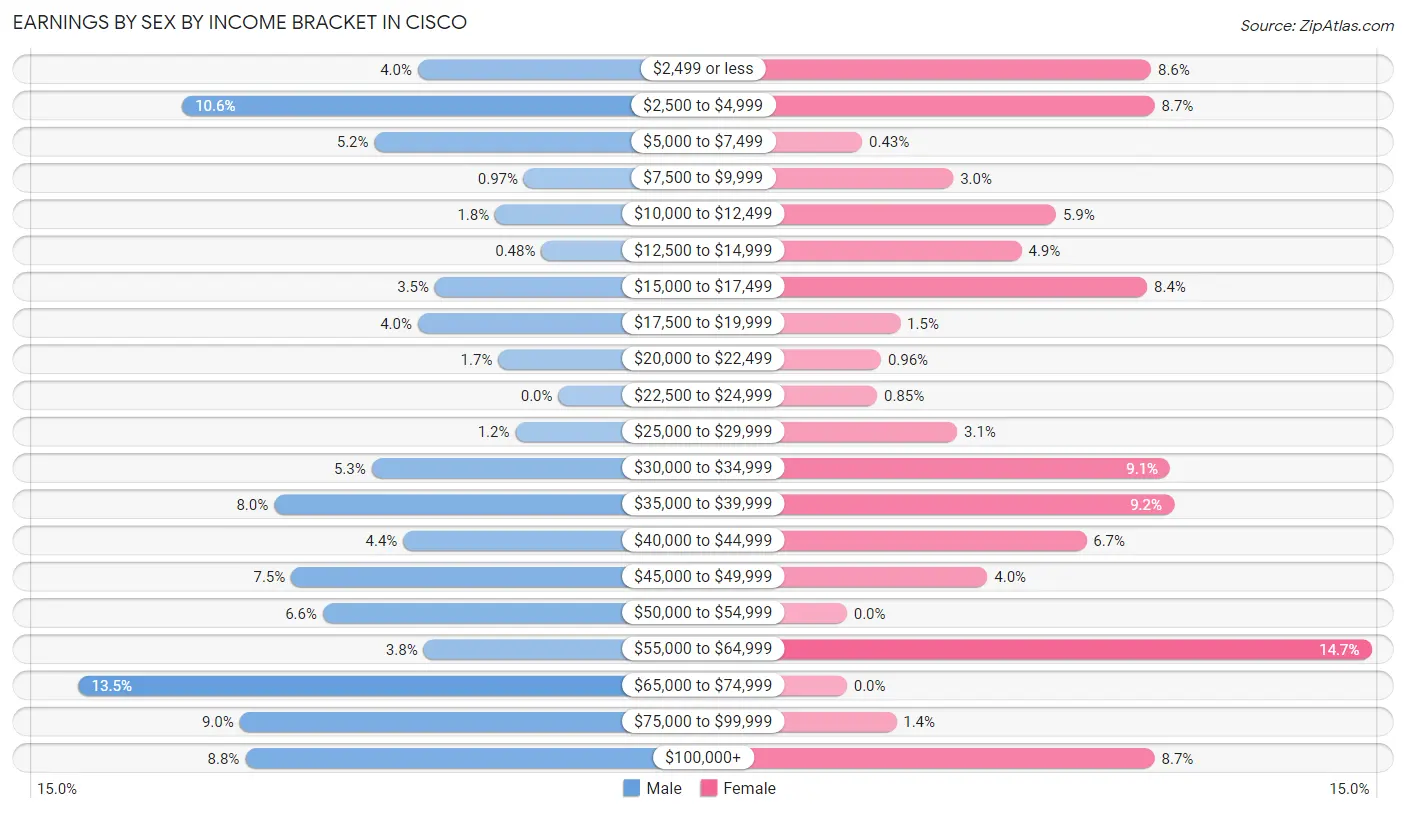
| Income | Male | Female |
| $2,499 or less | 49 (4.0%) | 80 (8.6%) |
| $2,500 to $4,999 | 131 (10.6%) | 81 (8.6%) |
| $5,000 to $7,499 | 64 (5.2%) | 4 (0.4%) |
| $7,500 to $9,999 | 12 (1.0%) | 28 (3.0%) |
| $10,000 to $12,499 | 22 (1.8%) | 55 (5.9%) |
| $12,500 to $14,999 | 6 (0.5%) | 46 (4.9%) |
| $15,000 to $17,499 | 43 (3.5%) | 79 (8.4%) |
| $17,500 to $19,999 | 49 (4.0%) | 14 (1.5%) |
| $20,000 to $22,499 | 21 (1.7%) | 9 (1.0%) |
| $22,500 to $24,999 | 0 (0.0%) | 8 (0.9%) |
| $25,000 to $29,999 | 15 (1.2%) | 29 (3.1%) |
| $30,000 to $34,999 | 65 (5.2%) | 85 (9.1%) |
| $35,000 to $39,999 | 99 (8.0%) | 86 (9.2%) |
| $40,000 to $44,999 | 54 (4.4%) | 63 (6.7%) |
| $45,000 to $49,999 | 93 (7.5%) | 37 (4.0%) |
| $50,000 to $54,999 | 82 (6.6%) | 0 (0.0%) |
| $55,000 to $64,999 | 47 (3.8%) | 138 (14.7%) |
| $65,000 to $74,999 | 167 (13.5%) | 0 (0.0%) |
| $75,000 to $99,999 | 111 (9.0%) | 13 (1.4%) |
| $100,000+ | 109 (8.8%) | 81 (8.6%) |
| Total | 1,239 (100.0%) | 936 (100.0%) |
Earnings by Sex by Educational Attainment in Cisco
Average earnings in Cisco are $51,504 for men and $40,060 for women, a difference of 22.2%. Men with an educational attainment of bachelor's degree enjoy the highest average annual earnings of $71,168, while those with high school diploma education earn the least with $46,250. Women with an educational attainment of graduate degree earn the most with the average annual earnings of $110,281, while those with college or associate's degree education have the smallest earnings of $33,989.
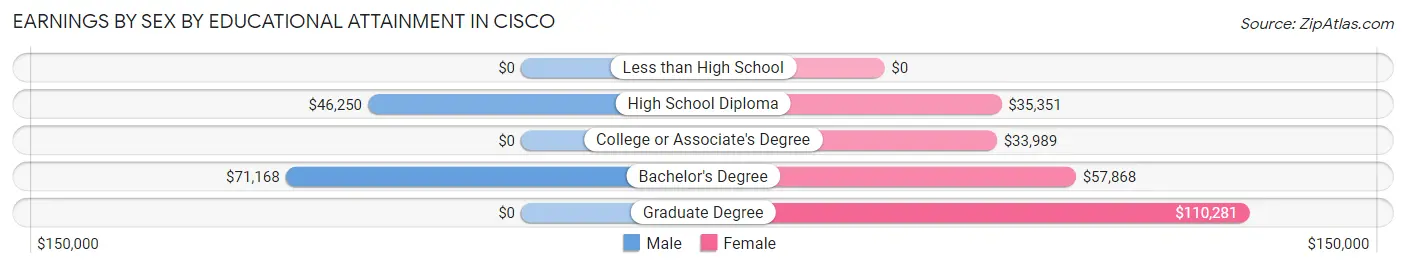
| Educational Attainment | Male Income | Female Income |
| Less than High School | - | - |
| High School Diploma | $46,250 | $35,351 |
| College or Associate's Degree | - | - |
| Bachelor's Degree | $71,168 | $57,868 |
| Graduate Degree | - | - |
| Total | $51,504 | $40,060 |
Family Income in Cisco
Family Income Brackets in Cisco
According to the Cisco family income data, there are 295 families falling into the $50,000 to $74,999 income range, which is the most common income bracket and makes up 27.3% of all families.
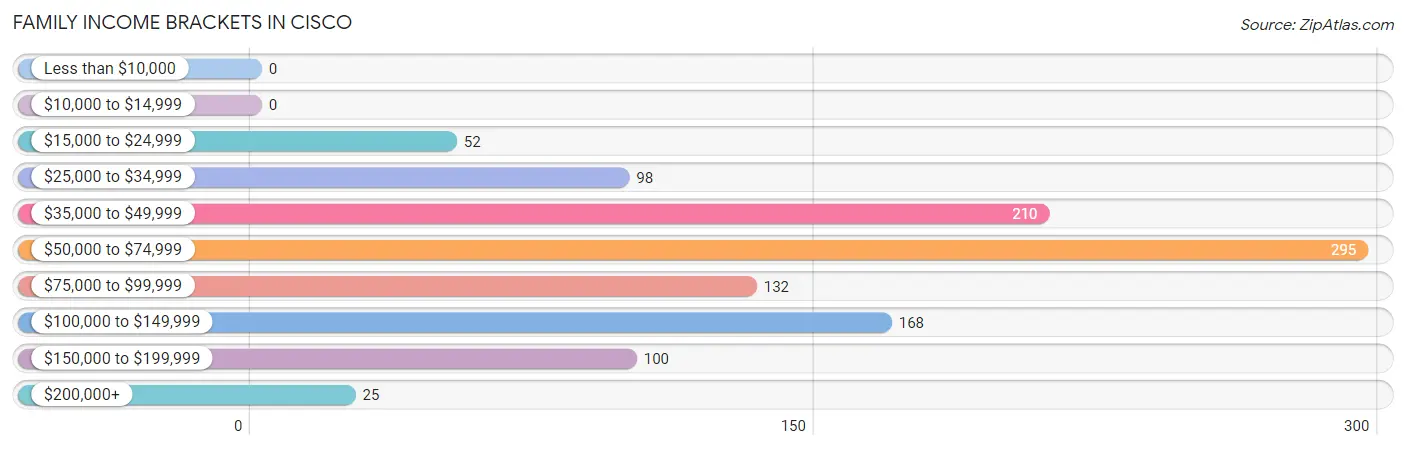
| Income Bracket | # Families | % Families |
| Less than $10,000 | 0 | 0.0% |
| $10,000 to $14,999 | 0 | 0.0% |
| $15,000 to $24,999 | 52 | 4.8% |
| $25,000 to $34,999 | 98 | 9.1% |
| $35,000 to $49,999 | 210 | 19.4% |
| $50,000 to $74,999 | 295 | 27.3% |
| $75,000 to $99,999 | 132 | 12.2% |
| $100,000 to $149,999 | 168 | 15.6% |
| $150,000 to $199,999 | 100 | 9.3% |
| $200,000+ | 25 | 2.3% |
Family Income by Famaliy Size in Cisco
3-person families (271 | 25.1%) account for the highest median family income in Cisco with $126,328 per family, while 3-person families (271 | 25.1%) have the highest median income of $42,109 per family member.
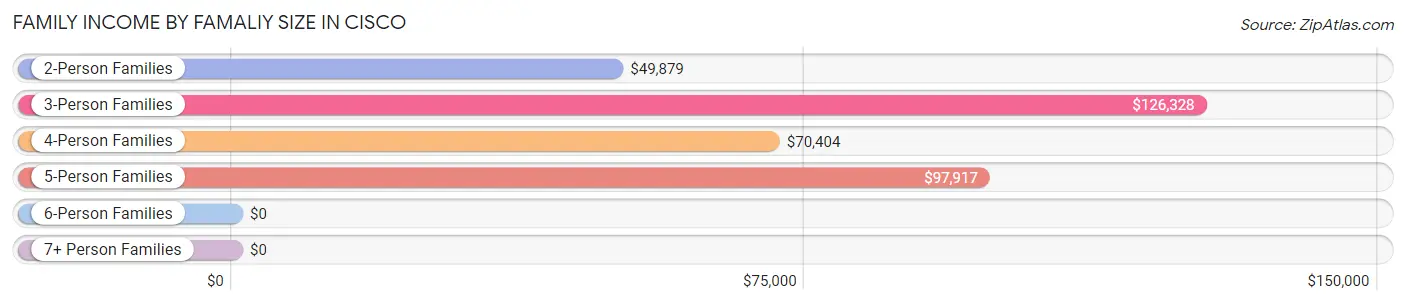
| Income Bracket | # Families | Median Income |
| 2-Person Families | 603 (55.8%) | $49,879 |
| 3-Person Families | 271 (25.1%) | $126,328 |
| 4-Person Families | 114 (10.6%) | $70,404 |
| 5-Person Families | 83 (7.7%) | $97,917 |
| 6-Person Families | 9 (0.8%) | $0 |
| 7+ Person Families | 0 (0.0%) | $0 |
| Total | 1,080 (100.0%) | $65,278 |
Family Income by Number of Earners in Cisco
The median family income in Cisco is $65,278, with families comprising 3+ earners (132) having the highest median family income of $162,451, while families with 1 earner (345) have the lowest median family income of $49,798, accounting for 12.2% and 31.9% of families, respectively.
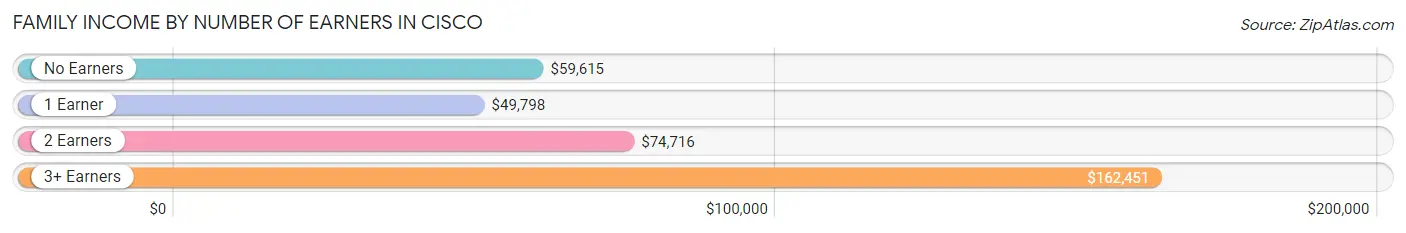
| Number of Earners | # Families | Median Income |
| No Earners | 186 (17.2%) | $59,615 |
| 1 Earner | 345 (31.9%) | $49,798 |
| 2 Earners | 417 (38.6%) | $74,716 |
| 3+ Earners | 132 (12.2%) | $162,451 |
| Total | 1,080 (100.0%) | $65,278 |
Household Income in Cisco
Household Income Brackets in Cisco
With 352 households falling in the category, the $50,000 to $74,999 income range is the most frequent in Cisco, accounting for 24.0% of all households. In contrast, only 7 households (0.5%) fall into the less than $10,000 income bracket, making it the least populous group.
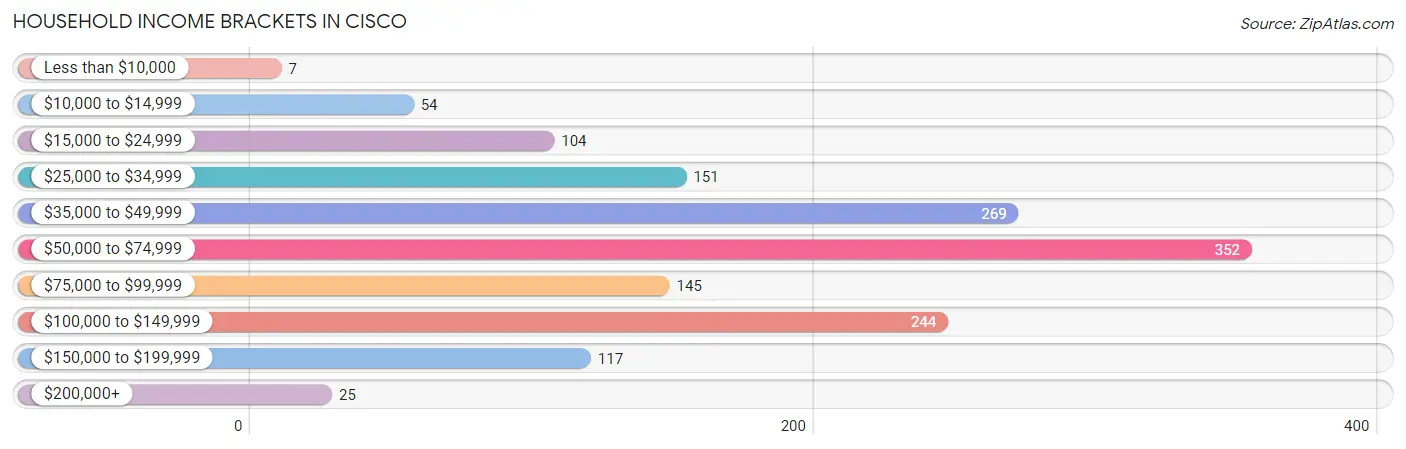
| Income Bracket | # Households | % Households |
| Less than $10,000 | 7 | 0.5% |
| $10,000 to $14,999 | 54 | 3.7% |
| $15,000 to $24,999 | 104 | 7.1% |
| $25,000 to $34,999 | 151 | 10.3% |
| $35,000 to $49,999 | 269 | 18.3% |
| $50,000 to $74,999 | 352 | 24.0% |
| $75,000 to $99,999 | 145 | 9.9% |
| $100,000 to $149,999 | 244 | 16.6% |
| $150,000 to $199,999 | 117 | 8.0% |
| $200,000+ | 25 | 1.7% |
Household Income by Householder Age in Cisco
The median household income in Cisco is $59,698, with the highest median household income of $92,097 found in the 45 to 64 years age bracket for the primary householder. A total of 442 households (30.1%) fall into this category. Meanwhile, the 65+ years age bracket for the primary householder has the lowest median household income of $46,583, with 459 households (31.3%) in this group.
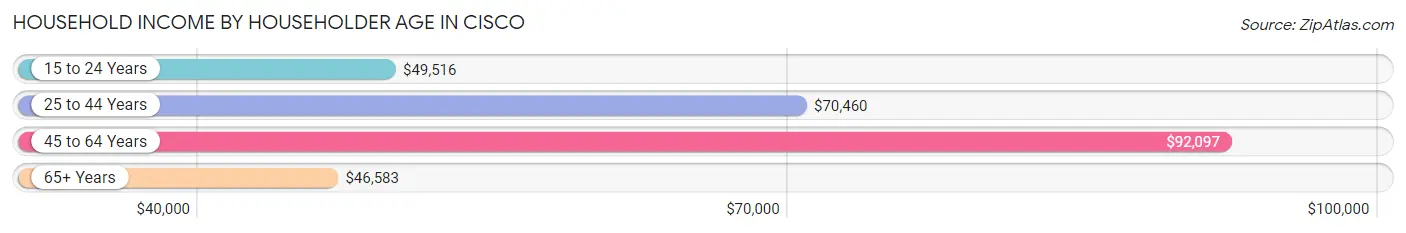
| Income Bracket | # Households | Median Income |
| 15 to 24 Years | 236 (16.1%) | $49,516 |
| 25 to 44 Years | 331 (22.6%) | $70,460 |
| 45 to 64 Years | 442 (30.1%) | $92,097 |
| 65+ Years | 459 (31.3%) | $46,583 |
| Total | 1,468 (100.0%) | $59,698 |
Poverty in Cisco
Income Below Poverty by Sex and Age in Cisco
With 3.5% poverty level for males and 3.9% for females among the residents of Cisco, 75 year old and over males and 6 to 11 year old females are the most vulnerable to poverty, with 58 males (22.9%) and 20 females (18.3%) in their respective age groups living below the poverty level.
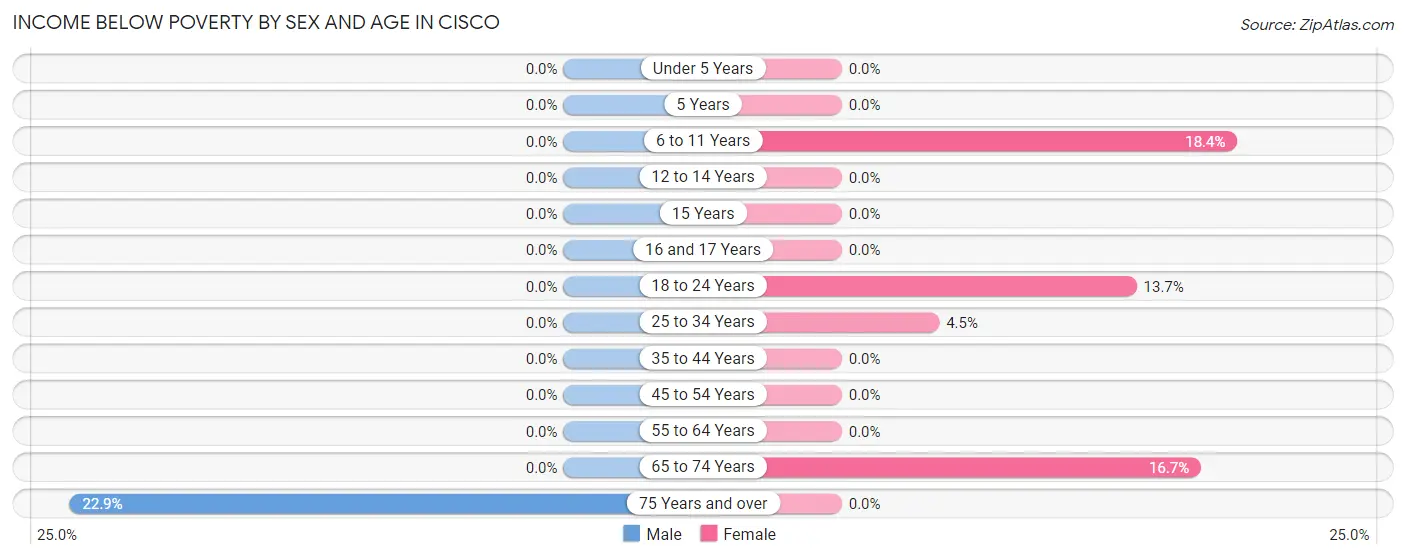
| Age Bracket | Male | Female |
| Under 5 Years | 0 (0.0%) | 0 (0.0%) |
| 5 Years | 0 (0.0%) | 0 (0.0%) |
| 6 to 11 Years | 0 (0.0%) | 20 (18.3%) |
| 12 to 14 Years | 0 (0.0%) | 0 (0.0%) |
| 15 Years | 0 (0.0%) | 0 (0.0%) |
| 16 and 17 Years | 0 (0.0%) | 0 (0.0%) |
| 18 to 24 Years | 0 (0.0%) | 26 (13.7%) |
| 25 to 34 Years | 0 (0.0%) | 9 (4.5%) |
| 35 to 44 Years | 0 (0.0%) | 0 (0.0%) |
| 45 to 54 Years | 0 (0.0%) | 0 (0.0%) |
| 55 to 64 Years | 0 (0.0%) | 0 (0.0%) |
| 65 to 74 Years | 0 (0.0%) | 16 (16.7%) |
| 75 Years and over | 58 (22.9%) | 0 (0.0%) |
| Total | 58 (3.5%) | 71 (3.9%) |
Income Above Poverty by Sex and Age in Cisco
According to the poverty statistics in Cisco, males aged under 5 years and females aged under 5 years are the age groups that are most secure financially, with 100.0% of males and 100.0% of females in these age groups living above the poverty line.
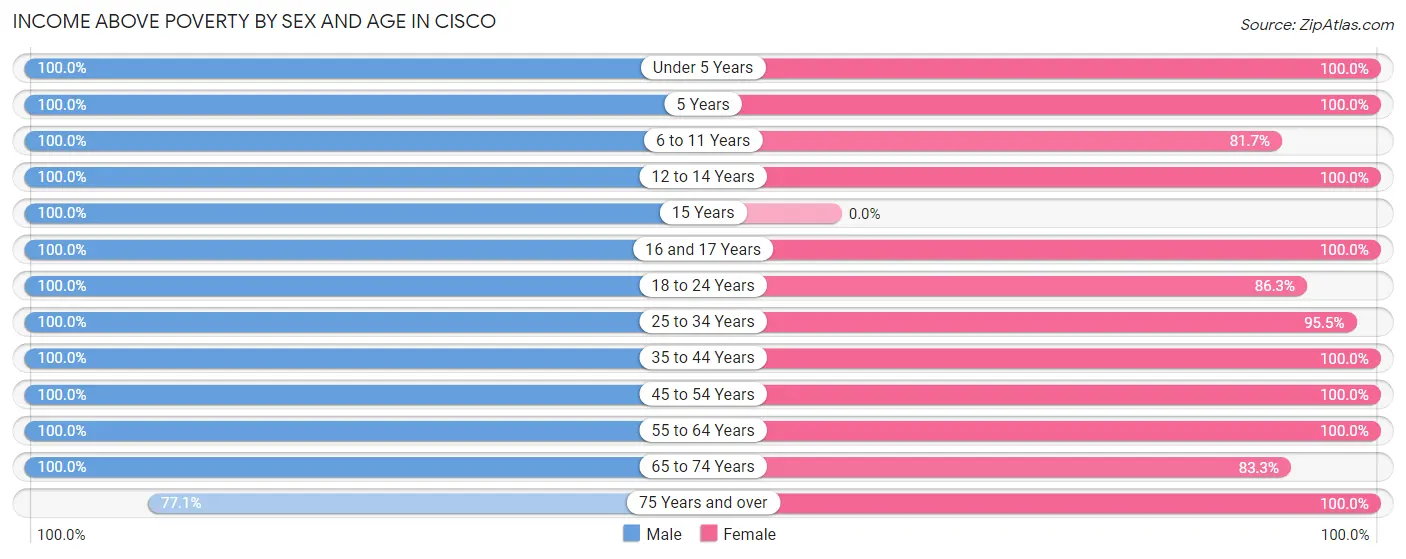
| Age Bracket | Male | Female |
| Under 5 Years | 96 (100.0%) | 134 (100.0%) |
| 5 Years | 19 (100.0%) | 84 (100.0%) |
| 6 to 11 Years | 24 (100.0%) | 89 (81.7%) |
| 12 to 14 Years | 26 (100.0%) | 81 (100.0%) |
| 15 Years | 56 (100.0%) | 0 (0.0%) |
| 16 and 17 Years | 95 (100.0%) | 102 (100.0%) |
| 18 to 24 Years | 175 (100.0%) | 164 (86.3%) |
| 25 to 34 Years | 183 (100.0%) | 190 (95.5%) |
| 35 to 44 Years | 170 (100.0%) | 150 (100.0%) |
| 45 to 54 Years | 188 (100.0%) | 219 (100.0%) |
| 55 to 64 Years | 238 (100.0%) | 274 (100.0%) |
| 65 to 74 Years | 134 (100.0%) | 80 (83.3%) |
| 75 Years and over | 195 (77.1%) | 190 (100.0%) |
| Total | 1,599 (96.5%) | 1,757 (96.1%) |
Income Below Poverty Among Married-Couple Families in Cisco
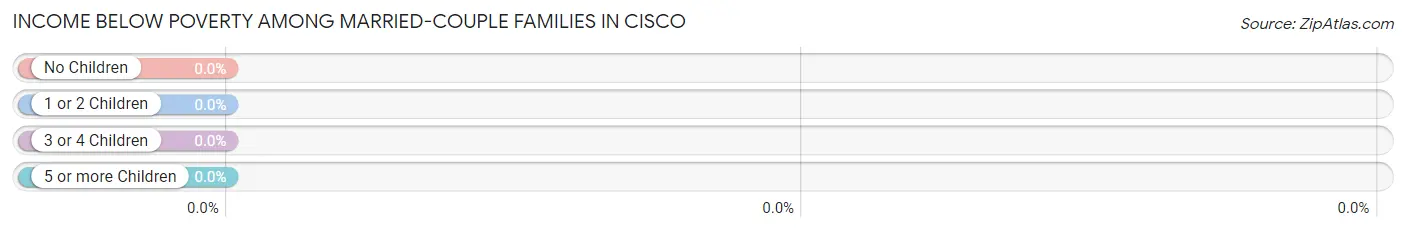
| Children | Above Poverty | Below Poverty |
| No Children | 624 (100.0%) | 0 (0.0%) |
| 1 or 2 Children | 303 (100.0%) | 0 (0.0%) |
| 3 or 4 Children | 62 (100.0%) | 0 (0.0%) |
| 5 or more Children | 0 (0.0%) | 0 (0.0%) |
| Total | 989 (100.0%) | 0 (0.0%) |
Income Below Poverty Among Single-Parent Households in Cisco
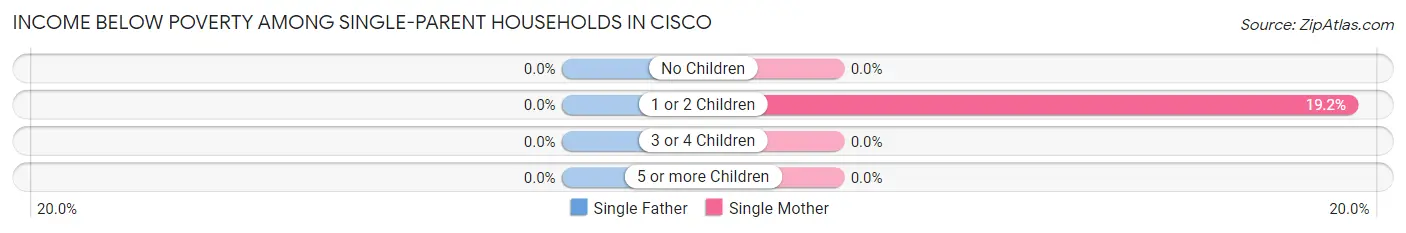
| Children | Single Father | Single Mother |
| No Children | 0 (0.0%) | 0 (0.0%) |
| 1 or 2 Children | 0 (0.0%) | 9 (19.2%) |
| 3 or 4 Children | 0 (0.0%) | 0 (0.0%) |
| 5 or more Children | 0 (0.0%) | 0 (0.0%) |
| Total | 0 (0.0%) | 9 (9.9%) |
Income Below Poverty Among Married-Couple vs Single-Parent Households in Cisco
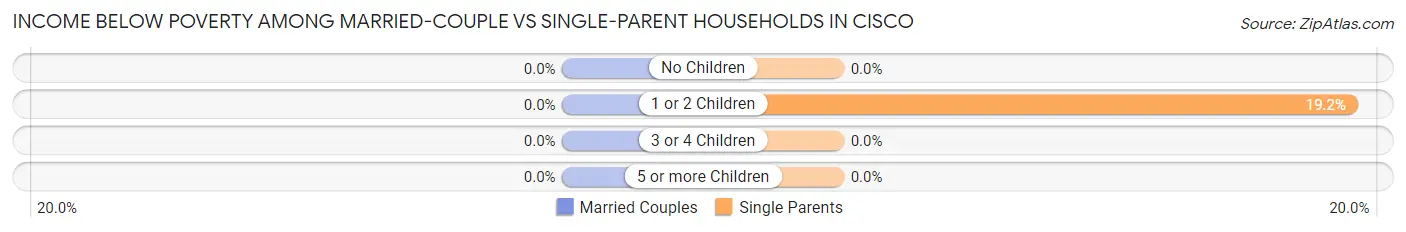
| Children | Married-Couple Families | Single-Parent Households |
| No Children | 0 (0.0%) | 0 (0.0%) |
| 1 or 2 Children | 0 (0.0%) | 9 (19.2%) |
| 3 or 4 Children | 0 (0.0%) | 0 (0.0%) |
| 5 or more Children | 0 (0.0%) | 0 (0.0%) |
| Total | 0 (0.0%) | 9 (9.9%) |
Race in Cisco
The most populous races in Cisco are White / Caucasian (3,327 | 85.3%), Hispanic or Latino (923 | 23.7%), and Two or more Races (360 | 9.2%).
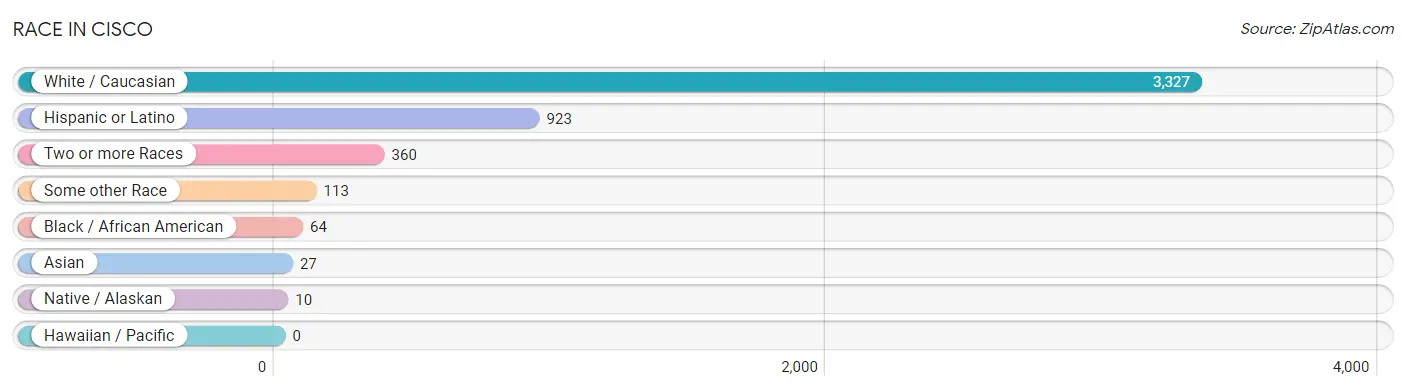
| Race | # Population | % Population |
| Asian | 27 | 0.7% |
| Black / African American | 64 | 1.6% |
| Hawaiian / Pacific | 0 | 0.0% |
| Hispanic or Latino | 923 | 23.7% |
| Native / Alaskan | 10 | 0.3% |
| White / Caucasian | 3,327 | 85.3% |
| Two or more Races | 360 | 9.2% |
| Some other Race | 113 | 2.9% |
| Total | 3,901 | 100.0% |
Ancestry in Cisco
The most populous ancestries reported in Cisco are Mexican (837 | 21.5%), European (586 | 15.0%), German (506 | 13.0%), English (500 | 12.8%), and American (486 | 12.5%), together accounting for 74.7% of all Cisco residents.
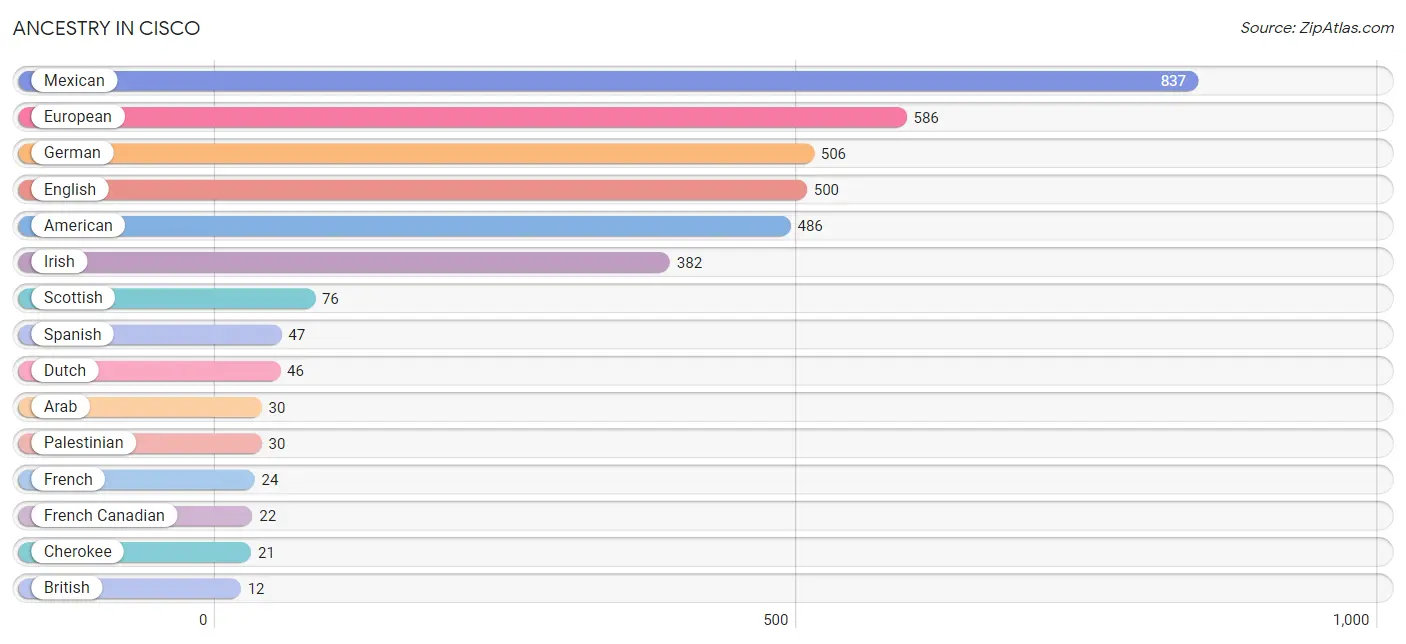
| Ancestry | # Population | % Population |
| Afghan | 9 | 0.2% |
| American | 486 | 12.5% |
| Arab | 30 | 0.8% |
| Austrian | 4 | 0.1% |
| British | 12 | 0.3% |
| Canadian | 3 | 0.1% |
| Central American | 10 | 0.3% |
| Cherokee | 21 | 0.5% |
| Dutch | 46 | 1.2% |
| English | 500 | 12.8% |
| European | 586 | 15.0% |
| Finnish | 12 | 0.3% |
| French | 24 | 0.6% |
| French Canadian | 22 | 0.6% |
| German | 506 | 13.0% |
| Guatemalan | 10 | 0.3% |
| Irish | 382 | 9.8% |
| Mexican | 837 | 21.5% |
| Nigerian | 8 | 0.2% |
| Palestinian | 30 | 0.8% |
| Polish | 11 | 0.3% |
| Puerto Rican | 9 | 0.2% |
| Scotch-Irish | 11 | 0.3% |
| Scottish | 76 | 1.9% |
| Spaniard | 4 | 0.1% |
| Spanish | 47 | 1.2% |
| Sri Lankan | 8 | 0.2% |
| Subsaharan African | 8 | 0.2% |
| Thai | 10 | 0.3% | View All 29 Rows |
Immigrants in Cisco
The most numerous immigrant groups reported in Cisco came from Central America (112 | 2.9%), Latin America (112 | 2.9%), Mexico (112 | 2.9%), Europe (4 | 0.1%), and Southern Europe (4 | 0.1%), together accounting for 8.8% of all Cisco residents.
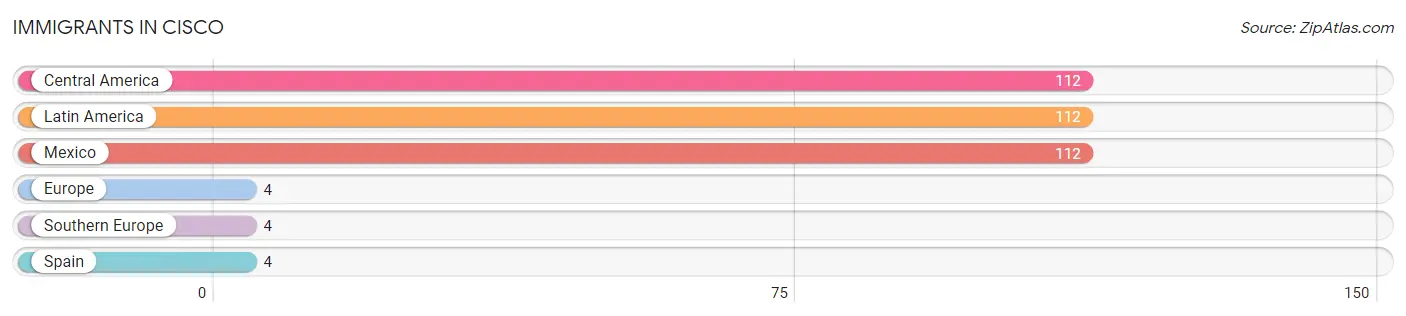
| Immigration Origin | # Population | % Population |
| Central America | 112 | 2.9% |
| Europe | 4 | 0.1% |
| Latin America | 112 | 2.9% |
| Mexico | 112 | 2.9% |
| Southern Europe | 4 | 0.1% |
| Spain | 4 | 0.1% | View All 6 Rows |
Sex and Age in Cisco
Sex and Age in Cisco
The most populous age groups in Cisco are 15 to 19 Years (273 | 14.5%) for men and 15 to 19 Years (291 | 14.4%) for women.
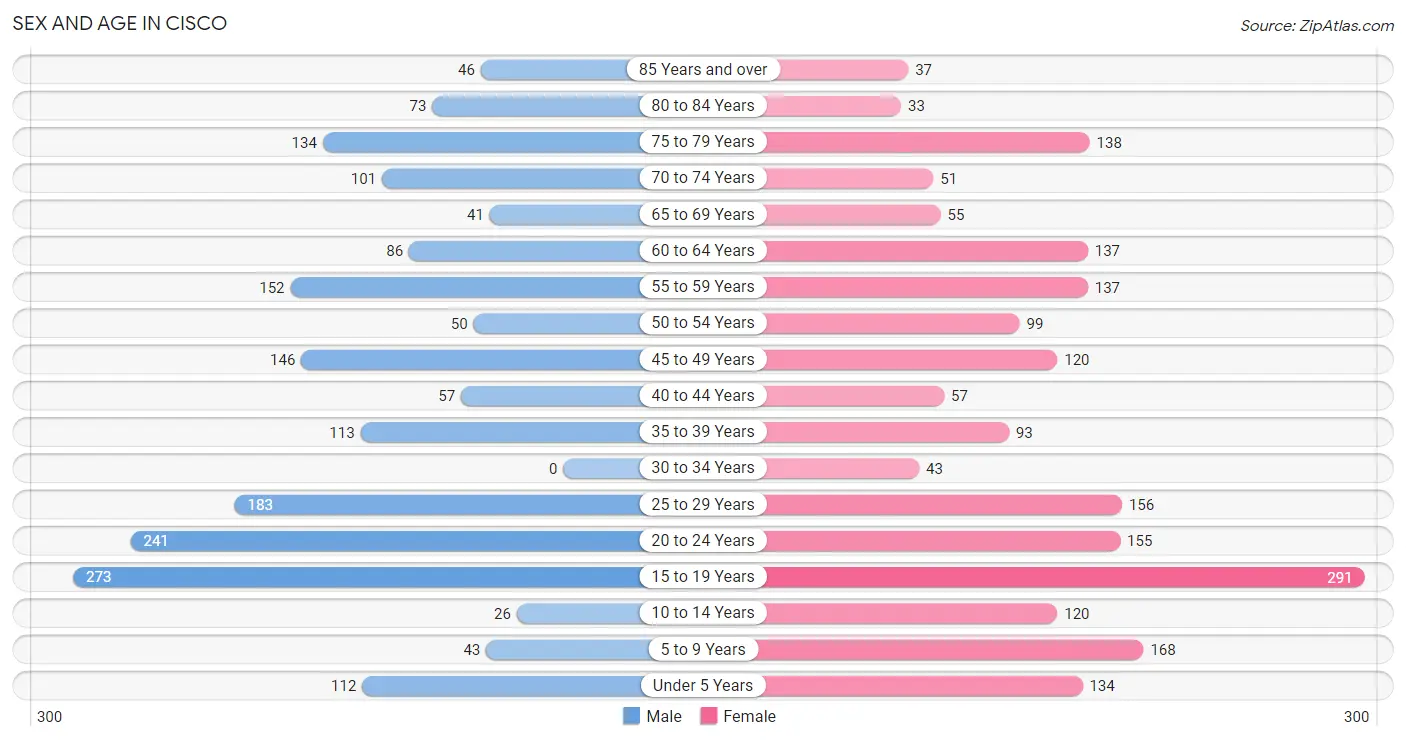
| Age Bracket | Male | Female |
| Under 5 Years | 112 (6.0%) | 134 (6.6%) |
| 5 to 9 Years | 43 (2.3%) | 168 (8.3%) |
| 10 to 14 Years | 26 (1.4%) | 120 (5.9%) |
| 15 to 19 Years | 273 (14.5%) | 291 (14.4%) |
| 20 to 24 Years | 241 (12.8%) | 155 (7.7%) |
| 25 to 29 Years | 183 (9.8%) | 156 (7.7%) |
| 30 to 34 Years | 0 (0.0%) | 43 (2.1%) |
| 35 to 39 Years | 113 (6.0%) | 93 (4.6%) |
| 40 to 44 Years | 57 (3.0%) | 57 (2.8%) |
| 45 to 49 Years | 146 (7.8%) | 120 (5.9%) |
| 50 to 54 Years | 50 (2.7%) | 99 (4.9%) |
| 55 to 59 Years | 152 (8.1%) | 137 (6.8%) |
| 60 to 64 Years | 86 (4.6%) | 137 (6.8%) |
| 65 to 69 Years | 41 (2.2%) | 55 (2.7%) |
| 70 to 74 Years | 101 (5.4%) | 51 (2.5%) |
| 75 to 79 Years | 134 (7.1%) | 138 (6.8%) |
| 80 to 84 Years | 73 (3.9%) | 33 (1.6%) |
| 85 Years and over | 46 (2.5%) | 37 (1.8%) |
| Total | 1,877 (100.0%) | 2,024 (100.0%) |
Families and Households in Cisco
Median Family Size in Cisco
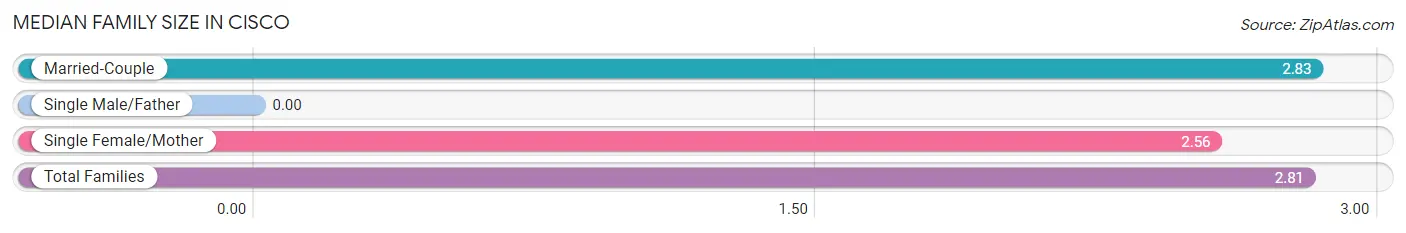
| Family Type | # Families | Family Size |
| Married-Couple | 989 (91.6%) | 2.83 |
| Single Male/Father | 0 (0.0%) | - |
| Single Female/Mother | 91 (8.4%) | 2.56 |
| Total Families | 1,080 (100.0%) | 2.81 |
Median Household Size in Cisco
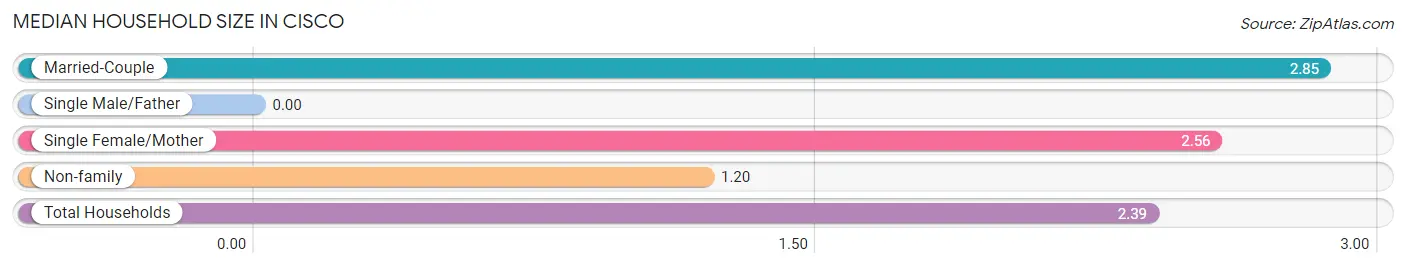
| Household Type | # Households | Household Size |
| Married-Couple | 989 (67.4%) | 2.85 |
| Single Male/Father | 0 (0.0%) | - |
| Single Female/Mother | 91 (6.2%) | 2.56 |
| Non-family | 388 (26.4%) | 1.20 |
| Total Households | 1,468 (100.0%) | 2.39 |
Household Size by Marriage Status in Cisco
Out of a total of 1,468 households in Cisco, 1,080 (73.6%) are family households, while 388 (26.4%) are nonfamily households. The most numerous type of family households are 2-person households, comprising 589, and the most common type of nonfamily households are 1-person households, comprising 305.
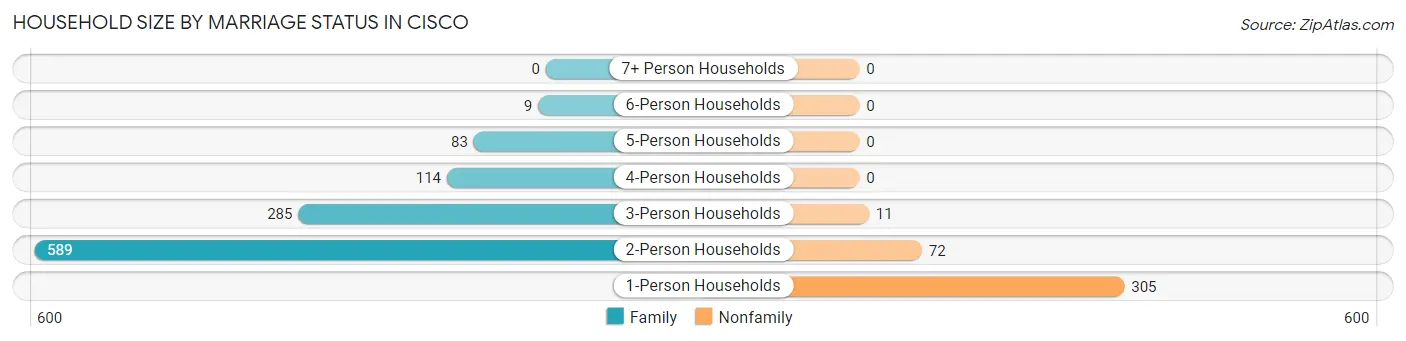
| Household Size | Family Households | Nonfamily Households |
| 1-Person Households | - | 305 (20.8%) |
| 2-Person Households | 589 (40.1%) | 72 (4.9%) |
| 3-Person Households | 285 (19.4%) | 11 (0.7%) |
| 4-Person Households | 114 (7.8%) | 0 (0.0%) |
| 5-Person Households | 83 (5.7%) | 0 (0.0%) |
| 6-Person Households | 9 (0.6%) | 0 (0.0%) |
| 7+ Person Households | 0 (0.0%) | 0 (0.0%) |
| Total | 1,080 (73.6%) | 388 (26.4%) |
Female Fertility in Cisco
Fertility by Age in Cisco
Average fertility rate in Cisco is 15.0 births per 1,000 women. Women in the age bracket of 15 to 19 years have the highest fertility rate with 48.0 births per 1,000 women. Women in the age bracket of 15 to 19 years acount for 100.0% of all women with births.
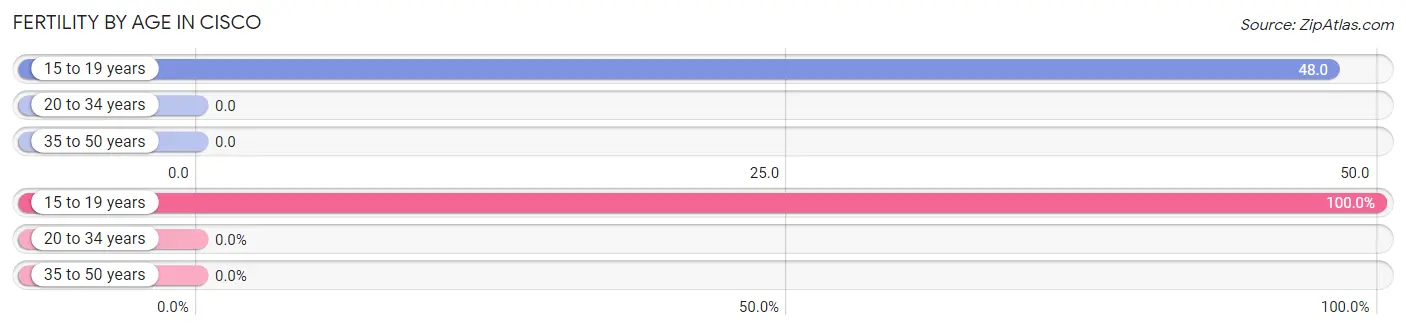
| Age Bracket | Women with Births | Births / 1,000 Women |
| 15 to 19 years | 14 (100.0%) | 48.0 |
| 20 to 34 years | 0 (0.0%) | 0.0 |
| 35 to 50 years | 0 (0.0%) | 0.0 |
| Total | 14 (100.0%) | 15.0 |
Fertility by Age by Marriage Status in Cisco
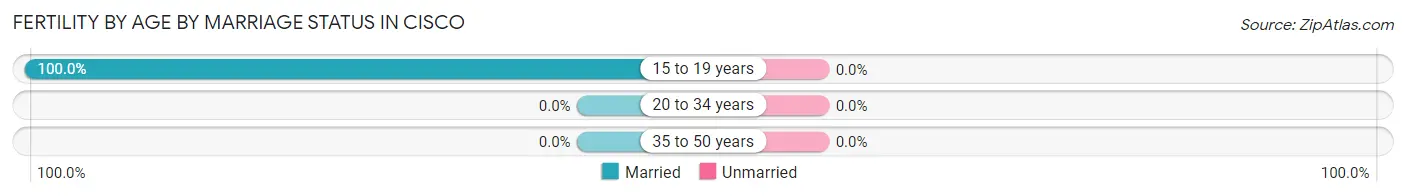
| Age Bracket | Married | Unmarried |
| 15 to 19 years | 14 (100.0%) | 0 (0.0%) |
| 20 to 34 years | 0 (0.0%) | 0 (0.0%) |
| 35 to 50 years | 0 (0.0%) | 0 (0.0%) |
| Total | 14 (100.0%) | 0 (0.0%) |
Fertility by Education in Cisco
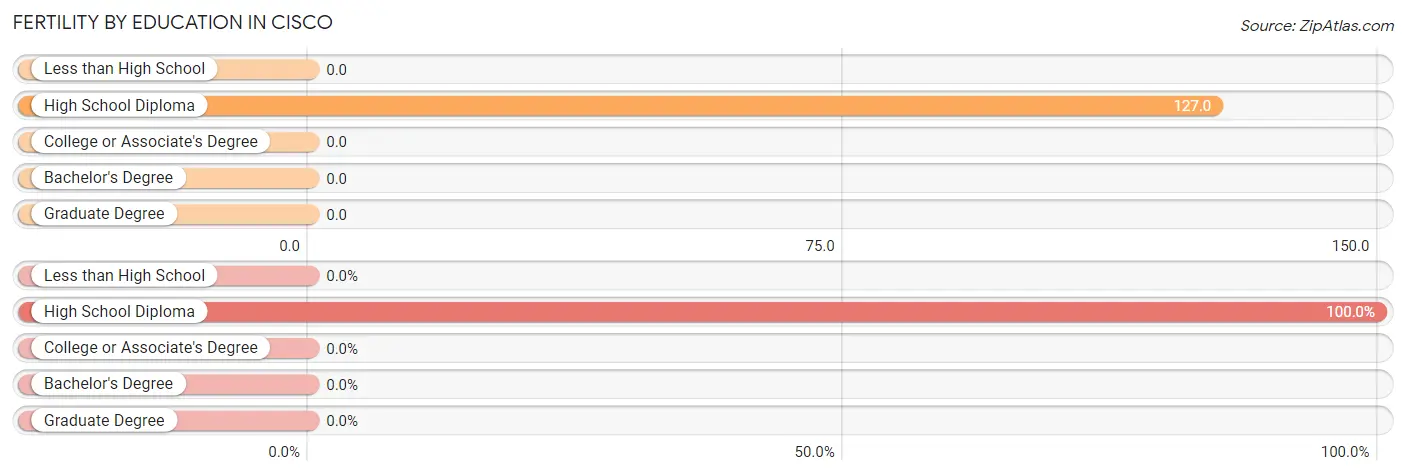
| Educational Attainment | Women with Births | Births / 1,000 Women |
| Less than High School | 0 (0.0%) | 0.0 |
| High School Diploma | 14 (100.0%) | 127.0 |
| College or Associate's Degree | 0 (0.0%) | 0.0 |
| Bachelor's Degree | 0 (0.0%) | 0.0 |
| Graduate Degree | 0 (0.0%) | 0.0 |
| Total | 14 (100.0%) | 15.0 |
Fertility by Education by Marriage Status in Cisco
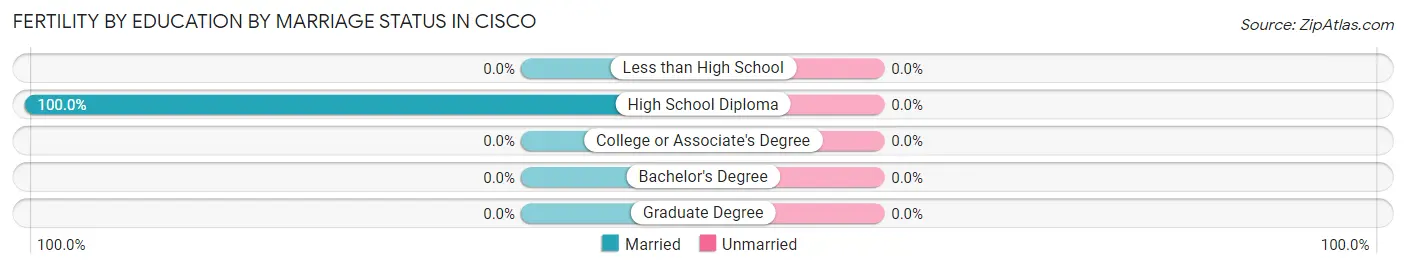
| Educational Attainment | Married | Unmarried |
| Less than High School | 0 (0.0%) | 0 (0.0%) |
| High School Diploma | 14 (100.0%) | 0 (0.0%) |
| College or Associate's Degree | 0 (0.0%) | 0 (0.0%) |
| Bachelor's Degree | 0 (0.0%) | 0 (0.0%) |
| Graduate Degree | 0 (0.0%) | 0 (0.0%) |
| Total | 14 (100.0%) | 0 (0.0%) |
Employment Characteristics in Cisco
Employment by Class of Employer in Cisco
Among the 1,721 employed individuals in Cisco, private company employees (731 | 42.5%), not-for-profit organizations (348 | 20.2%), and local government employees (200 | 11.6%) make up the most common classes of employment.
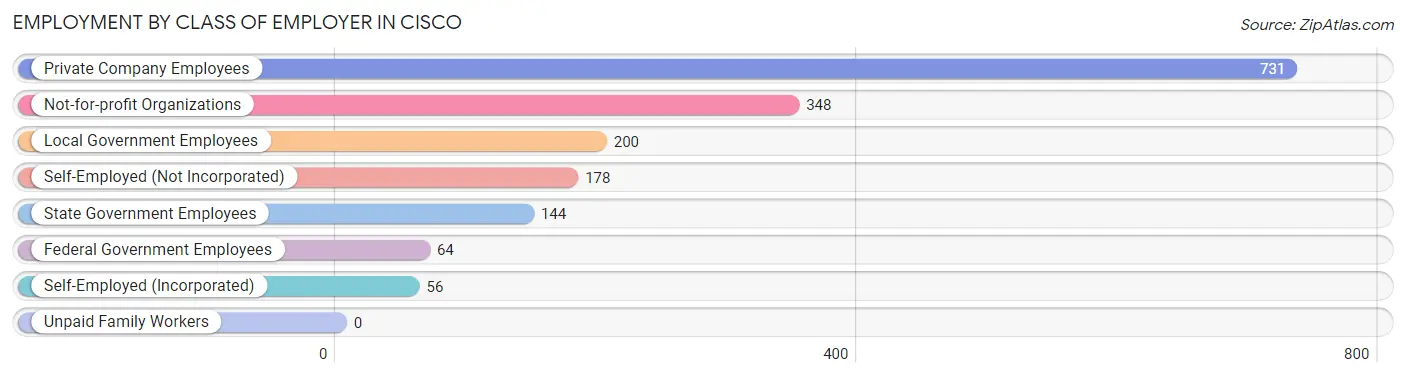
| Employer Class | # Employees | % Employees |
| Private Company Employees | 731 | 42.5% |
| Self-Employed (Incorporated) | 56 | 3.3% |
| Self-Employed (Not Incorporated) | 178 | 10.3% |
| Not-for-profit Organizations | 348 | 20.2% |
| Local Government Employees | 200 | 11.6% |
| State Government Employees | 144 | 8.4% |
| Federal Government Employees | 64 | 3.7% |
| Unpaid Family Workers | 0 | 0.0% |
| Total | 1,721 | 100.0% |
Employment Status by Age in Cisco
According to the labor force statistics for Cisco, out of the total population over 16 years of age (3,242), 58.2% or 1,887 individuals are in the labor force, with 6.5% or 123 of them unemployed. The age group with the highest labor force participation rate is 35 to 44 years, with 100.0% or 320 individuals in the labor force. Within the labor force, the 20 to 24 years age range has the highest percentage of unemployed individuals, with 32.2% or 108 of them being unemployed.
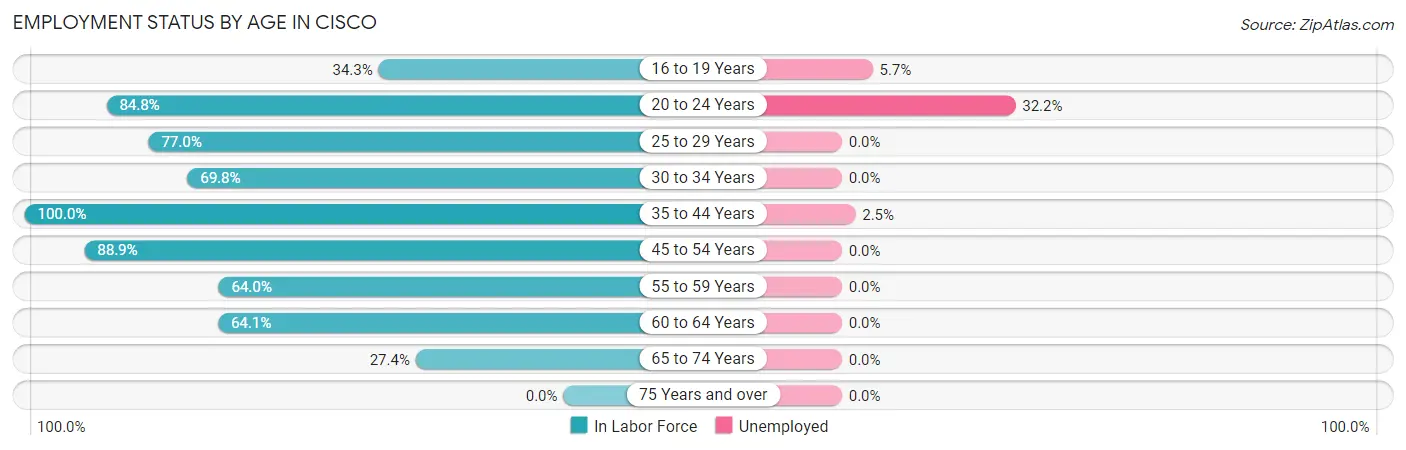
| Age Bracket | In Labor Force | Unemployed |
| 16 to 19 Years | 174 (34.3%) | 10 (5.7%) |
| 20 to 24 Years | 336 (84.8%) | 108 (32.2%) |
| 25 to 29 Years | 261 (77.0%) | 0 (0.0%) |
| 30 to 34 Years | 30 (69.8%) | 0 (0.0%) |
| 35 to 44 Years | 320 (100.0%) | 8 (2.5%) |
| 45 to 54 Years | 369 (88.9%) | 0 (0.0%) |
| 55 to 59 Years | 185 (64.0%) | 0 (0.0%) |
| 60 to 64 Years | 143 (64.1%) | 0 (0.0%) |
| 65 to 74 Years | 68 (27.4%) | 0 (0.0%) |
| 75 Years and over | 0 (0.0%) | 0 (0.0%) |
| Total | 1,887 (58.2%) | 123 (6.5%) |
Employment Status by Educational Attainment in Cisco
According to labor force statistics for Cisco, 80.3% of individuals (1,308) out of the total population between 25 and 64 years of age (1,629) are in the labor force, with 0.6% or 8 of them being unemployed. The group with the highest labor force participation rate are those with the educational attainment of bachelor's degree or higher, with 89.4% or 574 individuals in the labor force. Within the labor force, individuals with college / associate degree education have the highest percentage of unemployment, with 1.6% or 8 of them being unemployed.
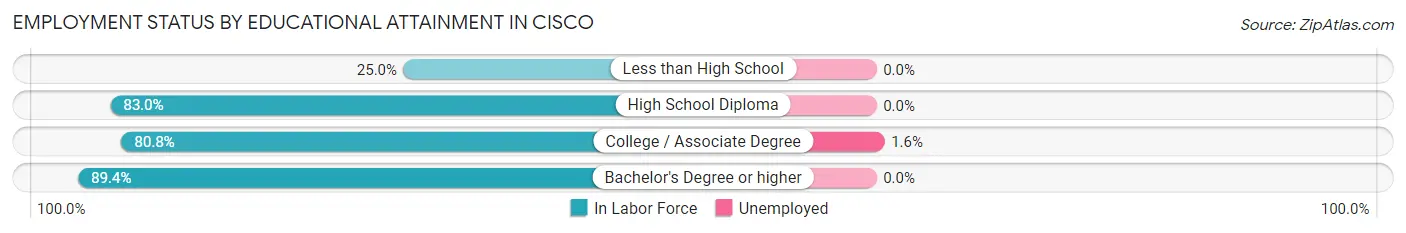
| Educational Attainment | In Labor Force | Unemployed |
| Less than High School | 31 (25.0%) | 0 (0.0%) |
| High School Diploma | 210 (83.0%) | 0 (0.0%) |
| College / Associate Degree | 493 (80.8%) | 10 (1.6%) |
| Bachelor's Degree or higher | 574 (89.4%) | 0 (0.0%) |
| Total | 1,308 (80.3%) | 10 (0.6%) |
Employment Occupations by Sex in Cisco
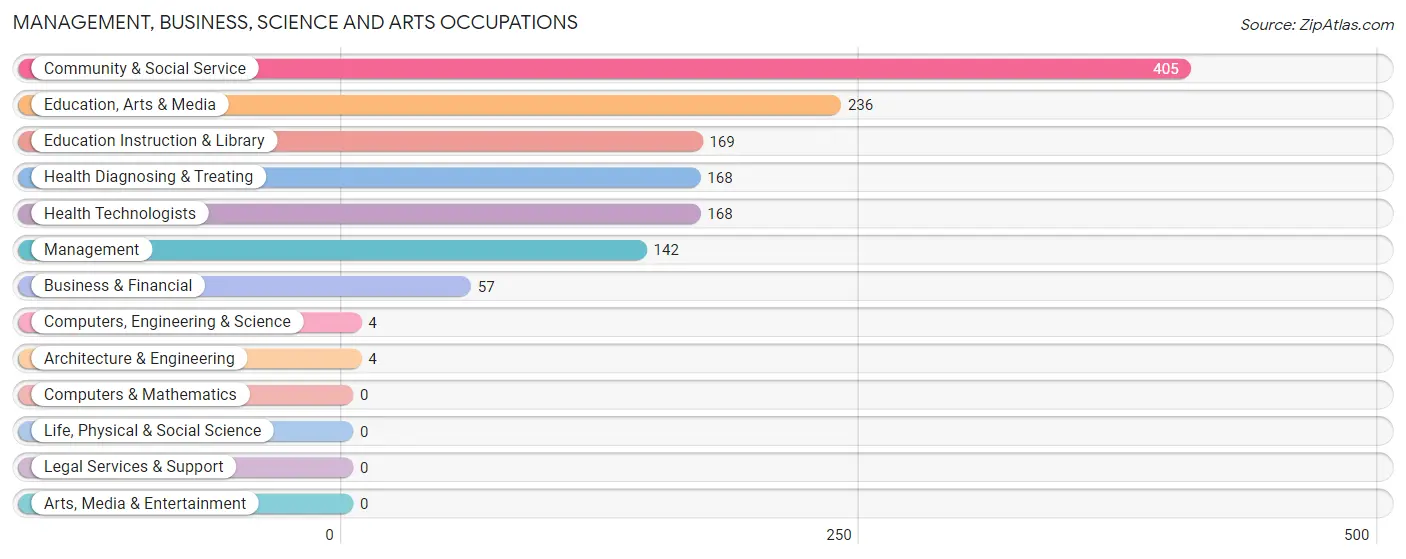
Management, Business, Science and Arts Occupations
The most common Management, Business, Science and Arts occupations in Cisco are Community & Social Service (405 | 23.1%), Education, Arts & Media (236 | 13.5%), Education Instruction & Library (169 | 9.7%), Health Diagnosing & Treating (168 | 9.6%), and Health Technologists (168 | 9.6%).
Management, Business, Science and Arts Occupations by Sex
Within the Management, Business, Science and Arts occupations in Cisco, the most male-oriented occupations are Computers, Engineering & Science (100.0%), Architecture & Engineering (100.0%), and Education, Arts & Media (87.3%), while the most female-oriented occupations are Education Instruction & Library (93.5%), Health Diagnosing & Treating (69.6%), and Health Technologists (69.6%).
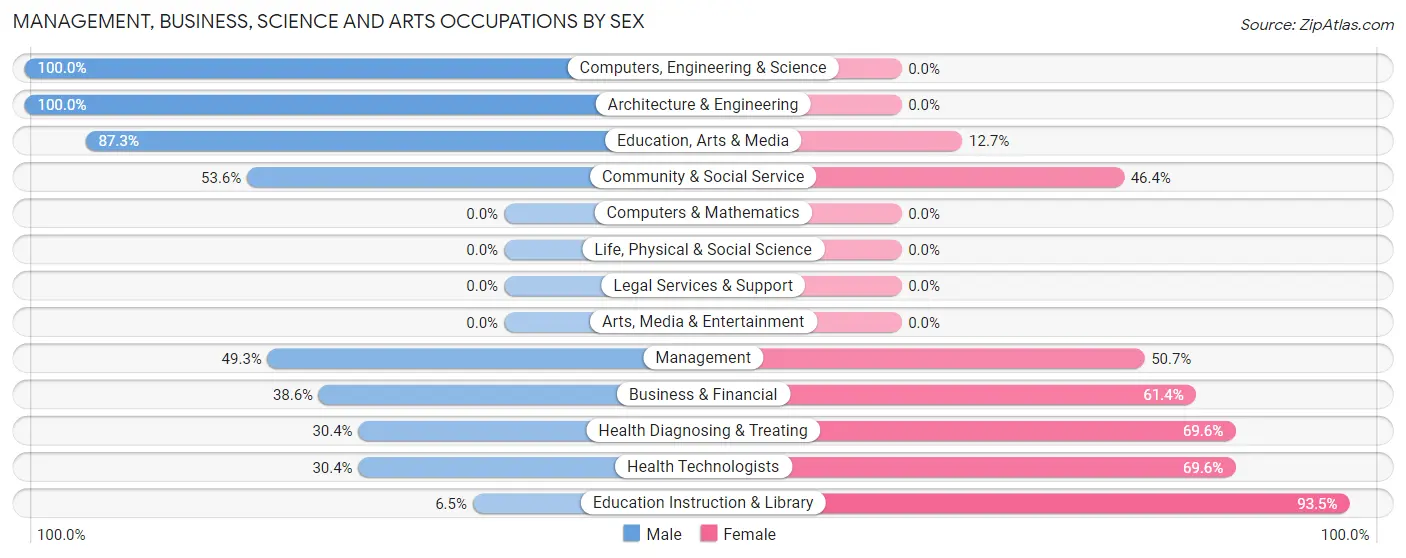
| Occupation | Male | Female |
| Management | 70 (49.3%) | 72 (50.7%) |
| Business & Financial | 22 (38.6%) | 35 (61.4%) |
| Computers, Engineering & Science | 4 (100.0%) | 0 (0.0%) |
| Computers & Mathematics | 0 (0.0%) | 0 (0.0%) |
| Architecture & Engineering | 4 (100.0%) | 0 (0.0%) |
| Life, Physical & Social Science | 0 (0.0%) | 0 (0.0%) |
| Community & Social Service | 217 (53.6%) | 188 (46.4%) |
| Education, Arts & Media | 206 (87.3%) | 30 (12.7%) |
| Legal Services & Support | 0 (0.0%) | 0 (0.0%) |
| Education Instruction & Library | 11 (6.5%) | 158 (93.5%) |
| Arts, Media & Entertainment | 0 (0.0%) | 0 (0.0%) |
| Health Diagnosing & Treating | 51 (30.4%) | 117 (69.6%) |
| Health Technologists | 51 (30.4%) | 117 (69.6%) |
| Total (Category) | 364 (46.9%) | 412 (53.1%) |
| Total (Overall) | 947 (54.1%) | 804 (45.9%) |
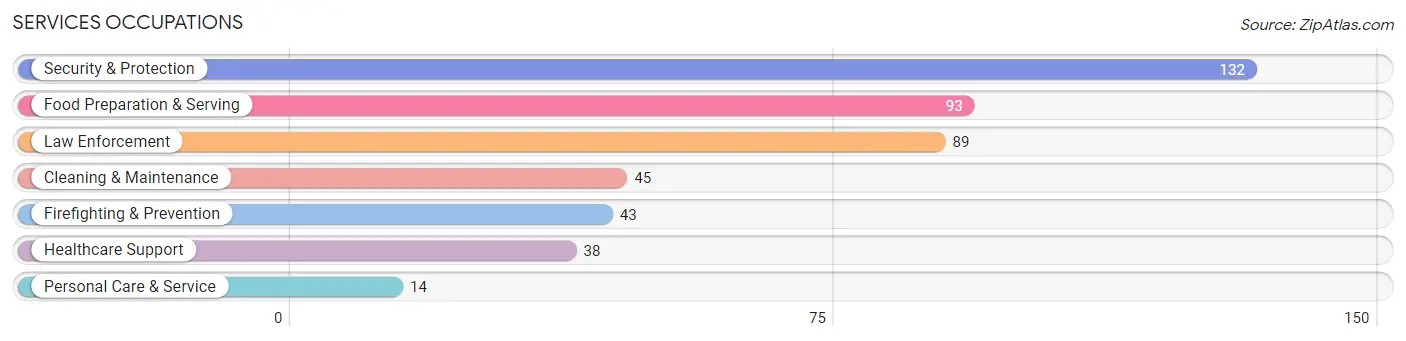
Services Occupations
The most common Services occupations in Cisco are Security & Protection (132 | 7.5%), Food Preparation & Serving (93 | 5.3%), Law Enforcement (89 | 5.1%), Cleaning & Maintenance (45 | 2.6%), and Firefighting & Prevention (43 | 2.5%).
Services Occupations by Sex
Within the Services occupations in Cisco, the most male-oriented occupations are Law Enforcement (100.0%), Cleaning & Maintenance (100.0%), and Security & Protection (67.4%), while the most female-oriented occupations are Healthcare Support (100.0%), Firefighting & Prevention (100.0%), and Food Preparation & Serving (100.0%).
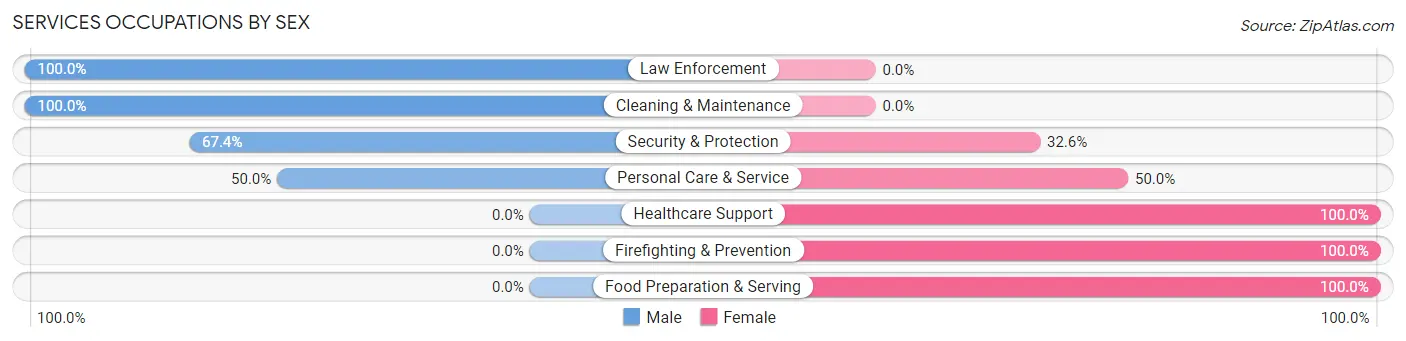
| Occupation | Male | Female |
| Healthcare Support | 0 (0.0%) | 38 (100.0%) |
| Security & Protection | 89 (67.4%) | 43 (32.6%) |
| Firefighting & Prevention | 0 (0.0%) | 43 (100.0%) |
| Law Enforcement | 89 (100.0%) | 0 (0.0%) |
| Food Preparation & Serving | 0 (0.0%) | 93 (100.0%) |
| Cleaning & Maintenance | 45 (100.0%) | 0 (0.0%) |
| Personal Care & Service | 7 (50.0%) | 7 (50.0%) |
| Total (Category) | 141 (43.8%) | 181 (56.2%) |
| Total (Overall) | 947 (54.1%) | 804 (45.9%) |
Sales and Office Occupations
The most common Sales and Office occupations in Cisco are Sales & Related (181 | 10.3%), and Office & Administration (81 | 4.6%).
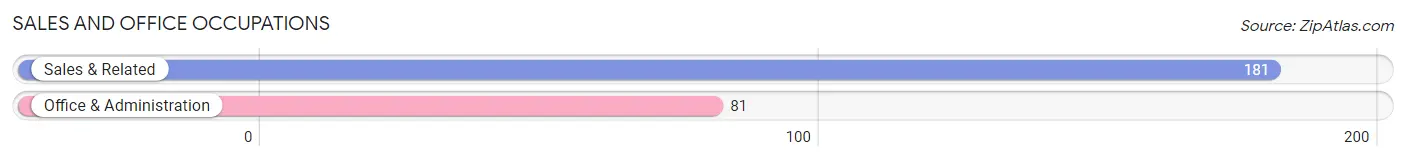
Sales and Office Occupations by Sex

| Occupation | Male | Female |
| Sales & Related | 98 (54.1%) | 83 (45.9%) |
| Office & Administration | 0 (0.0%) | 81 (100.0%) |
| Total (Category) | 98 (37.4%) | 164 (62.6%) |
| Total (Overall) | 947 (54.1%) | 804 (45.9%) |
Natural Resources, Construction and Maintenance Occupations
The most common Natural Resources, Construction and Maintenance occupations in Cisco are Construction & Extraction (206 | 11.8%), and Farming, Fishing & Forestry (6 | 0.3%).

Natural Resources, Construction and Maintenance Occupations by Sex

| Occupation | Male | Female |
| Farming, Fishing & Forestry | 6 (100.0%) | 0 (0.0%) |
| Construction & Extraction | 191 (92.7%) | 15 (7.3%) |
| Installation, Maintenance & Repair | 0 (0.0%) | 0 (0.0%) |
| Total (Category) | 197 (92.9%) | 15 (7.1%) |
| Total (Overall) | 947 (54.1%) | 804 (45.9%) |
Production, Transportation and Moving Occupations
The most common Production, Transportation and Moving occupations in Cisco are Production (64 | 3.7%), Transportation (61 | 3.5%), and Material Moving (54 | 3.1%).
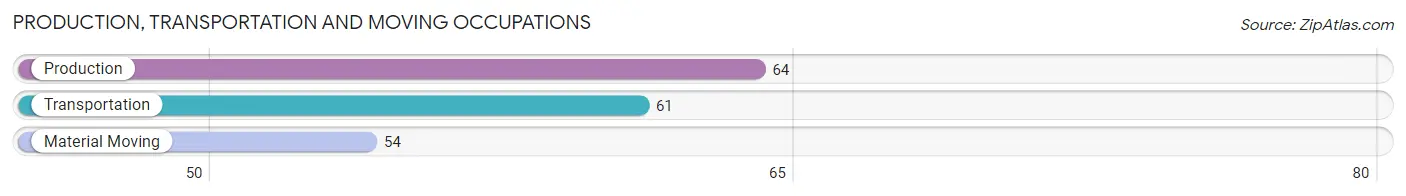
Production, Transportation and Moving Occupations by Sex
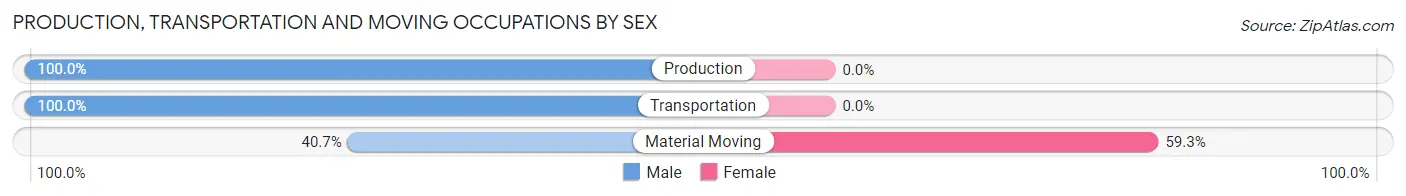
| Occupation | Male | Female |
| Production | 64 (100.0%) | 0 (0.0%) |
| Transportation | 61 (100.0%) | 0 (0.0%) |
| Material Moving | 22 (40.7%) | 32 (59.3%) |
| Total (Category) | 147 (82.1%) | 32 (17.9%) |
| Total (Overall) | 947 (54.1%) | 804 (45.9%) |
Employment Industries by Sex in Cisco
Employment Industries in Cisco
The major employment industries in Cisco include Health Care & Social Assistance (330 | 18.9%), Educational Services (231 | 13.2%), Construction (217 | 12.4%), Retail Trade (169 | 9.7%), and Public Administration (159 | 9.1%).
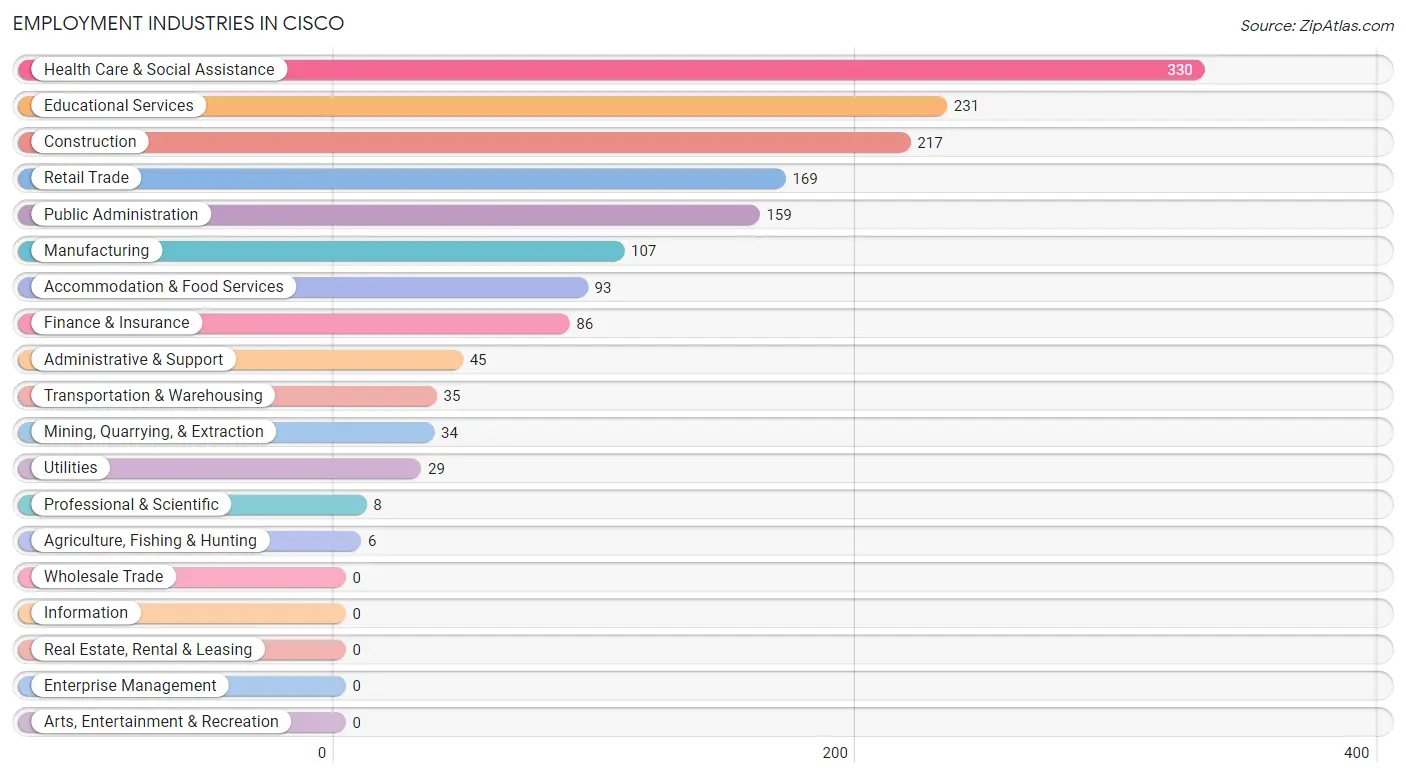
Employment Industries by Sex in Cisco
The Cisco industries that see more men than women are Agriculture, Fishing & Hunting (100.0%), Manufacturing (100.0%), and Transportation & Warehousing (100.0%), whereas the industries that tend to have a higher number of women are Accommodation & Food Services (100.0%), Educational Services (82.7%), and Health Care & Social Assistance (79.1%).
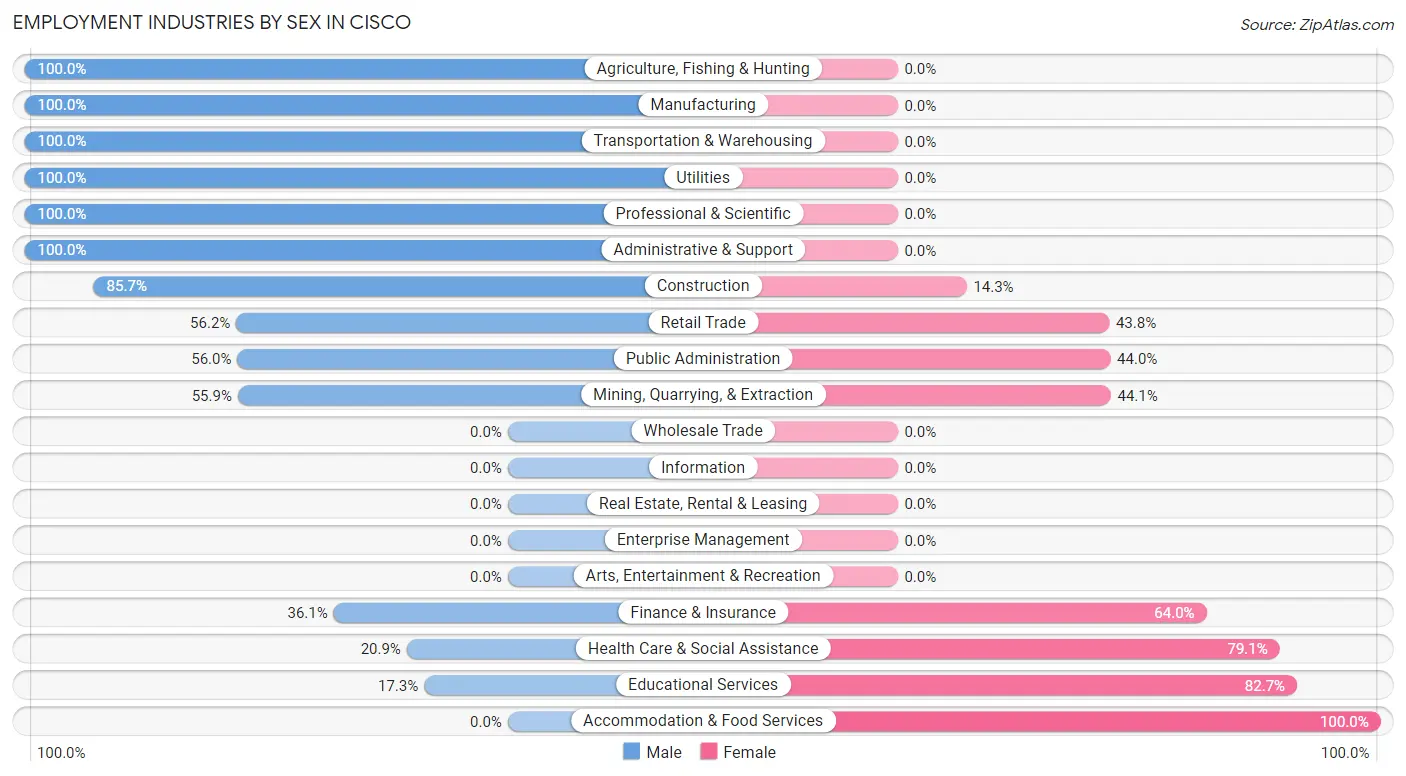
| Industry | Male | Female |
| Agriculture, Fishing & Hunting | 6 (100.0%) | 0 (0.0%) |
| Mining, Quarrying, & Extraction | 19 (55.9%) | 15 (44.1%) |
| Construction | 186 (85.7%) | 31 (14.3%) |
| Manufacturing | 107 (100.0%) | 0 (0.0%) |
| Wholesale Trade | 0 (0.0%) | 0 (0.0%) |
| Retail Trade | 95 (56.2%) | 74 (43.8%) |
| Transportation & Warehousing | 35 (100.0%) | 0 (0.0%) |
| Utilities | 29 (100.0%) | 0 (0.0%) |
| Information | 0 (0.0%) | 0 (0.0%) |
| Finance & Insurance | 31 (36.0%) | 55 (63.9%) |
| Real Estate, Rental & Leasing | 0 (0.0%) | 0 (0.0%) |
| Professional & Scientific | 8 (100.0%) | 0 (0.0%) |
| Enterprise Management | 0 (0.0%) | 0 (0.0%) |
| Administrative & Support | 45 (100.0%) | 0 (0.0%) |
| Educational Services | 40 (17.3%) | 191 (82.7%) |
| Health Care & Social Assistance | 69 (20.9%) | 261 (79.1%) |
| Arts, Entertainment & Recreation | 0 (0.0%) | 0 (0.0%) |
| Accommodation & Food Services | 0 (0.0%) | 93 (100.0%) |
| Public Administration | 89 (56.0%) | 70 (44.0%) |
| Total | 947 (54.1%) | 804 (45.9%) |
Education in Cisco
School Enrollment in Cisco
The most common levels of schooling among the 1,279 students in Cisco are college / undergraduate (508 | 39.7%), high school (289 | 22.6%), and nursery / preschool (160 | 12.5%).
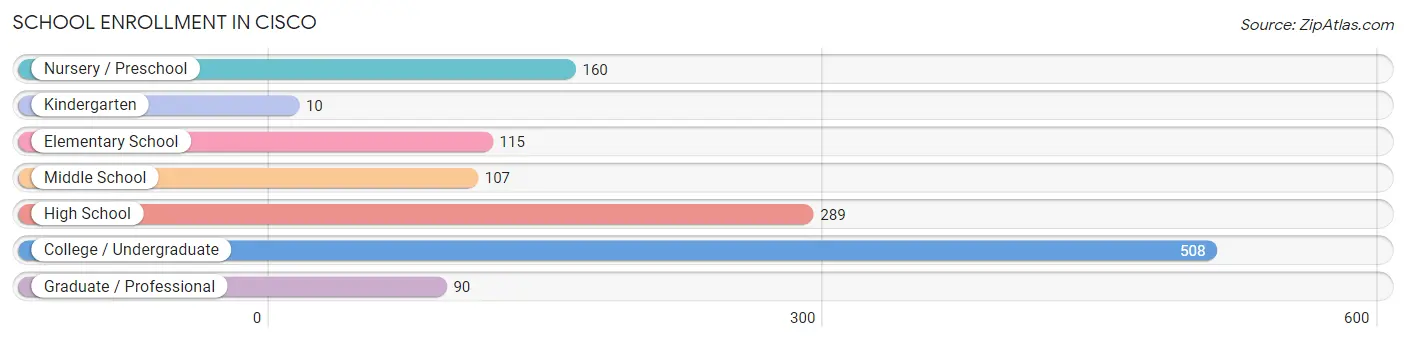
| School Level | # Students | % Students |
| Nursery / Preschool | 160 | 12.5% |
| Kindergarten | 10 | 0.8% |
| Elementary School | 115 | 9.0% |
| Middle School | 107 | 8.4% |
| High School | 289 | 22.6% |
| College / Undergraduate | 508 | 39.7% |
| Graduate / Professional | 90 | 7.0% |
| Total | 1,279 | 100.0% |
School Enrollment by Age by Funding Source in Cisco
Out of a total of 1,279 students who are enrolled in schools in Cisco, 281 (22.0%) attend a private institution, while the remaining 998 (78.0%) are enrolled in public schools. The age group of 3 to 4 year olds has the highest likelihood of being enrolled in private schools, with 94 (85.5% in the age bracket) enrolled. Conversely, the age group of 10 to 14 year olds has the lowest likelihood of being enrolled in a private school, with 146 (100.0% in the age bracket) attending a public institution.
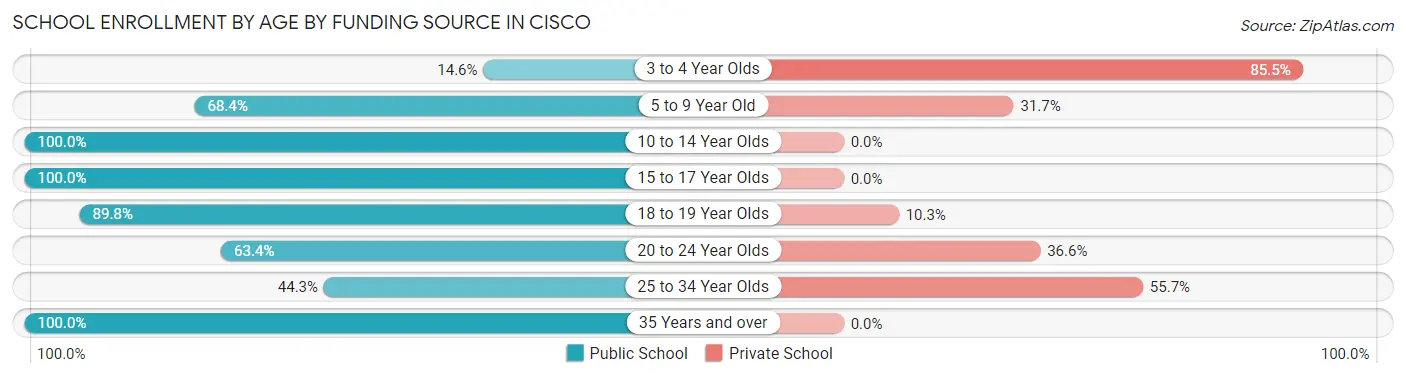
| Age Bracket | Public School | Private School |
| 3 to 4 Year Olds | 16 (14.5%) | 94 (85.5%) |
| 5 to 9 Year Old | 108 (68.3%) | 50 (31.7%) |
| 10 to 14 Year Olds | 146 (100.0%) | 0 (0.0%) |
| 15 to 17 Year Olds | 253 (100.0%) | 0 (0.0%) |
| 18 to 19 Year Olds | 254 (89.7%) | 29 (10.2%) |
| 20 to 24 Year Olds | 71 (63.4%) | 41 (36.6%) |
| 25 to 34 Year Olds | 54 (44.3%) | 68 (55.7%) |
| 35 Years and over | 95 (100.0%) | 0 (0.0%) |
| Total | 998 (78.0%) | 281 (22.0%) |
Educational Attainment by Field of Study in Cisco
Computers & mathematics (137 | 19.2%), science & technology (125 | 17.6%), arts & humanities (106 | 14.9%), liberal arts & history (69 | 9.7%), and social sciences (68 | 9.6%) are the most common fields of study among 712 individuals in Cisco who have obtained a bachelor's degree or higher.
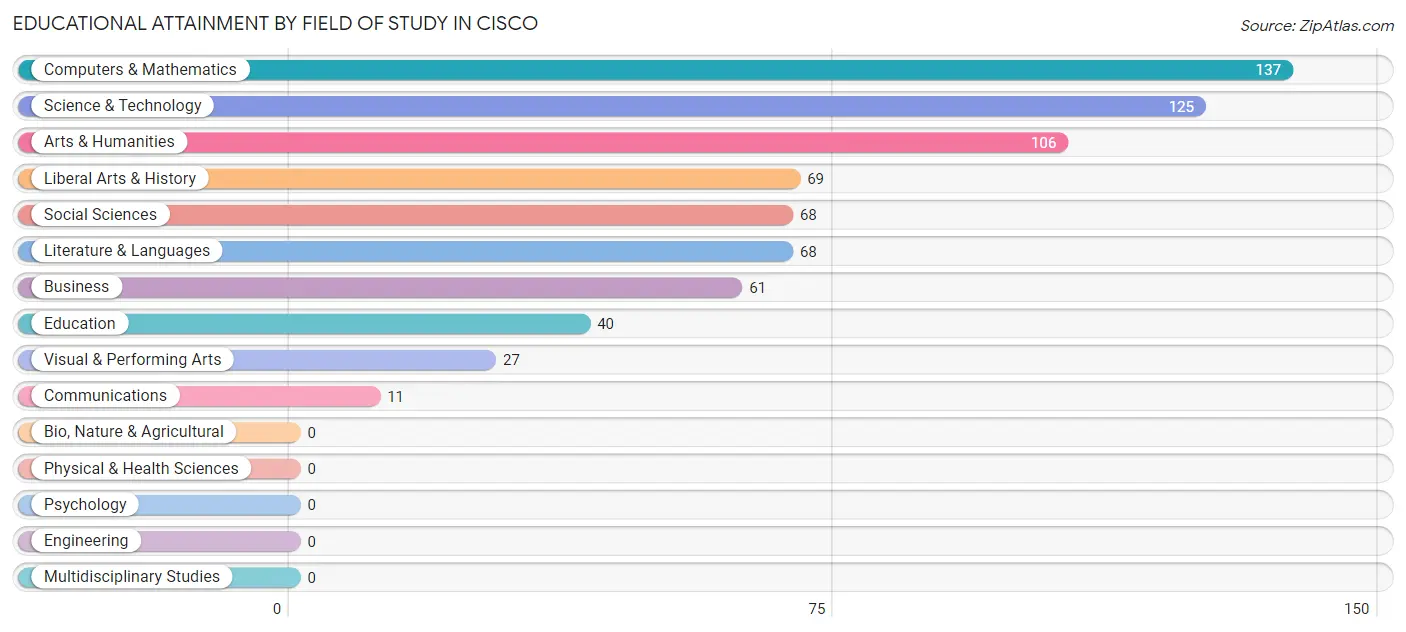
| Field of Study | # Graduates | % Graduates |
| Computers & Mathematics | 137 | 19.2% |
| Bio, Nature & Agricultural | 0 | 0.0% |
| Physical & Health Sciences | 0 | 0.0% |
| Psychology | 0 | 0.0% |
| Social Sciences | 68 | 9.6% |
| Engineering | 0 | 0.0% |
| Multidisciplinary Studies | 0 | 0.0% |
| Science & Technology | 125 | 17.6% |
| Business | 61 | 8.6% |
| Education | 40 | 5.6% |
| Literature & Languages | 68 | 9.6% |
| Liberal Arts & History | 69 | 9.7% |
| Visual & Performing Arts | 27 | 3.8% |
| Communications | 11 | 1.5% |
| Arts & Humanities | 106 | 14.9% |
| Total | 712 | 100.0% |
Transportation & Commute in Cisco
Vehicle Availability by Sex in Cisco
The most prevalent vehicle ownership categories in Cisco are males with 2 vehicles (526, accounting for 58.0%) and females with 2 vehicles (392, making up 71.1%).
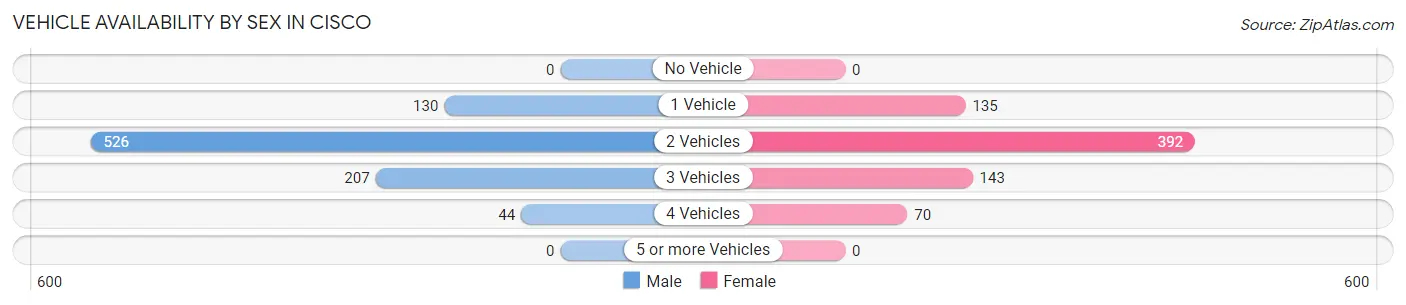
| Vehicles Available | Male | Female |
| No Vehicle | 0 (0.0%) | 0 (0.0%) |
| 1 Vehicle | 130 (14.3%) | 135 (18.2%) |
| 2 Vehicles | 526 (58.0%) | 392 (53.0%) |
| 3 Vehicles | 207 (22.8%) | 143 (19.3%) |
| 4 Vehicles | 44 (4.9%) | 70 (9.5%) |
| 5 or more Vehicles | 0 (0.0%) | 0 (0.0%) |
| Total | 907 (100.0%) | 740 (100.0%) |
Commute Time in Cisco
The most frequently occuring commute durations in Cisco are 5 to 9 minutes (602 commuters, 35.9%), 10 to 14 minutes (177 commuters, 10.6%), and 45 to 59 minutes (176 commuters, 10.5%).
| Commute Time | # Commuters | % Commuters |
| Less than 5 Minutes | 172 | 10.3% |
| 5 to 9 Minutes | 602 | 35.9% |
| 10 to 14 Minutes | 177 | 10.6% |
| 15 to 19 Minutes | 173 | 10.3% |
| 20 to 24 Minutes | 92 | 5.5% |
| 25 to 29 Minutes | 48 | 2.9% |
| 30 to 34 Minutes | 28 | 1.7% |
| 35 to 39 Minutes | 0 | 0.0% |
| 40 to 44 Minutes | 12 | 0.7% |
| 45 to 59 Minutes | 176 | 10.5% |
| 60 to 89 Minutes | 105 | 6.3% |
| 90 or more Minutes | 91 | 5.4% |
Commute Time by Sex in Cisco
The most common commute times in Cisco are 5 to 9 minutes (359 commuters, 38.6%) for males and 5 to 9 minutes (243 commuters, 32.6%) for females.
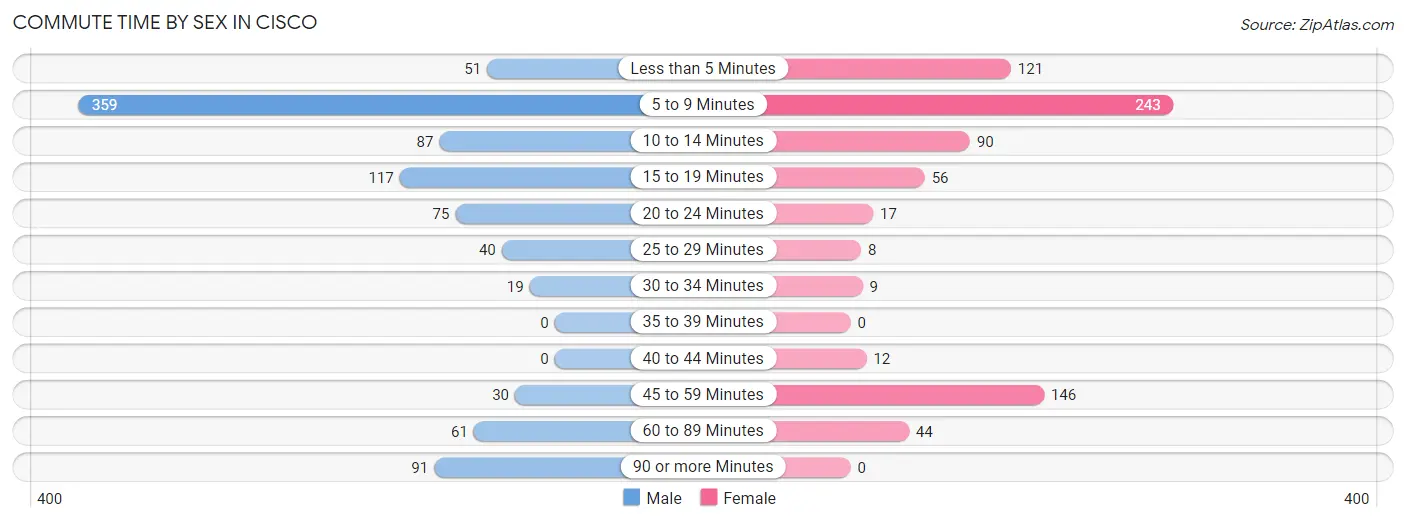
| Commute Time | Male | Female |
| Less than 5 Minutes | 51 (5.5%) | 121 (16.2%) |
| 5 to 9 Minutes | 359 (38.6%) | 243 (32.6%) |
| 10 to 14 Minutes | 87 (9.3%) | 90 (12.1%) |
| 15 to 19 Minutes | 117 (12.6%) | 56 (7.5%) |
| 20 to 24 Minutes | 75 (8.1%) | 17 (2.3%) |
| 25 to 29 Minutes | 40 (4.3%) | 8 (1.1%) |
| 30 to 34 Minutes | 19 (2.0%) | 9 (1.2%) |
| 35 to 39 Minutes | 0 (0.0%) | 0 (0.0%) |
| 40 to 44 Minutes | 0 (0.0%) | 12 (1.6%) |
| 45 to 59 Minutes | 30 (3.2%) | 146 (19.6%) |
| 60 to 89 Minutes | 61 (6.6%) | 44 (5.9%) |
| 90 or more Minutes | 91 (9.8%) | 0 (0.0%) |
Time of Departure to Work by Sex in Cisco
The most frequent times of departure to work in Cisco are 5:30 AM to 5:59 AM (218, 23.4%) for males and 7:30 AM to 7:59 AM (215, 28.8%) for females.
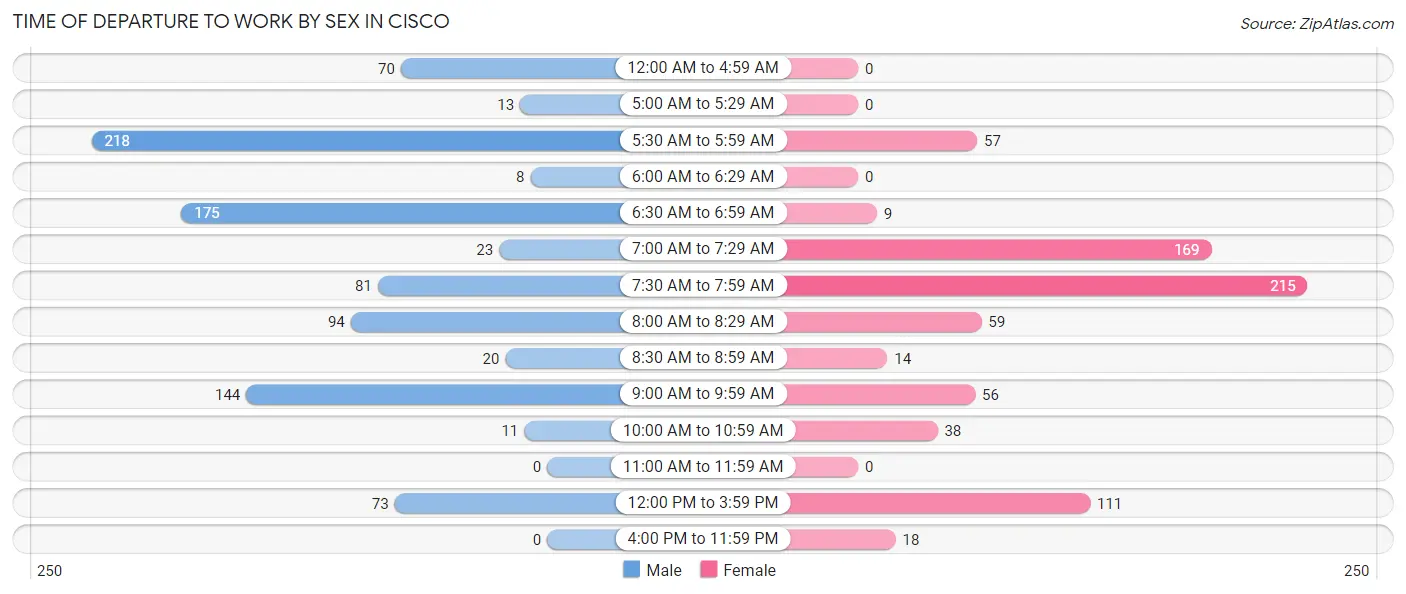
| Time of Departure | Male | Female |
| 12:00 AM to 4:59 AM | 70 (7.5%) | 0 (0.0%) |
| 5:00 AM to 5:29 AM | 13 (1.4%) | 0 (0.0%) |
| 5:30 AM to 5:59 AM | 218 (23.4%) | 57 (7.6%) |
| 6:00 AM to 6:29 AM | 8 (0.9%) | 0 (0.0%) |
| 6:30 AM to 6:59 AM | 175 (18.8%) | 9 (1.2%) |
| 7:00 AM to 7:29 AM | 23 (2.5%) | 169 (22.7%) |
| 7:30 AM to 7:59 AM | 81 (8.7%) | 215 (28.8%) |
| 8:00 AM to 8:29 AM | 94 (10.1%) | 59 (7.9%) |
| 8:30 AM to 8:59 AM | 20 (2.1%) | 14 (1.9%) |
| 9:00 AM to 9:59 AM | 144 (15.5%) | 56 (7.5%) |
| 10:00 AM to 10:59 AM | 11 (1.2%) | 38 (5.1%) |
| 11:00 AM to 11:59 AM | 0 (0.0%) | 0 (0.0%) |
| 12:00 PM to 3:59 PM | 73 (7.9%) | 111 (14.9%) |
| 4:00 PM to 11:59 PM | 0 (0.0%) | 18 (2.4%) |
| Total | 930 (100.0%) | 746 (100.0%) |
Housing Occupancy in Cisco
Occupancy by Ownership in Cisco
Of the total 1,468 dwellings in Cisco, owner-occupied units account for 942 (64.2%), while renter-occupied units make up 526 (35.8%).
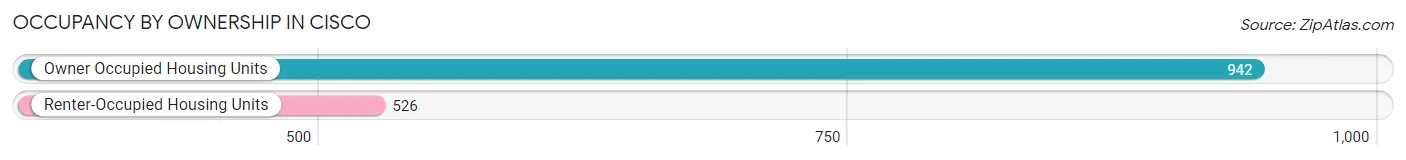
| Occupancy | # Housing Units | % Housing Units |
| Owner Occupied Housing Units | 942 | 64.2% |
| Renter-Occupied Housing Units | 526 | 35.8% |
| Total Occupied Housing Units | 1,468 | 100.0% |
Occupancy by Household Size in Cisco
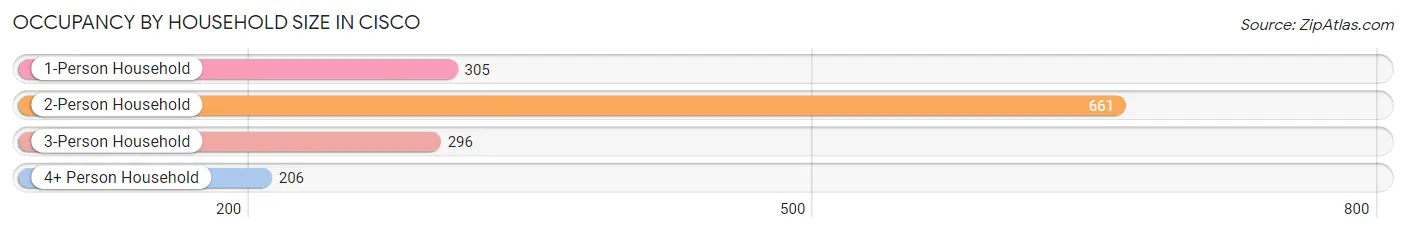
| Household Size | # Housing Units | % Housing Units |
| 1-Person Household | 305 | 20.8% |
| 2-Person Household | 661 | 45.0% |
| 3-Person Household | 296 | 20.2% |
| 4+ Person Household | 206 | 14.0% |
| Total Housing Units | 1,468 | 100.0% |
Occupancy by Ownership by Household Size in Cisco
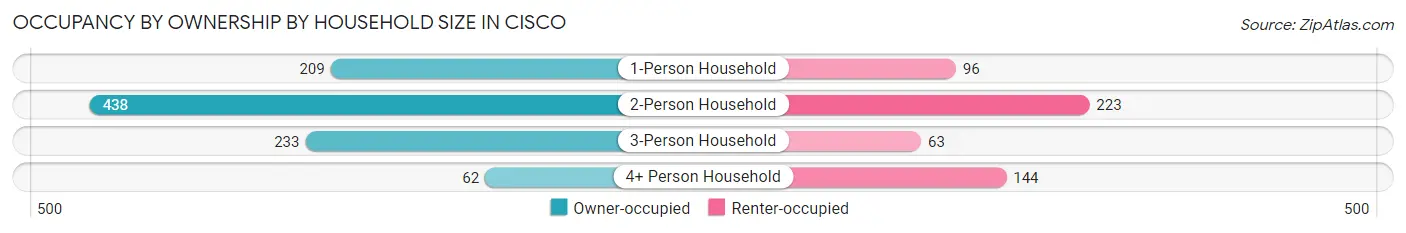
| Household Size | Owner-occupied | Renter-occupied |
| 1-Person Household | 209 (68.5%) | 96 (31.5%) |
| 2-Person Household | 438 (66.3%) | 223 (33.7%) |
| 3-Person Household | 233 (78.7%) | 63 (21.3%) |
| 4+ Person Household | 62 (30.1%) | 144 (69.9%) |
| Total Housing Units | 942 (64.2%) | 526 (35.8%) |
Occupancy by Educational Attainment in Cisco
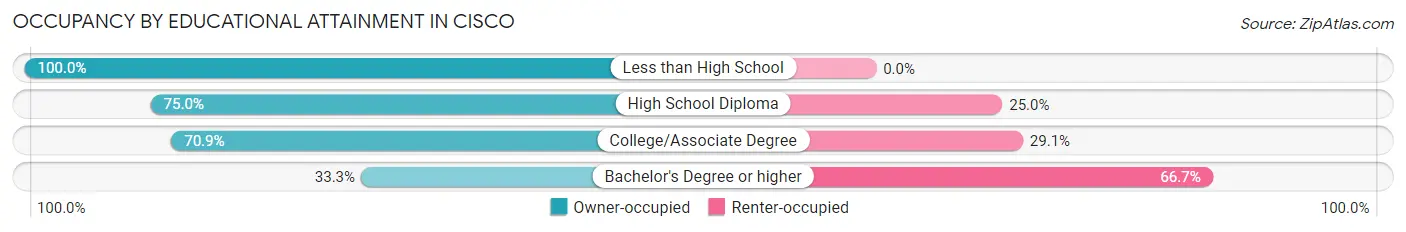
| Household Size | Owner-occupied | Renter-occupied |
| Less than High School | 93 (100.0%) | 0 (0.0%) |
| High School Diploma | 315 (75.0%) | 105 (25.0%) |
| College/Associate Degree | 407 (70.9%) | 167 (29.1%) |
| Bachelor's Degree or higher | 127 (33.3%) | 254 (66.7%) |
Occupancy by Age of Householder in Cisco
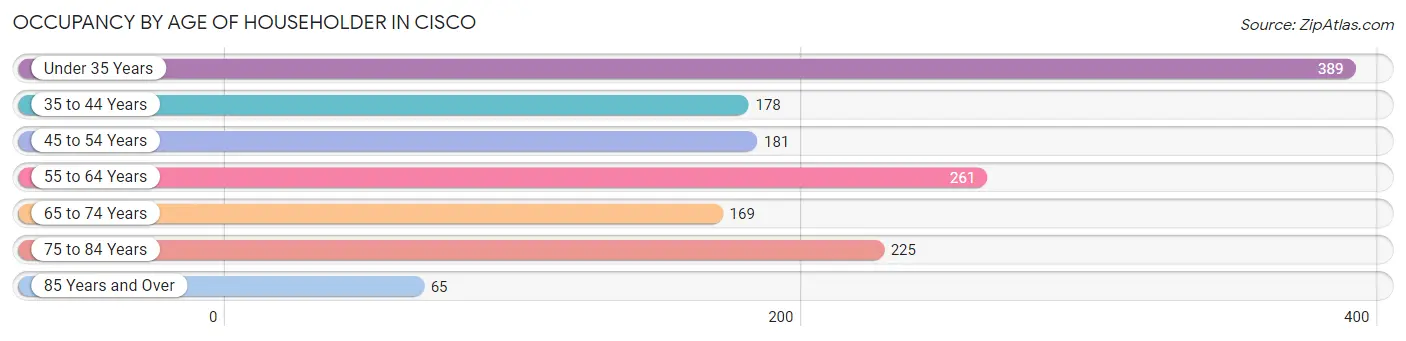
| Age Bracket | # Households | % Households |
| Under 35 Years | 389 | 26.5% |
| 35 to 44 Years | 178 | 12.1% |
| 45 to 54 Years | 181 | 12.3% |
| 55 to 64 Years | 261 | 17.8% |
| 65 to 74 Years | 169 | 11.5% |
| 75 to 84 Years | 225 | 15.3% |
| 85 Years and Over | 65 | 4.4% |
| Total | 1,468 | 100.0% |
Housing Finances in Cisco
Median Income by Occupancy in Cisco
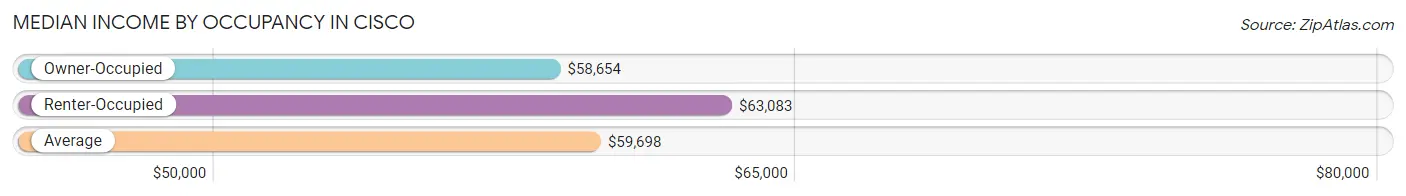
| Occupancy Type | # Households | Median Income |
| Owner-Occupied | 942 (64.2%) | $58,654 |
| Renter-Occupied | 526 (35.8%) | $63,083 |
| Average | 1,468 (100.0%) | $59,698 |
Occupancy by Householder Income Bracket in Cisco
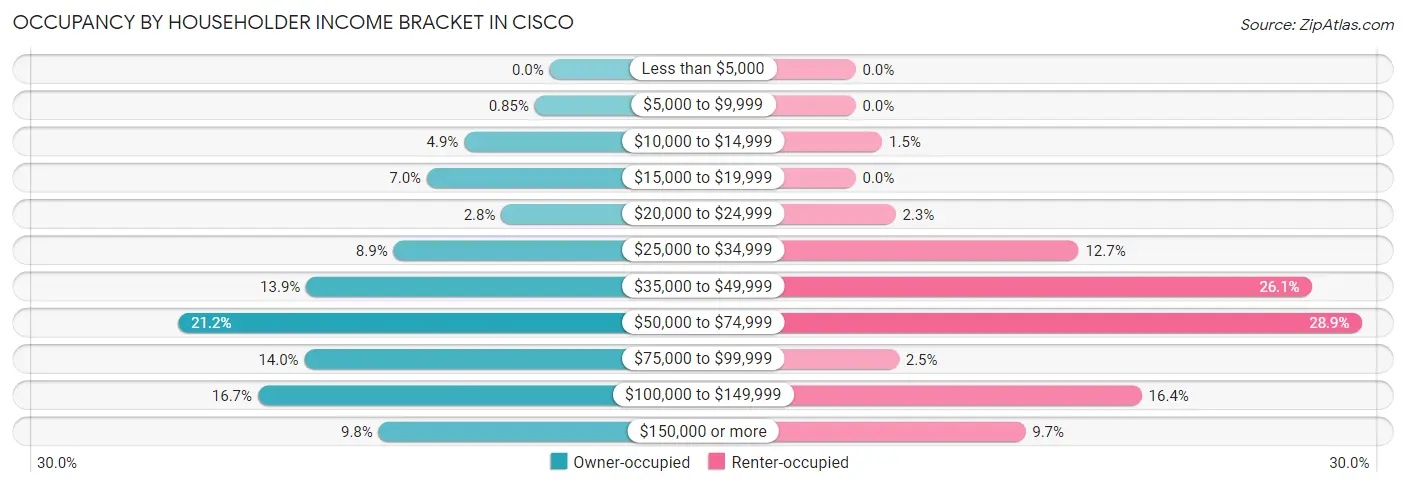
| Income Bracket | Owner-occupied | Renter-occupied |
| Less than $5,000 | 0 (0.0%) | 0 (0.0%) |
| $5,000 to $9,999 | 8 (0.9%) | 0 (0.0%) |
| $10,000 to $14,999 | 46 (4.9%) | 8 (1.5%) |
| $15,000 to $19,999 | 66 (7.0%) | 0 (0.0%) |
| $20,000 to $24,999 | 26 (2.8%) | 12 (2.3%) |
| $25,000 to $34,999 | 84 (8.9%) | 67 (12.7%) |
| $35,000 to $49,999 | 131 (13.9%) | 137 (26.1%) |
| $50,000 to $74,999 | 200 (21.2%) | 152 (28.9%) |
| $75,000 to $99,999 | 132 (14.0%) | 13 (2.5%) |
| $100,000 to $149,999 | 157 (16.7%) | 86 (16.4%) |
| $150,000 or more | 92 (9.8%) | 51 (9.7%) |
| Total | 942 (100.0%) | 526 (100.0%) |
Monthly Housing Cost Tiers in Cisco
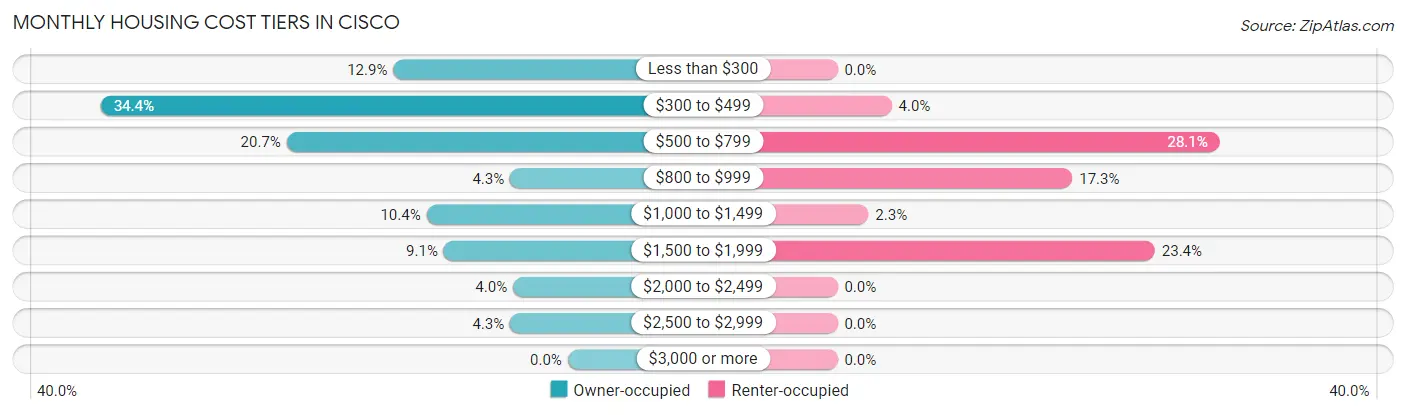
| Monthly Cost | Owner-occupied | Renter-occupied |
| Less than $300 | 121 (12.9%) | 0 (0.0%) |
| $300 to $499 | 324 (34.4%) | 21 (4.0%) |
| $500 to $799 | 195 (20.7%) | 148 (28.1%) |
| $800 to $999 | 40 (4.3%) | 91 (17.3%) |
| $1,000 to $1,499 | 98 (10.4%) | 12 (2.3%) |
| $1,500 to $1,999 | 86 (9.1%) | 123 (23.4%) |
| $2,000 to $2,499 | 38 (4.0%) | 0 (0.0%) |
| $2,500 to $2,999 | 40 (4.3%) | 0 (0.0%) |
| $3,000 or more | 0 (0.0%) | 0 (0.0%) |
| Total | 942 (100.0%) | 526 (100.0%) |
Physical Housing Characteristics in Cisco
Housing Structures in Cisco
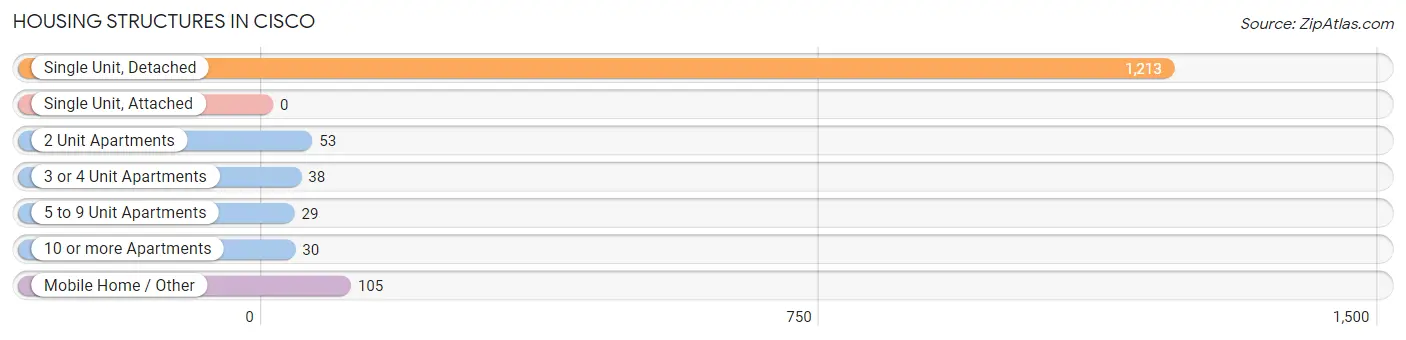
| Structure Type | # Housing Units | % Housing Units |
| Single Unit, Detached | 1,213 | 82.6% |
| Single Unit, Attached | 0 | 0.0% |
| 2 Unit Apartments | 53 | 3.6% |
| 3 or 4 Unit Apartments | 38 | 2.6% |
| 5 to 9 Unit Apartments | 29 | 2.0% |
| 10 or more Apartments | 30 | 2.0% |
| Mobile Home / Other | 105 | 7.1% |
| Total | 1,468 | 100.0% |
Housing Structures by Occupancy in Cisco
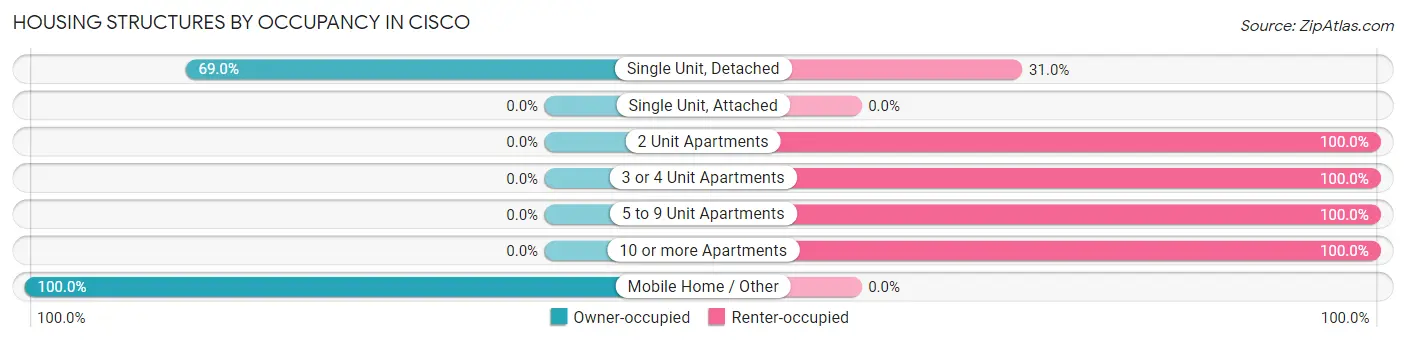
| Structure Type | Owner-occupied | Renter-occupied |
| Single Unit, Detached | 837 (69.0%) | 376 (31.0%) |
| Single Unit, Attached | 0 (0.0%) | 0 (0.0%) |
| 2 Unit Apartments | 0 (0.0%) | 53 (100.0%) |
| 3 or 4 Unit Apartments | 0 (0.0%) | 38 (100.0%) |
| 5 to 9 Unit Apartments | 0 (0.0%) | 29 (100.0%) |
| 10 or more Apartments | 0 (0.0%) | 30 (100.0%) |
| Mobile Home / Other | 105 (100.0%) | 0 (0.0%) |
| Total | 942 (64.2%) | 526 (35.8%) |
Housing Structures by Number of Rooms in Cisco
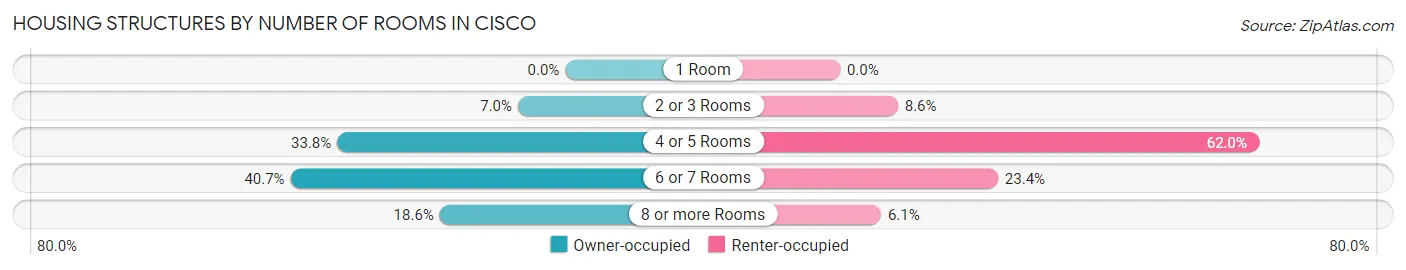
| Number of Rooms | Owner-occupied | Renter-occupied |
| 1 Room | 0 (0.0%) | 0 (0.0%) |
| 2 or 3 Rooms | 66 (7.0%) | 45 (8.6%) |
| 4 or 5 Rooms | 318 (33.8%) | 326 (62.0%) |
| 6 or 7 Rooms | 383 (40.7%) | 123 (23.4%) |
| 8 or more Rooms | 175 (18.6%) | 32 (6.1%) |
| Total | 942 (100.0%) | 526 (100.0%) |
Housing Structure by Heating Type in Cisco

| Heating Type | Owner-occupied | Renter-occupied |
| Utility Gas | 476 (50.5%) | 66 (12.6%) |
| Bottled, Tank, or LP Gas | 44 (4.7%) | 0 (0.0%) |
| Electricity | 422 (44.8%) | 438 (83.3%) |
| Fuel Oil or Kerosene | 0 (0.0%) | 0 (0.0%) |
| Coal or Coke | 0 (0.0%) | 0 (0.0%) |
| All other Fuels | 0 (0.0%) | 22 (4.2%) |
| No Fuel Used | 0 (0.0%) | 0 (0.0%) |
| Total | 942 (100.0%) | 526 (100.0%) |
Household Vehicle Usage in Cisco
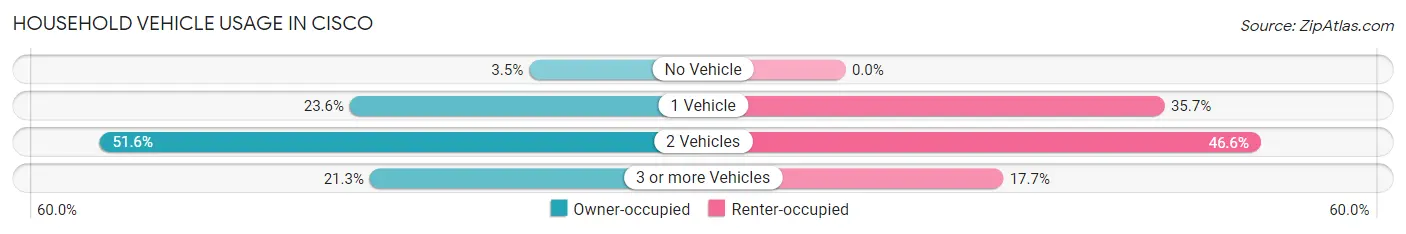
| Vehicles per Household | Owner-occupied | Renter-occupied |
| No Vehicle | 33 (3.5%) | 0 (0.0%) |
| 1 Vehicle | 222 (23.6%) | 188 (35.7%) |
| 2 Vehicles | 486 (51.6%) | 245 (46.6%) |
| 3 or more Vehicles | 201 (21.3%) | 93 (17.7%) |
| Total | 942 (100.0%) | 526 (100.0%) |
Real Estate & Mortgages in Cisco
Real Estate and Mortgage Overview in Cisco
| Characteristic | Without Mortgage | With Mortgage |
| Housing Units | 639 | 303 |
| Median Property Value | $87,200 | $111,200 |
| Median Household Income | $53,138 | $40 |
| Monthly Housing Costs | $426 | $0 |
| Real Estate Taxes | $1,227 | $0 |
Property Value by Mortgage Status in Cisco
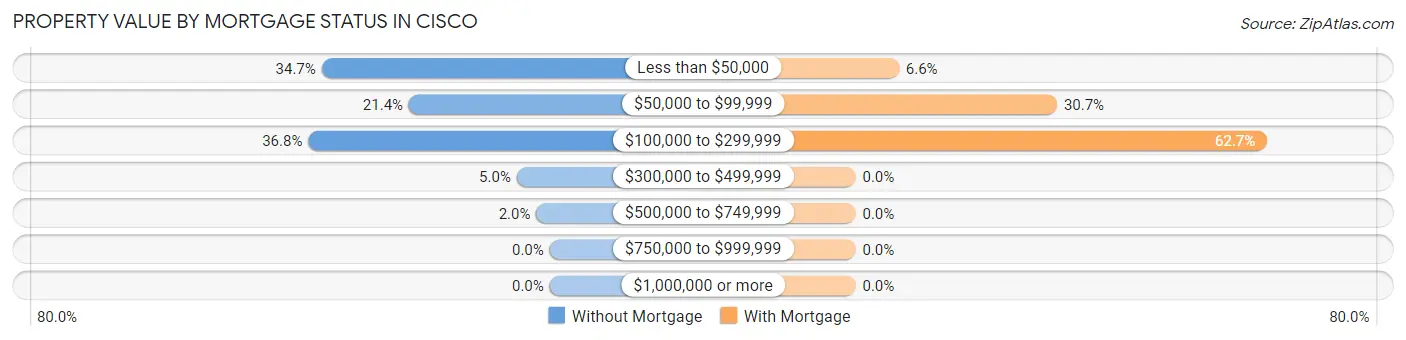
| Property Value | Without Mortgage | With Mortgage |
| Less than $50,000 | 222 (34.7%) | 20 (6.6%) |
| $50,000 to $99,999 | 137 (21.4%) | 93 (30.7%) |
| $100,000 to $299,999 | 235 (36.8%) | 190 (62.7%) |
| $300,000 to $499,999 | 32 (5.0%) | 0 (0.0%) |
| $500,000 to $749,999 | 13 (2.0%) | 0 (0.0%) |
| $750,000 to $999,999 | 0 (0.0%) | 0 (0.0%) |
| $1,000,000 or more | 0 (0.0%) | 0 (0.0%) |
| Total | 639 (100.0%) | 303 (100.0%) |
Household Income by Mortgage Status in Cisco
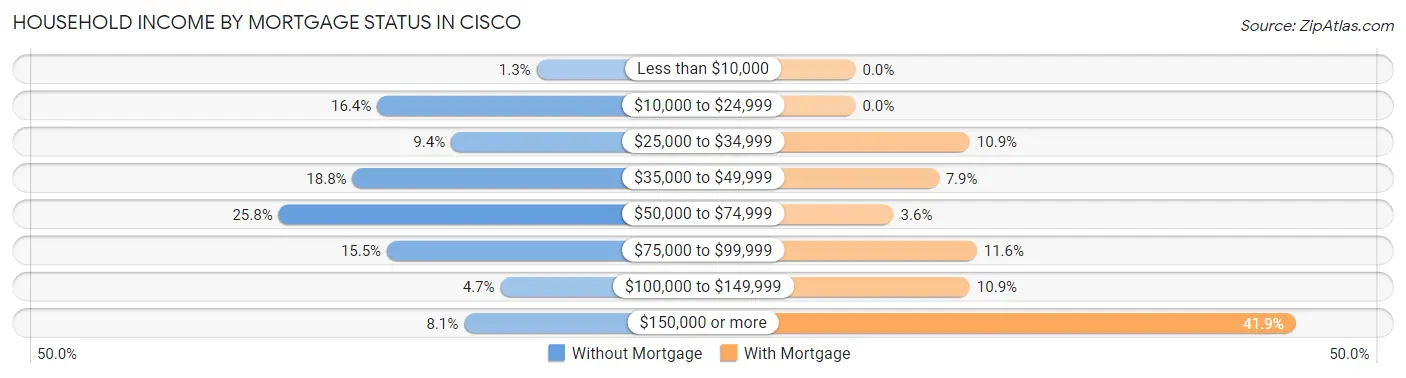
| Household Income | Without Mortgage | With Mortgage |
| Less than $10,000 | 8 (1.3%) | 0 (0.0%) |
| $10,000 to $24,999 | 105 (16.4%) | 0 (0.0%) |
| $25,000 to $34,999 | 60 (9.4%) | 33 (10.9%) |
| $35,000 to $49,999 | 120 (18.8%) | 24 (7.9%) |
| $50,000 to $74,999 | 165 (25.8%) | 11 (3.6%) |
| $75,000 to $99,999 | 99 (15.5%) | 35 (11.6%) |
| $100,000 to $149,999 | 30 (4.7%) | 33 (10.9%) |
| $150,000 or more | 52 (8.1%) | 127 (41.9%) |
| Total | 639 (100.0%) | 303 (100.0%) |
Property Value to Household Income Ratio in Cisco
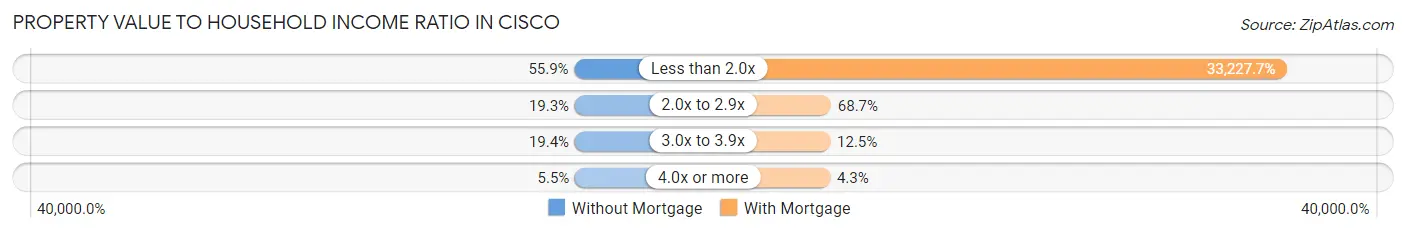
| Value-to-Income Ratio | Without Mortgage | With Mortgage |
| Less than 2.0x | 357 (55.9%) | 100,680 (33,227.7%) |
| 2.0x to 2.9x | 123 (19.3%) | 208 (68.6%) |
| 3.0x to 3.9x | 124 (19.4%) | 38 (12.5%) |
| 4.0x or more | 35 (5.5%) | 13 (4.3%) |
| Total | 639 (100.0%) | 303 (100.0%) |
Real Estate Taxes by Mortgage Status in Cisco
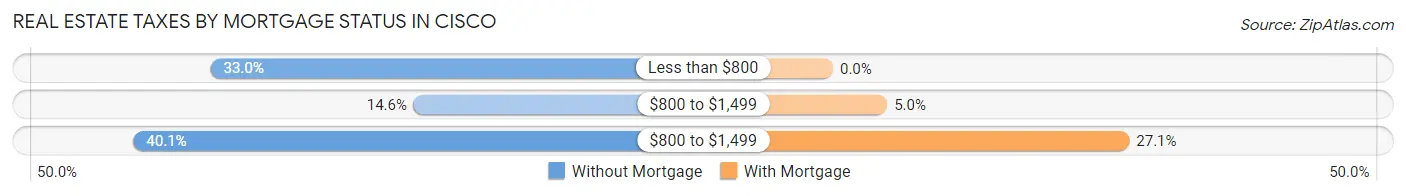
| Property Taxes | Without Mortgage | With Mortgage |
| Less than $800 | 211 (33.0%) | 0 (0.0%) |
| $800 to $1,499 | 93 (14.5%) | 15 (5.0%) |
| $800 to $1,499 | 256 (40.1%) | 82 (27.1%) |
| Total | 639 (100.0%) | 303 (100.0%) |
Health & Disability in Cisco
Health Insurance Coverage by Age in Cisco
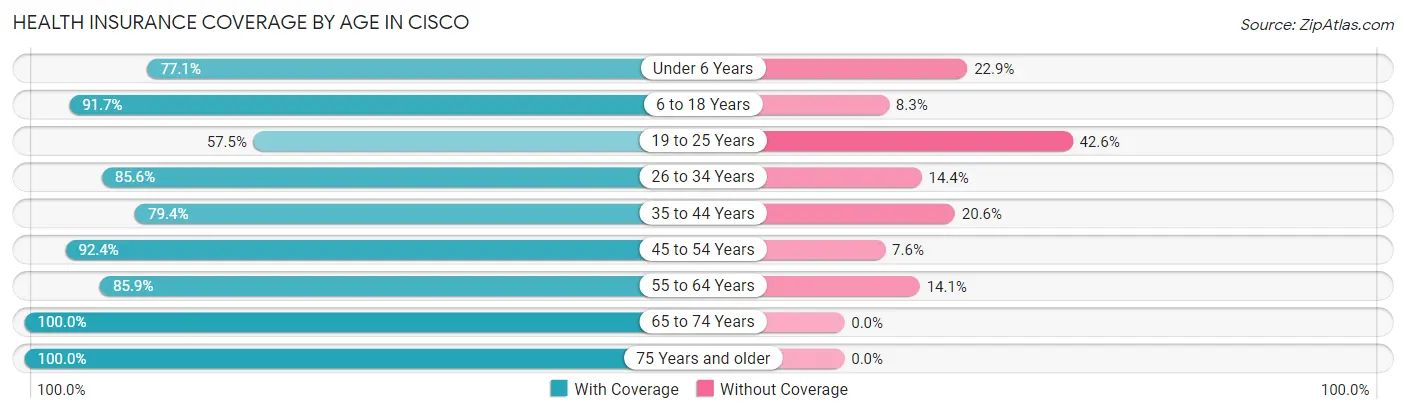
| Age Bracket | With Coverage | Without Coverage |
| Under 6 Years | 269 (77.1%) | 80 (22.9%) |
| 6 to 18 Years | 584 (91.7%) | 53 (8.3%) |
| 19 to 25 Years | 324 (57.5%) | 240 (42.5%) |
| 26 to 34 Years | 327 (85.6%) | 55 (14.4%) |
| 35 to 44 Years | 254 (79.4%) | 66 (20.6%) |
| 45 to 54 Years | 376 (92.4%) | 31 (7.6%) |
| 55 to 64 Years | 440 (85.9%) | 72 (14.1%) |
| 65 to 74 Years | 230 (100.0%) | 0 (0.0%) |
| 75 Years and older | 443 (100.0%) | 0 (0.0%) |
| Total | 3,247 (84.5%) | 597 (15.5%) |
Health Insurance Coverage by Citizenship Status in Cisco

| Citizenship Status | With Coverage | Without Coverage |
| Native Born | 269 (77.1%) | 80 (22.9%) |
| Foreign Born, Citizen | 584 (91.7%) | 53 (8.3%) |
| Foreign Born, not a Citizen | 324 (57.5%) | 240 (42.5%) |
Health Insurance Coverage by Household Income in Cisco
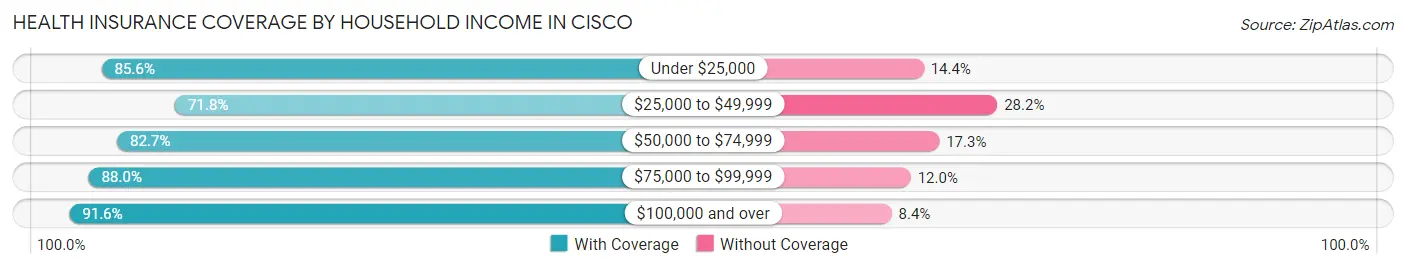
| Household Income | With Coverage | Without Coverage |
| Under $25,000 | 202 (85.6%) | 34 (14.4%) |
| $25,000 to $49,999 | 571 (71.8%) | 224 (28.2%) |
| $50,000 to $74,999 | 778 (82.7%) | 163 (17.3%) |
| $75,000 to $99,999 | 360 (88.0%) | 49 (12.0%) |
| $100,000 and over | 1,027 (91.6%) | 94 (8.4%) |
Public vs Private Health Insurance Coverage by Age in Cisco
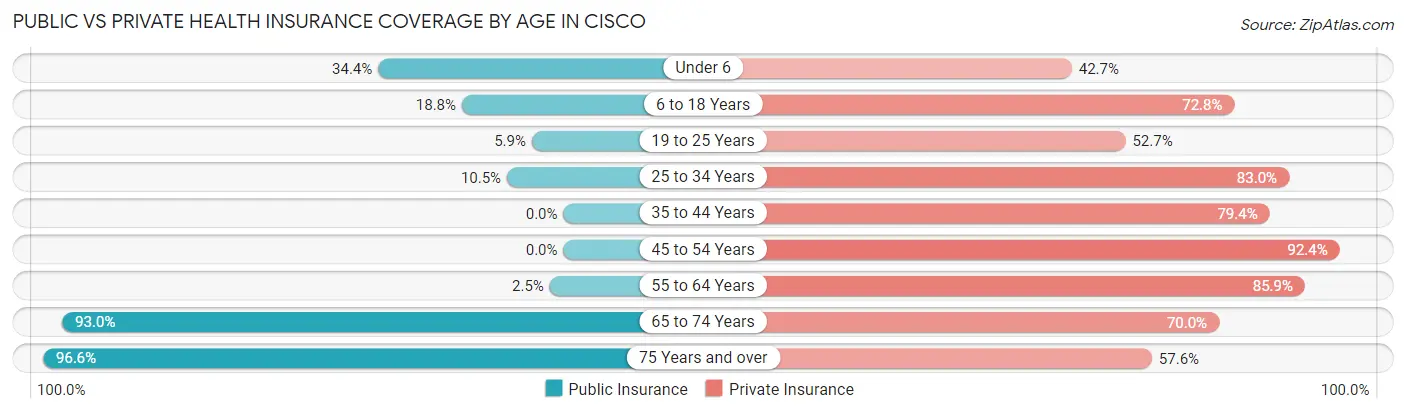
| Age Bracket | Public Insurance | Private Insurance |
| Under 6 | 120 (34.4%) | 149 (42.7%) |
| 6 to 18 Years | 120 (18.8%) | 464 (72.8%) |
| 19 to 25 Years | 33 (5.9%) | 297 (52.7%) |
| 25 to 34 Years | 40 (10.5%) | 317 (83.0%) |
| 35 to 44 Years | 0 (0.0%) | 254 (79.4%) |
| 45 to 54 Years | 0 (0.0%) | 376 (92.4%) |
| 55 to 64 Years | 13 (2.5%) | 440 (85.9%) |
| 65 to 74 Years | 214 (93.0%) | 161 (70.0%) |
| 75 Years and over | 428 (96.6%) | 255 (57.6%) |
| Total | 968 (25.2%) | 2,713 (70.6%) |
Disability Status by Sex by Age in Cisco
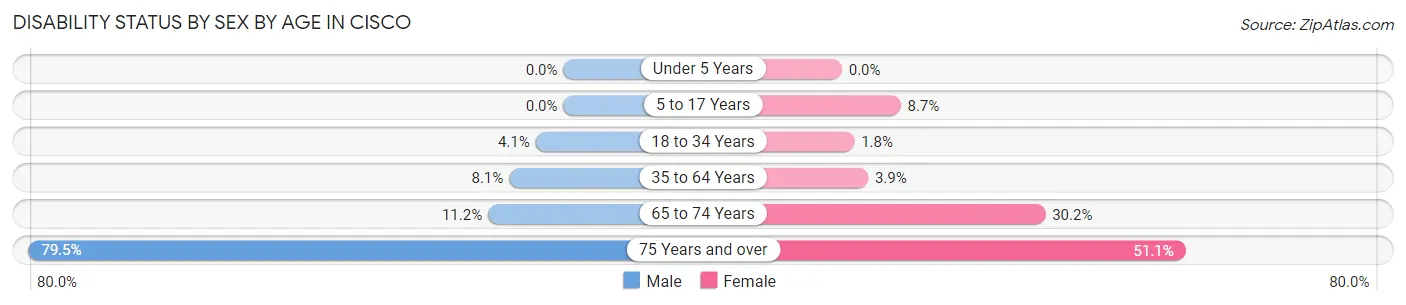
| Age Bracket | Male | Female |
| Under 5 Years | 0 (0.0%) | 0 (0.0%) |
| 5 to 17 Years | 0 (0.0%) | 34 (8.7%) |
| 18 to 34 Years | 22 (4.1%) | 10 (1.8%) |
| 35 to 64 Years | 48 (8.1%) | 25 (3.9%) |
| 65 to 74 Years | 15 (11.2%) | 29 (30.2%) |
| 75 Years and over | 201 (79.4%) | 97 (51.0%) |
Disability Class by Sex by Age in Cisco
Disability Class: Hearing Difficulty
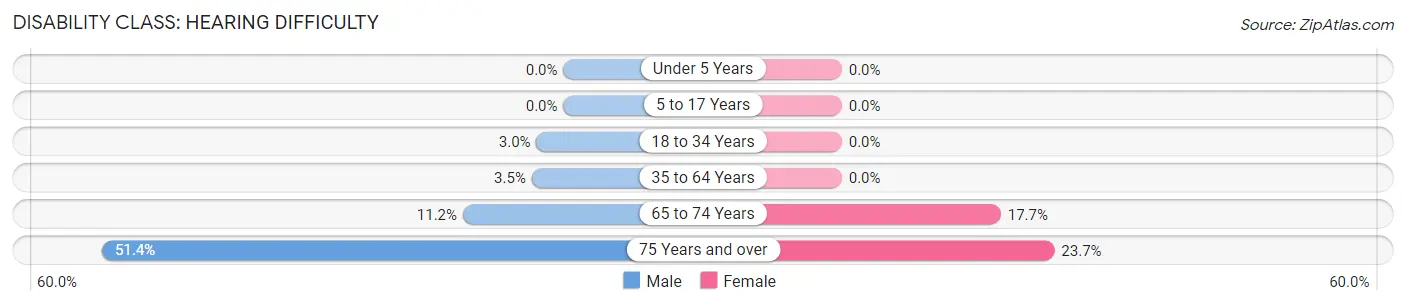
| Age Bracket | Male | Female |
| Under 5 Years | 0 (0.0%) | 0 (0.0%) |
| 5 to 17 Years | 0 (0.0%) | 0 (0.0%) |
| 18 to 34 Years | 16 (3.0%) | 0 (0.0%) |
| 35 to 64 Years | 21 (3.5%) | 0 (0.0%) |
| 65 to 74 Years | 15 (11.2%) | 17 (17.7%) |
| 75 Years and over | 130 (51.4%) | 45 (23.7%) |
Disability Class: Vision Difficulty
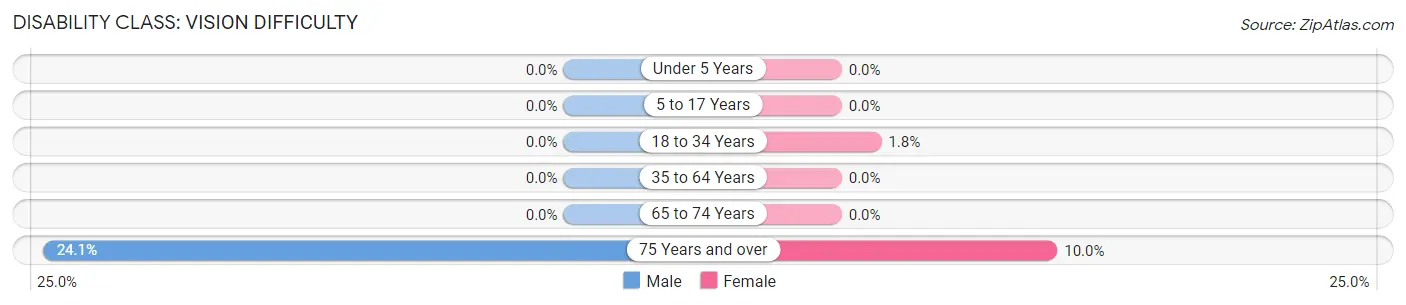
| Age Bracket | Male | Female |
| Under 5 Years | 0 (0.0%) | 0 (0.0%) |
| 5 to 17 Years | 0 (0.0%) | 0 (0.0%) |
| 18 to 34 Years | 0 (0.0%) | 10 (1.8%) |
| 35 to 64 Years | 0 (0.0%) | 0 (0.0%) |
| 65 to 74 Years | 0 (0.0%) | 0 (0.0%) |
| 75 Years and over | 61 (24.1%) | 19 (10.0%) |
Disability Class: Cognitive Difficulty
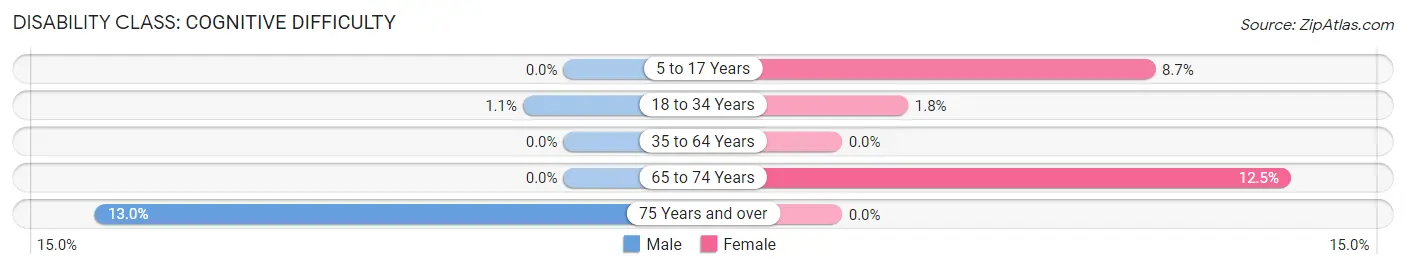
| Age Bracket | Male | Female |
| 5 to 17 Years | 0 (0.0%) | 34 (8.7%) |
| 18 to 34 Years | 6 (1.1%) | 10 (1.8%) |
| 35 to 64 Years | 0 (0.0%) | 0 (0.0%) |
| 65 to 74 Years | 0 (0.0%) | 12 (12.5%) |
| 75 Years and over | 33 (13.0%) | 0 (0.0%) |
Disability Class: Ambulatory Difficulty
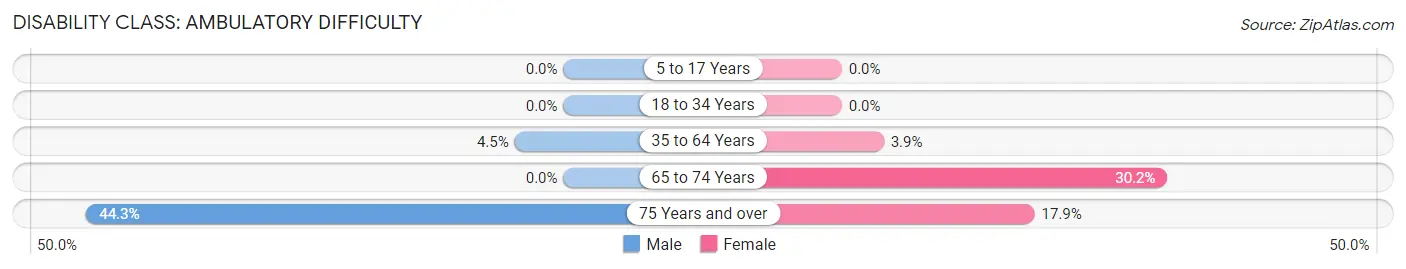
| Age Bracket | Male | Female |
| 5 to 17 Years | 0 (0.0%) | 0 (0.0%) |
| 18 to 34 Years | 0 (0.0%) | 0 (0.0%) |
| 35 to 64 Years | 27 (4.5%) | 25 (3.9%) |
| 65 to 74 Years | 0 (0.0%) | 29 (30.2%) |
| 75 Years and over | 112 (44.3%) | 34 (17.9%) |
Disability Class: Self-Care Difficulty
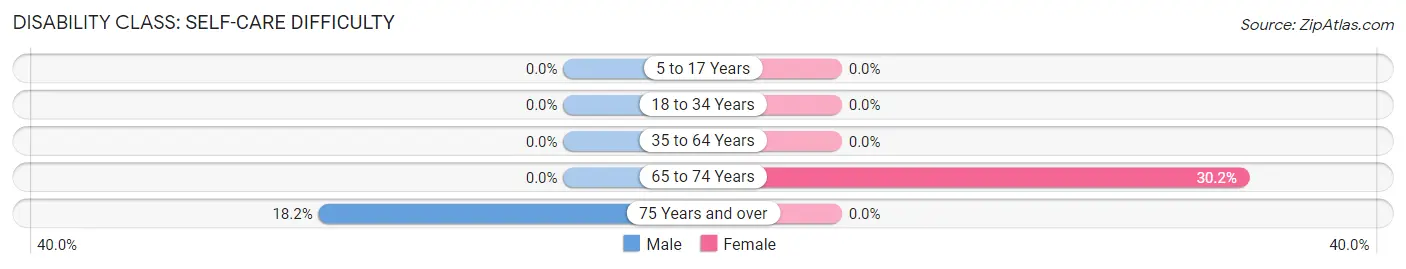
| Age Bracket | Male | Female |
| 5 to 17 Years | 0 (0.0%) | 0 (0.0%) |
| 18 to 34 Years | 0 (0.0%) | 0 (0.0%) |
| 35 to 64 Years | 0 (0.0%) | 0 (0.0%) |
| 65 to 74 Years | 0 (0.0%) | 29 (30.2%) |
| 75 Years and over | 46 (18.2%) | 0 (0.0%) |
Technology Access in Cisco
Computing Device Access in Cisco
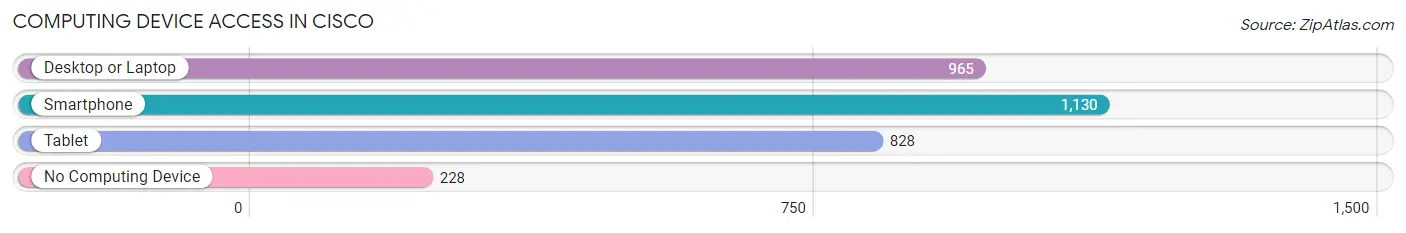
| Device Type | # Households | % Households |
| Desktop or Laptop | 965 | 65.7% |
| Smartphone | 1,130 | 77.0% |
| Tablet | 828 | 56.4% |
| No Computing Device | 228 | 15.5% |
| Total | 1,468 | 100.0% |
Internet Access in Cisco
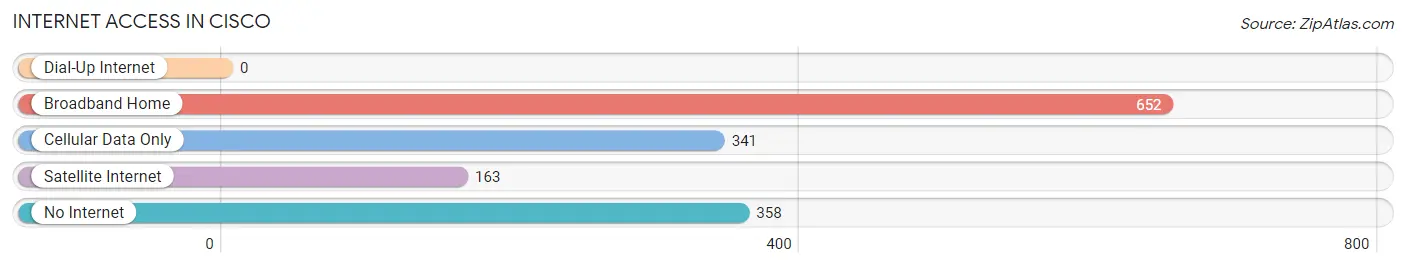
| Internet Type | # Households | % Households |
| Dial-Up Internet | 0 | 0.0% |
| Broadband Home | 652 | 44.4% |
| Cellular Data Only | 341 | 23.2% |
| Satellite Internet | 163 | 11.1% |
| No Internet | 358 | 24.4% |
| Total | 1,468 | 100.0% |
Cisco Summary
Cisco, Texas is a small town located in Eastland County, Texas. It is situated on the banks of the Clear Fork of the Brazos River, approximately 100 miles west of Fort Worth. The town was founded in 1877 by the Texas and Pacific Railway Company and was named after the nearby Cisco Creek. The town was incorporated in 1883 and has a population of approximately 3,900 people as of the 2010 census.
History
The area around Cisco was first inhabited by Native American tribes, including the Comanche, Kiowa, and Apache. The first European settlers arrived in the area in the late 1840s, and the town of Cisco was founded in 1877 by the Texas and Pacific Railway Company. The town was named after the nearby Cisco Creek, which was named after a Comanche chief.
The town quickly grew and by 1880, it had a population of over 500 people. The town was incorporated in 1883 and by 1890, it had a population of 1,200 people. During this time, the town was a major shipping center for the surrounding area, and it was home to several businesses, including a cotton gin, a flour mill, and a brick factory.
In the early 1900s, the town experienced a period of growth and prosperity. The population increased to over 2,000 people and the town was home to several businesses, including a bank, a hotel, a newspaper, and a movie theater.
In the 1920s, the town experienced a period of decline. The population decreased to 1,500 people and several businesses closed. The town experienced a brief resurgence in the 1940s, when the population increased to over 2,000 people.
In the 1950s, the town experienced another period of decline. The population decreased to 1,400 people and several businesses closed. The town experienced a brief resurgence in the 1970s, when the population increased to over 2,000 people.
Geography
Cisco is located in Eastland County, Texas, approximately 100 miles west of Fort Worth. The town is situated on the banks of the Clear Fork of the Brazos River. The town has a total area of 2.2 square miles, all of which is land.
Economy
The economy of Cisco is largely based on agriculture and oil production. The town is home to several businesses, including a grocery store, a hardware store, a bank, and a restaurant. The town is also home to several oil and gas companies, including Chevron, ExxonMobil, and Shell.
Demographics
As of the 2010 census, the population of Cisco was 3,900 people. The racial makeup of the town was 94.3% White, 0.3% African American, 0.3% Native American, 0.3% Asian, 0.1% Pacific Islander, 3.2% from other races, and 1.8% from two or more races. Hispanic or Latino of any race were 8.2% of the population.
The median income for a household in Cisco was $31,250, and the median income for a family was $37,500. The per capita income for the town was $17,845. About 16.2% of families and 19.2% of the population were below the poverty line, including 25.2% of those under age 18 and 11.2% of those age 65 or over.
Common Questions
What is Per Capita Income in Cisco?
Per Capita income in Cisco is $29,668.
What is the Median Family Income in Cisco?
Median Family Income in Cisco is $65,278.
What is the Median Household income in Cisco?
Median Household Income in Cisco is $59,698.
What is Income or Wage Gap in Cisco?
Income or Wage Gap in Cisco is 26.3%.
Women in Cisco earn 73.7 cents for every dollar earned by a man.
What is Inequality or Gini Index in Cisco?
Inequality or Gini Index in Cisco is 0.36.
What is the Total Population of Cisco?
Total Population of Cisco is 3,901.
What is the Total Male Population of Cisco?
Total Male Population of Cisco is 1,877.
What is the Total Female Population of Cisco?
Total Female Population of Cisco is 2,024.
What is the Ratio of Males per 100 Females in Cisco?
There are 92.74 Males per 100 Females in Cisco.
What is the Ratio of Females per 100 Males in Cisco?
There are 107.83 Females per 100 Males in Cisco.
What is the Median Population Age in Cisco?
Median Population Age in Cisco is 35.1 Years.
What is the Average Family Size in Cisco
Average Family Size in Cisco is 2.8 People.
What is the Average Household Size in Cisco
Average Household Size in Cisco is 2.4 People.
How Large is the Labor Force in Cisco?
There are 1,887 People in the Labor Forcein in Cisco.
What is the Percentage of People in the Labor Force in Cisco?
58.2% of People are in the Labor Force in Cisco.
What is the Unemployment Rate in Cisco?
Unemployment Rate in Cisco is 6.5%.