Galena Park, TX Map & Demographics
Galena Park Map
Galena Park Overview
$18,071
PER CAPITA INCOME
$51,105
AVG FAMILY INCOME
$45,614
AVG HOUSEHOLD INCOME
40.9%
WAGE / INCOME GAP [ % ]
59.1¢/ $1
WAGE / INCOME GAP [ $ ]
$14,389
FAMILY INCOME DEFICIT
0.40
INEQUALITY / GINI INDEX
10,641
TOTAL POPULATION
5,527
MALE POPULATION
5,114
FEMALE POPULATION
108.08
MALES / 100 FEMALES
92.53
FEMALES / 100 MALES
28.0
MEDIAN AGE
4.0
AVG FAMILY SIZE
3.7
AVG HOUSEHOLD SIZE
4,389
LABOR FORCE [ PEOPLE ]
59.9%
PERCENT IN LABOR FORCE
14.3%
UNEMPLOYMENT RATE
Galena Park Zip Codes
Galena Park Area Codes
Income in Galena Park
Income Overview in Galena Park
Per Capita Income in Galena Park is $18,071, while median incomes of families and households are $51,105 and $45,614 respectively.
| Characteristic | Number | Measure |
| Per Capita Income | 10,641 | $18,071 |
| Median Family Income | 2,428 | $51,105 |
| Mean Family Income | 2,428 | $65,573 |
| Median Household Income | 2,906 | $45,614 |
| Mean Household Income | 2,906 | $62,430 |
| Income Deficit | 2,428 | $14,389 |
| Wage / Income Gap (%) | 10,641 | 40.86% |
| Wage / Income Gap ($) | 10,641 | 59.14¢ per $1 |
| Gini / Inequality Index | 10,641 | 0.40 |
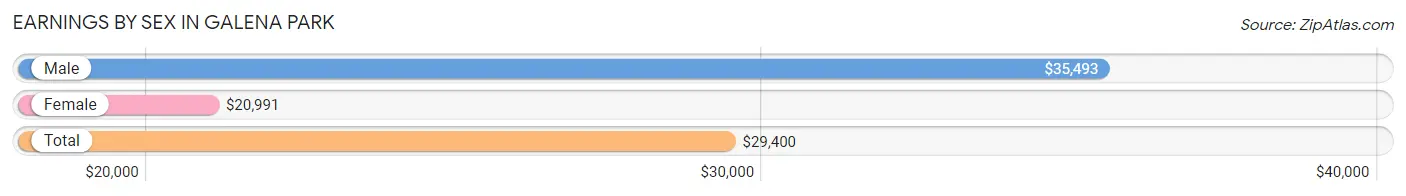
Earnings by Sex in Galena Park
Average Earnings in Galena Park are $29,400, $35,493 for men and $20,991 for women, a difference of 40.9%.
| Sex | Number | Average Earnings |
| Male | 2,694 (58.9%) | $35,493 |
| Female | 1,878 (41.1%) | $20,991 |
| Total | 4,572 (100.0%) | $29,400 |
Earnings by Sex by Income Bracket in Galena Park
The most common earnings brackets in Galena Park are $25,000 to $29,999 for men (359 | 13.3%) and $2,499 or less for women (146 | 7.8%).
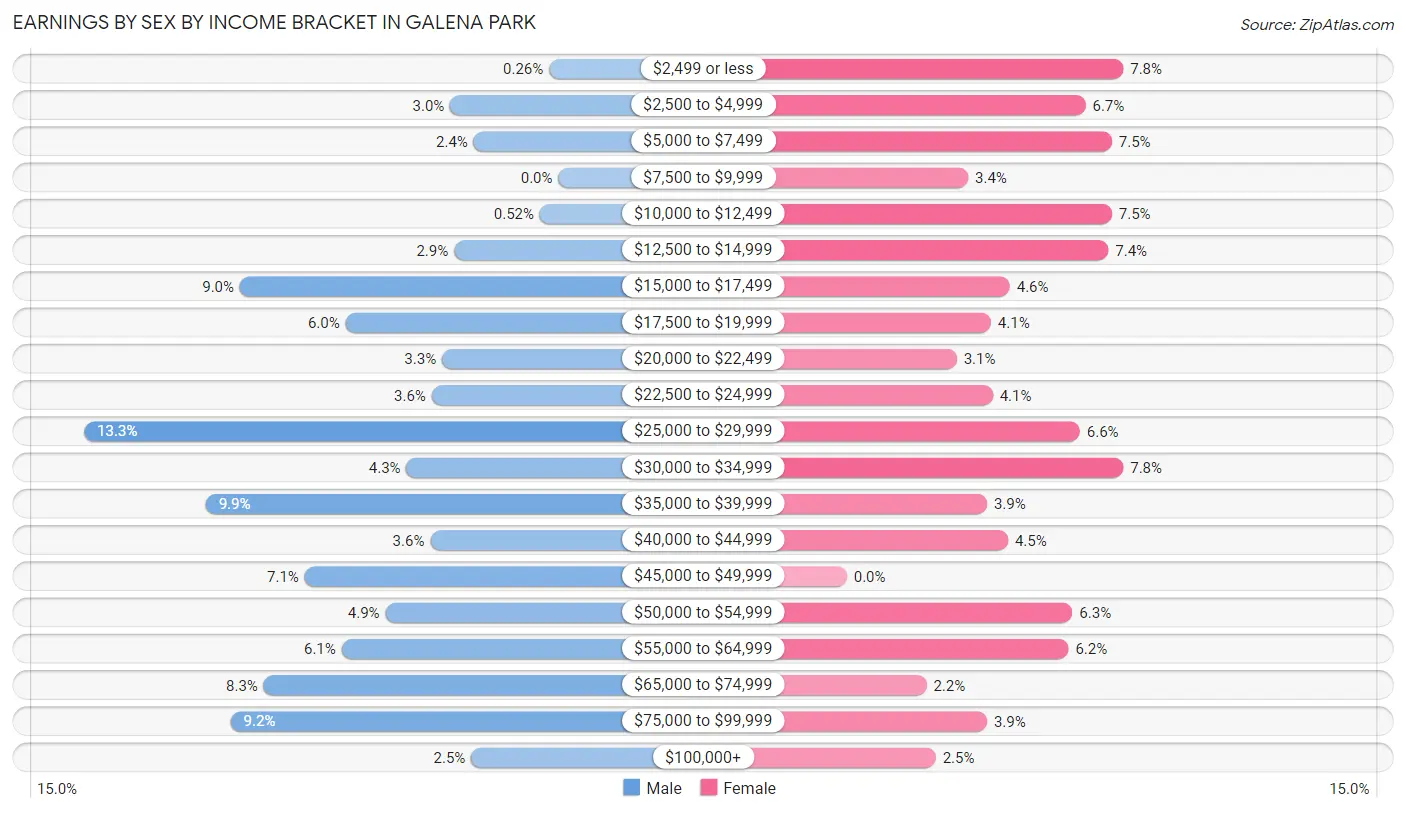
| Income | Male | Female |
| $2,499 or less | 7 (0.3%) | 146 (7.8%) |
| $2,500 to $4,999 | 82 (3.0%) | 126 (6.7%) |
| $5,000 to $7,499 | 64 (2.4%) | 140 (7.4%) |
| $7,500 to $9,999 | 0 (0.0%) | 64 (3.4%) |
| $10,000 to $12,499 | 14 (0.5%) | 140 (7.4%) |
| $12,500 to $14,999 | 79 (2.9%) | 138 (7.3%) |
| $15,000 to $17,499 | 241 (8.9%) | 86 (4.6%) |
| $17,500 to $19,999 | 161 (6.0%) | 76 (4.1%) |
| $20,000 to $22,499 | 88 (3.3%) | 58 (3.1%) |
| $22,500 to $24,999 | 96 (3.6%) | 77 (4.1%) |
| $25,000 to $29,999 | 359 (13.3%) | 123 (6.6%) |
| $30,000 to $34,999 | 115 (4.3%) | 146 (7.8%) |
| $35,000 to $39,999 | 267 (9.9%) | 74 (3.9%) |
| $40,000 to $44,999 | 97 (3.6%) | 85 (4.5%) |
| $45,000 to $49,999 | 192 (7.1%) | 0 (0.0%) |
| $50,000 to $54,999 | 131 (4.9%) | 119 (6.3%) |
| $55,000 to $64,999 | 164 (6.1%) | 117 (6.2%) |
| $65,000 to $74,999 | 223 (8.3%) | 42 (2.2%) |
| $75,000 to $99,999 | 248 (9.2%) | 74 (3.9%) |
| $100,000+ | 66 (2.5%) | 47 (2.5%) |
| Total | 2,694 (100.0%) | 1,878 (100.0%) |
Earnings by Sex by Educational Attainment in Galena Park
Average earnings in Galena Park are $35,980 for men and $24,692 for women, a difference of 31.4%. Men with an educational attainment of college or associate's degree enjoy the highest average annual earnings of $39,231, while those with less than high school education earn the least with $32,219. Women with an educational attainment of college or associate's degree earn the most with the average annual earnings of $40,625, while those with high school diploma education have the smallest earnings of $15,357.
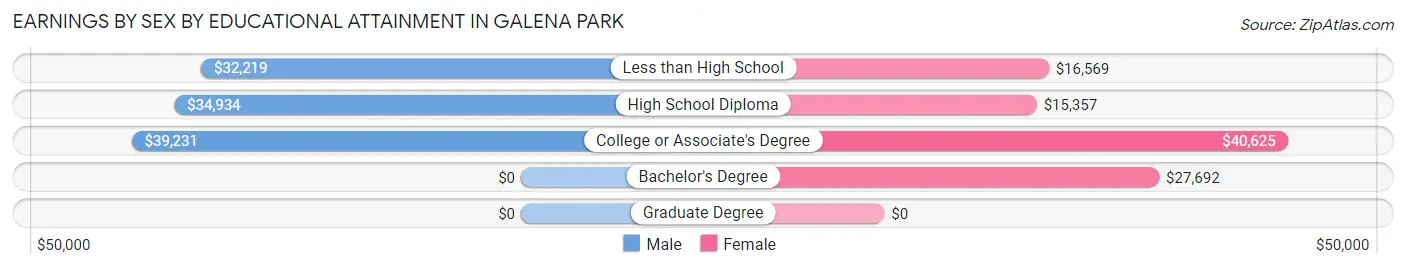
| Educational Attainment | Male Income | Female Income |
| Less than High School | $32,219 | $16,569 |
| High School Diploma | $34,934 | $15,357 |
| College or Associate's Degree | $39,231 | $40,625 |
| Bachelor's Degree | - | - |
| Graduate Degree | - | - |
| Total | $35,980 | $24,692 |
Family Income in Galena Park
Family Income Brackets in Galena Park
According to the Galena Park family income data, there are 483 families falling into the $100,000 to $149,999 income range, which is the most common income bracket and makes up 19.9% of all families. Conversely, the $150,000 to $199,999 income bracket is the least frequent group with only 41 families (1.7%) belonging to this category.
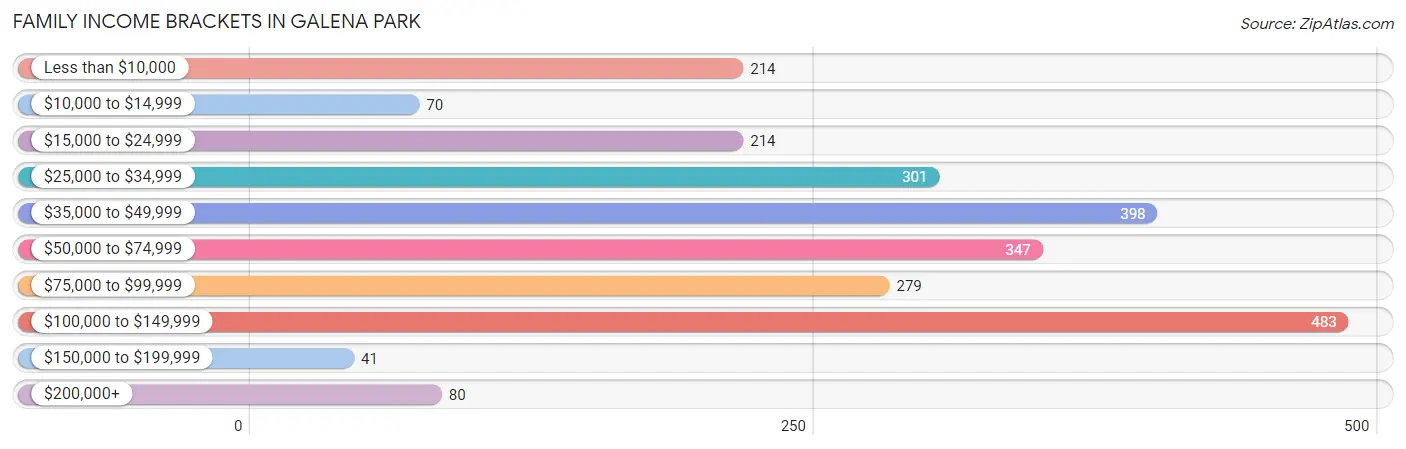
| Income Bracket | # Families | % Families |
| Less than $10,000 | 214 | 8.8% |
| $10,000 to $14,999 | 70 | 2.9% |
| $15,000 to $24,999 | 214 | 8.8% |
| $25,000 to $34,999 | 301 | 12.4% |
| $35,000 to $49,999 | 398 | 16.4% |
| $50,000 to $74,999 | 347 | 14.3% |
| $75,000 to $99,999 | 279 | 11.5% |
| $100,000 to $149,999 | 483 | 19.9% |
| $150,000 to $199,999 | 41 | 1.7% |
| $200,000+ | 80 | 3.3% |
Family Income by Famaliy Size in Galena Park
7+ person families (99 | 4.1%) account for the highest median family income in Galena Park with $114,408 per family, while 2-person families (633 | 26.1%) have the highest median income of $25,394 per family member.
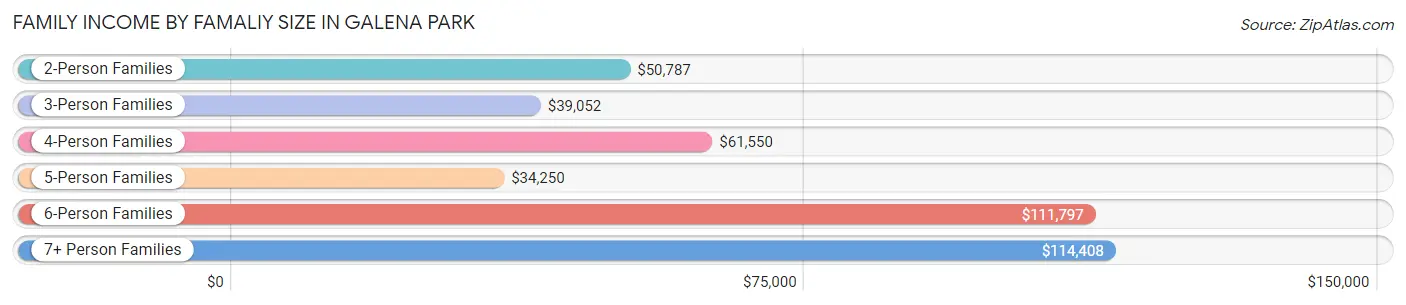
| Income Bracket | # Families | Median Income |
| 2-Person Families | 633 (26.1%) | $50,787 |
| 3-Person Families | 518 (21.3%) | $39,052 |
| 4-Person Families | 709 (29.2%) | $61,550 |
| 5-Person Families | 327 (13.5%) | $34,250 |
| 6-Person Families | 142 (5.9%) | $111,797 |
| 7+ Person Families | 99 (4.1%) | $114,408 |
| Total | 2,428 (100.0%) | $51,105 |
Family Income by Number of Earners in Galena Park
The median family income in Galena Park is $51,105, with families comprising 3+ earners (303) having the highest median family income of $126,382, while families with no earners (284) have the lowest median family income of $2,499, accounting for 12.5% and 11.7% of families, respectively.
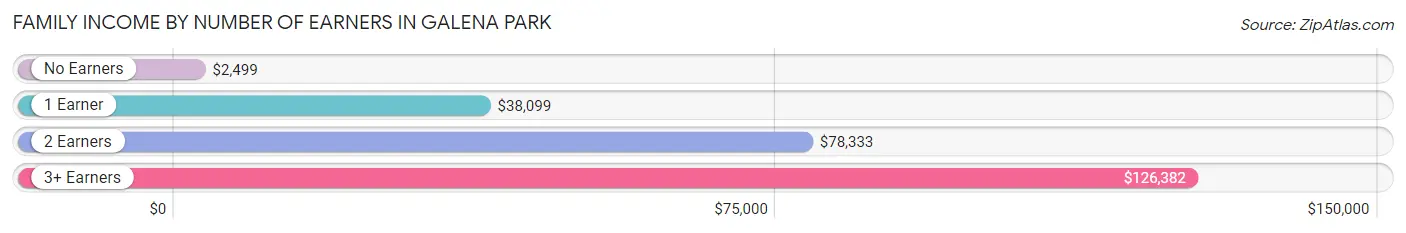
| Number of Earners | # Families | Median Income |
| No Earners | 284 (11.7%) | $2,499 |
| 1 Earner | 923 (38.0%) | $38,099 |
| 2 Earners | 918 (37.8%) | $78,333 |
| 3+ Earners | 303 (12.5%) | $126,382 |
| Total | 2,428 (100.0%) | $51,105 |
Household Income in Galena Park
Household Income Brackets in Galena Park
With 506 households falling in the category, the $100,000 to $149,999 income range is the most frequent in Galena Park, accounting for 17.4% of all households. In contrast, only 41 households (1.4%) fall into the $150,000 to $199,999 income bracket, making it the least populous group.
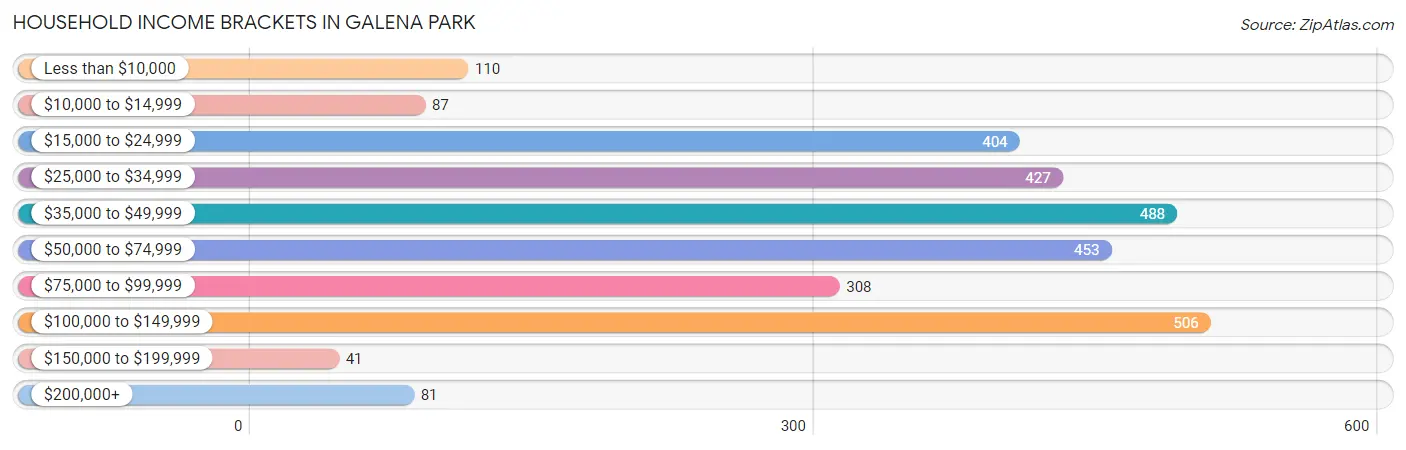
| Income Bracket | # Households | % Households |
| Less than $10,000 | 110 | 3.8% |
| $10,000 to $14,999 | 87 | 3.0% |
| $15,000 to $24,999 | 404 | 13.9% |
| $25,000 to $34,999 | 427 | 14.7% |
| $35,000 to $49,999 | 488 | 16.8% |
| $50,000 to $74,999 | 453 | 15.6% |
| $75,000 to $99,999 | 308 | 10.6% |
| $100,000 to $149,999 | 506 | 17.4% |
| $150,000 to $199,999 | 41 | 1.4% |
| $200,000+ | 81 | 2.8% |
Household Income by Householder Age in Galena Park
The median household income in Galena Park is $45,614, with the highest median household income of $65,300 found in the 45 to 64 years age bracket for the primary householder. A total of 1,216 households (41.8%) fall into this category. Meanwhile, the 25 to 44 years age bracket for the primary householder has the lowest median household income of $34,265, with 1,004 households (34.5%) in this group.
| Income Bracket | # Households | Median Income |
| 15 to 24 Years | 102 (3.5%) | $36,923 |
| 25 to 44 Years | 1,004 (34.5%) | $34,265 |
| 45 to 64 Years | 1,216 (41.8%) | $65,300 |
| 65+ Years | 584 (20.1%) | $38,529 |
| Total | 2,906 (100.0%) | $45,614 |
Poverty in Galena Park
Income Below Poverty by Sex and Age in Galena Park
With 27.4% poverty level for males and 33.7% for females among the residents of Galena Park, 5 year old males and 15 year old females are the most vulnerable to poverty, with 93 males (61.6%) and 74 females (81.3%) in their respective age groups living below the poverty level.
| Age Bracket | Male | Female |
| Under 5 Years | 196 (52.7%) | 198 (45.7%) |
| 5 Years | 93 (61.6%) | 54 (52.4%) |
| 6 to 11 Years | 386 (58.8%) | 234 (50.9%) |
| 12 to 14 Years | 106 (32.5%) | 172 (52.1%) |
| 15 Years | 49 (22.1%) | 74 (81.3%) |
| 16 and 17 Years | 53 (35.8%) | 58 (27.0%) |
| 18 to 24 Years | 206 (26.8%) | 148 (28.6%) |
| 25 to 34 Years | 54 (12.7%) | 236 (34.4%) |
| 35 to 44 Years | 128 (14.8%) | 364 (51.4%) |
| 45 to 54 Years | 92 (15.5%) | 53 (12.0%) |
| 55 to 64 Years | 78 (19.0%) | 91 (14.0%) |
| 65 to 74 Years | 53 (13.0%) | 0 (0.0%) |
| 75 Years and over | 0 (0.0%) | 11 (8.0%) |
| Total | 1,494 (27.4%) | 1,693 (33.7%) |
Income Above Poverty by Sex and Age in Galena Park
According to the poverty statistics in Galena Park, males aged 75 years and over and females aged 65 to 74 years are the age groups that are most secure financially, with 100.0% of males and 100.0% of females in these age groups living above the poverty line.
| Age Bracket | Male | Female |
| Under 5 Years | 176 (47.3%) | 235 (54.3%) |
| 5 Years | 58 (38.4%) | 49 (47.6%) |
| 6 to 11 Years | 271 (41.2%) | 226 (49.1%) |
| 12 to 14 Years | 220 (67.5%) | 158 (47.9%) |
| 15 Years | 173 (77.9%) | 17 (18.7%) |
| 16 and 17 Years | 95 (64.2%) | 157 (73.0%) |
| 18 to 24 Years | 564 (73.3%) | 369 (71.4%) |
| 25 to 34 Years | 371 (87.3%) | 451 (65.6%) |
| 35 to 44 Years | 739 (85.2%) | 344 (48.6%) |
| 45 to 54 Years | 500 (84.5%) | 388 (88.0%) |
| 55 to 64 Years | 332 (81.0%) | 557 (86.0%) |
| 65 to 74 Years | 356 (87.0%) | 254 (100.0%) |
| 75 Years and over | 99 (100.0%) | 126 (92.0%) |
| Total | 3,954 (72.6%) | 3,331 (66.3%) |
Income Below Poverty Among Married-Couple Families in Galena Park
The poverty statistics for married-couple families in Galena Park show that 17.1% or 251 of the total 1,471 families live below the poverty line. Families with 3 or 4 children have the highest poverty rate of 28.7%, comprising of 64 families. On the other hand, families with 5 or more children have the lowest poverty rate of 0.0%, which includes 0 families.
| Children | Above Poverty | Below Poverty |
| No Children | 628 (92.6%) | 50 (7.4%) |
| 1 or 2 Children | 414 (75.1%) | 137 (24.9%) |
| 3 or 4 Children | 159 (71.3%) | 64 (28.7%) |
| 5 or more Children | 19 (100.0%) | 0 (0.0%) |
| Total | 1,220 (82.9%) | 251 (17.1%) |
Income Below Poverty Among Single-Parent Households in Galena Park
According to the poverty data in Galena Park, 19.4% or 49 single-father households and 47.4% or 334 single-mother households are living below the poverty line. Among single-father households, those with 3 or 4 children have the highest poverty rate, with 22 households (64.7%) experiencing poverty. Likewise, among single-mother households, those with 5 or more children have the highest poverty rate, with 22 households (100.0%) falling below the poverty line.
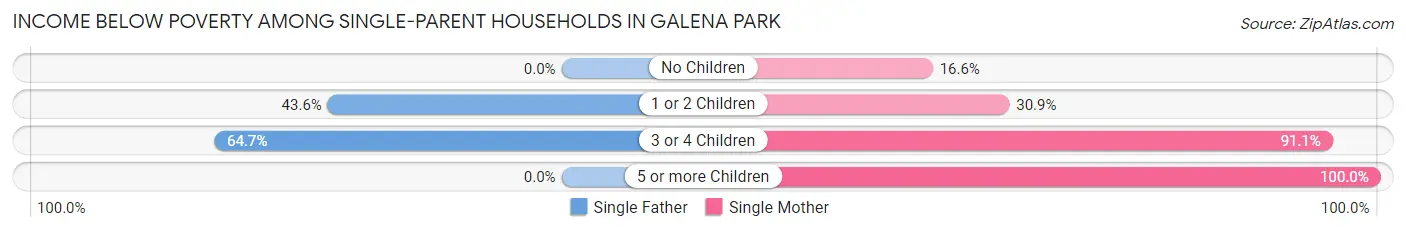
| Children | Single Father | Single Mother |
| No Children | 0 (0.0%) | 31 (16.6%) |
| 1 or 2 Children | 27 (43.5%) | 87 (30.8%) |
| 3 or 4 Children | 22 (64.7%) | 194 (91.1%) |
| 5 or more Children | 0 (0.0%) | 22 (100.0%) |
| Total | 49 (19.4%) | 334 (47.4%) |
Income Below Poverty Among Married-Couple vs Single-Parent Households in Galena Park
The poverty data for Galena Park shows that 251 of the married-couple family households (17.1%) and 383 of the single-parent households (40.0%) are living below the poverty level. Within the married-couple family households, those with 3 or 4 children have the highest poverty rate, with 64 households (28.7%) falling below the poverty line. Among the single-parent households, those with 5 or more children have the highest poverty rate, with 22 household (100.0%) living below poverty.
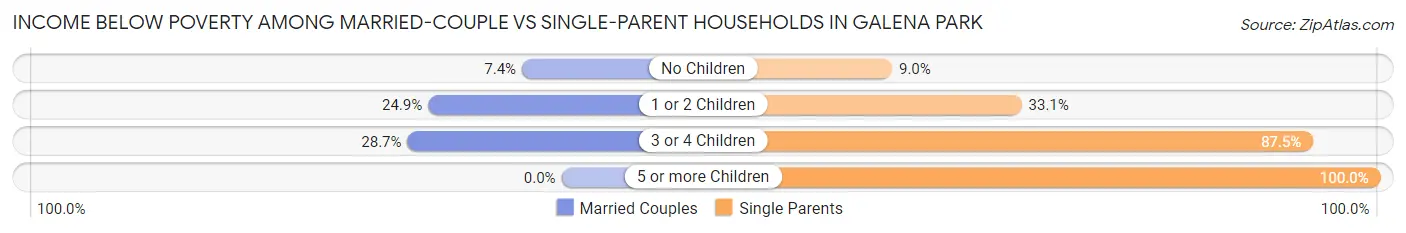
| Children | Married-Couple Families | Single-Parent Households |
| No Children | 50 (7.4%) | 31 (9.0%) |
| 1 or 2 Children | 137 (24.9%) | 114 (33.1%) |
| 3 or 4 Children | 64 (28.7%) | 216 (87.5%) |
| 5 or more Children | 0 (0.0%) | 22 (100.0%) |
| Total | 251 (17.1%) | 383 (40.0%) |
Race in Galena Park
The most populous races in Galena Park are Hispanic or Latino (9,757 | 91.7%), White / Caucasian (5,578 | 52.4%), and Two or more Races (3,795 | 35.7%).
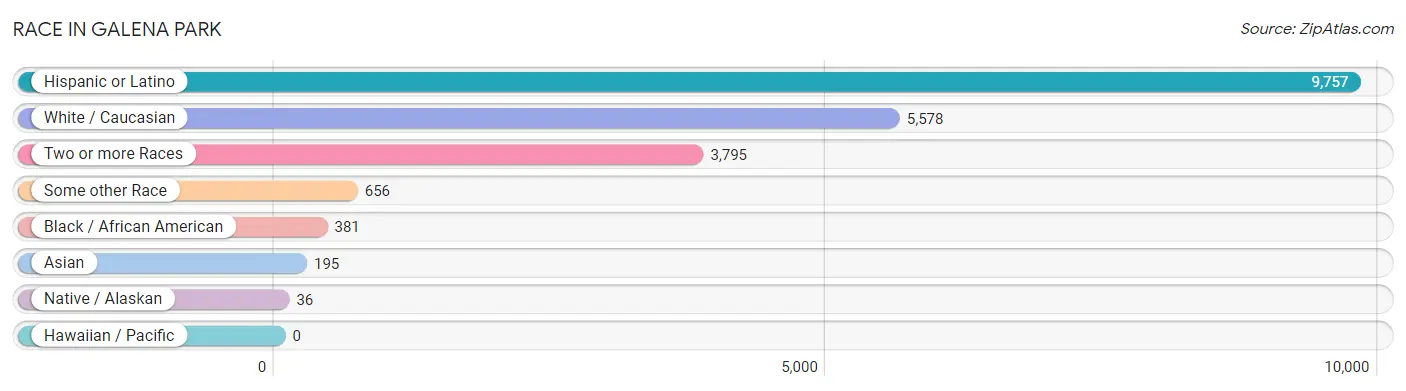
| Race | # Population | % Population |
| Asian | 195 | 1.8% |
| Black / African American | 381 | 3.6% |
| Hawaiian / Pacific | 0 | 0.0% |
| Hispanic or Latino | 9,757 | 91.7% |
| Native / Alaskan | 36 | 0.3% |
| White / Caucasian | 5,578 | 52.4% |
| Two or more Races | 3,795 | 35.7% |
| Some other Race | 656 | 6.2% |
| Total | 10,641 | 100.0% |
Ancestry in Galena Park
The most populous ancestries reported in Galena Park are Mexican (9,363 | 88.0%), American (439 | 4.1%), Central American (291 | 2.7%), Salvadoran (275 | 2.6%), and Indian (Asian) (189 | 1.8%), together accounting for 99.2% of all Galena Park residents.
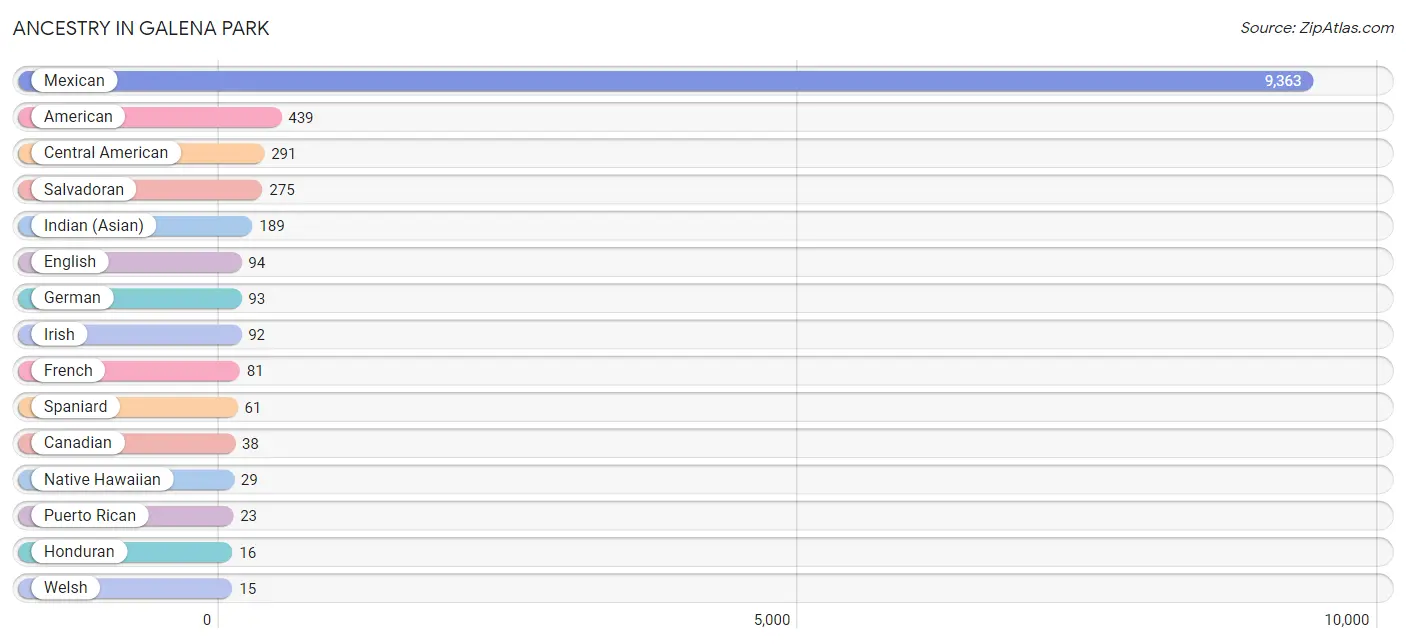
| Ancestry | # Population | % Population |
| American | 439 | 4.1% |
| Canadian | 38 | 0.4% |
| Central American | 291 | 2.7% |
| Cherokee | 6 | 0.1% |
| English | 94 | 0.9% |
| European | 5 | 0.1% |
| French | 81 | 0.8% |
| French Canadian | 12 | 0.1% |
| German | 93 | 0.9% |
| Honduran | 16 | 0.2% |
| Indian (Asian) | 189 | 1.8% |
| Irish | 92 | 0.9% |
| Italian | 4 | 0.0% |
| Mexican | 9,363 | 88.0% |
| Mexican American Indian | 8 | 0.1% |
| Native Hawaiian | 29 | 0.3% |
| Puerto Rican | 23 | 0.2% |
| Salvadoran | 275 | 2.6% |
| Spaniard | 61 | 0.6% |
| Spanish | 5 | 0.1% |
| Sri Lankan | 6 | 0.1% |
| Welsh | 15 | 0.1% | View All 22 Rows |
Immigrants in Galena Park
The most numerous immigrant groups reported in Galena Park came from Central America (3,280 | 30.8%), Latin America (3,280 | 30.8%), Mexico (3,099 | 29.1%), El Salvador (136 | 1.3%), and Honduras (45 | 0.4%), together accounting for 92.5% of all Galena Park residents.
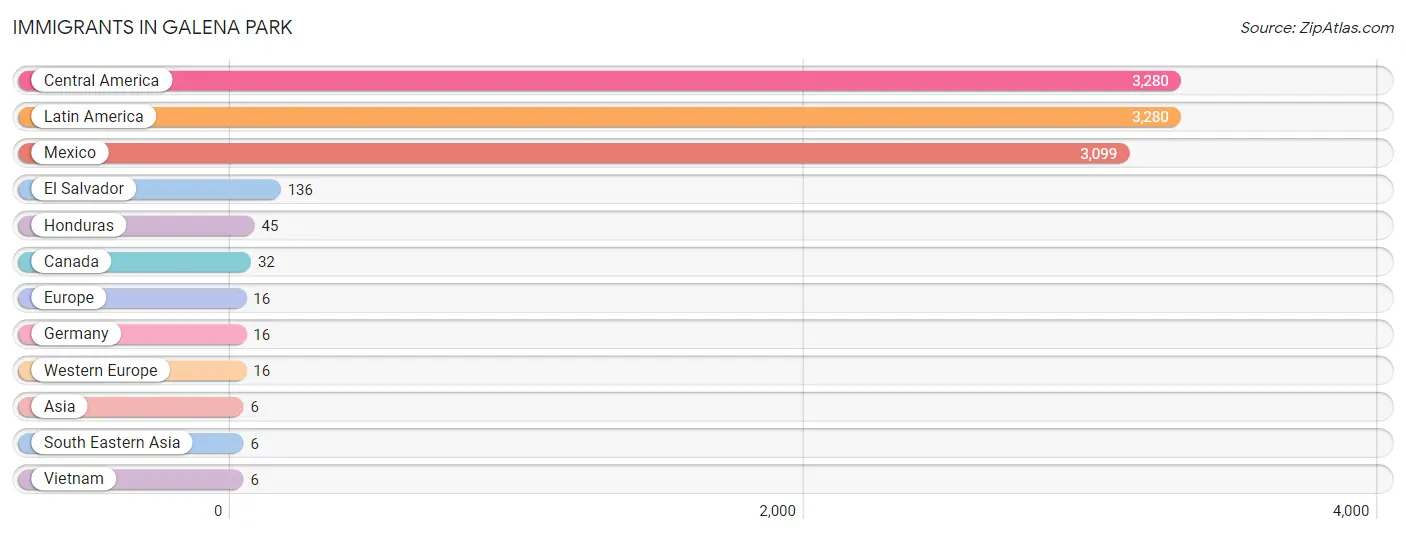
| Immigration Origin | # Population | % Population |
| Asia | 6 | 0.1% |
| Canada | 32 | 0.3% |
| Central America | 3,280 | 30.8% |
| El Salvador | 136 | 1.3% |
| Europe | 16 | 0.2% |
| Germany | 16 | 0.2% |
| Honduras | 45 | 0.4% |
| Latin America | 3,280 | 30.8% |
| Mexico | 3,099 | 29.1% |
| South Eastern Asia | 6 | 0.1% |
| Vietnam | 6 | 0.1% |
| Western Europe | 16 | 0.2% | View All 12 Rows |
Sex and Age in Galena Park
Sex and Age in Galena Park
The most populous age groups in Galena Park are 20 to 24 Years (671 | 12.1%) for men and 10 to 14 Years (579 | 11.3%) for women.
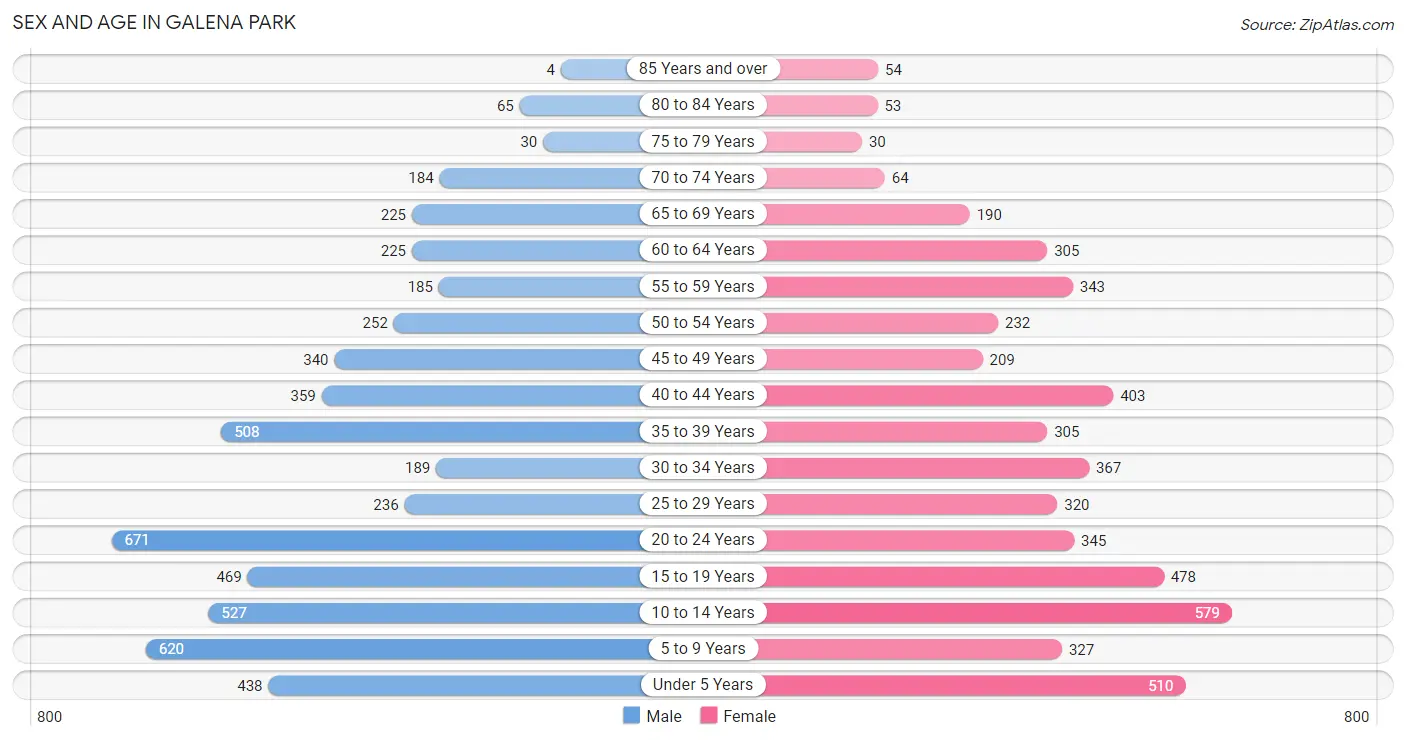
| Age Bracket | Male | Female |
| Under 5 Years | 438 (7.9%) | 510 (10.0%) |
| 5 to 9 Years | 620 (11.2%) | 327 (6.4%) |
| 10 to 14 Years | 527 (9.5%) | 579 (11.3%) |
| 15 to 19 Years | 469 (8.5%) | 478 (9.3%) |
| 20 to 24 Years | 671 (12.1%) | 345 (6.8%) |
| 25 to 29 Years | 236 (4.3%) | 320 (6.3%) |
| 30 to 34 Years | 189 (3.4%) | 367 (7.2%) |
| 35 to 39 Years | 508 (9.2%) | 305 (6.0%) |
| 40 to 44 Years | 359 (6.5%) | 403 (7.9%) |
| 45 to 49 Years | 340 (6.1%) | 209 (4.1%) |
| 50 to 54 Years | 252 (4.6%) | 232 (4.5%) |
| 55 to 59 Years | 185 (3.4%) | 343 (6.7%) |
| 60 to 64 Years | 225 (4.1%) | 305 (6.0%) |
| 65 to 69 Years | 225 (4.1%) | 190 (3.7%) |
| 70 to 74 Years | 184 (3.3%) | 64 (1.3%) |
| 75 to 79 Years | 30 (0.5%) | 30 (0.6%) |
| 80 to 84 Years | 65 (1.2%) | 53 (1.0%) |
| 85 Years and over | 4 (0.1%) | 54 (1.1%) |
| Total | 5,527 (100.0%) | 5,114 (100.0%) |
Families and Households in Galena Park
Median Family Size in Galena Park
The median family size in Galena Park is 3.95 persons per family, with married-couple families (1,471 | 60.6%) accounting for the largest median family size of 4.09 persons per family. On the other hand, single male/father families (253 | 10.4%) represent the smallest median family size with 3.02 persons per family.
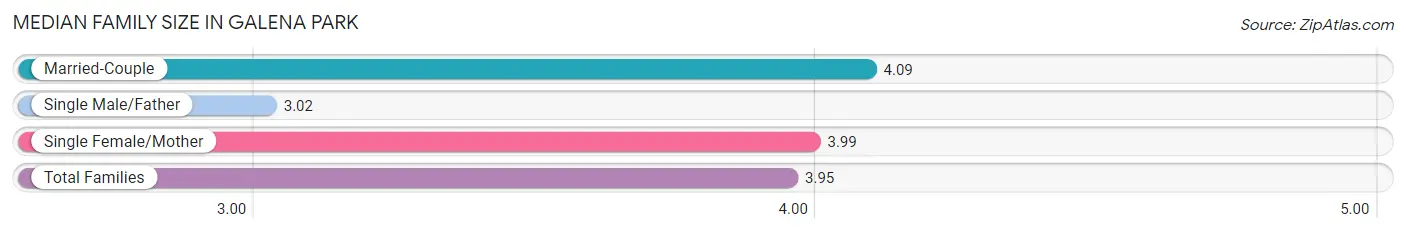
| Family Type | # Families | Family Size |
| Married-Couple | 1,471 (60.6%) | 4.09 |
| Single Male/Father | 253 (10.4%) | 3.02 |
| Single Female/Mother | 704 (29.0%) | 3.99 |
| Total Families | 2,428 (100.0%) | 3.95 |
Median Household Size in Galena Park
The median household size in Galena Park is 3.66 persons per household, with single female/mother households (704 | 24.2%) accounting for the largest median household size of 4.29 persons per household. non-family households (478 | 16.5%) represent the smallest median household size with 1.47 persons per household.
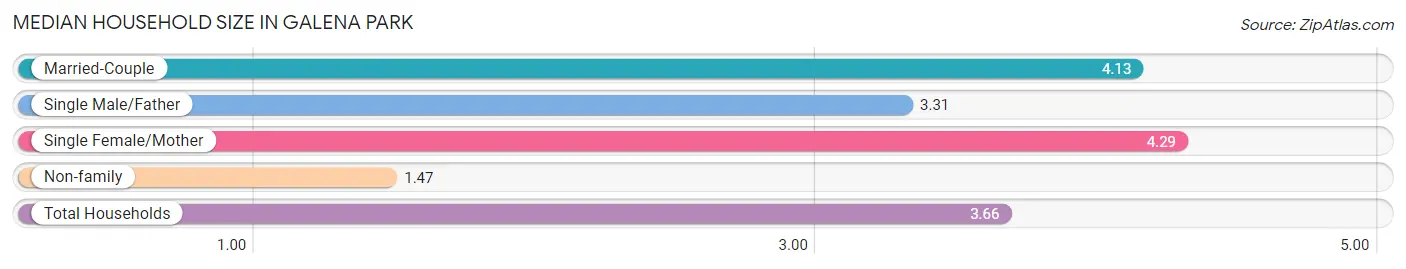
| Household Type | # Households | Household Size |
| Married-Couple | 1,471 (50.6%) | 4.13 |
| Single Male/Father | 253 (8.7%) | 3.31 |
| Single Female/Mother | 704 (24.2%) | 4.29 |
| Non-family | 478 (16.5%) | 1.47 |
| Total Households | 2,906 (100.0%) | 3.66 |
Household Size by Marriage Status in Galena Park
Out of a total of 2,906 households in Galena Park, 2,428 (83.6%) are family households, while 478 (16.5%) are nonfamily households. The most numerous type of family households are 4-person households, comprising 810, and the most common type of nonfamily households are 1-person households, comprising 380.
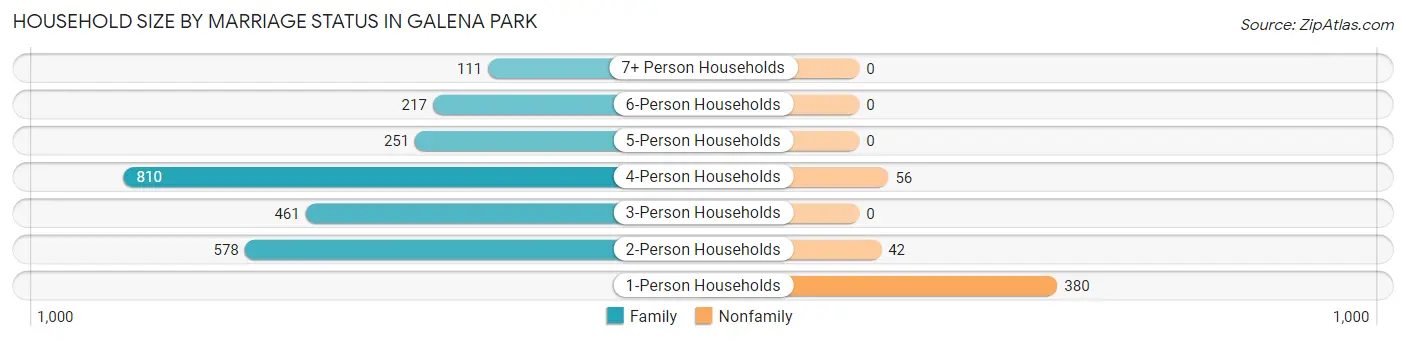
| Household Size | Family Households | Nonfamily Households |
| 1-Person Households | - | 380 (13.1%) |
| 2-Person Households | 578 (19.9%) | 42 (1.5%) |
| 3-Person Households | 461 (15.9%) | 0 (0.0%) |
| 4-Person Households | 810 (27.9%) | 56 (1.9%) |
| 5-Person Households | 251 (8.6%) | 0 (0.0%) |
| 6-Person Households | 217 (7.5%) | 0 (0.0%) |
| 7+ Person Households | 111 (3.8%) | 0 (0.0%) |
| Total | 2,428 (83.6%) | 478 (16.5%) |
Female Fertility in Galena Park
Fertility by Age in Galena Park
Average fertility rate in Galena Park is 67.0 births per 1,000 women. Women in the age bracket of 15 to 19 years have the highest fertility rate with 123.0 births per 1,000 women. Women in the age bracket of 20 to 34 years acount for 57.8% of all women with births.
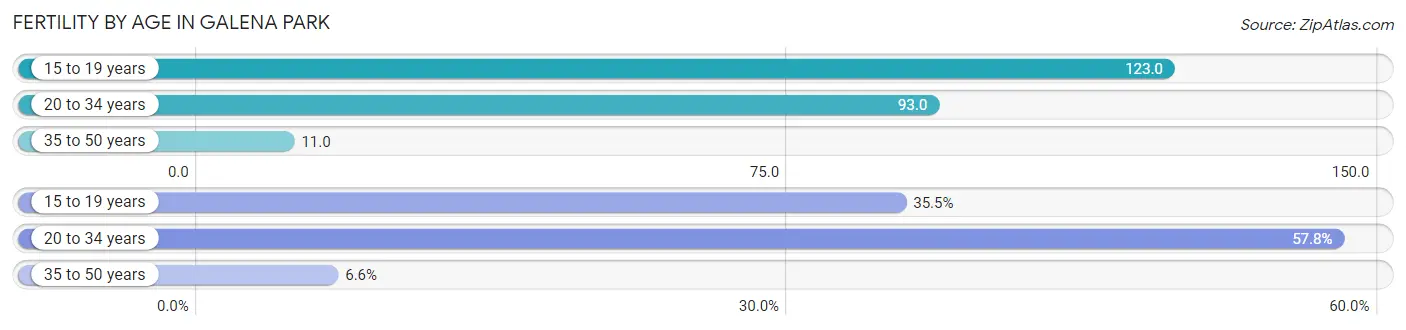
| Age Bracket | Women with Births | Births / 1,000 Women |
| 15 to 19 years | 59 (35.5%) | 123.0 |
| 20 to 34 years | 96 (57.8%) | 93.0 |
| 35 to 50 years | 11 (6.6%) | 11.0 |
| Total | 166 (100.0%) | 67.0 |
Fertility by Age by Marriage Status in Galena Park
44.0% of women with births (166) in Galena Park are married. The highest percentage of unmarried women with births falls into 15 to 19 years age bracket with 100.0% of them unmarried at the time of birth, while the lowest percentage of unmarried women with births belong to 20 to 34 years age bracket with 24.0% of them unmarried.
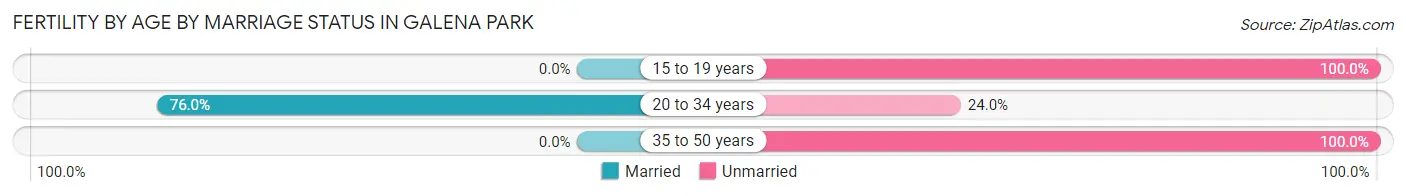
| Age Bracket | Married | Unmarried |
| 15 to 19 years | 0 (0.0%) | 59 (100.0%) |
| 20 to 34 years | 73 (76.0%) | 23 (24.0%) |
| 35 to 50 years | 0 (0.0%) | 11 (100.0%) |
| Total | 73 (44.0%) | 93 (56.0%) |
Fertility by Education in Galena Park
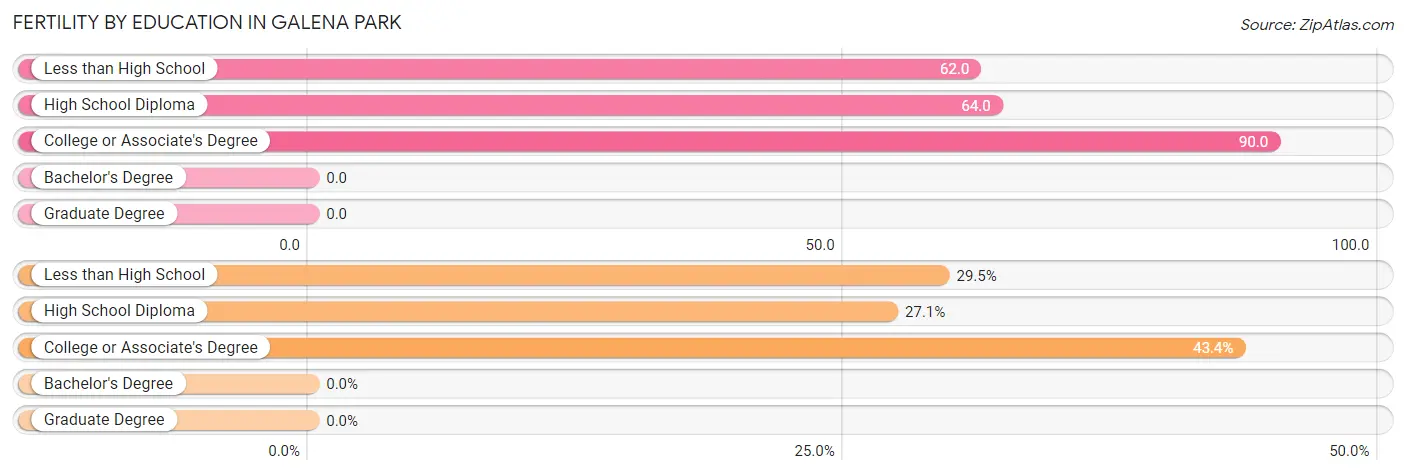
| Educational Attainment | Women with Births | Births / 1,000 Women |
| Less than High School | 49 (29.5%) | 62.0 |
| High School Diploma | 45 (27.1%) | 64.0 |
| College or Associate's Degree | 72 (43.4%) | 90.0 |
| Bachelor's Degree | 0 (0.0%) | 0.0 |
| Graduate Degree | 0 (0.0%) | 0.0 |
| Total | 166 (100.0%) | 67.0 |
Fertility by Education by Marriage Status in Galena Park
56.0% of women with births in Galena Park are unmarried. Women with the educational attainment of college or associate's degree are most likely to be married with 84.7% of them married at childbirth, while women with the educational attainment of less than high school are least likely to be married with 100.0% of them unmarried at childbirth.
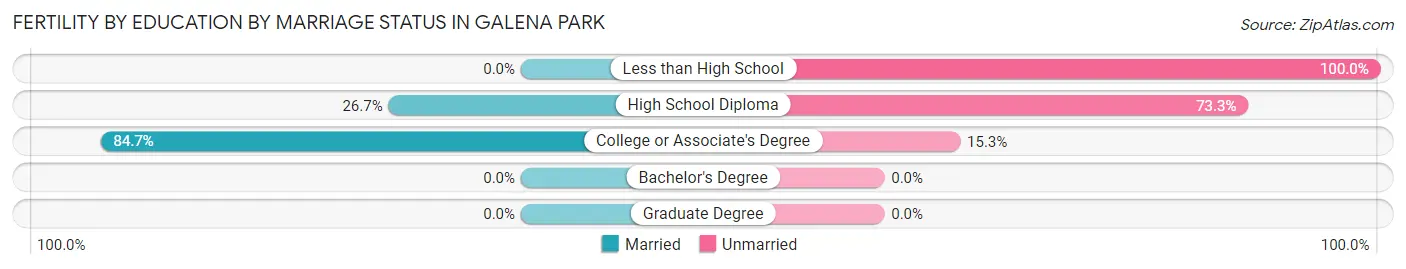
| Educational Attainment | Married | Unmarried |
| Less than High School | 0 (0.0%) | 49 (100.0%) |
| High School Diploma | 12 (26.7%) | 33 (73.3%) |
| College or Associate's Degree | 61 (84.7%) | 11 (15.3%) |
| Bachelor's Degree | 0 (0.0%) | 0 (0.0%) |
| Graduate Degree | 0 (0.0%) | 0 (0.0%) |
| Total | 73 (44.0%) | 93 (56.0%) |
Employment Characteristics in Galena Park
Employment by Class of Employer in Galena Park
Among the 3,661 employed individuals in Galena Park, private company employees (3,015 | 82.4%), local government employees (245 | 6.7%), and self-employed (not incorporated) (148 | 4.0%) make up the most common classes of employment.
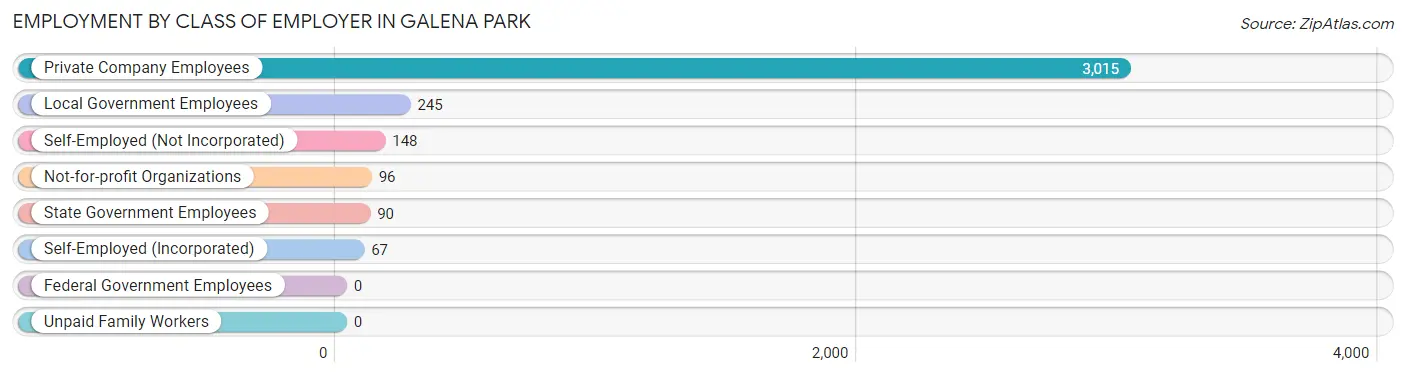
| Employer Class | # Employees | % Employees |
| Private Company Employees | 3,015 | 82.4% |
| Self-Employed (Incorporated) | 67 | 1.8% |
| Self-Employed (Not Incorporated) | 148 | 4.0% |
| Not-for-profit Organizations | 96 | 2.6% |
| Local Government Employees | 245 | 6.7% |
| State Government Employees | 90 | 2.5% |
| Federal Government Employees | 0 | 0.0% |
| Unpaid Family Workers | 0 | 0.0% |
| Total | 3,661 | 100.0% |
Employment Status by Age in Galena Park
According to the labor force statistics for Galena Park, out of the total population over 16 years of age (7,327), 59.9% or 4,389 individuals are in the labor force, with 14.3% or 628 of them unemployed. The age group with the highest labor force participation rate is 45 to 54 years, with 81.0% or 837 individuals in the labor force. Within the labor force, the 20 to 24 years age range has the highest percentage of unemployed individuals, with 32.1% or 228 of them being unemployed.
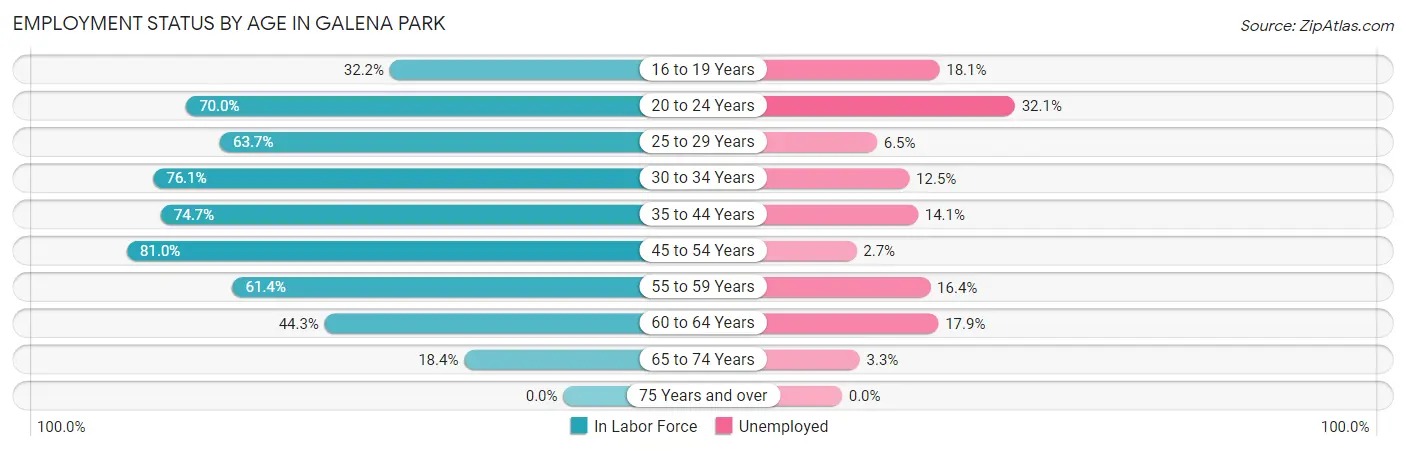
| Age Bracket | In Labor Force | Unemployed |
| 16 to 19 Years | 204 (32.2%) | 37 (18.1%) |
| 20 to 24 Years | 711 (70.0%) | 228 (32.1%) |
| 25 to 29 Years | 354 (63.7%) | 23 (6.5%) |
| 30 to 34 Years | 423 (76.1%) | 53 (12.5%) |
| 35 to 44 Years | 1,177 (74.7%) | 166 (14.1%) |
| 45 to 54 Years | 837 (81.0%) | 23 (2.7%) |
| 55 to 59 Years | 324 (61.4%) | 53 (16.4%) |
| 60 to 64 Years | 235 (44.3%) | 42 (17.9%) |
| 65 to 74 Years | 122 (18.4%) | 4 (3.3%) |
| 75 Years and over | 0 (0.0%) | 0 (0.0%) |
| Total | 4,389 (59.9%) | 628 (14.3%) |
Employment Status by Educational Attainment in Galena Park
According to labor force statistics for Galena Park, 70.1% of individuals (3,349) out of the total population between 25 and 64 years of age (4,778) are in the labor force, with 10.7% or 358 of them being unemployed. The group with the highest labor force participation rate are those with the educational attainment of bachelor's degree or higher, with 91.8% or 315 individuals in the labor force. Within the labor force, individuals with high school diploma education have the highest percentage of unemployment, with 16.7% or 227 of them being unemployed.
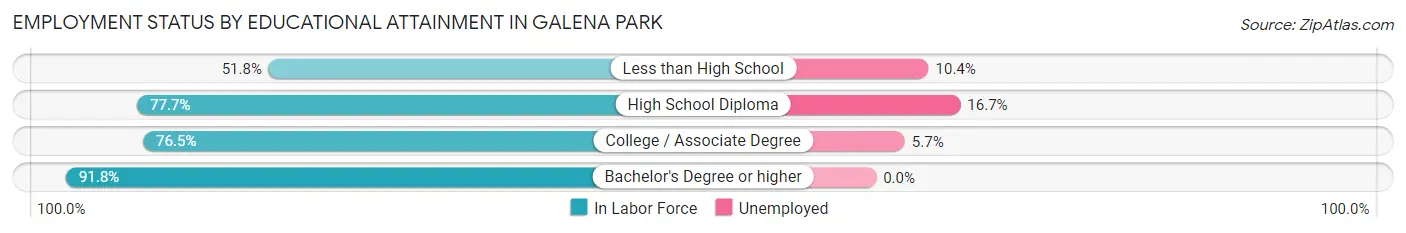
| Educational Attainment | In Labor Force | Unemployed |
| Less than High School | 799 (51.8%) | 160 (10.4%) |
| High School Diploma | 1,361 (77.7%) | 292 (16.7%) |
| College / Associate Degree | 874 (76.5%) | 65 (5.7%) |
| Bachelor's Degree or higher | 315 (91.8%) | 0 (0.0%) |
| Total | 3,349 (70.1%) | 511 (10.7%) |
Employment Occupations by Sex in Galena Park
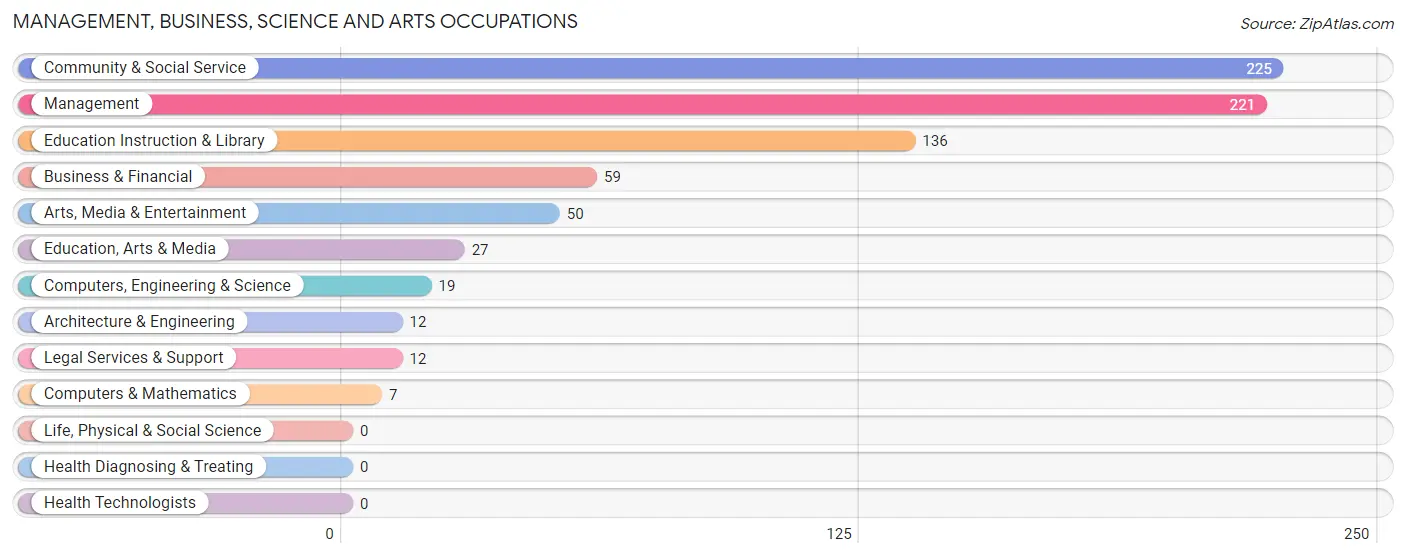
Management, Business, Science and Arts Occupations
The most common Management, Business, Science and Arts occupations in Galena Park are Community & Social Service (225 | 6.0%), Management (221 | 5.9%), Education Instruction & Library (136 | 3.6%), Business & Financial (59 | 1.6%), and Arts, Media & Entertainment (50 | 1.3%).
Management, Business, Science and Arts Occupations by Sex
Within the Management, Business, Science and Arts occupations in Galena Park, the most male-oriented occupations are Computers, Engineering & Science (100.0%), Computers & Mathematics (100.0%), and Architecture & Engineering (100.0%), while the most female-oriented occupations are Arts, Media & Entertainment (100.0%), Education Instruction & Library (91.9%), and Community & Social Service (77.8%).
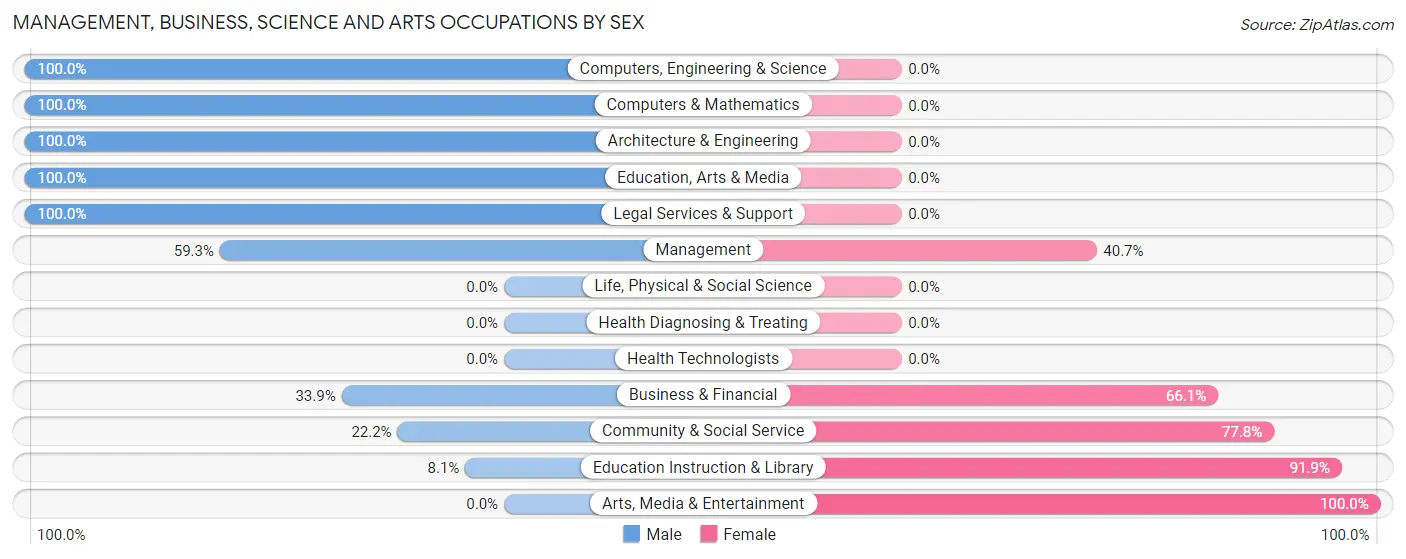
| Occupation | Male | Female |
| Management | 131 (59.3%) | 90 (40.7%) |
| Business & Financial | 20 (33.9%) | 39 (66.1%) |
| Computers, Engineering & Science | 19 (100.0%) | 0 (0.0%) |
| Computers & Mathematics | 7 (100.0%) | 0 (0.0%) |
| Architecture & Engineering | 12 (100.0%) | 0 (0.0%) |
| Life, Physical & Social Science | 0 (0.0%) | 0 (0.0%) |
| Community & Social Service | 50 (22.2%) | 175 (77.8%) |
| Education, Arts & Media | 27 (100.0%) | 0 (0.0%) |
| Legal Services & Support | 12 (100.0%) | 0 (0.0%) |
| Education Instruction & Library | 11 (8.1%) | 125 (91.9%) |
| Arts, Media & Entertainment | 0 (0.0%) | 50 (100.0%) |
| Health Diagnosing & Treating | 0 (0.0%) | 0 (0.0%) |
| Health Technologists | 0 (0.0%) | 0 (0.0%) |
| Total (Category) | 220 (42.0%) | 304 (58.0%) |
| Total (Overall) | 2,281 (60.7%) | 1,476 (39.3%) |
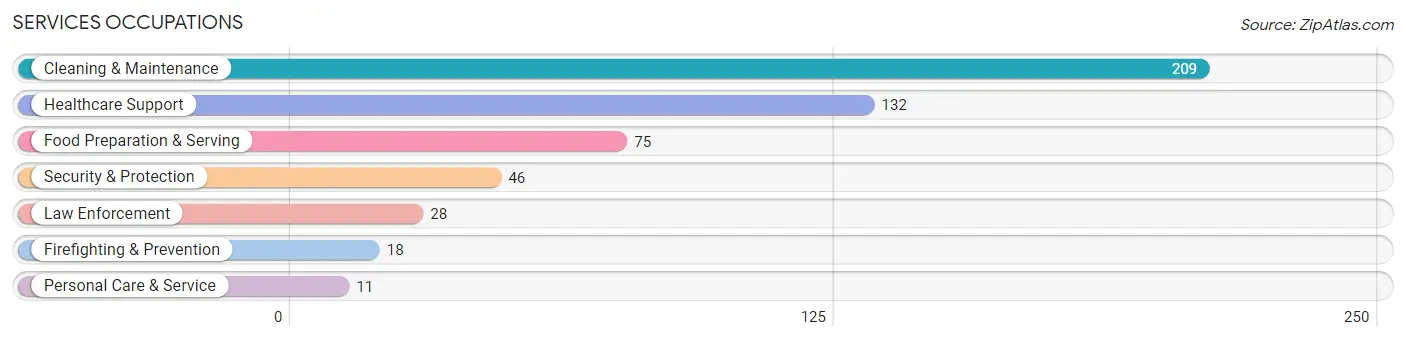
Services Occupations
The most common Services occupations in Galena Park are Cleaning & Maintenance (209 | 5.6%), Healthcare Support (132 | 3.5%), Food Preparation & Serving (75 | 2.0%), Security & Protection (46 | 1.2%), and Law Enforcement (28 | 0.7%).
Services Occupations by Sex
Within the Services occupations in Galena Park, the most male-oriented occupations are Security & Protection (100.0%), Firefighting & Prevention (100.0%), and Law Enforcement (100.0%), while the most female-oriented occupations are Healthcare Support (100.0%), Food Preparation & Serving (100.0%), and Personal Care & Service (100.0%).
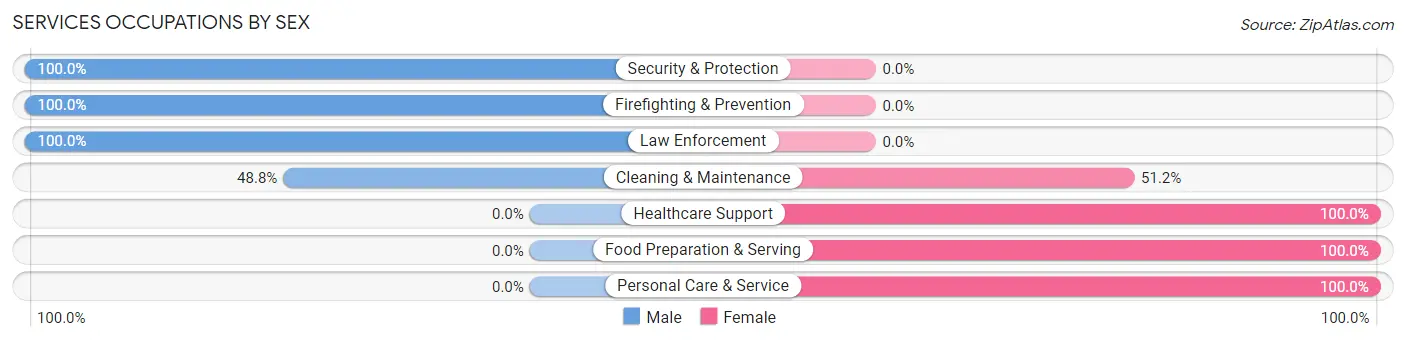
| Occupation | Male | Female |
| Healthcare Support | 0 (0.0%) | 132 (100.0%) |
| Security & Protection | 46 (100.0%) | 0 (0.0%) |
| Firefighting & Prevention | 18 (100.0%) | 0 (0.0%) |
| Law Enforcement | 28 (100.0%) | 0 (0.0%) |
| Food Preparation & Serving | 0 (0.0%) | 75 (100.0%) |
| Cleaning & Maintenance | 102 (48.8%) | 107 (51.2%) |
| Personal Care & Service | 0 (0.0%) | 11 (100.0%) |
| Total (Category) | 148 (31.3%) | 325 (68.7%) |
| Total (Overall) | 2,281 (60.7%) | 1,476 (39.3%) |
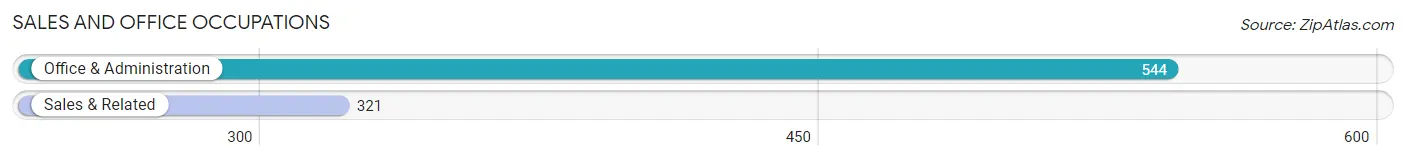
Sales and Office Occupations
The most common Sales and Office occupations in Galena Park are Office & Administration (544 | 14.5%), and Sales & Related (321 | 8.5%).
Sales and Office Occupations by Sex
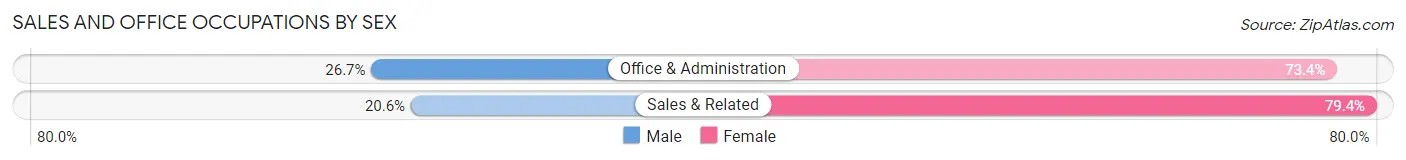
| Occupation | Male | Female |
| Sales & Related | 66 (20.6%) | 255 (79.4%) |
| Office & Administration | 145 (26.7%) | 399 (73.4%) |
| Total (Category) | 211 (24.4%) | 654 (75.6%) |
| Total (Overall) | 2,281 (60.7%) | 1,476 (39.3%) |
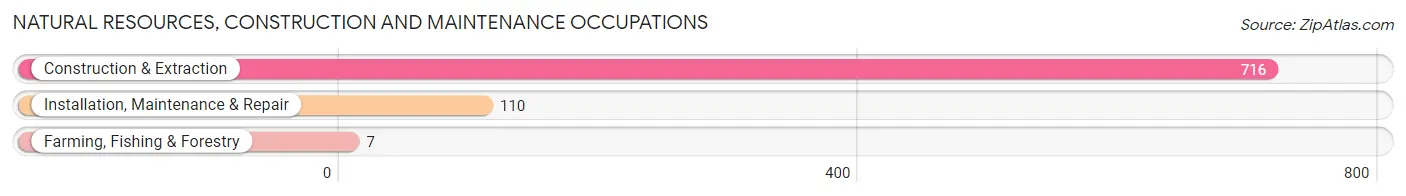
Natural Resources, Construction and Maintenance Occupations
The most common Natural Resources, Construction and Maintenance occupations in Galena Park are Construction & Extraction (716 | 19.1%), Installation, Maintenance & Repair (110 | 2.9%), and Farming, Fishing & Forestry (7 | 0.2%).
Natural Resources, Construction and Maintenance Occupations by Sex
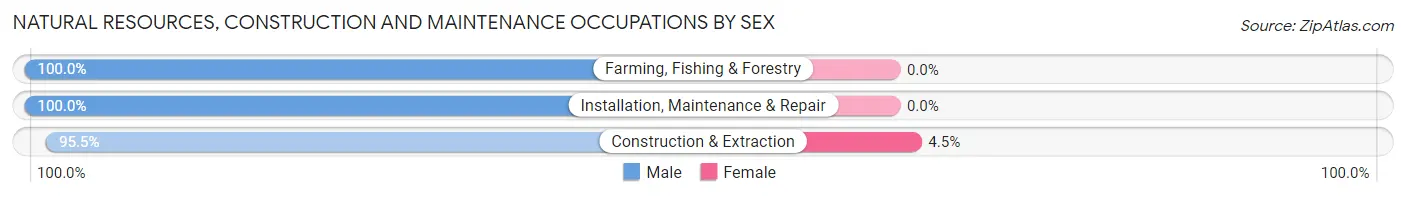
| Occupation | Male | Female |
| Farming, Fishing & Forestry | 7 (100.0%) | 0 (0.0%) |
| Construction & Extraction | 684 (95.5%) | 32 (4.5%) |
| Installation, Maintenance & Repair | 110 (100.0%) | 0 (0.0%) |
| Total (Category) | 801 (96.2%) | 32 (3.8%) |
| Total (Overall) | 2,281 (60.7%) | 1,476 (39.3%) |
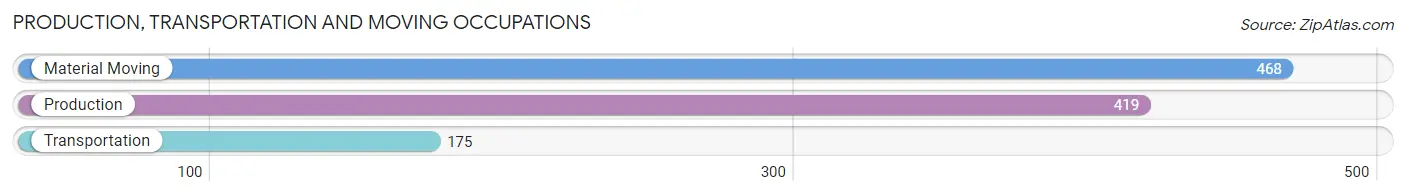
Production, Transportation and Moving Occupations
The most common Production, Transportation and Moving occupations in Galena Park are Material Moving (468 | 12.5%), Production (419 | 11.2%), and Transportation (175 | 4.7%).
Production, Transportation and Moving Occupations by Sex
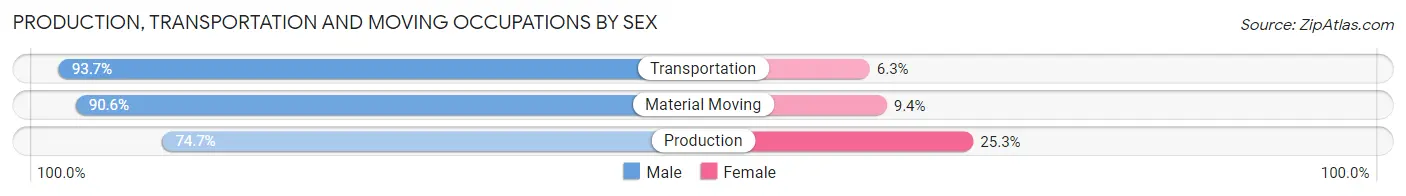
| Occupation | Male | Female |
| Production | 313 (74.7%) | 106 (25.3%) |
| Transportation | 164 (93.7%) | 11 (6.3%) |
| Material Moving | 424 (90.6%) | 44 (9.4%) |
| Total (Category) | 901 (84.8%) | 161 (15.2%) |
| Total (Overall) | 2,281 (60.7%) | 1,476 (39.3%) |
Employment Industries by Sex in Galena Park
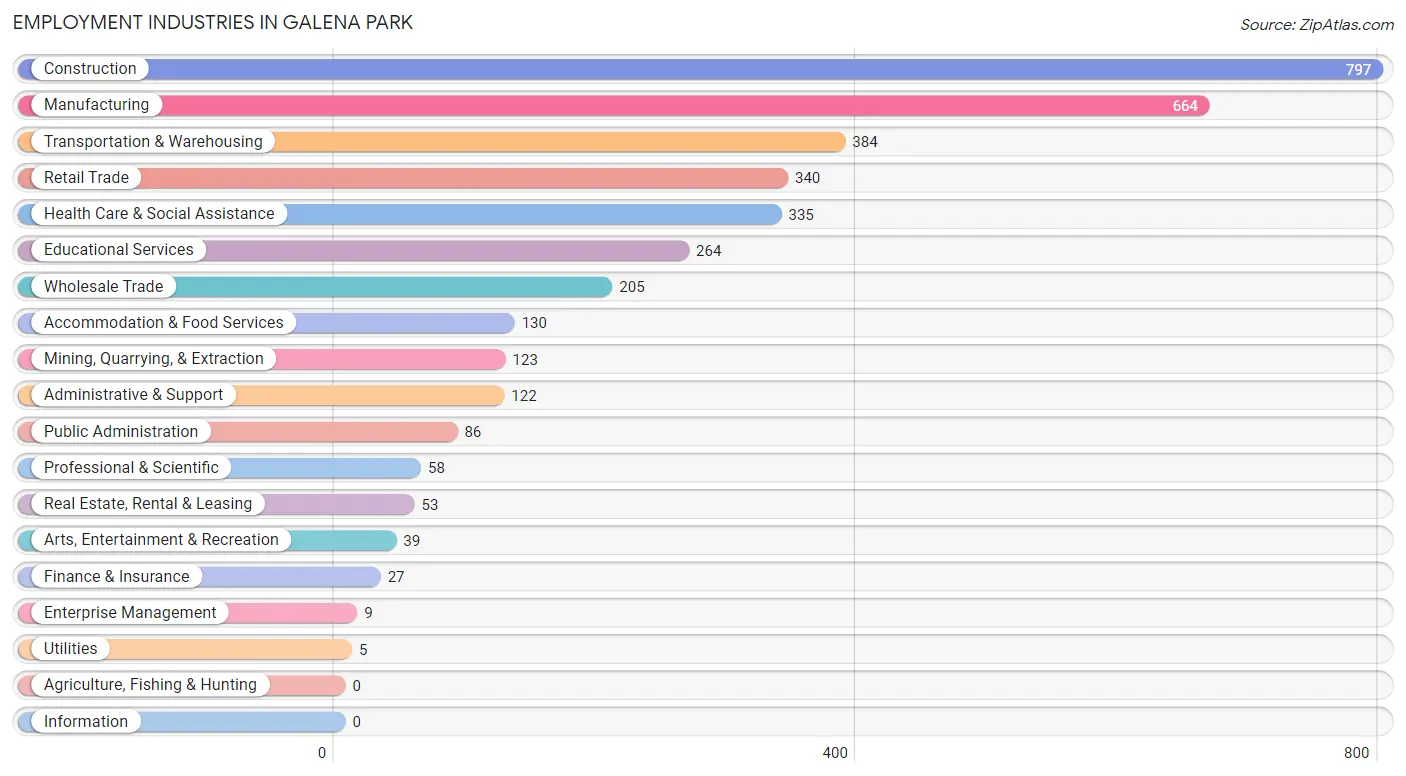
Employment Industries in Galena Park
The major employment industries in Galena Park include Construction (797 | 21.2%), Manufacturing (664 | 17.7%), Transportation & Warehousing (384 | 10.2%), Retail Trade (340 | 9.0%), and Health Care & Social Assistance (335 | 8.9%).
Employment Industries by Sex in Galena Park
The Galena Park industries that see more men than women are Utilities (100.0%), Construction (93.0%), and Manufacturing (84.0%), whereas the industries that tend to have a higher number of women are Enterprise Management (100.0%), Arts, Entertainment & Recreation (100.0%), and Accommodation & Food Services (100.0%).
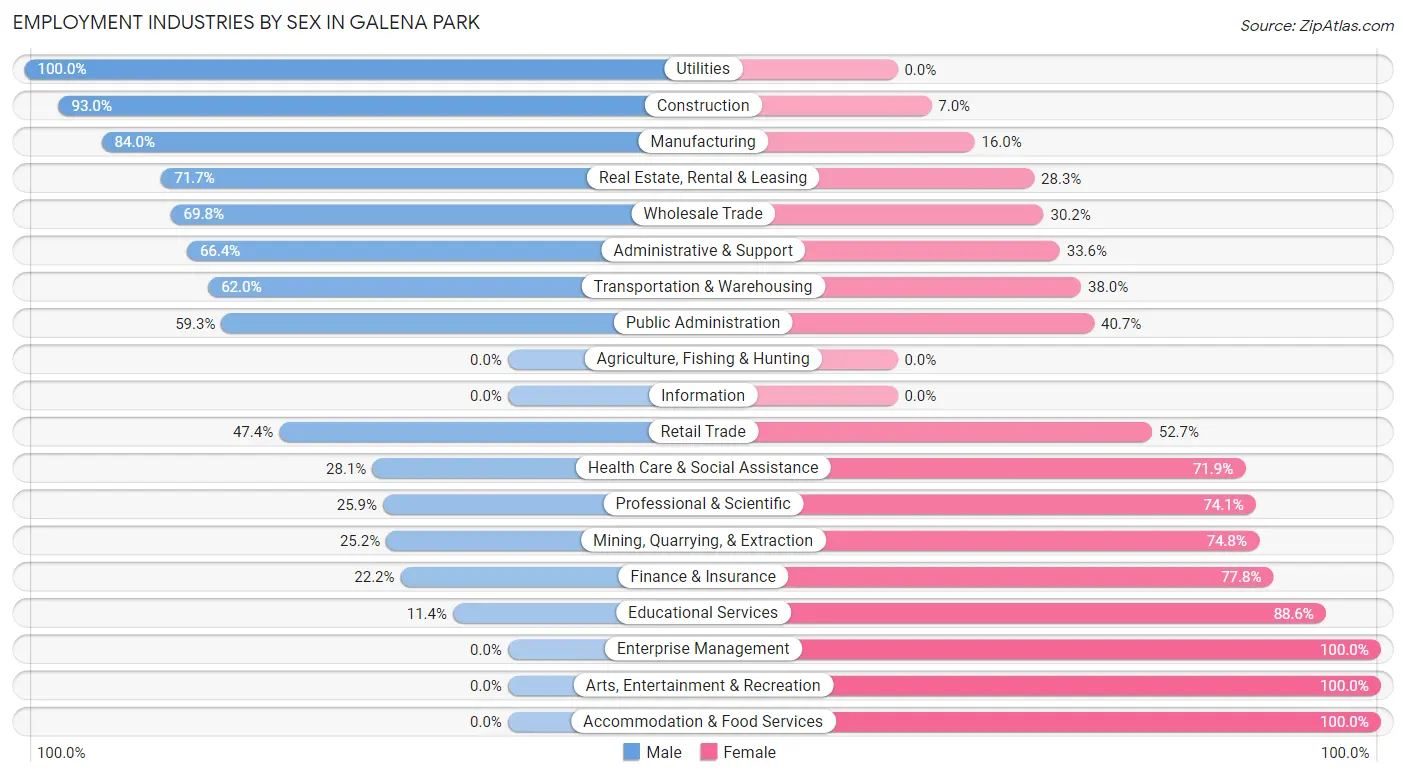
| Industry | Male | Female |
| Agriculture, Fishing & Hunting | 0 (0.0%) | 0 (0.0%) |
| Mining, Quarrying, & Extraction | 31 (25.2%) | 92 (74.8%) |
| Construction | 741 (93.0%) | 56 (7.0%) |
| Manufacturing | 558 (84.0%) | 106 (16.0%) |
| Wholesale Trade | 143 (69.8%) | 62 (30.2%) |
| Retail Trade | 161 (47.3%) | 179 (52.6%) |
| Transportation & Warehousing | 238 (62.0%) | 146 (38.0%) |
| Utilities | 5 (100.0%) | 0 (0.0%) |
| Information | 0 (0.0%) | 0 (0.0%) |
| Finance & Insurance | 6 (22.2%) | 21 (77.8%) |
| Real Estate, Rental & Leasing | 38 (71.7%) | 15 (28.3%) |
| Professional & Scientific | 15 (25.9%) | 43 (74.1%) |
| Enterprise Management | 0 (0.0%) | 9 (100.0%) |
| Administrative & Support | 81 (66.4%) | 41 (33.6%) |
| Educational Services | 30 (11.4%) | 234 (88.6%) |
| Health Care & Social Assistance | 94 (28.1%) | 241 (71.9%) |
| Arts, Entertainment & Recreation | 0 (0.0%) | 39 (100.0%) |
| Accommodation & Food Services | 0 (0.0%) | 130 (100.0%) |
| Public Administration | 51 (59.3%) | 35 (40.7%) |
| Total | 2,281 (60.7%) | 1,476 (39.3%) |
Education in Galena Park
School Enrollment in Galena Park
The most common levels of schooling among the 3,129 students in Galena Park are high school (887 | 28.3%), middle school (849 | 27.1%), and elementary school (657 | 21.0%).
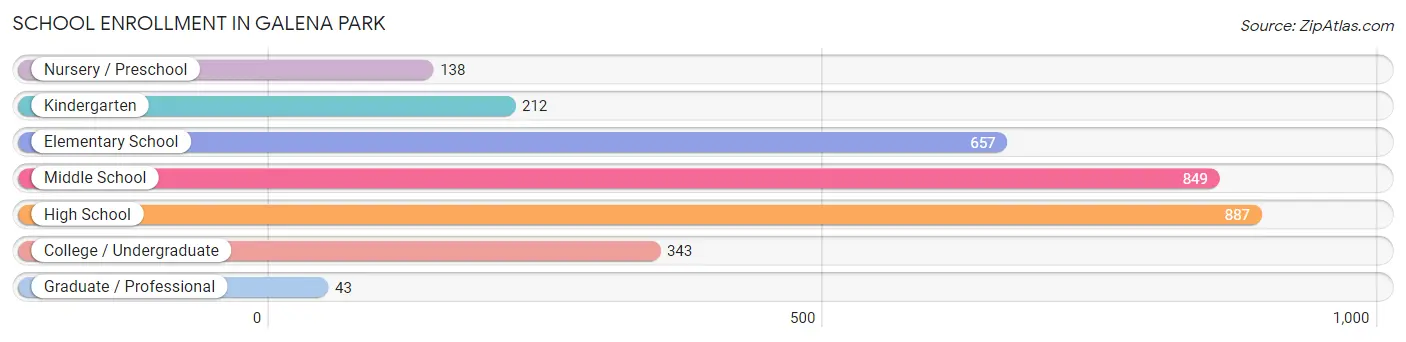
| School Level | # Students | % Students |
| Nursery / Preschool | 138 | 4.4% |
| Kindergarten | 212 | 6.8% |
| Elementary School | 657 | 21.0% |
| Middle School | 849 | 27.1% |
| High School | 887 | 28.3% |
| College / Undergraduate | 343 | 11.0% |
| Graduate / Professional | 43 | 1.4% |
| Total | 3,129 | 100.0% |
School Enrollment by Age by Funding Source in Galena Park
Out of a total of 3,129 students who are enrolled in schools in Galena Park, 125 (4.0%) attend a private institution, while the remaining 3,004 (96.0%) are enrolled in public schools. The age group of 25 to 34 year olds has the highest likelihood of being enrolled in private schools, with 10 (12.3% in the age bracket) enrolled. Conversely, the age group of 3 to 4 year olds has the lowest likelihood of being enrolled in a private school, with 58 (100.0% in the age bracket) attending a public institution.
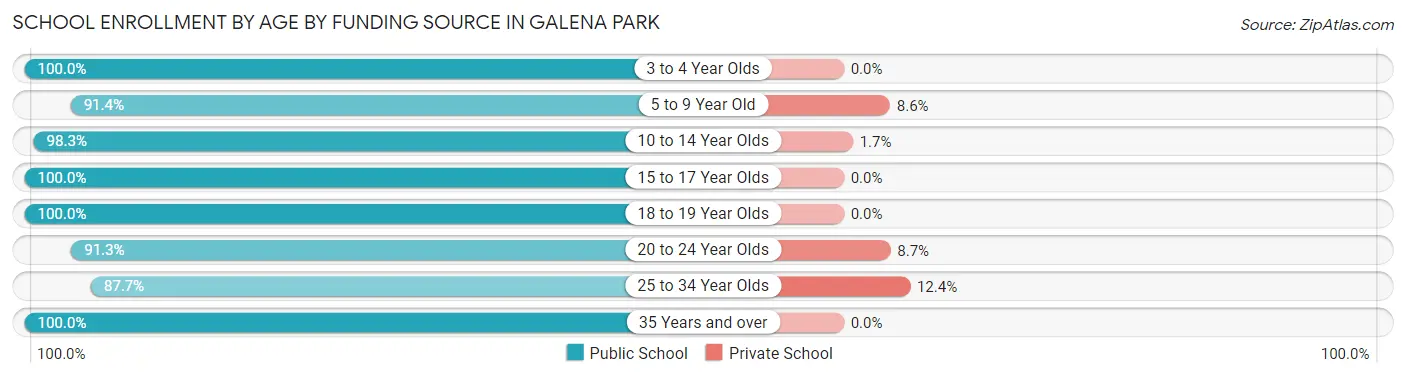
| Age Bracket | Public School | Private School |
| 3 to 4 Year Olds | 58 (100.0%) | 0 (0.0%) |
| 5 to 9 Year Old | 808 (91.4%) | 76 (8.6%) |
| 10 to 14 Year Olds | 1,044 (98.3%) | 18 (1.7%) |
| 15 to 17 Year Olds | 607 (100.0%) | 0 (0.0%) |
| 18 to 19 Year Olds | 178 (100.0%) | 0 (0.0%) |
| 20 to 24 Year Olds | 210 (91.3%) | 20 (8.7%) |
| 25 to 34 Year Olds | 71 (87.6%) | 10 (12.3%) |
| 35 Years and over | 29 (100.0%) | 0 (0.0%) |
| Total | 3,004 (96.0%) | 125 (4.0%) |
Educational Attainment by Field of Study in Galena Park
Education (125 | 32.0%), psychology (61 | 15.6%), computers & mathematics (56 | 14.3%), business (49 | 12.5%), and arts & humanities (43 | 11.0%) are the most common fields of study among 391 individuals in Galena Park who have obtained a bachelor's degree or higher.
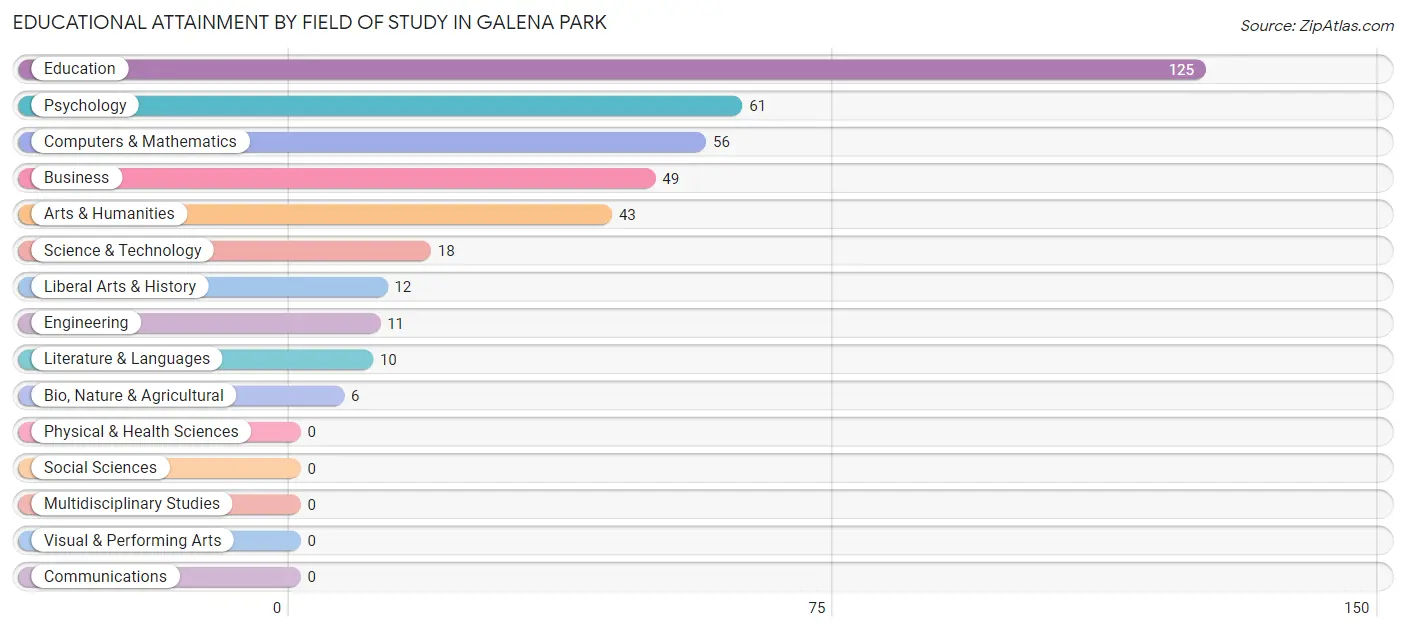
| Field of Study | # Graduates | % Graduates |
| Computers & Mathematics | 56 | 14.3% |
| Bio, Nature & Agricultural | 6 | 1.5% |
| Physical & Health Sciences | 0 | 0.0% |
| Psychology | 61 | 15.6% |
| Social Sciences | 0 | 0.0% |
| Engineering | 11 | 2.8% |
| Multidisciplinary Studies | 0 | 0.0% |
| Science & Technology | 18 | 4.6% |
| Business | 49 | 12.5% |
| Education | 125 | 32.0% |
| Literature & Languages | 10 | 2.6% |
| Liberal Arts & History | 12 | 3.1% |
| Visual & Performing Arts | 0 | 0.0% |
| Communications | 0 | 0.0% |
| Arts & Humanities | 43 | 11.0% |
| Total | 391 | 100.0% |
Transportation & Commute in Galena Park
Vehicle Availability by Sex in Galena Park
The most prevalent vehicle ownership categories in Galena Park are males with 2 vehicles (947, accounting for 41.7%) and females with 2 vehicles (547, making up 68.1%).
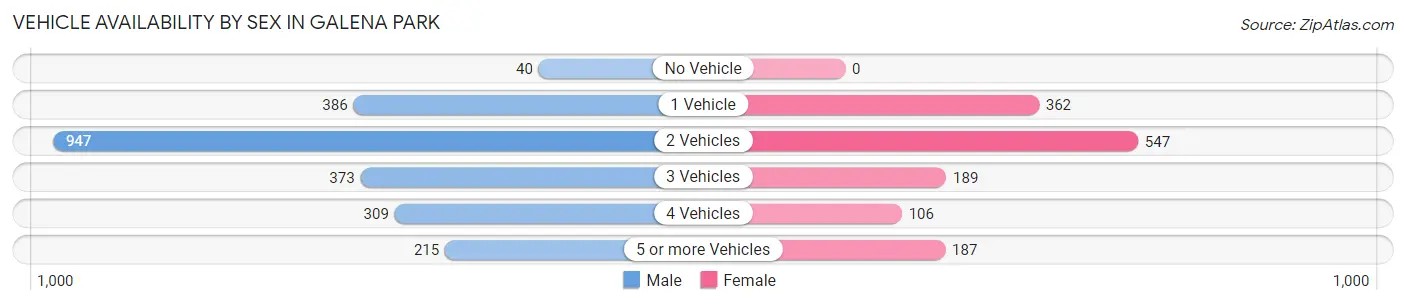
| Vehicles Available | Male | Female |
| No Vehicle | 40 (1.8%) | 0 (0.0%) |
| 1 Vehicle | 386 (17.0%) | 362 (26.0%) |
| 2 Vehicles | 947 (41.7%) | 547 (39.3%) |
| 3 Vehicles | 373 (16.4%) | 189 (13.6%) |
| 4 Vehicles | 309 (13.6%) | 106 (7.6%) |
| 5 or more Vehicles | 215 (9.5%) | 187 (13.4%) |
| Total | 2,270 (100.0%) | 1,391 (100.0%) |
Commute Time in Galena Park
The most frequently occuring commute durations in Galena Park are 20 to 24 minutes (824 commuters, 23.8%), 30 to 34 minutes (567 commuters, 16.4%), and 15 to 19 minutes (402 commuters, 11.6%).
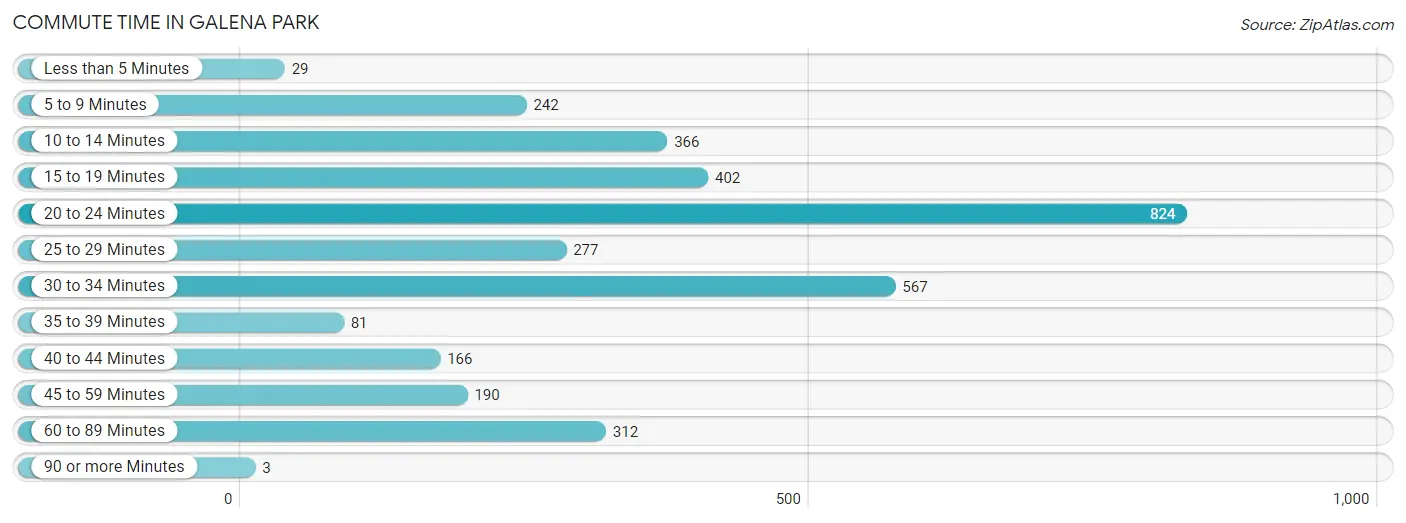
| Commute Time | # Commuters | % Commuters |
| Less than 5 Minutes | 29 | 0.8% |
| 5 to 9 Minutes | 242 | 7.0% |
| 10 to 14 Minutes | 366 | 10.6% |
| 15 to 19 Minutes | 402 | 11.6% |
| 20 to 24 Minutes | 824 | 23.8% |
| 25 to 29 Minutes | 277 | 8.0% |
| 30 to 34 Minutes | 567 | 16.4% |
| 35 to 39 Minutes | 81 | 2.3% |
| 40 to 44 Minutes | 166 | 4.8% |
| 45 to 59 Minutes | 190 | 5.5% |
| 60 to 89 Minutes | 312 | 9.0% |
| 90 or more Minutes | 3 | 0.1% |
Commute Time by Sex in Galena Park
The most common commute times in Galena Park are 20 to 24 minutes (432 commuters, 19.7%) for males and 20 to 24 minutes (392 commuters, 31.0%) for females.
| Commute Time | Male | Female |
| Less than 5 Minutes | 29 (1.3%) | 0 (0.0%) |
| 5 to 9 Minutes | 73 (3.3%) | 169 (13.4%) |
| 10 to 14 Minutes | 166 (7.6%) | 200 (15.8%) |
| 15 to 19 Minutes | 236 (10.7%) | 166 (13.1%) |
| 20 to 24 Minutes | 432 (19.7%) | 392 (31.0%) |
| 25 to 29 Minutes | 253 (11.5%) | 24 (1.9%) |
| 30 to 34 Minutes | 349 (15.9%) | 218 (17.2%) |
| 35 to 39 Minutes | 81 (3.7%) | 0 (0.0%) |
| 40 to 44 Minutes | 148 (6.7%) | 18 (1.4%) |
| 45 to 59 Minutes | 144 (6.6%) | 46 (3.6%) |
| 60 to 89 Minutes | 281 (12.8%) | 31 (2.5%) |
| 90 or more Minutes | 3 (0.1%) | 0 (0.0%) |
Time of Departure to Work by Sex in Galena Park
The most frequent times of departure to work in Galena Park are 6:00 AM to 6:29 AM (366, 16.7%) for males and 12:00 PM to 3:59 PM (206, 16.3%) for females.
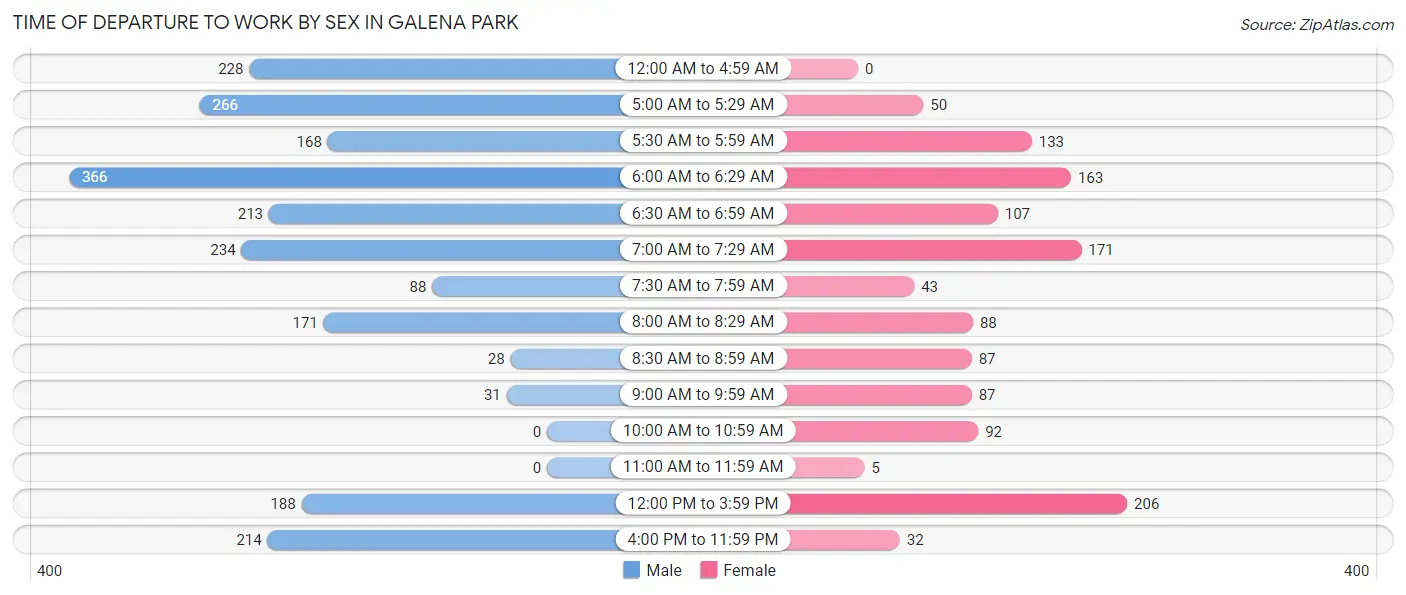
| Time of Departure | Male | Female |
| 12:00 AM to 4:59 AM | 228 (10.4%) | 0 (0.0%) |
| 5:00 AM to 5:29 AM | 266 (12.1%) | 50 (4.0%) |
| 5:30 AM to 5:59 AM | 168 (7.6%) | 133 (10.5%) |
| 6:00 AM to 6:29 AM | 366 (16.7%) | 163 (12.9%) |
| 6:30 AM to 6:59 AM | 213 (9.7%) | 107 (8.5%) |
| 7:00 AM to 7:29 AM | 234 (10.7%) | 171 (13.5%) |
| 7:30 AM to 7:59 AM | 88 (4.0%) | 43 (3.4%) |
| 8:00 AM to 8:29 AM | 171 (7.8%) | 88 (7.0%) |
| 8:30 AM to 8:59 AM | 28 (1.3%) | 87 (6.9%) |
| 9:00 AM to 9:59 AM | 31 (1.4%) | 87 (6.9%) |
| 10:00 AM to 10:59 AM | 0 (0.0%) | 92 (7.3%) |
| 11:00 AM to 11:59 AM | 0 (0.0%) | 5 (0.4%) |
| 12:00 PM to 3:59 PM | 188 (8.6%) | 206 (16.3%) |
| 4:00 PM to 11:59 PM | 214 (9.8%) | 32 (2.5%) |
| Total | 2,195 (100.0%) | 1,264 (100.0%) |
Housing Occupancy in Galena Park
Occupancy by Ownership in Galena Park
Of the total 2,906 dwellings in Galena Park, owner-occupied units account for 1,975 (68.0%), while renter-occupied units make up 931 (32.0%).
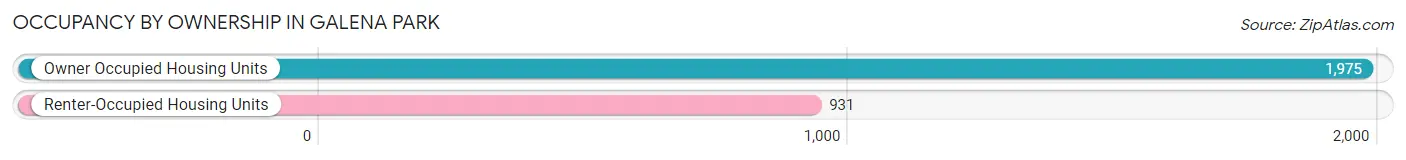
| Occupancy | # Housing Units | % Housing Units |
| Owner Occupied Housing Units | 1,975 | 68.0% |
| Renter-Occupied Housing Units | 931 | 32.0% |
| Total Occupied Housing Units | 2,906 | 100.0% |
Occupancy by Household Size in Galena Park
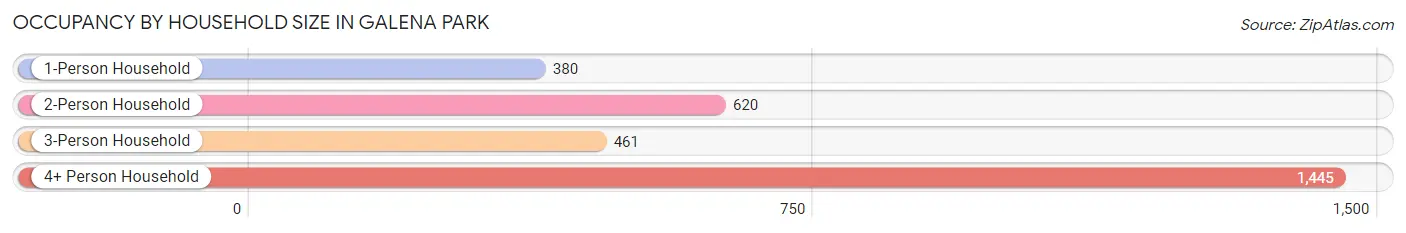
| Household Size | # Housing Units | % Housing Units |
| 1-Person Household | 380 | 13.1% |
| 2-Person Household | 620 | 21.3% |
| 3-Person Household | 461 | 15.9% |
| 4+ Person Household | 1,445 | 49.7% |
| Total Housing Units | 2,906 | 100.0% |
Occupancy by Ownership by Household Size in Galena Park
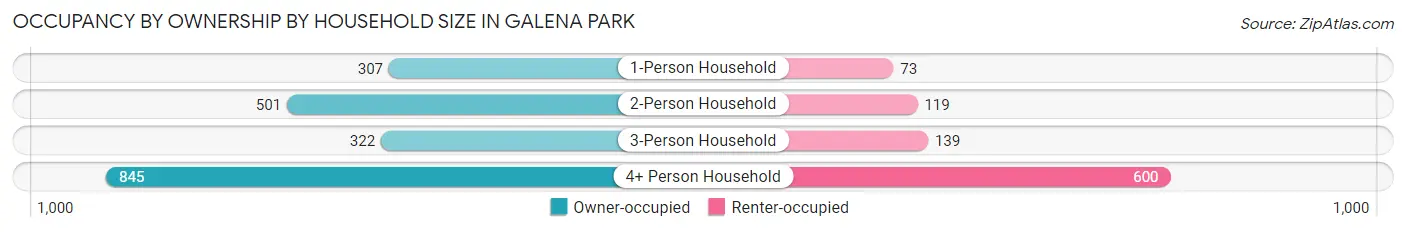
| Household Size | Owner-occupied | Renter-occupied |
| 1-Person Household | 307 (80.8%) | 73 (19.2%) |
| 2-Person Household | 501 (80.8%) | 119 (19.2%) |
| 3-Person Household | 322 (69.9%) | 139 (30.1%) |
| 4+ Person Household | 845 (58.5%) | 600 (41.5%) |
| Total Housing Units | 1,975 (68.0%) | 931 (32.0%) |
Occupancy by Educational Attainment in Galena Park
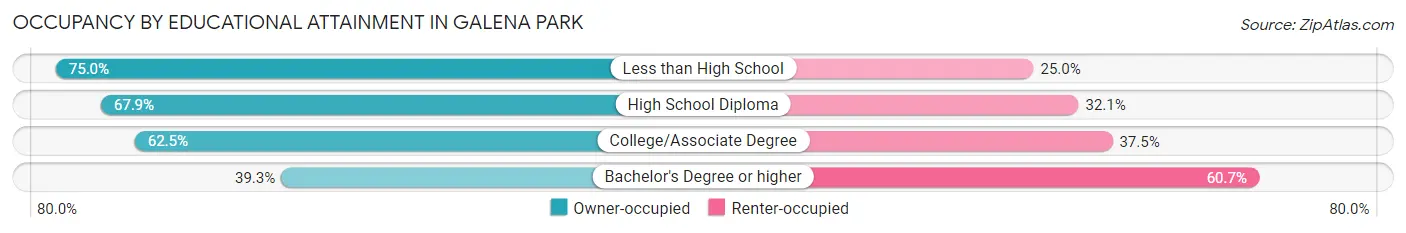
| Household Size | Owner-occupied | Renter-occupied |
| Less than High School | 842 (75.0%) | 280 (25.0%) |
| High School Diploma | 662 (67.9%) | 313 (32.1%) |
| College/Associate Degree | 412 (62.5%) | 247 (37.5%) |
| Bachelor's Degree or higher | 59 (39.3%) | 91 (60.7%) |
Occupancy by Age of Householder in Galena Park
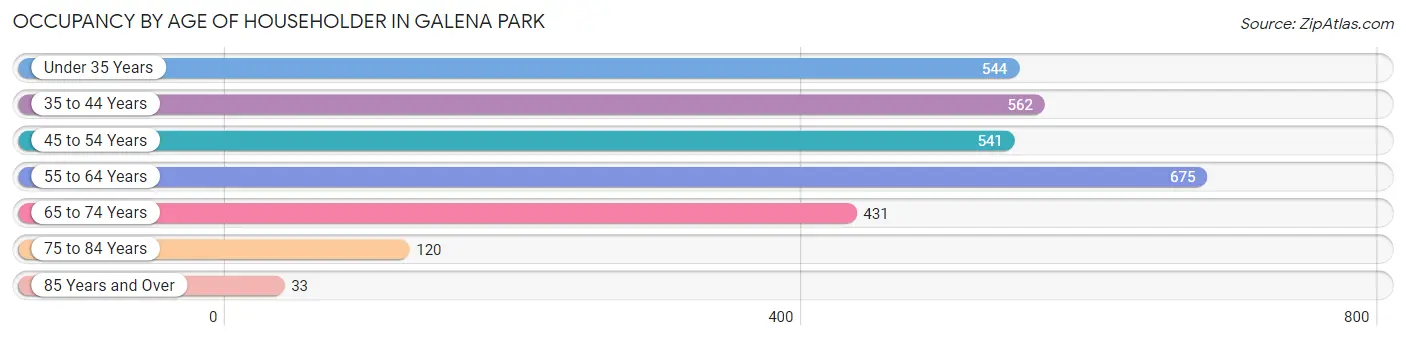
| Age Bracket | # Households | % Households |
| Under 35 Years | 544 | 18.7% |
| 35 to 44 Years | 562 | 19.3% |
| 45 to 54 Years | 541 | 18.6% |
| 55 to 64 Years | 675 | 23.2% |
| 65 to 74 Years | 431 | 14.8% |
| 75 to 84 Years | 120 | 4.1% |
| 85 Years and Over | 33 | 1.1% |
| Total | 2,906 | 100.0% |
Housing Finances in Galena Park
Median Income by Occupancy in Galena Park
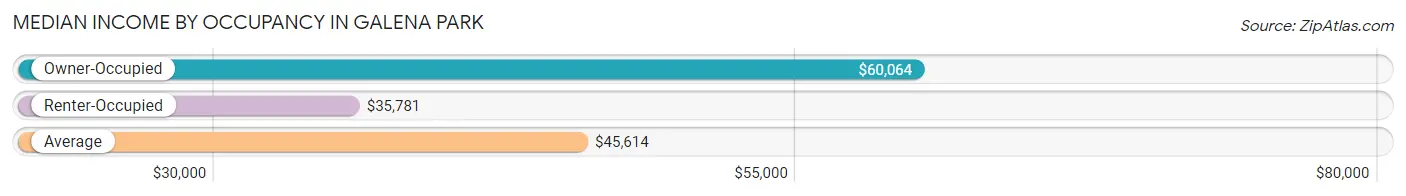
| Occupancy Type | # Households | Median Income |
| Owner-Occupied | 1,975 (68.0%) | $60,064 |
| Renter-Occupied | 931 (32.0%) | $35,781 |
| Average | 2,906 (100.0%) | $45,614 |
Occupancy by Householder Income Bracket in Galena Park
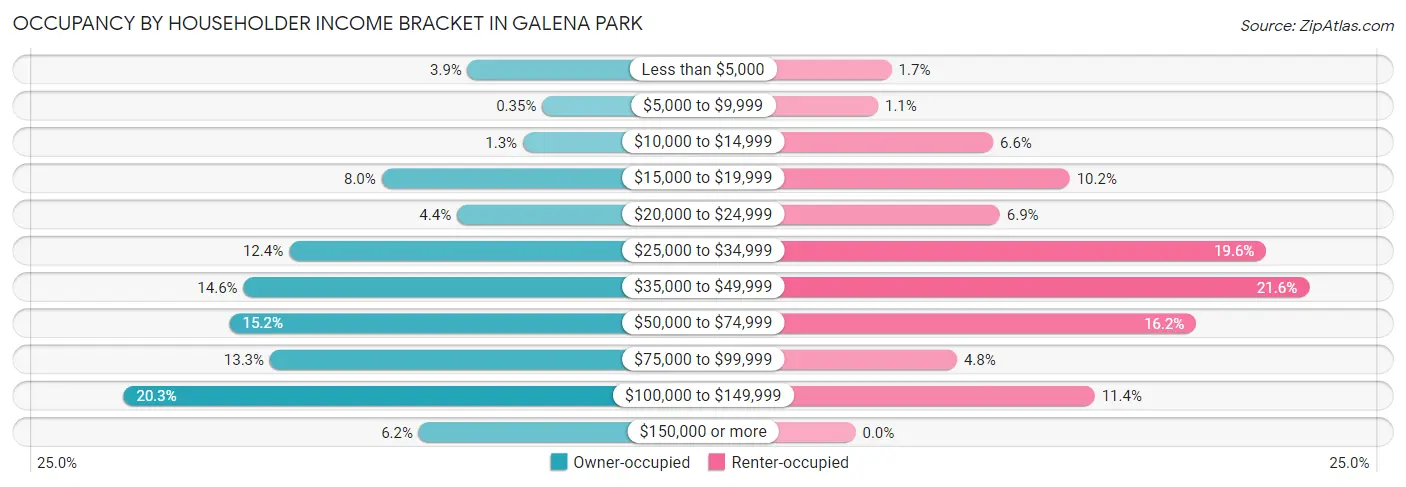
| Income Bracket | Owner-occupied | Renter-occupied |
| Less than $5,000 | 77 (3.9%) | 16 (1.7%) |
| $5,000 to $9,999 | 7 (0.4%) | 10 (1.1%) |
| $10,000 to $14,999 | 25 (1.3%) | 61 (6.6%) |
| $15,000 to $19,999 | 158 (8.0%) | 95 (10.2%) |
| $20,000 to $24,999 | 87 (4.4%) | 64 (6.9%) |
| $25,000 to $34,999 | 245 (12.4%) | 182 (19.6%) |
| $35,000 to $49,999 | 288 (14.6%) | 201 (21.6%) |
| $50,000 to $74,999 | 301 (15.2%) | 151 (16.2%) |
| $75,000 to $99,999 | 263 (13.3%) | 45 (4.8%) |
| $100,000 to $149,999 | 401 (20.3%) | 106 (11.4%) |
| $150,000 or more | 123 (6.2%) | 0 (0.0%) |
| Total | 1,975 (100.0%) | 931 (100.0%) |
Monthly Housing Cost Tiers in Galena Park
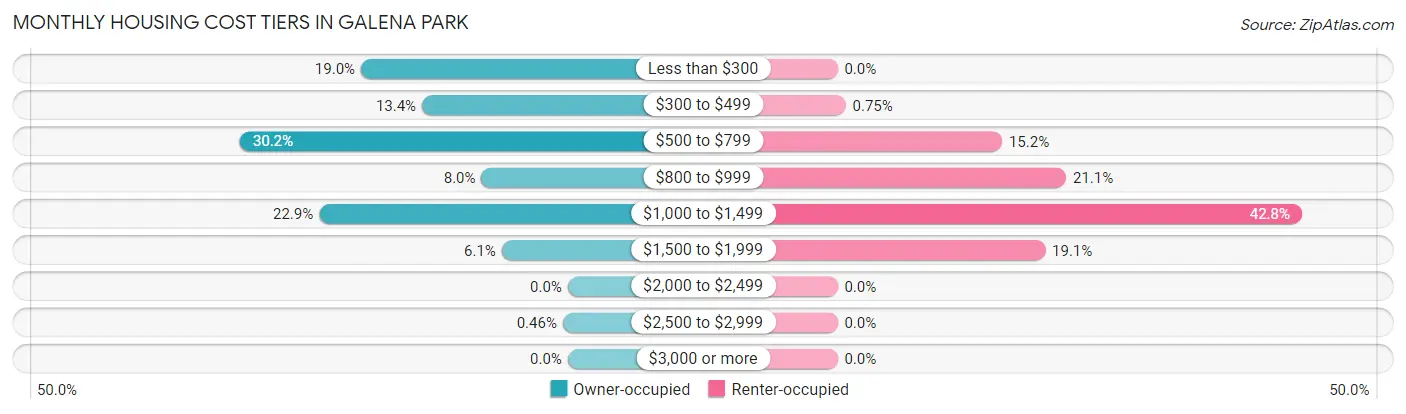
| Monthly Cost | Owner-occupied | Renter-occupied |
| Less than $300 | 376 (19.0%) | 0 (0.0%) |
| $300 to $499 | 265 (13.4%) | 7 (0.7%) |
| $500 to $799 | 596 (30.2%) | 141 (15.1%) |
| $800 to $999 | 157 (8.0%) | 196 (21.0%) |
| $1,000 to $1,499 | 452 (22.9%) | 398 (42.7%) |
| $1,500 to $1,999 | 120 (6.1%) | 178 (19.1%) |
| $2,000 to $2,499 | 0 (0.0%) | 0 (0.0%) |
| $2,500 to $2,999 | 9 (0.5%) | 0 (0.0%) |
| $3,000 or more | 0 (0.0%) | 0 (0.0%) |
| Total | 1,975 (100.0%) | 931 (100.0%) |
Physical Housing Characteristics in Galena Park
Housing Structures in Galena Park
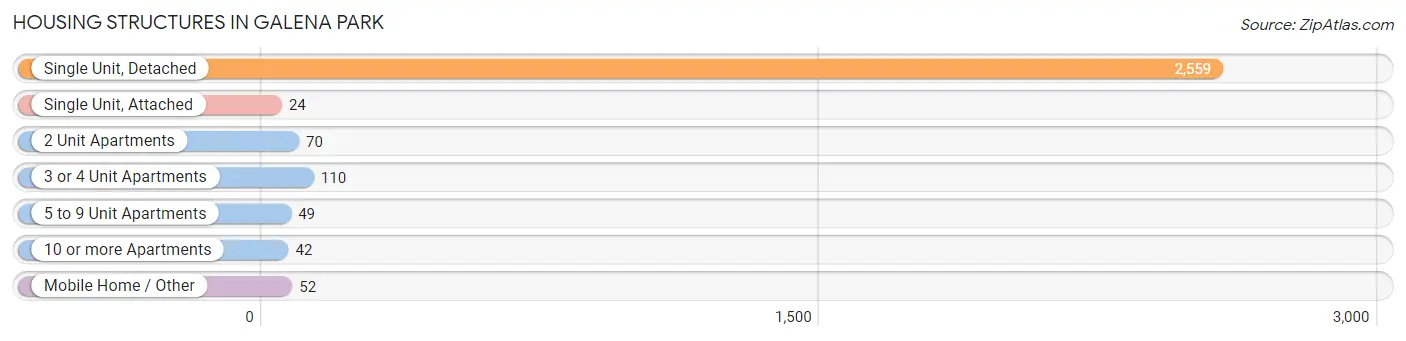
| Structure Type | # Housing Units | % Housing Units |
| Single Unit, Detached | 2,559 | 88.1% |
| Single Unit, Attached | 24 | 0.8% |
| 2 Unit Apartments | 70 | 2.4% |
| 3 or 4 Unit Apartments | 110 | 3.8% |
| 5 to 9 Unit Apartments | 49 | 1.7% |
| 10 or more Apartments | 42 | 1.5% |
| Mobile Home / Other | 52 | 1.8% |
| Total | 2,906 | 100.0% |
Housing Structures by Occupancy in Galena Park
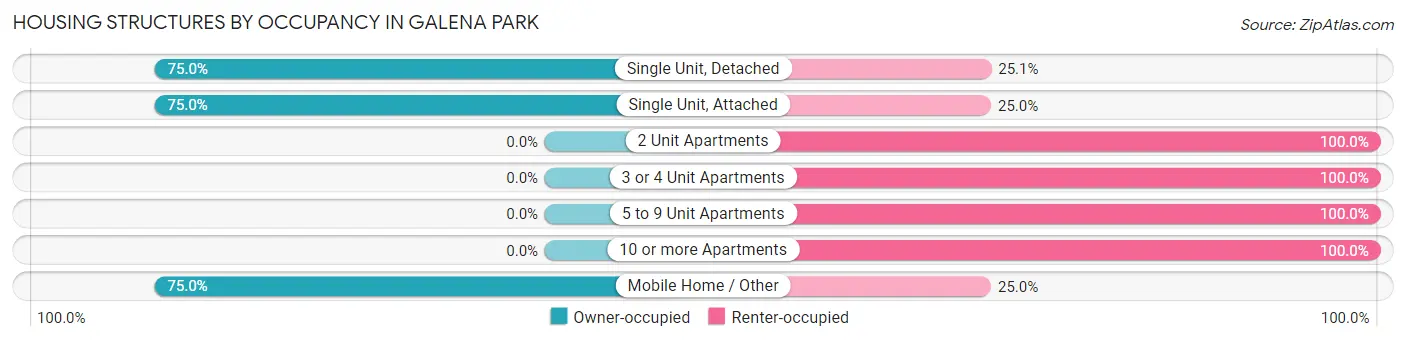
| Structure Type | Owner-occupied | Renter-occupied |
| Single Unit, Detached | 1,918 (75.0%) | 641 (25.1%) |
| Single Unit, Attached | 18 (75.0%) | 6 (25.0%) |
| 2 Unit Apartments | 0 (0.0%) | 70 (100.0%) |
| 3 or 4 Unit Apartments | 0 (0.0%) | 110 (100.0%) |
| 5 to 9 Unit Apartments | 0 (0.0%) | 49 (100.0%) |
| 10 or more Apartments | 0 (0.0%) | 42 (100.0%) |
| Mobile Home / Other | 39 (75.0%) | 13 (25.0%) |
| Total | 1,975 (68.0%) | 931 (32.0%) |
Housing Structures by Number of Rooms in Galena Park
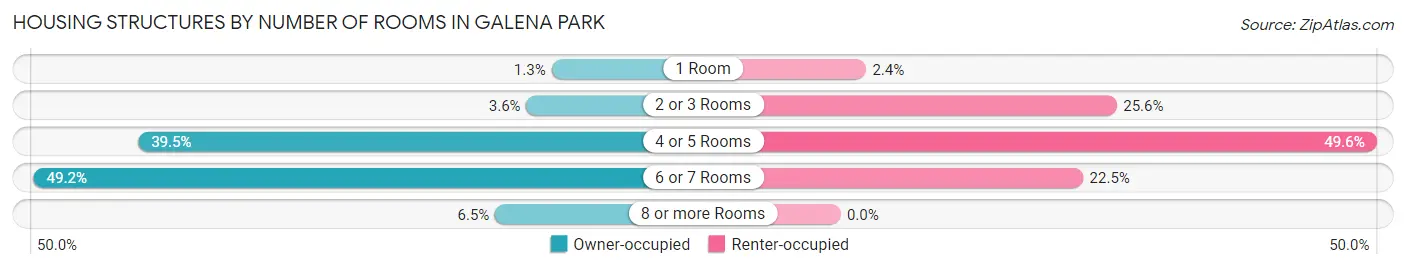
| Number of Rooms | Owner-occupied | Renter-occupied |
| 1 Room | 25 (1.3%) | 22 (2.4%) |
| 2 or 3 Rooms | 71 (3.6%) | 238 (25.6%) |
| 4 or 5 Rooms | 780 (39.5%) | 462 (49.6%) |
| 6 or 7 Rooms | 971 (49.2%) | 209 (22.5%) |
| 8 or more Rooms | 128 (6.5%) | 0 (0.0%) |
| Total | 1,975 (100.0%) | 931 (100.0%) |
Housing Structure by Heating Type in Galena Park
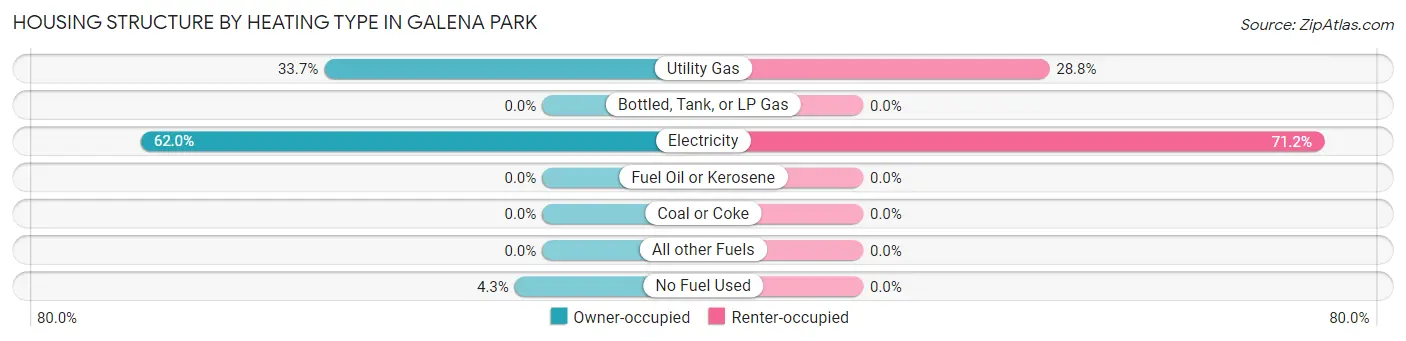
| Heating Type | Owner-occupied | Renter-occupied |
| Utility Gas | 666 (33.7%) | 268 (28.8%) |
| Bottled, Tank, or LP Gas | 0 (0.0%) | 0 (0.0%) |
| Electricity | 1,225 (62.0%) | 663 (71.2%) |
| Fuel Oil or Kerosene | 0 (0.0%) | 0 (0.0%) |
| Coal or Coke | 0 (0.0%) | 0 (0.0%) |
| All other Fuels | 0 (0.0%) | 0 (0.0%) |
| No Fuel Used | 84 (4.3%) | 0 (0.0%) |
| Total | 1,975 (100.0%) | 931 (100.0%) |
Household Vehicle Usage in Galena Park
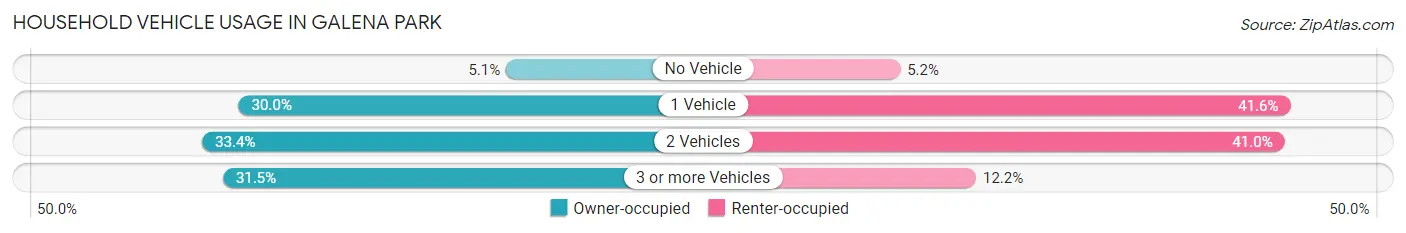
| Vehicles per Household | Owner-occupied | Renter-occupied |
| No Vehicle | 100 (5.1%) | 48 (5.2%) |
| 1 Vehicle | 593 (30.0%) | 387 (41.6%) |
| 2 Vehicles | 660 (33.4%) | 382 (41.0%) |
| 3 or more Vehicles | 622 (31.5%) | 114 (12.2%) |
| Total | 1,975 (100.0%) | 931 (100.0%) |
Real Estate & Mortgages in Galena Park
Real Estate and Mortgage Overview in Galena Park
| Characteristic | Without Mortgage | With Mortgage |
| Housing Units | 1,368 | 607 |
| Median Property Value | $95,200 | $129,500 |
| Median Household Income | $57,500 | $50 |
| Monthly Housing Costs | $514 | $0 |
| Real Estate Taxes | $1,883 | $0 |
Property Value by Mortgage Status in Galena Park
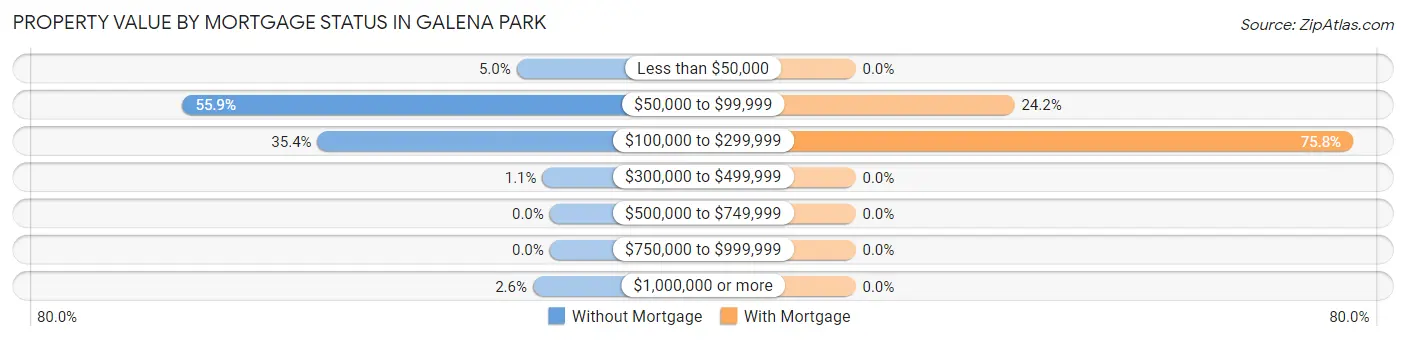
| Property Value | Without Mortgage | With Mortgage |
| Less than $50,000 | 69 (5.0%) | 0 (0.0%) |
| $50,000 to $99,999 | 765 (55.9%) | 147 (24.2%) |
| $100,000 to $299,999 | 484 (35.4%) | 460 (75.8%) |
| $300,000 to $499,999 | 15 (1.1%) | 0 (0.0%) |
| $500,000 to $749,999 | 0 (0.0%) | 0 (0.0%) |
| $750,000 to $999,999 | 0 (0.0%) | 0 (0.0%) |
| $1,000,000 or more | 35 (2.6%) | 0 (0.0%) |
| Total | 1,368 (100.0%) | 607 (100.0%) |
Household Income by Mortgage Status in Galena Park
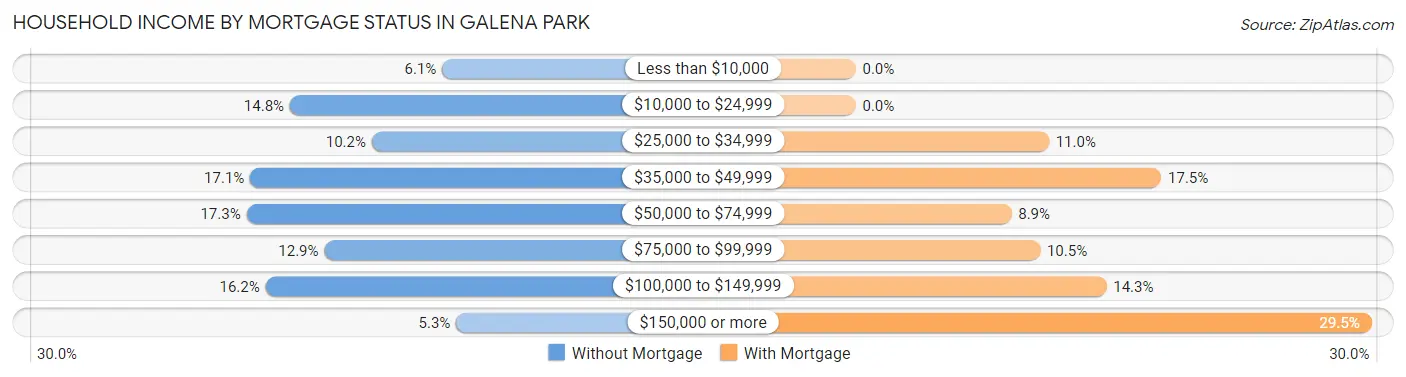
| Household Income | Without Mortgage | With Mortgage |
| Less than $10,000 | 84 (6.1%) | 0 (0.0%) |
| $10,000 to $24,999 | 203 (14.8%) | 0 (0.0%) |
| $25,000 to $34,999 | 139 (10.2%) | 67 (11.0%) |
| $35,000 to $49,999 | 234 (17.1%) | 106 (17.5%) |
| $50,000 to $74,999 | 237 (17.3%) | 54 (8.9%) |
| $75,000 to $99,999 | 176 (12.9%) | 64 (10.5%) |
| $100,000 to $149,999 | 222 (16.2%) | 87 (14.3%) |
| $150,000 or more | 73 (5.3%) | 179 (29.5%) |
| Total | 1,368 (100.0%) | 607 (100.0%) |
Property Value to Household Income Ratio in Galena Park
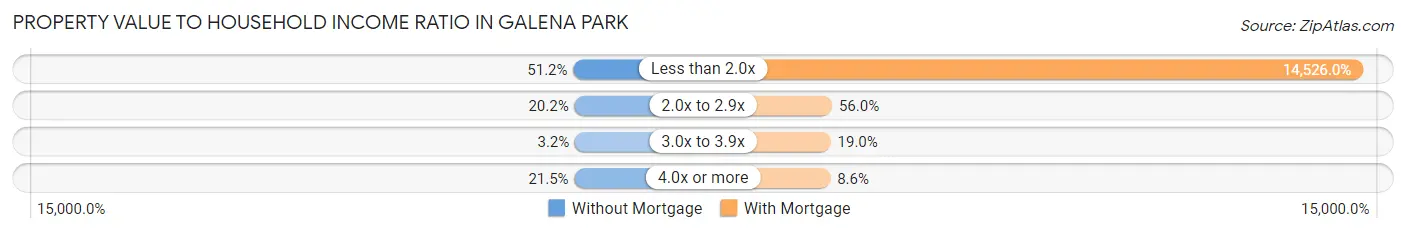
| Value-to-Income Ratio | Without Mortgage | With Mortgage |
| Less than 2.0x | 700 (51.2%) | 88,173 (14,526.0%) |
| 2.0x to 2.9x | 276 (20.2%) | 340 (56.0%) |
| 3.0x to 3.9x | 44 (3.2%) | 115 (19.0%) |
| 4.0x or more | 294 (21.5%) | 52 (8.6%) |
| Total | 1,368 (100.0%) | 607 (100.0%) |
Real Estate Taxes by Mortgage Status in Galena Park
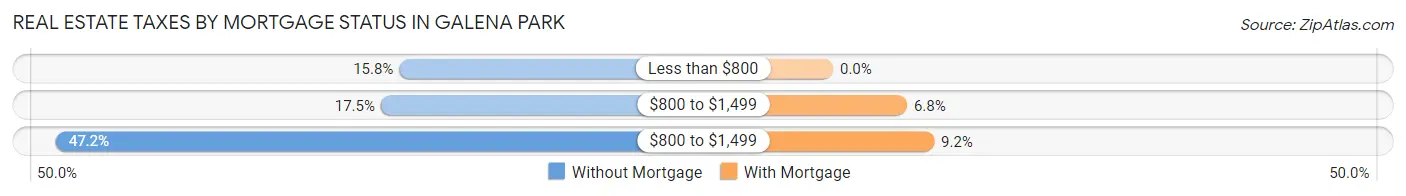
| Property Taxes | Without Mortgage | With Mortgage |
| Less than $800 | 216 (15.8%) | 0 (0.0%) |
| $800 to $1,499 | 239 (17.5%) | 41 (6.8%) |
| $800 to $1,499 | 645 (47.1%) | 56 (9.2%) |
| Total | 1,368 (100.0%) | 607 (100.0%) |
Health & Disability in Galena Park
Health Insurance Coverage by Age in Galena Park
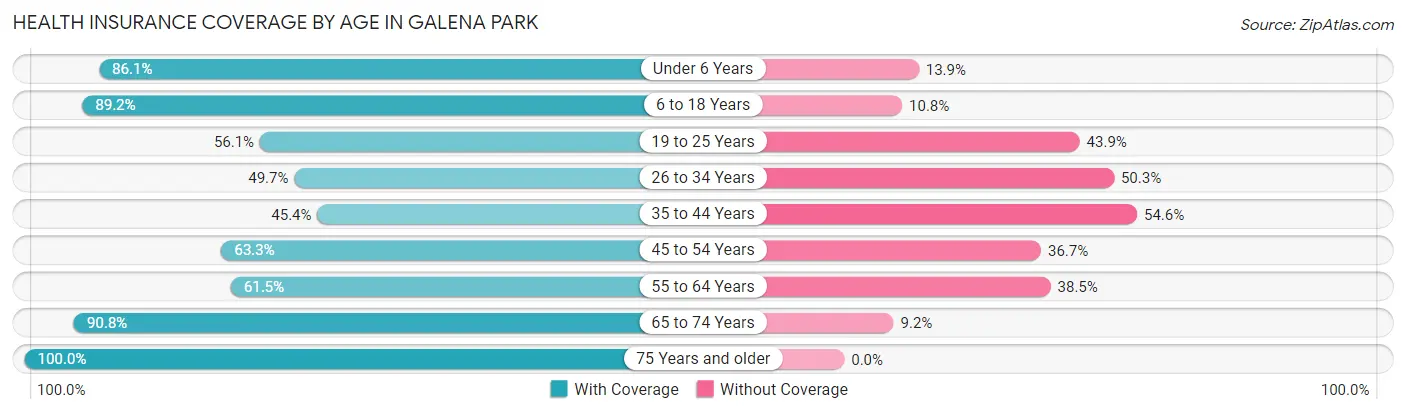
| Age Bracket | With Coverage | Without Coverage |
| Under 6 Years | 1,035 (86.1%) | 167 (13.9%) |
| 6 to 18 Years | 2,325 (89.2%) | 281 (10.8%) |
| 19 to 25 Years | 698 (56.1%) | 546 (43.9%) |
| 26 to 34 Years | 509 (49.7%) | 515 (50.3%) |
| 35 to 44 Years | 715 (45.4%) | 860 (54.6%) |
| 45 to 54 Years | 654 (63.3%) | 379 (36.7%) |
| 55 to 64 Years | 651 (61.5%) | 407 (38.5%) |
| 65 to 74 Years | 602 (90.8%) | 61 (9.2%) |
| 75 Years and older | 236 (100.0%) | 0 (0.0%) |
| Total | 7,425 (69.8%) | 3,216 (30.2%) |
Health Insurance Coverage by Citizenship Status in Galena Park
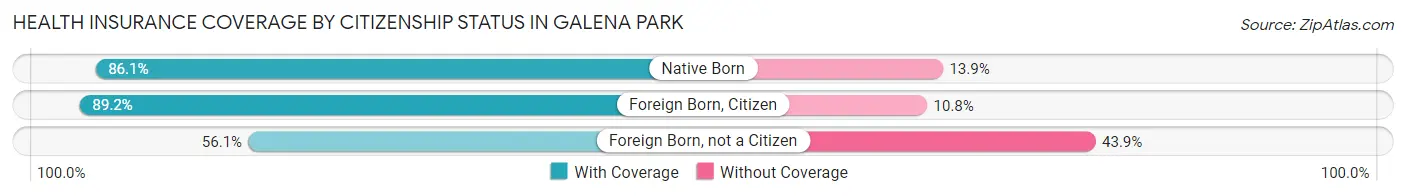
| Citizenship Status | With Coverage | Without Coverage |
| Native Born | 1,035 (86.1%) | 167 (13.9%) |
| Foreign Born, Citizen | 2,325 (89.2%) | 281 (10.8%) |
| Foreign Born, not a Citizen | 698 (56.1%) | 546 (43.9%) |
Health Insurance Coverage by Household Income in Galena Park
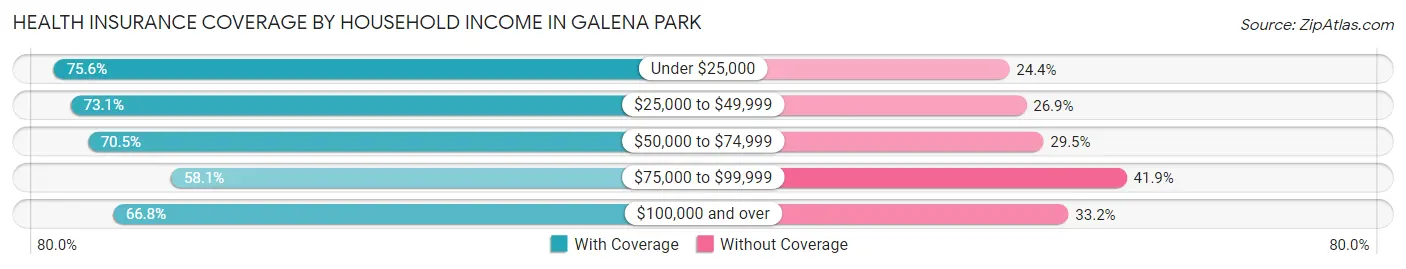
| Household Income | With Coverage | Without Coverage |
| Under $25,000 | 1,477 (75.6%) | 476 (24.4%) |
| $25,000 to $49,999 | 2,190 (73.1%) | 806 (26.9%) |
| $50,000 to $74,999 | 1,214 (70.5%) | 507 (29.5%) |
| $75,000 to $99,999 | 717 (58.1%) | 518 (41.9%) |
| $100,000 and over | 1,827 (66.8%) | 909 (33.2%) |
Public vs Private Health Insurance Coverage by Age in Galena Park
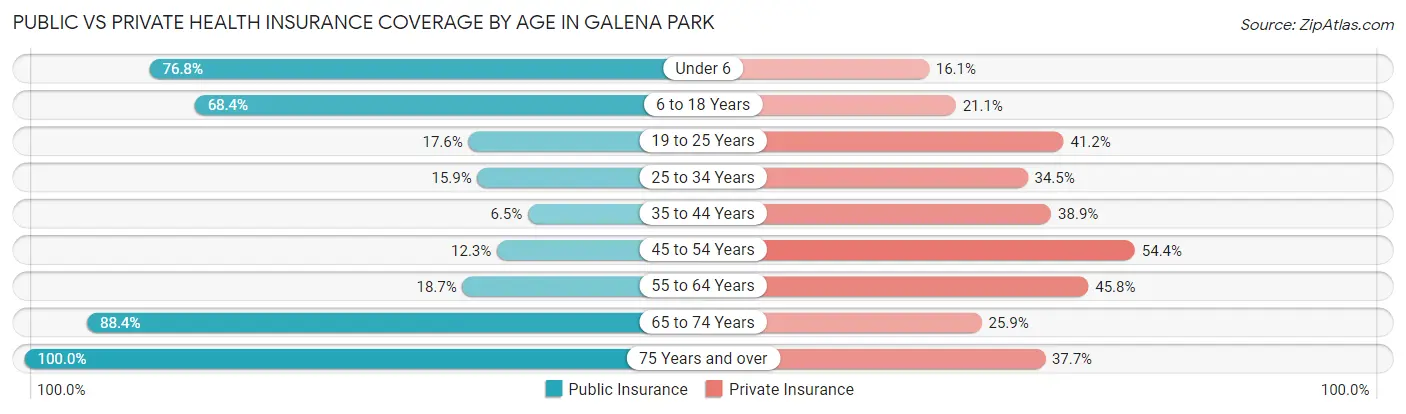
| Age Bracket | Public Insurance | Private Insurance |
| Under 6 | 923 (76.8%) | 194 (16.1%) |
| 6 to 18 Years | 1,783 (68.4%) | 551 (21.1%) |
| 19 to 25 Years | 219 (17.6%) | 512 (41.2%) |
| 25 to 34 Years | 163 (15.9%) | 353 (34.5%) |
| 35 to 44 Years | 103 (6.5%) | 612 (38.9%) |
| 45 to 54 Years | 127 (12.3%) | 562 (54.4%) |
| 55 to 64 Years | 198 (18.7%) | 484 (45.8%) |
| 65 to 74 Years | 586 (88.4%) | 172 (25.9%) |
| 75 Years and over | 236 (100.0%) | 89 (37.7%) |
| Total | 4,338 (40.8%) | 3,529 (33.2%) |
Disability Status by Sex by Age in Galena Park
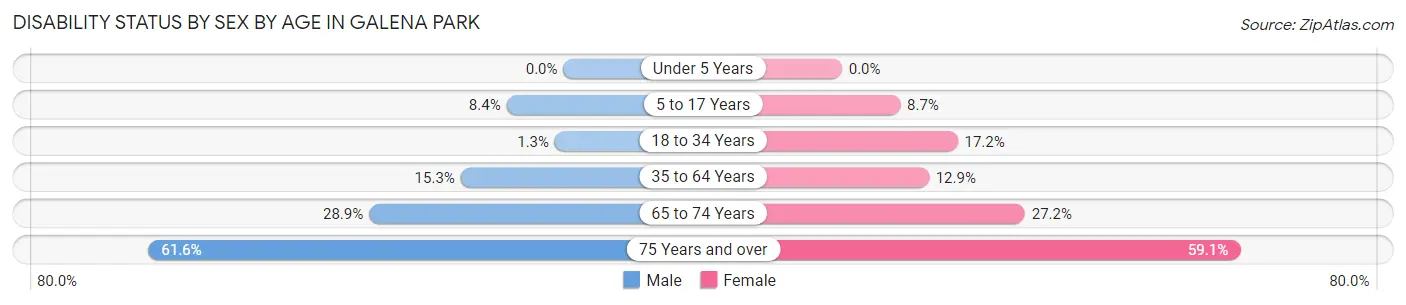
| Age Bracket | Male | Female |
| Under 5 Years | 0 (0.0%) | 0 (0.0%) |
| 5 to 17 Years | 128 (8.4%) | 105 (8.7%) |
| 18 to 34 Years | 15 (1.3%) | 207 (17.2%) |
| 35 to 64 Years | 285 (15.2%) | 232 (12.9%) |
| 65 to 74 Years | 118 (28.8%) | 69 (27.2%) |
| 75 Years and over | 61 (61.6%) | 81 (59.1%) |
Disability Class by Sex by Age in Galena Park
Disability Class: Hearing Difficulty
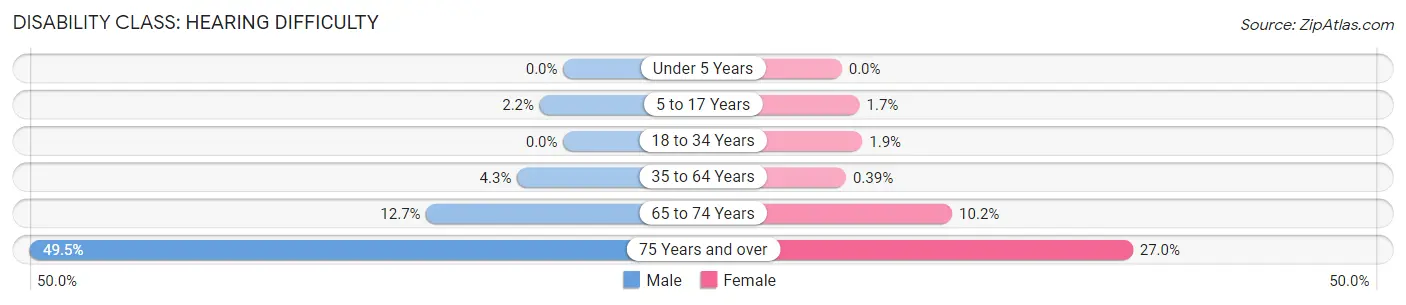
| Age Bracket | Male | Female |
| Under 5 Years | 0 (0.0%) | 0 (0.0%) |
| 5 to 17 Years | 33 (2.2%) | 20 (1.7%) |
| 18 to 34 Years | 0 (0.0%) | 23 (1.9%) |
| 35 to 64 Years | 80 (4.3%) | 7 (0.4%) |
| 65 to 74 Years | 52 (12.7%) | 26 (10.2%) |
| 75 Years and over | 49 (49.5%) | 37 (27.0%) |
Disability Class: Vision Difficulty
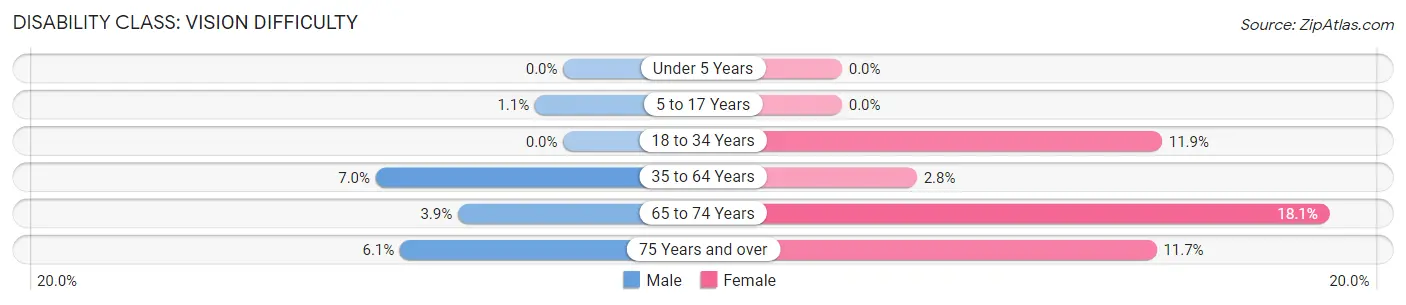
| Age Bracket | Male | Female |
| Under 5 Years | 0 (0.0%) | 0 (0.0%) |
| 5 to 17 Years | 16 (1.1%) | 0 (0.0%) |
| 18 to 34 Years | 0 (0.0%) | 143 (11.9%) |
| 35 to 64 Years | 130 (7.0%) | 50 (2.8%) |
| 65 to 74 Years | 16 (3.9%) | 46 (18.1%) |
| 75 Years and over | 6 (6.1%) | 16 (11.7%) |
Disability Class: Cognitive Difficulty
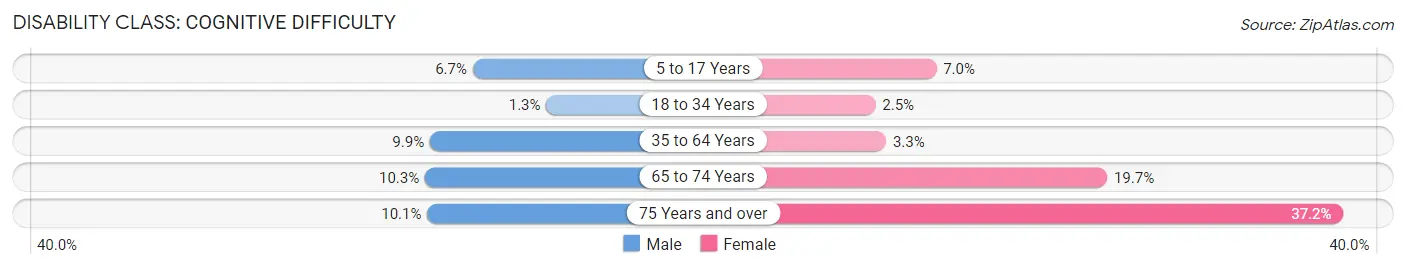
| Age Bracket | Male | Female |
| 5 to 17 Years | 102 (6.7%) | 85 (7.0%) |
| 18 to 34 Years | 15 (1.3%) | 30 (2.5%) |
| 35 to 64 Years | 185 (9.9%) | 59 (3.3%) |
| 65 to 74 Years | 42 (10.3%) | 50 (19.7%) |
| 75 Years and over | 10 (10.1%) | 51 (37.2%) |
Disability Class: Ambulatory Difficulty
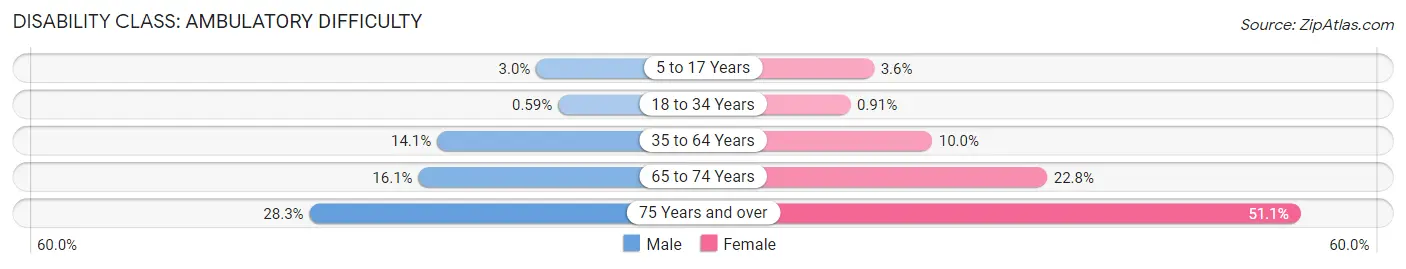
| Age Bracket | Male | Female |
| 5 to 17 Years | 46 (3.0%) | 43 (3.5%) |
| 18 to 34 Years | 7 (0.6%) | 11 (0.9%) |
| 35 to 64 Years | 263 (14.1%) | 180 (10.0%) |
| 65 to 74 Years | 66 (16.1%) | 58 (22.8%) |
| 75 Years and over | 28 (28.3%) | 70 (51.1%) |
Disability Class: Self-Care Difficulty
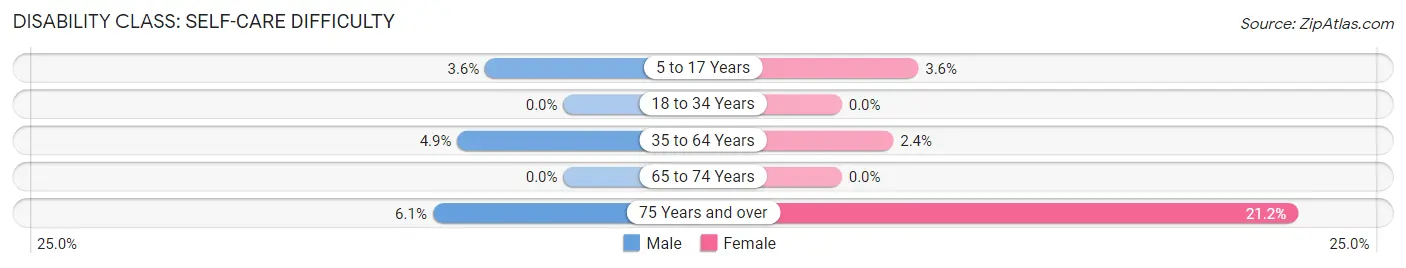
| Age Bracket | Male | Female |
| 5 to 17 Years | 55 (3.6%) | 43 (3.5%) |
| 18 to 34 Years | 0 (0.0%) | 0 (0.0%) |
| 35 to 64 Years | 92 (4.9%) | 43 (2.4%) |
| 65 to 74 Years | 0 (0.0%) | 0 (0.0%) |
| 75 Years and over | 6 (6.1%) | 29 (21.2%) |
Technology Access in Galena Park
Computing Device Access in Galena Park
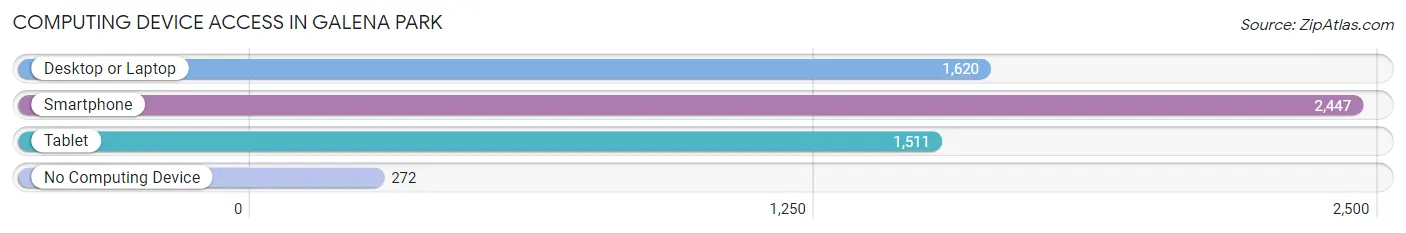
| Device Type | # Households | % Households |
| Desktop or Laptop | 1,620 | 55.7% |
| Smartphone | 2,447 | 84.2% |
| Tablet | 1,511 | 52.0% |
| No Computing Device | 272 | 9.4% |
| Total | 2,906 | 100.0% |
Internet Access in Galena Park
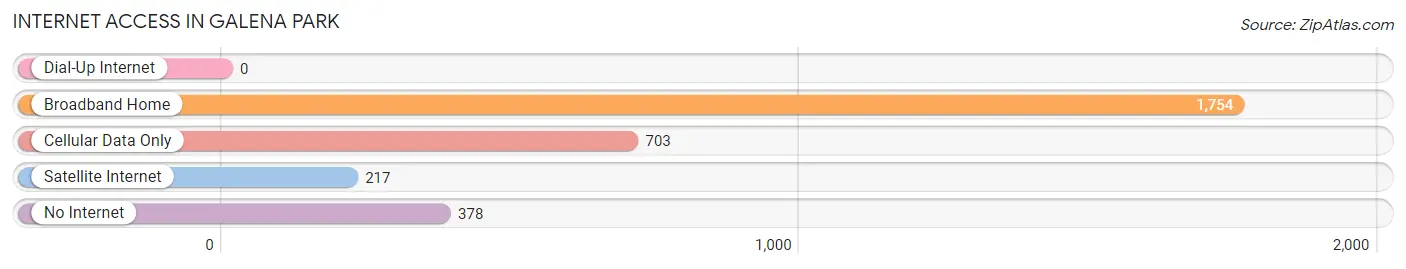
| Internet Type | # Households | % Households |
| Dial-Up Internet | 0 | 0.0% |
| Broadband Home | 1,754 | 60.4% |
| Cellular Data Only | 703 | 24.2% |
| Satellite Internet | 217 | 7.5% |
| No Internet | 378 | 13.0% |
| Total | 2,906 | 100.0% |
Galena Park Summary
Galena Park is a city located in Harris County, Texas, United States. It is part of the Houston–The Woodlands–Sugar Land metropolitan area. The population was 10,887 at the 2010 census.
History
Galena Park was founded in the late 19th century by the Galena Signal Oil Company. The company was named after the nearby Galena Creek, which was named after the lead ore, galena, found in the creek. The company built a refinery and a railroad station in the area, and the town grew up around them. The town was officially incorporated in 1935.
Geography
Galena Park is located at 29°44'25" North, 95°14'45" West (29.740278, -95.245833). It is bordered by the cities of Houston and Jacinto City to the north, Sheldon to the east, Channelview to the south, and the Houston Ship Channel to the west.
According to the United States Census Bureau, the city has a total area of 4.2 square miles (10.8 km2), all of it land.
Economy
Galena Park is home to several major industrial and manufacturing companies, including Valero Energy Corporation, LyondellBasell, and Dow Chemical. The city is also home to the Port of Houston, the largest port in the United States in terms of foreign tonnage.
Demographics
As of the census of 2010, there were 10,887 people, 3,541 households, and 2,717 families residing in the city. The population density was 2,611.2 people per square mile (1,006.2/km2). There were 3,945 housing units at an average density of 945.2 per square mile (364.7/km2). The racial makeup of the city was 63.2% White, 16.2% African American, 0.7% Native American, 0.7% Asian, 0.1% Pacific Islander, 16.2% from other races, and 2.9% from two or more races. Hispanic or Latino of any race were 68.2% of the population.
There were 3,541 households, out of which 41.2% had children under the age of 18 living with them, 44.2% were married couples living together, 20.2% had a female householder with no husband present, and 28.2% were non-families. 22.7% of all households were made up of individuals, and 8.2% had someone living alone who was 65 years of age or older. The average household size was 3.06 and the average family size was 3.58.
In the city, the population was spread out, with 32.2% under the age of 18, 11.2% from 18 to 24, 28.2% from 25 to 44, 19.2% from 45 to 64, and 9.2% who were 65 years of age or older. The median age was 30 years. For every 100 females, there were 97.2 males. For every 100 females age 18 and over, there were 93.2 males.
The median income for a household in the city was $30,917, and the median income for a family was $33,917. Males had a median income of $27,917 versus $20,917 for females. The per capita income for the city was $12,917. About 18.2% of families and 20.2% of the population were below the poverty line, including 25.2% of those under age 18 and 16.2% of those age 65 or over.
Common Questions
What is Per Capita Income in Galena Park?
Per Capita income in Galena Park is $18,071.
What is the Median Family Income in Galena Park?
Median Family Income in Galena Park is $51,105.
What is the Median Household income in Galena Park?
Median Household Income in Galena Park is $45,614.
What is Income or Wage Gap in Galena Park?
Income or Wage Gap in Galena Park is 40.9%.
Women in Galena Park earn 59.1 cents for every dollar earned by a man.
What is Family Income Deficit in Galena Park?
Family Income Deficit in Galena Park is $14,389.
Families that are below poverty line in Galena Park earn $14,389 less on average than the poverty threshold level.
What is Inequality or Gini Index in Galena Park?
Inequality or Gini Index in Galena Park is 0.40.
What is the Total Population of Galena Park?
Total Population of Galena Park is 10,641.
What is the Total Male Population of Galena Park?
Total Male Population of Galena Park is 5,527.
What is the Total Female Population of Galena Park?
Total Female Population of Galena Park is 5,114.
What is the Ratio of Males per 100 Females in Galena Park?
There are 108.08 Males per 100 Females in Galena Park.
What is the Ratio of Females per 100 Males in Galena Park?
There are 92.53 Females per 100 Males in Galena Park.
What is the Median Population Age in Galena Park?
Median Population Age in Galena Park is 28.0 Years.
What is the Average Family Size in Galena Park
Average Family Size in Galena Park is 4.0 People.
What is the Average Household Size in Galena Park
Average Household Size in Galena Park is 3.7 People.
How Large is the Labor Force in Galena Park?
There are 4,389 People in the Labor Forcein in Galena Park.
What is the Percentage of People in the Labor Force in Galena Park?
59.9% of People are in the Labor Force in Galena Park.
What is the Unemployment Rate in Galena Park?
Unemployment Rate in Galena Park is 14.3%.