Zip Codes with the Highest Percentage of Population with a Degree in Computers and Mathematics in Austin, TX

RELATED REPORTS & OPTIONS

Computers and Mathematics
Population
Families and Households
Female Fertility
Female Fertility (Unmarried)
Race (Community Size)
Race (Percentage)
Ancestry (Community Size)
AfghanAfricanAlbanianAlsatianAmericanApacheArabArgentineanArmenianAssyrian / Chaldean / SyriacAustralianAustrianBahamianBangladeshiBarbadianBasqueBelgianBelizeanBhutaneseBlackfeetBolivianBrazilianBritishBritish West IndianBulgarianBurmeseCajunCambodianCanadianCape VerdeanCelticCentral AmericanCentral American IndianCherokeeCheyenneChickasawChileanChippewaChoctawColombianComancheCosta RicanCreeCreekCroatianCrowCubanCzechCzechoslovakianDanishDelawareDominicanDutchDutch West IndianEastern EuropeanEcuadorianEgyptianEnglishEstonianEthiopianEuropeanFilipinoFinnishFrenchFrench American IndianFrench CanadianGermanGerman RussianGhanaianGreekGuamanian / ChamorroGuatemalanGuyaneseHaitianHonduranHopiHungarianIcelanderIndian (Asian)IndonesianIranianIraqiIrishIroquoisIsraeliItalianJamaicanJapaneseJordanianKenyanKiowaKoreanLaotianLatvianLebaneseLiberianLithuanianLumbeeLuxembourgerMacedonianMalaysianMalteseMexicanMexican American IndianMongolianMoroccanNative HawaiianNavajoNew ZealanderNicaraguanNigerianNorthern EuropeanNorwegianOkinawanOsagePakistaniPalestinianPanamanianParaguayanPennsylvania GermanPeruvianPolishPortuguesePotawatomiPuebloPuerto RicanRomanianRussianSalvadoranSamoanScandinavianScotch-IrishScottishSeminoleSerbianSiouxSlavicSlovakSloveneSomaliSouth AfricanSouth AmericanSouth American IndianSpaniardSpanishSpanish AmericanSpanish American IndianSri LankanSubsaharan AfricanSudaneseSwedishSwissSyrianThaiTlingit-HaidaTonganTrinidadian and TobagonianTurkishUkrainianUruguayanVenezuelanVietnameseWelshWest IndianYaquiYugoslavian
Ancestry (Percentage)
AfghanAfricanAlbanianAlsatianAmericanApacheArabArgentineanArmenianAssyrian / Chaldean / SyriacAustralianAustrianBahamianBangladeshiBarbadianBasqueBelgianBelizeanBhutaneseBlackfeetBolivianBrazilianBritishBritish West IndianBulgarianBurmeseCajunCambodianCanadianCape VerdeanCelticCentral AmericanCentral American IndianCherokeeCheyenneChickasawChileanChippewaChoctawColombianComancheCosta RicanCreeCreekCroatianCrowCubanCzechCzechoslovakianDanishDelawareDominicanDutchDutch West IndianEastern EuropeanEcuadorianEgyptianEnglishEstonianEthiopianEuropeanFilipinoFinnishFrenchFrench American IndianFrench CanadianGermanGerman RussianGhanaianGreekGuamanian / ChamorroGuatemalanGuyaneseHaitianHonduranHopiHungarianIcelanderIndian (Asian)IndonesianIranianIraqiIrishIroquoisIsraeliItalianJamaicanJapaneseJordanianKenyanKiowaKoreanLaotianLatvianLebaneseLiberianLithuanianLumbeeLuxembourgerMacedonianMalaysianMalteseMexicanMexican American IndianMongolianMoroccanNative HawaiianNavajoNew ZealanderNicaraguanNigerianNorthern EuropeanNorwegianOkinawanOsagePakistaniPalestinianPanamanianParaguayanPennsylvania GermanPeruvianPolishPortuguesePotawatomiPuebloPuerto RicanRomanianRussianSalvadoranSamoanScandinavianScotch-IrishScottishSeminoleSerbianSiouxSlavicSlovakSloveneSomaliSouth AfricanSouth AmericanSouth American IndianSpaniardSpanishSpanish AmericanSpanish American IndianSri LankanSubsaharan AfricanSudaneseSwedishSwissSyrianThaiTlingit-HaidaTonganTrinidadian and TobagonianTurkishUkrainianUruguayanVenezuelanVietnameseWelshWest IndianYaquiYugoslavian
Immigrant Origin (Total)
AfghanistanAfricaAlbaniaArgentinaAsiaAustraliaAustriaBahamasBangladeshBarbadosBelarusBelgiumBelizeBoliviaBosnia and HerzegovinaBrazilBulgariaBurma / MyanmarCambodiaCameroonCanadaCaribbeanCentral AmericaChileChinaColombiaCongoCosta RicaCroatiaCubaCzechoslovakiaDenmarkDominicaDominican RepublicEastern AfricaEastern AsiaEastern EuropeEcuadorEgyptEl SalvadorEnglandEritreaEthiopiaEuropeFranceGermanyGhanaGreeceGuatemalaGuyanaHaitiHondurasHong KongHungaryIndiaIndonesiaIranIraqIrelandIsraelItalyJamaicaJapanJordanKazakhstanKenyaKoreaKuwaitLaosLatin AmericaLatviaLebanonLiberiaLithuaniaMalaysiaMexicoMiddle AfricaMoldovaMoroccoNepalNetherlandsNicaraguaNigeriaNorthern AfricaNorthern EuropeNorwayOceaniaPakistanPanamaPeruPhilippinesPolandPortugalRomaniaRussiaSaudi ArabiaScotlandSerbiaSierra LeoneSingaporeSouth AfricaSouth AmericaSouth Central AsiaSouth Eastern AsiaSouthern EuropeSpainSri LankaSudanSwedenSwitzerlandSyriaTaiwanThailandTrinidad and TobagoTurkeyUgandaUkraineUruguayUzbekistanVenezuelaVietnamWestern AfricaWestern AsiaWestern EuropeYemenZaireZimbabwe
Immigrant Origin (Percentage)
AfghanistanAfricaAlbaniaArgentinaAsiaAustraliaAustriaBahamasBangladeshBarbadosBelarusBelgiumBelizeBoliviaBosnia and HerzegovinaBrazilBulgariaBurma / MyanmarCambodiaCameroonCanadaCaribbeanCentral AmericaChileChinaColombiaCongoCosta RicaCroatiaCubaCzechoslovakiaDenmarkDominicaDominican RepublicEastern AfricaEastern AsiaEastern EuropeEcuadorEgyptEl SalvadorEnglandEritreaEthiopiaEuropeFranceGermanyGhanaGreeceGuatemalaGuyanaHaitiHondurasHong KongHungaryIndiaIndonesiaIranIraqIrelandIsraelItalyJamaicaJapanJordanKazakhstanKenyaKoreaKuwaitLaosLatin AmericaLatviaLebanonLiberiaLithuaniaMalaysiaMexicoMiddle AfricaMoldovaMoroccoNepalNetherlandsNicaraguaNigeriaNorthern AfricaNorthern EuropeNorwayOceaniaPakistanPanamaPeruPhilippinesPolandPortugalRomaniaRussiaSaudi ArabiaScotlandSerbiaSierra LeoneSingaporeSouth AfricaSouth AmericaSouth Central AsiaSouth Eastern AsiaSouthern EuropeSpainSri LankaSudanSwedenSwitzerlandSyriaTaiwanThailandTrinidad and TobagoTurkeyUgandaUkraineUruguayUzbekistanVenezuelaVietnamWestern AfricaWestern AsiaWestern EuropeYemenZaireZimbabwe
Income
Income (Families)
Income (Households)
Poverty
Poverty (Families)
Unemployment
Employment Occupations
Employment Industries
Employer Class
Commute Time
Commute Means
School Enrollment
Education by Degree Field
Occupancy
Finances
Physical Characteristics
Austin
Compare Zip Codes
Comparison Subject

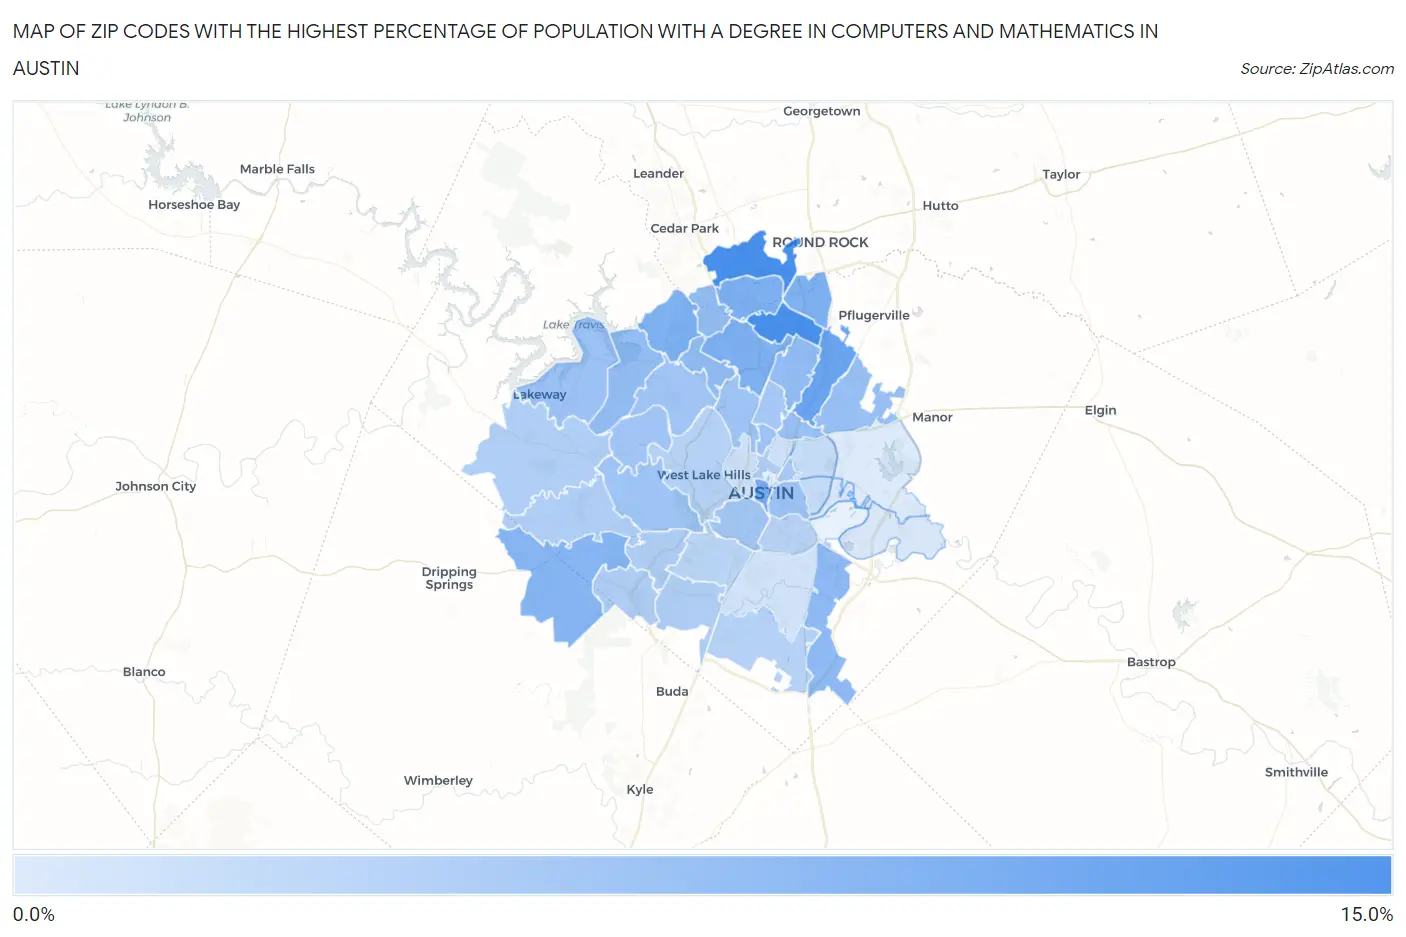
Map of Zip Codes with the Highest Percentage of Population with a Degree in Computers and Mathematics in Austin

0.0%
15.0%
Zip Codes with the Highest Percentage of Population with a Degree in Computers and Mathematics in Austin Map

Zip Codes with the Highest Percentage of Population with a Degree in Computers and Mathematics in Austin, TX

Zip Code % Graduates vs State vs National
1.7872713.0%5.2%(+7.80)#674.9%(+8.08)#1,060
2.7871712.9%5.2%(+7.75)#684.9%(+8.03)#1,065
3.7875310.3%5.2%(+5.17)#1054.9%(+5.45)#1,628
4.787019.4%5.2%(+4.21)#1304.9%(+4.50)#2,018
5.787298.9%5.2%(+3.74)#1504.9%(+4.02)#2,306
6.787288.8%5.2%(+3.67)#1534.9%(+3.95)#2,337
7.787598.8%5.2%(+3.58)#1574.9%(+3.86)#2,394
8.787268.7%5.2%(+3.51)#1614.9%(+3.79)#2,431
9.787378.2%5.2%(+3.05)#1804.9%(+3.33)#2,729
10.787197.5%5.2%(+2.32)#2244.9%(+2.61)#3,341
11.787587.3%5.2%(+2.17)#2344.9%(+2.46)#3,475
12.787327.2%5.2%(+2.05)#2404.9%(+2.33)#3,595
13.787507.2%5.2%(+1.98)#2454.9%(+2.27)#3,670
14.787546.9%5.2%(+1.70)#2674.9%(+1.98)#3,966
15.787526.8%5.2%(+1.64)#2734.9%(+1.93)#4,036
16.787566.8%5.2%(+1.60)#2814.9%(+1.88)#4,110
17.787026.8%5.2%(+1.58)#2854.9%(+1.86)#4,135
18.787346.6%5.2%(+1.40)#3014.9%(+1.68)#4,359
19.787356.4%5.2%(+1.21)#3234.9%(+1.50)#4,620
20.787316.3%5.2%(+1.14)#3344.9%(+1.43)#4,734
21.787306.2%5.2%(+1.02)#3454.9%(+1.31)#4,945
22.787336.2%5.2%(+0.991)#3474.9%(+1.28)#4,994
23.787046.0%5.2%(+0.849)#3644.9%(+1.13)#5,258
24.787575.9%5.2%(+0.728)#3774.9%(+1.01)#5,468
25.787225.9%5.2%(+0.716)#3804.9%(+1.00)#5,500
26.787055.3%5.2%(+0.106)#4684.9%(+0.391)#6,797
27.787495.3%5.2%(+0.076)#4724.9%(+0.360)#6,873
28.787365.2%5.2%(+0.044)#4774.9%(+0.328)#6,944
29.787485.2%5.2%(-0.008)#4824.9%(+0.276)#7,042
30.787395.1%5.2%(-0.055)#4874.9%(+0.229)#7,159
31.787385.1%5.2%(-0.124)#4964.9%(+0.160)#7,323
32.787464.8%5.2%(-0.390)#5394.9%(-0.106)#8,021
33.787474.7%5.2%(-0.477)#5604.9%(-0.193)#8,268
34.787414.6%5.2%(-0.615)#5844.9%(-0.331)#8,668
35.787454.4%5.2%(-0.824)#6284.9%(-0.540)#9,335
36.787233.6%5.2%(-1.61)#7764.9%(-1.33)#12,042
37.787213.5%5.2%(-1.69)#7934.9%(-1.40)#12,328
38.787513.0%5.2%(-2.14)#8804.9%(-1.85)#13,936
39.787032.9%5.2%(-2.25)#9014.9%(-1.97)#14,343
40.787442.8%5.2%(-2.39)#9274.9%(-2.10)#14,823
41.787252.2%5.2%(-2.95)#1,0454.9%(-2.66)#16,843
42.787241.9%5.2%(-3.25)#1,1064.9%(-2.97)#17,857

Common Questions

What are the Top 10 Zip Codes with the Highest Percentage of Population with a Degree in Computers and Mathematics in Austin, TX?
Top 10 Zip Codes with the Highest Percentage of Population with a Degree in Computers and Mathematics in Austin, TX are:
#1
13.0%
#2
12.9%
#3
10.3%
#4
9.4%
#5
8.9%
#6
8.8%
#7
8.8%
#8
8.7%
#9
8.2%
#10
7.5%
What zip code has the Highest Percentage of Population with a Degree in Computers and Mathematics in Austin, TX?
78727 has the Highest Percentage of Population with a Degree in Computers and Mathematics in Austin, TX with 13.0%.
What is the Percentage of Population with a Degree in Computers and Mathematics in Austin, TX?
Percentage of Population with a Degree in Computers and Mathematics in Austin is 6.6%.
What is the Percentage of Population with a Degree in Computers and Mathematics in Texas?
Percentage of Population with a Degree in Computers and Mathematics in Texas is 5.2%.
What is the Percentage of Population with a Degree in Computers and Mathematics in the United States?
Percentage of Population with a Degree in Computers and Mathematics in the United States is 4.9%.