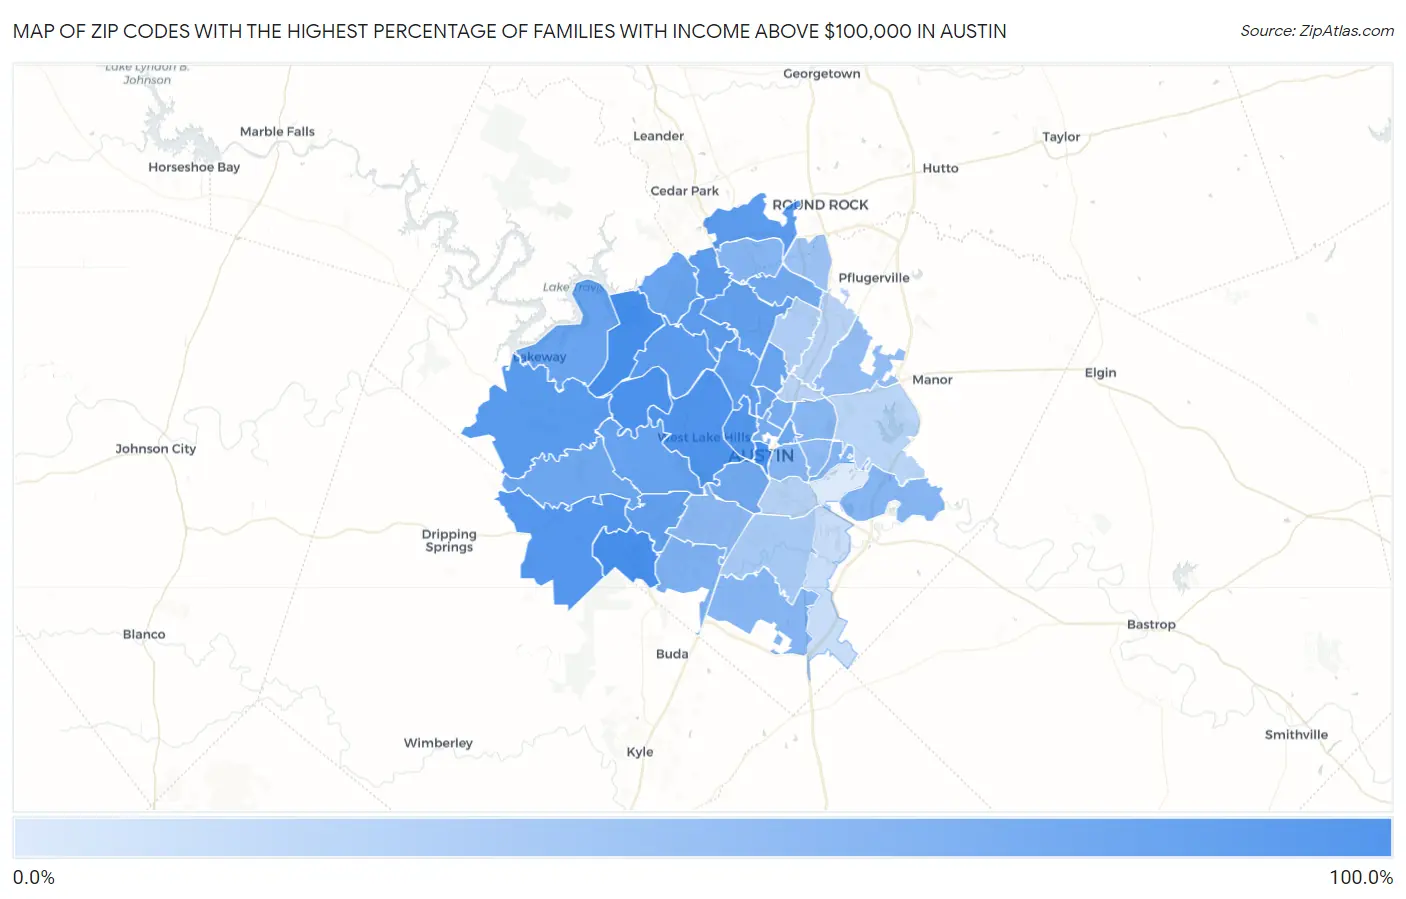
Zip Codes with the Highest Percentage of Families with Income Above $100,000 in Austin, TX
RELATED REPORTS & OPTIONS
Family Income | $100k+
Austin
Compare Zip Codes
Map of Zip Codes with the Highest Percentage of Families with Income Above $100,000 in Austin
13.8%
88.1%
Zip Codes with the Highest Percentage of Families with Income Above $100,000 in Austin, TX
| Zip Code | Families with Income > $100k | vs State | vs National | |
| 1. | 78732 | 88.1% | 43.7%(+44.4)#27 | 46.1%(+42.0)#421 |
| 2. | 78739 | 87.4% | 43.7%(+43.7)#30 | 46.1%(+41.3)#458 |
| 3. | 78701 | 86.5% | 43.7%(+42.8)#33 | 46.1%(+40.4)#502 |
| 4. | 78733 | 84.9% | 43.7%(+41.2)#37 | 46.1%(+38.8)#598 |
| 5. | 78746 | 81.9% | 43.7%(+38.2)#43 | 46.1%(+35.8)#811 |
| 6. | 78703 | 80.5% | 43.7%(+36.8)#50 | 46.1%(+34.4)#975 |
| 7. | 78737 | 79.1% | 43.7%(+35.4)#57 | 46.1%(+33.0)#1,127 |
| 8. | 78738 | 77.8% | 43.7%(+34.1)#62 | 46.1%(+31.7)#1,283 |
| 9. | 78717 | 75.6% | 43.7%(+31.9)#78 | 46.1%(+29.5)#1,611 |
| 10. | 78730 | 74.8% | 43.7%(+31.1)#84 | 46.1%(+28.7)#1,740 |
| 11. | 78750 | 74.4% | 43.7%(+30.7)#86 | 46.1%(+28.3)#1,796 |
| 12. | 78731 | 72.3% | 43.7%(+28.6)#105 | 46.1%(+26.2)#2,170 |
| 13. | 78759 | 71.1% | 43.7%(+27.4)#113 | 46.1%(+25.0)#2,379 |
| 14. | 78749 | 71.1% | 43.7%(+27.4)#114 | 46.1%(+25.0)#2,380 |
| 15. | 78735 | 70.0% | 43.7%(+26.3)#124 | 46.1%(+23.9)#2,597 |
| 16. | 78757 | 69.2% | 43.7%(+25.5)#136 | 46.1%(+23.1)#2,774 |
| 17. | 78726 | 68.2% | 43.7%(+24.5)#142 | 46.1%(+22.1)#2,976 |
| 18. | 78734 | 68.0% | 43.7%(+24.3)#145 | 46.1%(+21.9)#3,014 |
| 19. | 78756 | 67.5% | 43.7%(+23.8)#153 | 46.1%(+21.4)#3,147 |
| 20. | 78722 | 66.7% | 43.7%(+23.0)#163 | 46.1%(+20.6)#3,303 |
| 21. | 78736 | 64.3% | 43.7%(+20.6)#189 | 46.1%(+18.2)#3,924 |
| 22. | 78727 | 62.9% | 43.7%(+19.2)#209 | 46.1%(+16.8)#4,300 |
| 23. | 78704 | 62.3% | 43.7%(+18.6)#218 | 46.1%(+16.2)#4,461 |
| 24. | 78751 | 59.7% | 43.7%(+16.0)#260 | 46.1%(+13.6)#5,227 |
| 25. | 78705 | 58.8% | 43.7%(+15.1)#275 | 46.1%(+12.7)#5,508 |
| 26. | 78748 | 56.3% | 43.7%(+12.6)#305 | 46.1%(+10.2)#6,304 |
| 27. | 78729 | 52.9% | 43.7%(+9.20)#370 | 46.1%(+6.80)#7,580 |
| 28. | 78725 | 52.4% | 43.7%(+8.70)#383 | 46.1%(+6.30)#7,804 |
| 29. | 78747 | 52.2% | 43.7%(+8.50)#390 | 46.1%(+6.10)#7,885 |
| 30. | 78702 | 52.1% | 43.7%(+8.40)#395 | 46.1%(+6.00)#7,930 |
| 31. | 78723 | 51.7% | 43.7%(+8.00)#401 | 46.1%(+5.60)#8,090 |
| 32. | 78745 | 50.5% | 43.7%(+6.80)#433 | 46.1%(+4.40)#8,598 |
| 33. | 78721 | 48.4% | 43.7%(+4.70)#487 | 46.1%(+2.30)#9,560 |
| 34. | 78754 | 46.0% | 43.7%(+2.30)#559 | 46.1%(-0.100)#10,818 |
| 35. | 78728 | 42.9% | 43.7%(-0.800)#658 | 46.1%(-3.20)#12,543 |
| 36. | 78744 | 35.9% | 43.7%(-7.80)#926 | 46.1%(-10.2)#17,253 |
| 37. | 78758 | 33.3% | 43.7%(-10.4)#1,037 | 46.1%(-12.8)#19,036 |
| 38. | 78741 | 29.8% | 43.7%(-13.9)#1,199 | 46.1%(-16.3)#21,538 |
| 39. | 78752 | 29.0% | 43.7%(-14.7)#1,240 | 46.1%(-17.1)#22,110 |
| 40. | 78753 | 28.3% | 43.7%(-15.4)#1,274 | 46.1%(-17.8)#22,570 |
| 41. | 78724 | 28.2% | 43.7%(-15.5)#1,284 | 46.1%(-17.9)#22,630 |
| 42. | 78719 | 22.0% | 43.7%(-21.7)#1,516 | 46.1%(-24.1)#26,315 |
| 43. | 78742 | 13.8% | 43.7%(-29.9)#1,703 | 46.1%(-32.3)#29,461 |
1
Common Questions
What are the Top 10 Zip Codes with the Highest Percentage of Families with Income Above $100,000 in Austin, TX?
Top 10 Zip Codes with the Highest Percentage of Families with Income Above $100,000 in Austin, TX are:
What zip code has the Highest Percentage of Families with Income Above $100,000 in Austin, TX?
78732 has the Highest Percentage of Families with Income Above $100,000 in Austin, TX with 88.1%.
What is the Percentage of Families with Income Above $100,000 in Austin, TX?
Percentage of Families with Income Above $100,000 in Austin is 55.9%.
What is the Percentage of Families with Income Above $100,000 in Texas?
Percentage of Families with Income Above $100,000 in Texas is 43.7%.
What is the Percentage of Families with Income Above $100,000 in the United States?
Percentage of Families with Income Above $100,000 in the United States is 46.1%.