Zip Codes with the Highest Percentage of Families with Income Above $100,000 in Houston, TX
RELATED REPORTS & OPTIONS
Family Income | $100k+
Houston
Compare Zip Codes
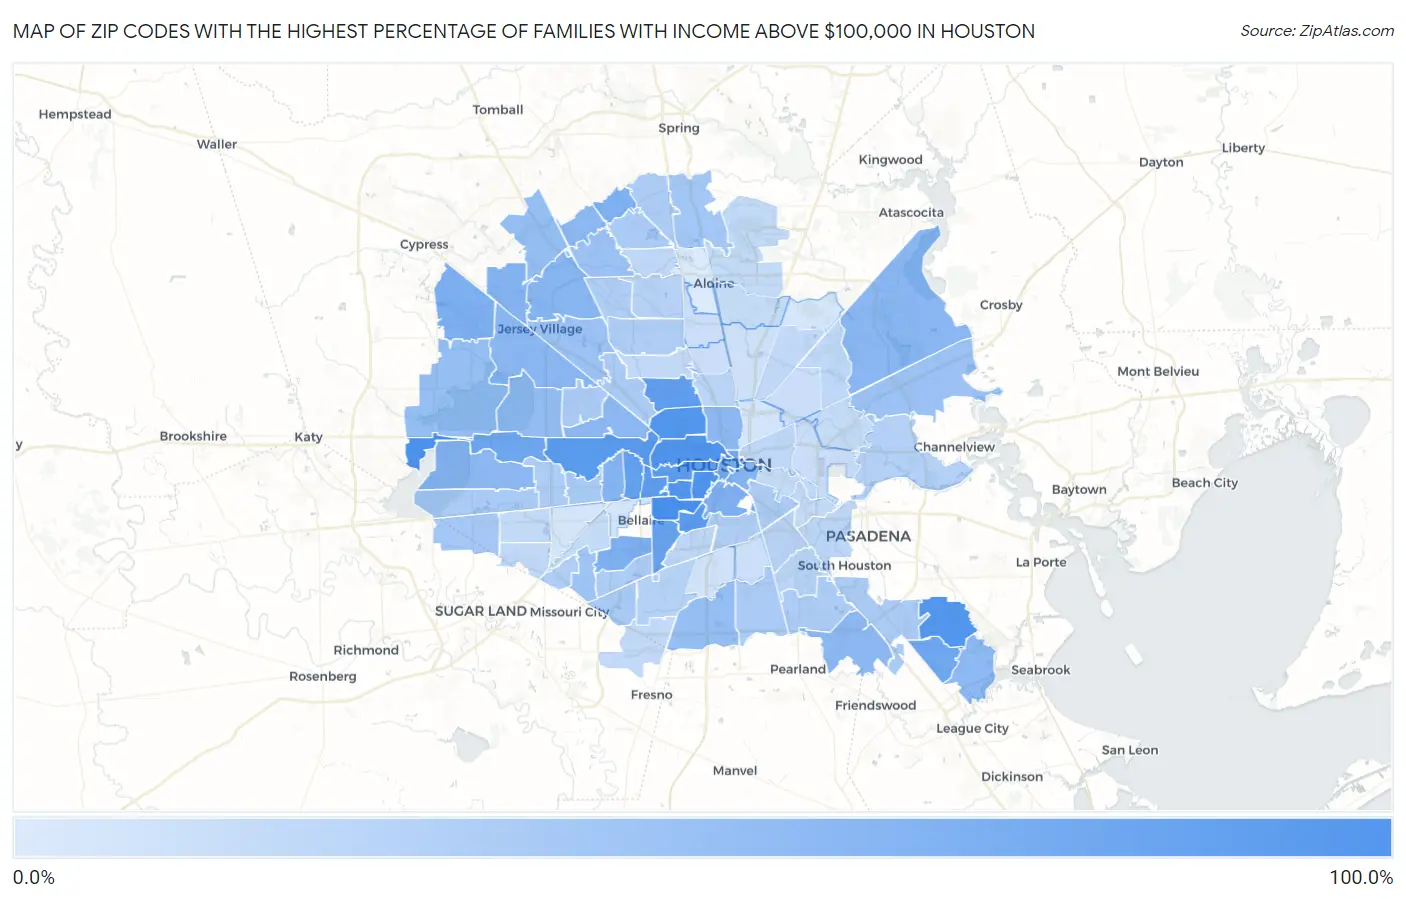
Map of Zip Codes with the Highest Percentage of Families with Income Above $100,000 in Houston
7.8%
86.0%
Zip Codes with the Highest Percentage of Families with Income Above $100,000 in Houston, TX
| Zip Code | Families with Income > $100k | vs State | vs National | |
| 1. | 77005 | 86.0% | 43.7%(+42.3)#34 | 46.1%(+39.9)#531 |
| 2. | 77094 | 82.9% | 43.7%(+39.2)#41 | 46.1%(+36.8)#743 |
| 3. | 77006 | 81.7% | 43.7%(+38.0)#45 | 46.1%(+35.6)#837 |
| 4. | 77007 | 80.5% | 43.7%(+36.8)#49 | 46.1%(+34.4)#971 |
| 5. | 77098 | 79.5% | 43.7%(+35.8)#53 | 46.1%(+33.4)#1,080 |
| 6. | 77059 | 78.7% | 43.7%(+35.0)#59 | 46.1%(+32.6)#1,174 |
| 7. | 77008 | 78.6% | 43.7%(+34.9)#60 | 46.1%(+32.5)#1,181 |
| 8. | 77010 | 77.7% | 43.7%(+34.0)#65 | 46.1%(+31.6)#1,312 |
| 9. | 77024 | 75.5% | 43.7%(+31.8)#79 | 46.1%(+29.4)#1,618 |
| 10. | 77019 | 74.4% | 43.7%(+30.7)#87 | 46.1%(+28.3)#1,798 |
| 11. | 77030 | 73.7% | 43.7%(+30.0)#93 | 46.1%(+27.6)#1,923 |
| 12. | 77027 | 70.5% | 43.7%(+26.8)#120 | 46.1%(+24.4)#2,507 |
| 13. | 77018 | 69.2% | 43.7%(+25.5)#135 | 46.1%(+23.1)#2,769 |
| 14. | 77056 | 67.5% | 43.7%(+23.8)#152 | 46.1%(+21.4)#3,140 |
| 15. | 77025 | 64.8% | 43.7%(+21.1)#183 | 46.1%(+18.7)#3,790 |
| 16. | 77062 | 61.7% | 43.7%(+18.0)#227 | 46.1%(+15.6)#4,630 |
| 17. | 77079 | 60.7% | 43.7%(+17.0)#243 | 46.1%(+14.6)#4,935 |
| 18. | 77002 | 56.9% | 43.7%(+13.2)#297 | 46.1%(+10.8)#6,133 |
| 19. | 77068 | 52.7% | 43.7%(+9.00)#375 | 46.1%(+6.60)#7,665 |
| 20. | 77096 | 52.5% | 43.7%(+8.80)#379 | 46.1%(+6.40)#7,747 |
| 21. | 77095 | 52.0% | 43.7%(+8.30)#398 | 46.1%(+5.90)#7,972 |
| 22. | 77004 | 51.7% | 43.7%(+8.00)#402 | 46.1%(+5.60)#8,091 |
| 23. | 77046 | 50.4% | 43.7%(+6.70)#439 | 46.1%(+4.30)#8,672 |
| 24. | 77003 | 49.4% | 43.7%(+5.70)#461 | 46.1%(+3.30)#9,110 |
| 25. | 77057 | 48.8% | 43.7%(+5.10)#474 | 46.1%(+2.70)#9,347 |
| 26. | 77065 | 47.9% | 43.7%(+4.20)#506 | 46.1%(+1.80)#9,798 |
| 27. | 77064 | 46.5% | 43.7%(+2.80)#542 | 46.1%(+0.400)#10,545 |
| 28. | 77044 | 46.2% | 43.7%(+2.50)#554 | 46.1%(+0.100)#10,695 |
| 29. | 77041 | 45.8% | 43.7%(+2.10)#566 | 46.1%(-0.300)#10,919 |
| 30. | 77077 | 44.9% | 43.7%(+1.20)#597 | 46.1%(-1.20)#11,378 |
| 31. | 77089 | 44.8% | 43.7%(+1.10)#601 | 46.1%(-1.30)#11,435 |
| 32. | 77009 | 44.7% | 43.7%(+1.000)#602 | 46.1%(-1.40)#11,504 |
| 33. | 77055 | 44.3% | 43.7%(+0.600)#616 | 46.1%(-1.80)#11,735 |
| 34. | 77069 | 44.3% | 43.7%(+0.600)#619 | 46.1%(-1.80)#11,753 |
| 35. | 77058 | 43.1% | 43.7%(-0.600)#653 | 46.1%(-3.00)#12,426 |
| 36. | 77043 | 41.2% | 43.7%(-2.50)#722 | 46.1%(-4.90)#13,592 |
| 37. | 77070 | 40.3% | 43.7%(-3.40)#754 | 46.1%(-5.80)#14,171 |
| 38. | 77084 | 40.1% | 43.7%(-3.60)#765 | 46.1%(-6.00)#14,304 |
| 39. | 77047 | 39.5% | 43.7%(-4.20)#789 | 46.1%(-6.60)#14,728 |
| 40. | 77066 | 37.6% | 43.7%(-6.10)#861 | 46.1%(-8.50)#16,036 |
| 41. | 77040 | 36.8% | 43.7%(-6.90)#891 | 46.1%(-9.30)#16,620 |
| 42. | 77049 | 36.3% | 43.7%(-7.40)#912 | 46.1%(-9.80)#16,954 |
| 43. | 77071 | 35.6% | 43.7%(-8.10)#941 | 46.1%(-10.5)#17,469 |
| 44. | 77073 | 32.7% | 43.7%(-11.0)#1,070 | 46.1%(-13.4)#19,500 |
| 45. | 77083 | 32.3% | 43.7%(-11.4)#1,086 | 46.1%(-13.8)#19,802 |
| 46. | 77063 | 31.3% | 43.7%(-12.4)#1,128 | 46.1%(-14.8)#20,479 |
| 47. | 77085 | 30.8% | 43.7%(-12.9)#1,159 | 46.1%(-15.3)#20,857 |
| 48. | 77080 | 30.1% | 43.7%(-13.6)#1,187 | 46.1%(-16.0)#21,330 |
| 49. | 77082 | 29.8% | 43.7%(-13.9)#1,198 | 46.1%(-16.3)#21,537 |
| 50. | 77014 | 29.8% | 43.7%(-13.9)#1,200 | 46.1%(-16.3)#21,541 |
| 51. | 77092 | 29.5% | 43.7%(-14.2)#1,218 | 46.1%(-16.6)#21,764 |
| 52. | 77048 | 29.4% | 43.7%(-14.3)#1,225 | 46.1%(-16.7)#21,833 |
| 53. | 77034 | 29.2% | 43.7%(-14.5)#1,231 | 46.1%(-16.9)#21,963 |
| 54. | 77075 | 29.0% | 43.7%(-14.7)#1,239 | 46.1%(-17.1)#22,099 |
| 55. | 77042 | 28.6% | 43.7%(-15.1)#1,258 | 46.1%(-17.5)#22,354 |
| 56. | 77023 | 28.4% | 43.7%(-15.3)#1,269 | 46.1%(-17.7)#22,510 |
| 57. | 77035 | 28.3% | 43.7%(-15.4)#1,275 | 46.1%(-17.8)#22,573 |
| 58. | 77090 | 28.1% | 43.7%(-15.6)#1,288 | 46.1%(-18.0)#22,703 |
| 59. | 77021 | 27.6% | 43.7%(-16.1)#1,308 | 46.1%(-18.5)#23,035 |
| 60. | 77031 | 27.4% | 43.7%(-16.3)#1,312 | 46.1%(-18.7)#23,168 |
| 61. | 77088 | 27.1% | 43.7%(-16.6)#1,320 | 46.1%(-19.0)#23,347 |
| 62. | 77086 | 26.8% | 43.7%(-16.9)#1,328 | 46.1%(-19.3)#23,552 |
| 63. | 77015 | 25.4% | 43.7%(-18.3)#1,387 | 46.1%(-20.7)#24,463 |
| 64. | 77045 | 24.3% | 43.7%(-19.4)#1,436 | 46.1%(-21.8)#25,118 |
| 65. | 77087 | 23.3% | 43.7%(-20.4)#1,475 | 46.1%(-22.8)#25,648 |
| 66. | 77038 | 22.9% | 43.7%(-20.8)#1,490 | 46.1%(-23.2)#25,850 |
| 67. | 77061 | 22.5% | 43.7%(-21.2)#1,503 | 46.1%(-23.6)#26,054 |
| 68. | 77022 | 22.2% | 43.7%(-21.5)#1,510 | 46.1%(-23.9)#26,184 |
| 69. | 77017 | 21.4% | 43.7%(-22.3)#1,528 | 46.1%(-24.7)#26,589 |
| 70. | 77054 | 21.3% | 43.7%(-22.4)#1,532 | 46.1%(-24.8)#26,650 |
| 71. | 77078 | 20.6% | 43.7%(-23.1)#1,552 | 46.1%(-25.5)#26,963 |
| 72. | 77020 | 20.5% | 43.7%(-23.2)#1,555 | 46.1%(-25.6)#27,008 |
| 73. | 77067 | 20.4% | 43.7%(-23.3)#1,557 | 46.1%(-25.7)#27,058 |
| 74. | 77099 | 19.4% | 43.7%(-24.3)#1,581 | 46.1%(-26.7)#27,503 |
| 75. | 77053 | 19.4% | 43.7%(-24.3)#1,582 | 46.1%(-26.7)#27,508 |
| 76. | 77016 | 19.2% | 43.7%(-24.5)#1,591 | 46.1%(-26.9)#27,597 |
| 77. | 77091 | 18.8% | 43.7%(-24.9)#1,602 | 46.1%(-27.3)#27,778 |
| 78. | 77072 | 18.7% | 43.7%(-25.0)#1,604 | 46.1%(-27.4)#27,814 |
| 79. | 77074 | 18.6% | 43.7%(-25.1)#1,608 | 46.1%(-27.5)#27,857 |
| 80. | 77012 | 18.5% | 43.7%(-25.2)#1,609 | 46.1%(-27.6)#27,888 |
| 81. | 77032 | 18.4% | 43.7%(-25.3)#1,613 | 46.1%(-27.7)#27,930 |
| 82. | 77013 | 17.4% | 43.7%(-26.3)#1,634 | 46.1%(-28.7)#28,301 |
| 83. | 77039 | 17.2% | 43.7%(-26.5)#1,638 | 46.1%(-28.9)#28,369 |
| 84. | 77011 | 16.9% | 43.7%(-26.8)#1,641 | 46.1%(-29.2)#28,475 |
| 85. | 77028 | 15.5% | 43.7%(-28.2)#1,666 | 46.1%(-30.6)#28,933 |
| 86. | 77037 | 15.3% | 43.7%(-28.4)#1,670 | 46.1%(-30.8)#28,999 |
| 87. | 77029 | 15.2% | 43.7%(-28.5)#1,673 | 46.1%(-30.9)#29,035 |
| 88. | 77076 | 15.0% | 43.7%(-28.7)#1,675 | 46.1%(-31.1)#29,097 |
| 89. | 77033 | 14.8% | 43.7%(-28.9)#1,680 | 46.1%(-31.3)#29,168 |
| 90. | 77093 | 13.0% | 43.7%(-30.7)#1,721 | 46.1%(-33.1)#29,695 |
| 91. | 77051 | 12.7% | 43.7%(-31.0)#1,727 | 46.1%(-33.4)#29,771 |
| 92. | 77026 | 11.8% | 43.7%(-31.9)#1,739 | 46.1%(-34.3)#29,991 |
| 93. | 77036 | 11.6% | 43.7%(-32.1)#1,741 | 46.1%(-34.5)#30,035 |
| 94. | 77081 | 11.3% | 43.7%(-32.4)#1,744 | 46.1%(-34.8)#30,091 |
| 95. | 77050 | 10.1% | 43.7%(-33.6)#1,755 | 46.1%(-36.0)#30,307 |
| 96. | 77060 | 7.8% | 43.7%(-35.9)#1,783 | 46.1%(-38.3)#30,673 |
1
Common Questions
What are the Top 10 Zip Codes with the Highest Percentage of Families with Income Above $100,000 in Houston, TX?
Top 10 Zip Codes with the Highest Percentage of Families with Income Above $100,000 in Houston, TX are:
What zip code has the Highest Percentage of Families with Income Above $100,000 in Houston, TX?
77005 has the Highest Percentage of Families with Income Above $100,000 in Houston, TX with 86.0%.
What is the Percentage of Families with Income Above $100,000 in Houston, TX?
Percentage of Families with Income Above $100,000 in Houston is 35.1%.
What is the Percentage of Families with Income Above $100,000 in Texas?
Percentage of Families with Income Above $100,000 in Texas is 43.7%.
What is the Percentage of Families with Income Above $100,000 in the United States?
Percentage of Families with Income Above $100,000 in the United States is 46.1%.