Zip Codes with the Highest Percentage of Families with Income Above $100,000 in Lancaster, TX
RELATED REPORTS & OPTIONS
Family Income | $100k+
Lancaster
Compare Zip Codes
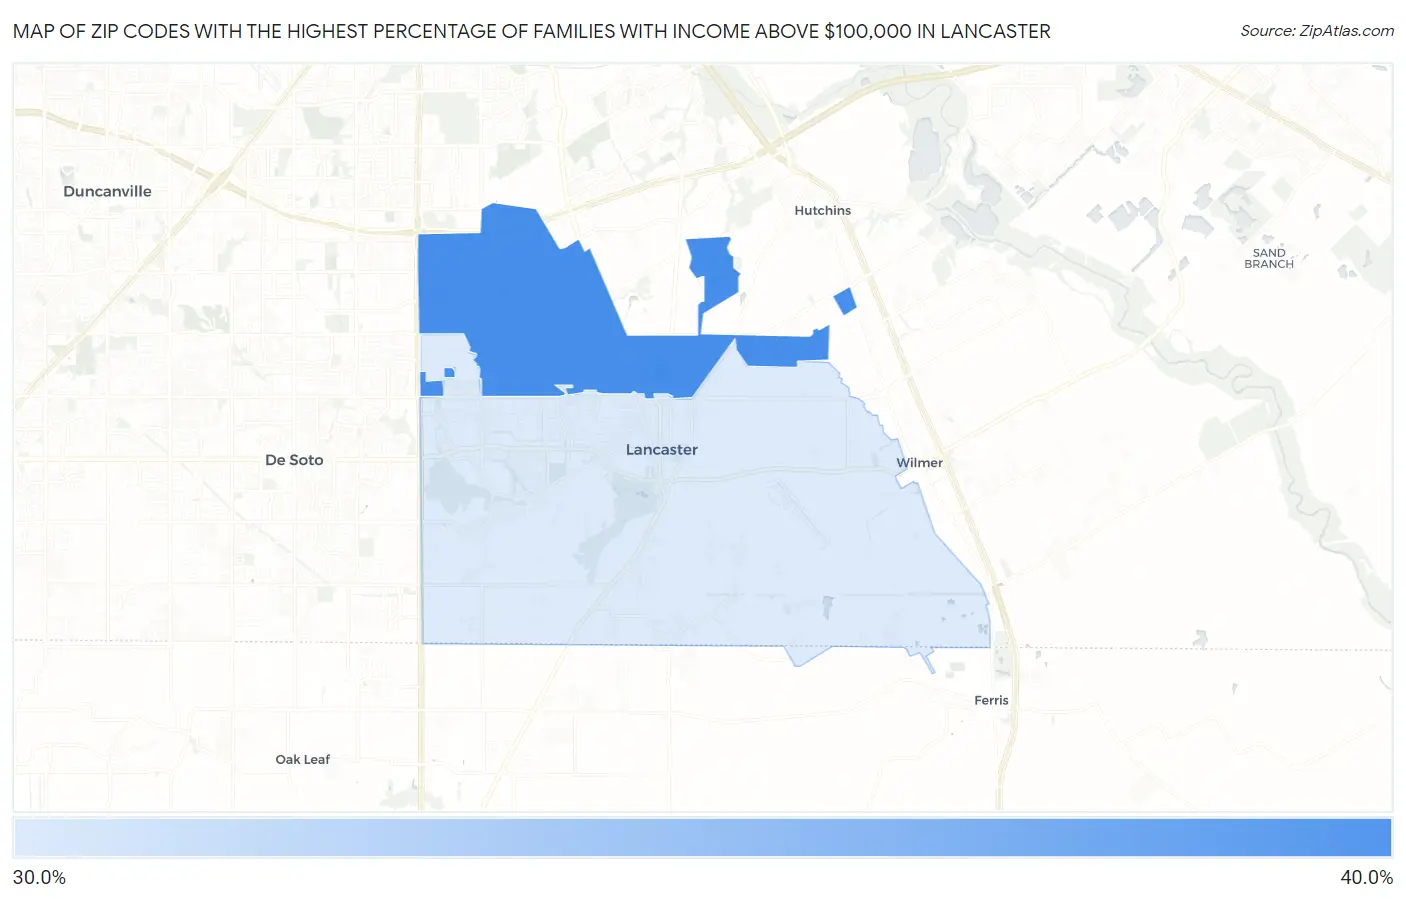
Map of Zip Codes with the Highest Percentage of Families with Income Above $100,000 in Lancaster
33.4%
33.6%
Zip Codes with the Highest Percentage of Families with Income Above $100,000 in Lancaster, TX
| Zip Code | Families with Income > $100k | vs State | vs National | |
| 1. | 75134 | 33.6% | 43.7%(-10.1)#1,022 | 46.1%(-12.5)#18,841 |
| 2. | 75146 | 33.4% | 43.7%(-10.3)#1,033 | 46.1%(-12.7)#18,984 |
1
Common Questions
What are the Top Zip Codes with the Highest Percentage of Families with Income Above $100,000 in Lancaster, TX?
Top Zip Codes with the Highest Percentage of Families with Income Above $100,000 in Lancaster, TX are:
What zip code has the Highest Percentage of Families with Income Above $100,000 in Lancaster, TX?
75134 has the Highest Percentage of Families with Income Above $100,000 in Lancaster, TX with 33.6%.
What is the Percentage of Families with Income Above $100,000 in Lancaster, TX?
Percentage of Families with Income Above $100,000 in Lancaster is 33.3%.
What is the Percentage of Families with Income Above $100,000 in Texas?
Percentage of Families with Income Above $100,000 in Texas is 43.7%.
What is the Percentage of Families with Income Above $100,000 in the United States?
Percentage of Families with Income Above $100,000 in the United States is 46.1%.