deCordova, TX Map & Demographics
deCordova Map
deCordova Overview
$53,132
PER CAPITA INCOME
$130,045
AVG FAMILY INCOME
$115,013
AVG HOUSEHOLD INCOME
15.6%
WAGE / INCOME GAP [ % ]
84.4¢/ $1
WAGE / INCOME GAP [ $ ]
0.36
INEQUALITY / GINI INDEX
3,035
TOTAL POPULATION
1,503
MALE POPULATION
1,532
FEMALE POPULATION
98.11
MALES / 100 FEMALES
101.93
FEMALES / 100 MALES
52.1
MEDIAN AGE
2.7
AVG FAMILY SIZE
2.3
AVG HOUSEHOLD SIZE
1,300
LABOR FORCE [ PEOPLE ]
51.4%
PERCENT IN LABOR FORCE
4.2%
UNEMPLOYMENT RATE
Income in deCordova
Income Overview in deCordova
Per Capita Income in deCordova is $53,132, while median incomes of families and households are $130,045 and $115,013 respectively.
| Characteristic | Number | Measure |
| Per Capita Income | 3,035 | $53,132 |
| Median Family Income | 987 | $130,045 |
| Mean Family Income | 987 | $147,555 |
| Median Household Income | 1,329 | $115,013 |
| Mean Household Income | 1,329 | $120,441 |
| Income Deficit | 987 | $0 |
| Wage / Income Gap (%) | 3,035 | 15.60% |
| Wage / Income Gap ($) | 3,035 | 84.40¢ per $1 |
| Gini / Inequality Index | 3,035 | 0.36 |
Earnings by Sex in deCordova
Average Earnings in deCordova are $62,356, $72,543 for men and $61,226 for women, a difference of 15.6%.
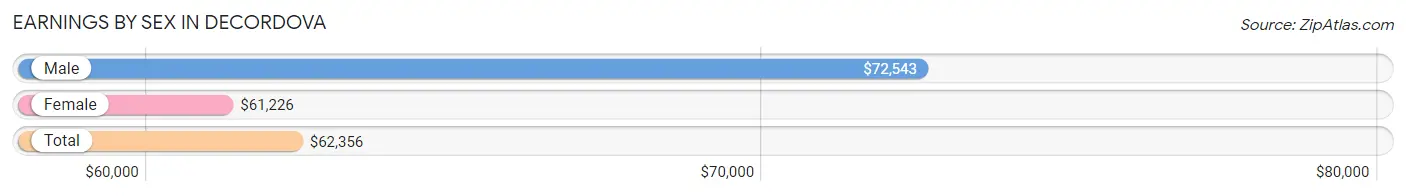
| Sex | Number | Average Earnings |
| Male | 777 (56.5%) | $72,543 |
| Female | 599 (43.5%) | $61,226 |
| Total | 1,376 (100.0%) | $62,356 |
Earnings by Sex by Income Bracket in deCordova
The most common earnings brackets in deCordova are $100,000+ for men (227 | 29.2%) and $55,000 to $64,999 for women (145 | 24.2%).
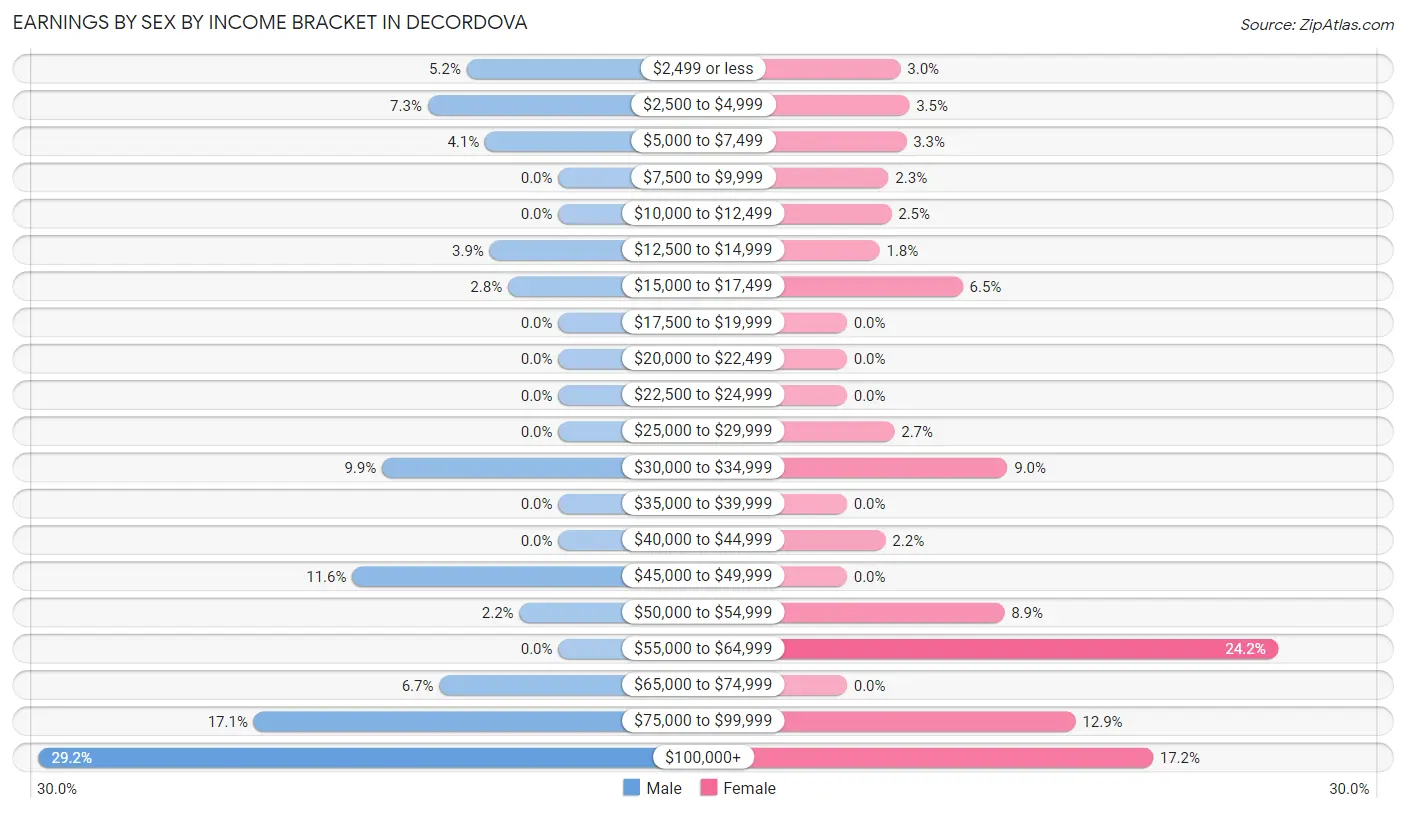
| Income | Male | Female |
| $2,499 or less | 40 (5.1%) | 18 (3.0%) |
| $2,500 to $4,999 | 57 (7.3%) | 21 (3.5%) |
| $5,000 to $7,499 | 32 (4.1%) | 20 (3.3%) |
| $7,500 to $9,999 | 0 (0.0%) | 14 (2.3%) |
| $10,000 to $12,499 | 0 (0.0%) | 15 (2.5%) |
| $12,500 to $14,999 | 30 (3.9%) | 11 (1.8%) |
| $15,000 to $17,499 | 22 (2.8%) | 39 (6.5%) |
| $17,500 to $19,999 | 0 (0.0%) | 0 (0.0%) |
| $20,000 to $22,499 | 0 (0.0%) | 0 (0.0%) |
| $22,500 to $24,999 | 0 (0.0%) | 0 (0.0%) |
| $25,000 to $29,999 | 0 (0.0%) | 16 (2.7%) |
| $30,000 to $34,999 | 77 (9.9%) | 54 (9.0%) |
| $35,000 to $39,999 | 0 (0.0%) | 0 (0.0%) |
| $40,000 to $44,999 | 0 (0.0%) | 13 (2.2%) |
| $45,000 to $49,999 | 90 (11.6%) | 0 (0.0%) |
| $50,000 to $54,999 | 17 (2.2%) | 53 (8.8%) |
| $55,000 to $64,999 | 0 (0.0%) | 145 (24.2%) |
| $65,000 to $74,999 | 52 (6.7%) | 0 (0.0%) |
| $75,000 to $99,999 | 133 (17.1%) | 77 (12.9%) |
| $100,000+ | 227 (29.2%) | 103 (17.2%) |
| Total | 777 (100.0%) | 599 (100.0%) |
Earnings by Sex by Educational Attainment in deCordova
Average earnings in deCordova are $74,224 for men and $62,139 for women, a difference of 16.3%. Men with an educational attainment of graduate degree enjoy the highest average annual earnings of $105,531, while those with bachelor's degree education earn the least with $72,974. Women with an educational attainment of bachelor's degree earn the most with the average annual earnings of $62,567, while those with bachelor's degree education have the smallest earnings of $62,567.
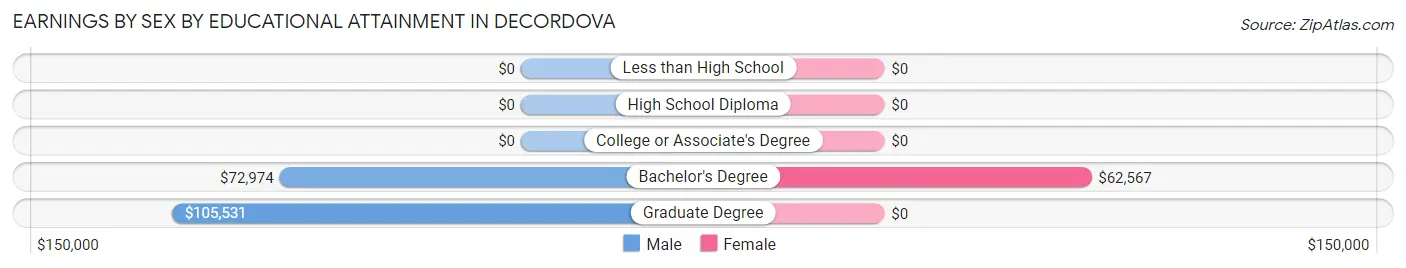
| Educational Attainment | Male Income | Female Income |
| Less than High School | - | - |
| High School Diploma | - | - |
| College or Associate's Degree | - | - |
| Bachelor's Degree | $72,974 | $62,567 |
| Graduate Degree | $105,531 | $0 |
| Total | $74,224 | $62,139 |
Family Income in deCordova
Family Income Brackets in deCordova
According to the deCordova family income data, there are 446 families falling into the $100,000 to $149,999 income range, which is the most common income bracket and makes up 45.2% of all families.
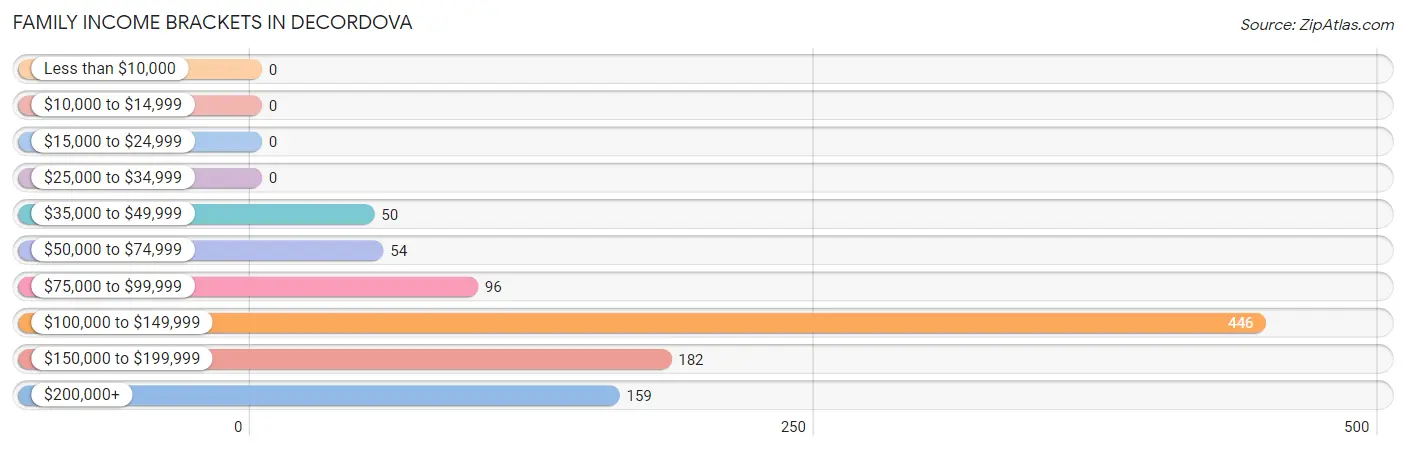
| Income Bracket | # Families | % Families |
| Less than $10,000 | 0 | 0.0% |
| $10,000 to $14,999 | 0 | 0.0% |
| $15,000 to $24,999 | 0 | 0.0% |
| $25,000 to $34,999 | 0 | 0.0% |
| $35,000 to $49,999 | 50 | 5.1% |
| $50,000 to $74,999 | 54 | 5.5% |
| $75,000 to $99,999 | 96 | 9.7% |
| $100,000 to $149,999 | 446 | 45.2% |
| $150,000 to $199,999 | 182 | 18.4% |
| $200,000+ | 159 | 16.1% |
Family Income by Famaliy Size in deCordova
4-person families (152 | 15.4%) account for the highest median family income in deCordova with $168,526 per family, while 2-person families (665 | 67.4%) have the highest median income of $58,677 per family member.
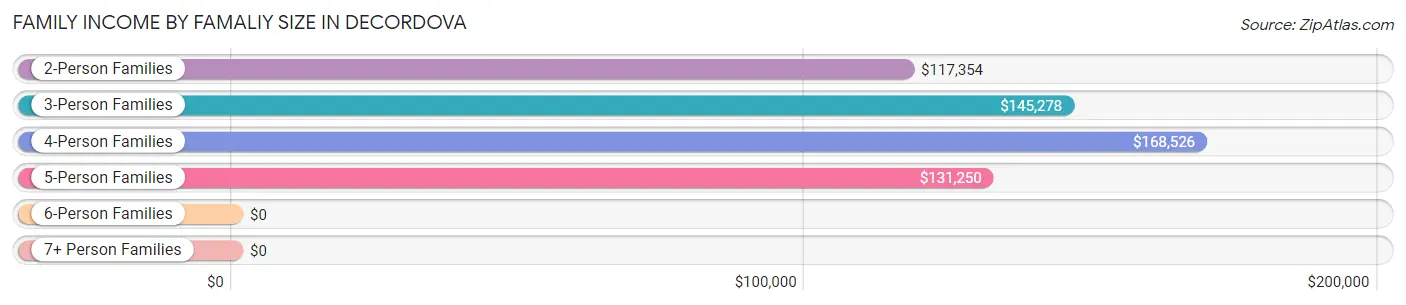
| Income Bracket | # Families | Median Income |
| 2-Person Families | 665 (67.4%) | $117,354 |
| 3-Person Families | 120 (12.2%) | $145,278 |
| 4-Person Families | 152 (15.4%) | $168,526 |
| 5-Person Families | 50 (5.1%) | $131,250 |
| 6-Person Families | 0 (0.0%) | $0 |
| 7+ Person Families | 0 (0.0%) | $0 |
| Total | 987 (100.0%) | $130,045 |
Family Income by Number of Earners in deCordova
The median family income in deCordova is $130,045, with families comprising 3+ earners (37) having the highest median family income of $145,972, while families with no earners (276) have the lowest median family income of $115,266, accounting for 3.7% and 28.0% of families, respectively.
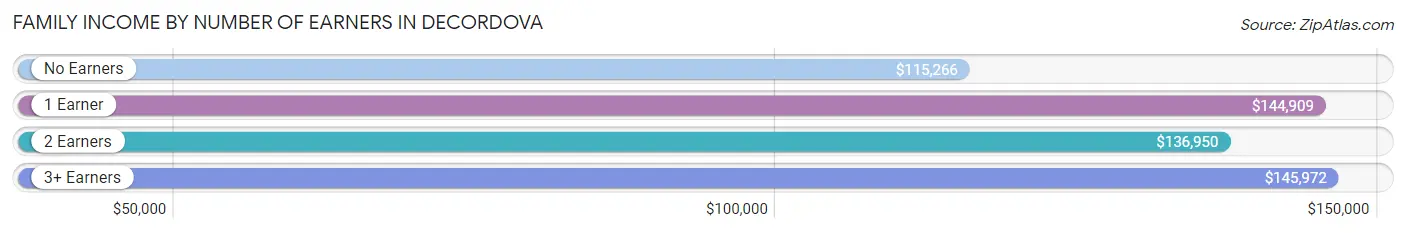
| Number of Earners | # Families | Median Income |
| No Earners | 276 (28.0%) | $115,266 |
| 1 Earner | 227 (23.0%) | $144,909 |
| 2 Earners | 447 (45.3%) | $136,950 |
| 3+ Earners | 37 (3.7%) | $145,972 |
| Total | 987 (100.0%) | $130,045 |
Household Income in deCordova
Household Income Brackets in deCordova
With 447 households falling in the category, the $100,000 to $149,999 income range is the most frequent in deCordova, accounting for 33.6% of all households.
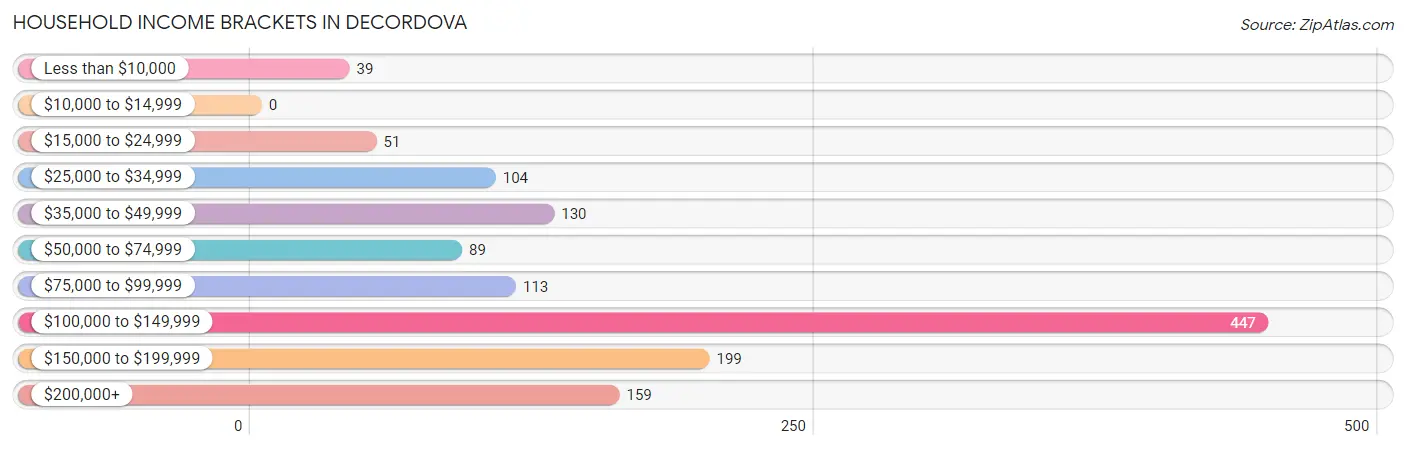
| Income Bracket | # Households | % Households |
| Less than $10,000 | 39 | 2.9% |
| $10,000 to $14,999 | 0 | 0.0% |
| $15,000 to $24,999 | 51 | 3.8% |
| $25,000 to $34,999 | 104 | 7.8% |
| $35,000 to $49,999 | 130 | 9.8% |
| $50,000 to $74,999 | 89 | 6.7% |
| $75,000 to $99,999 | 113 | 8.5% |
| $100,000 to $149,999 | 447 | 33.6% |
| $150,000 to $199,999 | 199 | 15.0% |
| $200,000+ | 159 | 12.0% |
Household Income by Householder Age in deCordova
The median household income in deCordova is $115,013, with the highest median household income of $142,961 found in the 45 to 64 years age bracket for the primary householder. A total of 471 households (35.4%) fall into this category.
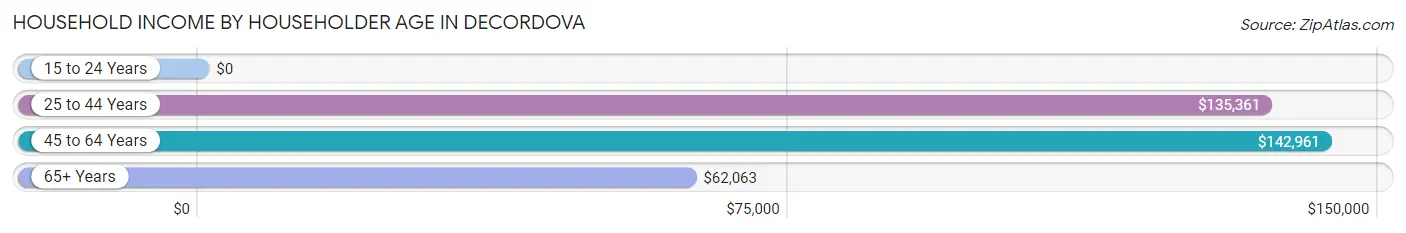
| Income Bracket | # Households | Median Income |
| 15 to 24 Years | 0 (0.0%) | $0 |
| 25 to 44 Years | 251 (18.9%) | $135,361 |
| 45 to 64 Years | 471 (35.4%) | $142,961 |
| 65+ Years | 607 (45.7%) | $62,063 |
| Total | 1,329 (100.0%) | $115,013 |
Poverty in deCordova
Income Below Poverty by Sex and Age in deCordova
With 1.5% poverty level for males and 2.5% for females among the residents of deCordova, 25 to 34 year old males and 25 to 34 year old females are the most vulnerable to poverty, with 23 males (18.0%) and 21 females (9.0%) in their respective age groups living below the poverty level.
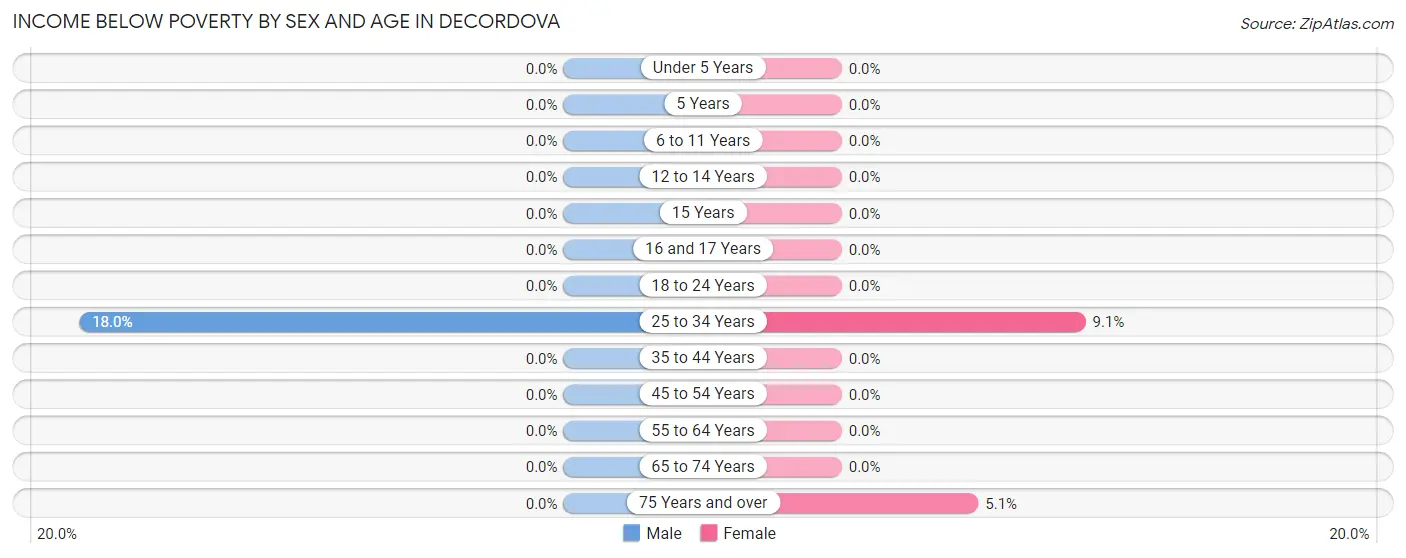
| Age Bracket | Male | Female |
| Under 5 Years | 0 (0.0%) | 0 (0.0%) |
| 5 Years | 0 (0.0%) | 0 (0.0%) |
| 6 to 11 Years | 0 (0.0%) | 0 (0.0%) |
| 12 to 14 Years | 0 (0.0%) | 0 (0.0%) |
| 15 Years | 0 (0.0%) | 0 (0.0%) |
| 16 and 17 Years | 0 (0.0%) | 0 (0.0%) |
| 18 to 24 Years | 0 (0.0%) | 0 (0.0%) |
| 25 to 34 Years | 23 (18.0%) | 21 (9.0%) |
| 35 to 44 Years | 0 (0.0%) | 0 (0.0%) |
| 45 to 54 Years | 0 (0.0%) | 0 (0.0%) |
| 55 to 64 Years | 0 (0.0%) | 0 (0.0%) |
| 65 to 74 Years | 0 (0.0%) | 0 (0.0%) |
| 75 Years and over | 0 (0.0%) | 17 (5.1%) |
| Total | 23 (1.5%) | 38 (2.5%) |
Income Above Poverty by Sex and Age in deCordova
According to the poverty statistics in deCordova, males aged under 5 years and females aged under 5 years are the age groups that are most secure financially, with 100.0% of males and 100.0% of females in these age groups living above the poverty line.
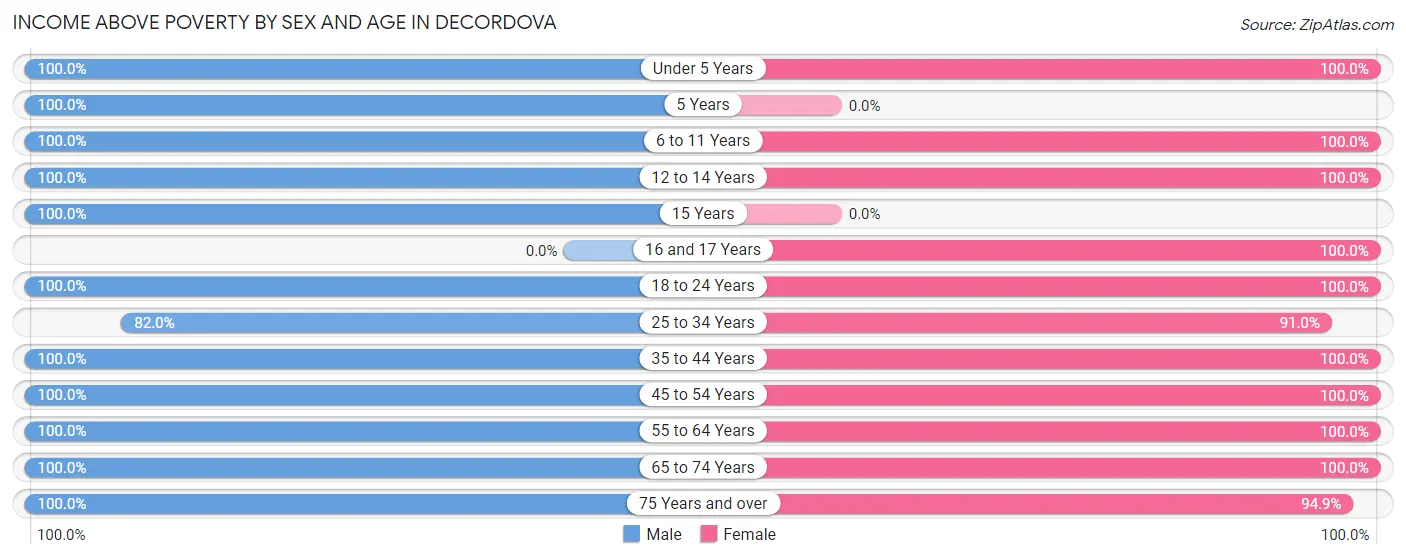
| Age Bracket | Male | Female |
| Under 5 Years | 51 (100.0%) | 76 (100.0%) |
| 5 Years | 35 (100.0%) | 0 (0.0%) |
| 6 to 11 Years | 166 (100.0%) | 76 (100.0%) |
| 12 to 14 Years | 53 (100.0%) | 26 (100.0%) |
| 15 Years | 22 (100.0%) | 0 (0.0%) |
| 16 and 17 Years | 0 (0.0%) | 20 (100.0%) |
| 18 to 24 Years | 60 (100.0%) | 18 (100.0%) |
| 25 to 34 Years | 105 (82.0%) | 211 (90.9%) |
| 35 to 44 Years | 152 (100.0%) | 161 (100.0%) |
| 45 to 54 Years | 164 (100.0%) | 124 (100.0%) |
| 55 to 64 Years | 280 (100.0%) | 271 (100.0%) |
| 65 to 74 Years | 275 (100.0%) | 193 (100.0%) |
| 75 Years and over | 117 (100.0%) | 318 (94.9%) |
| Total | 1,480 (98.5%) | 1,494 (97.5%) |
Income Below Poverty Among Married-Couple Families in deCordova
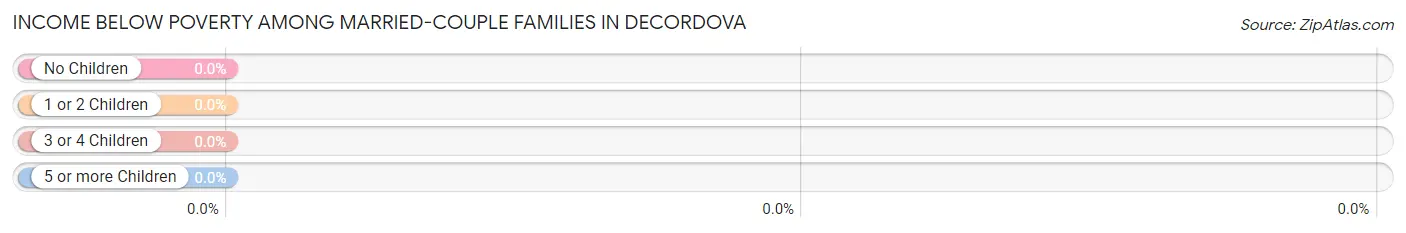
| Children | Above Poverty | Below Poverty |
| No Children | 686 (100.0%) | 0 (0.0%) |
| 1 or 2 Children | 197 (100.0%) | 0 (0.0%) |
| 3 or 4 Children | 48 (100.0%) | 0 (0.0%) |
| 5 or more Children | 0 (0.0%) | 0 (0.0%) |
| Total | 931 (100.0%) | 0 (0.0%) |
Income Below Poverty Among Single-Parent Households in deCordova
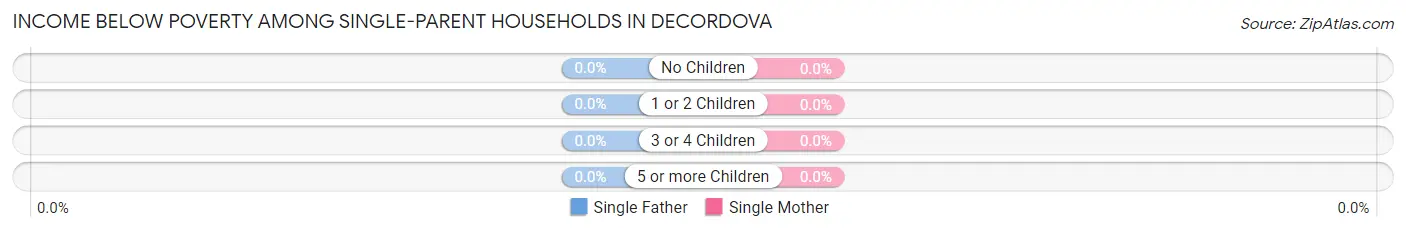
| Children | Single Father | Single Mother |
| No Children | 0 (0.0%) | 0 (0.0%) |
| 1 or 2 Children | 0 (0.0%) | 0 (0.0%) |
| 3 or 4 Children | 0 (0.0%) | 0 (0.0%) |
| 5 or more Children | 0 (0.0%) | 0 (0.0%) |
| Total | 0 (0.0%) | 0 (0.0%) |
Income Below Poverty Among Married-Couple vs Single-Parent Households in deCordova
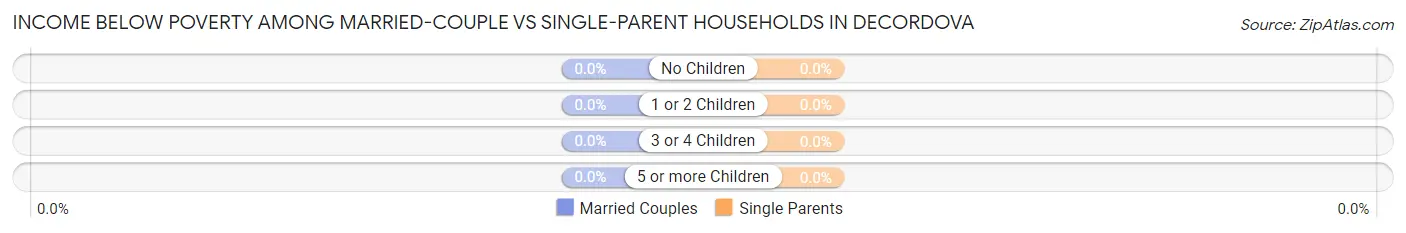
| Children | Married-Couple Families | Single-Parent Households |
| No Children | 0 (0.0%) | 0 (0.0%) |
| 1 or 2 Children | 0 (0.0%) | 0 (0.0%) |
| 3 or 4 Children | 0 (0.0%) | 0 (0.0%) |
| 5 or more Children | 0 (0.0%) | 0 (0.0%) |
| Total | 0 (0.0%) | 0 (0.0%) |
Race in deCordova
The most populous races in deCordova are White / Caucasian (2,982 | 98.3%), Hispanic or Latino (88 | 2.9%), and Two or more Races (26 | 0.9%).
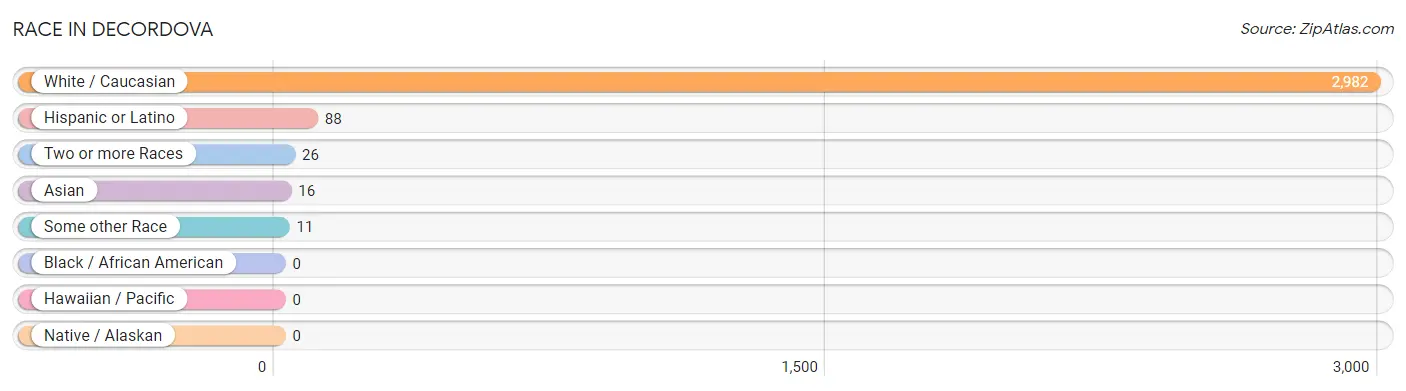
| Race | # Population | % Population |
| Asian | 16 | 0.5% |
| Black / African American | 0 | 0.0% |
| Hawaiian / Pacific | 0 | 0.0% |
| Hispanic or Latino | 88 | 2.9% |
| Native / Alaskan | 0 | 0.0% |
| White / Caucasian | 2,982 | 98.3% |
| Two or more Races | 26 | 0.9% |
| Some other Race | 11 | 0.4% |
| Total | 3,035 | 100.0% |
Ancestry in deCordova
The most populous ancestries reported in deCordova are English (602 | 19.8%), German (536 | 17.7%), Irish (526 | 17.3%), American (300 | 9.9%), and Scotch-Irish (162 | 5.3%), together accounting for 70.1% of all deCordova residents.
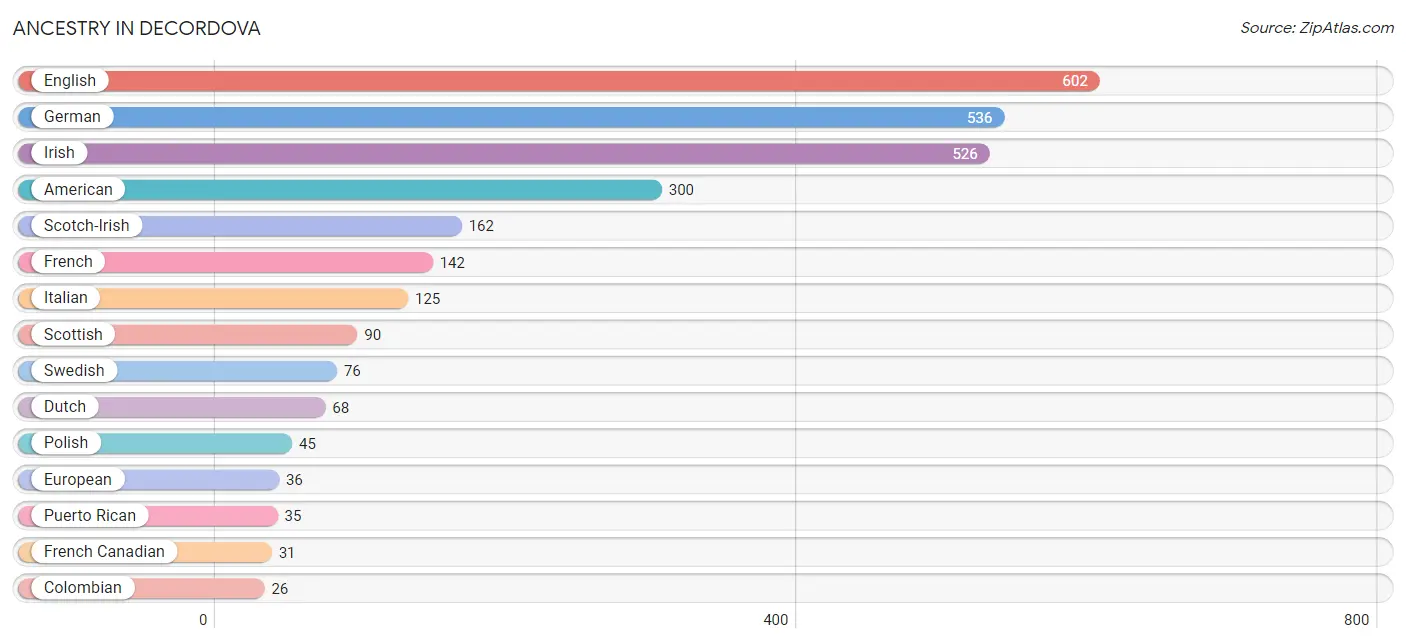
| Ancestry | # Population | % Population |
| American | 300 | 9.9% |
| Central American | 16 | 0.5% |
| Colombian | 26 | 0.9% |
| Danish | 8 | 0.3% |
| Dutch | 68 | 2.2% |
| English | 602 | 19.8% |
| European | 36 | 1.2% |
| French | 142 | 4.7% |
| French Canadian | 31 | 1.0% |
| German | 536 | 17.7% |
| Indian (Asian) | 16 | 0.5% |
| Irish | 526 | 17.3% |
| Italian | 125 | 4.1% |
| Mexican | 11 | 0.4% |
| Panamanian | 16 | 0.5% |
| Polish | 45 | 1.5% |
| Puerto Rican | 35 | 1.1% |
| Scandinavian | 13 | 0.4% |
| Scotch-Irish | 162 | 5.3% |
| Scottish | 90 | 3.0% |
| South American | 26 | 0.9% |
| Swedish | 76 | 2.5% | View All 22 Rows |
Immigrants in deCordova
The most numerous immigrant groups reported in deCordova came from Latin America (42 | 1.4%), Colombia (26 | 0.9%), South America (26 | 0.9%), Asia (16 | 0.5%), and Central America (16 | 0.5%), together accounting for 4.2% of all deCordova residents.
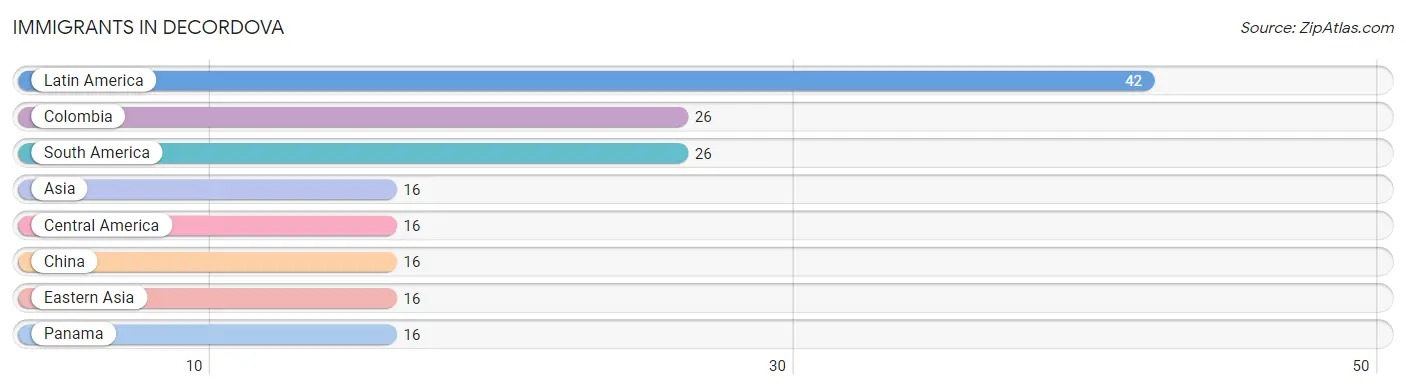
| Immigration Origin | # Population | % Population |
| Asia | 16 | 0.5% |
| Central America | 16 | 0.5% |
| China | 16 | 0.5% |
| Colombia | 26 | 0.9% |
| Eastern Asia | 16 | 0.5% |
| Latin America | 42 | 1.4% |
| Panama | 16 | 0.5% |
| South America | 26 | 0.9% | View All 8 Rows |
Sex and Age in deCordova
Sex and Age in deCordova
The most populous age groups in deCordova are 60 to 64 Years (199 | 13.2%) for men and 60 to 64 Years (212 | 13.8%) for women.
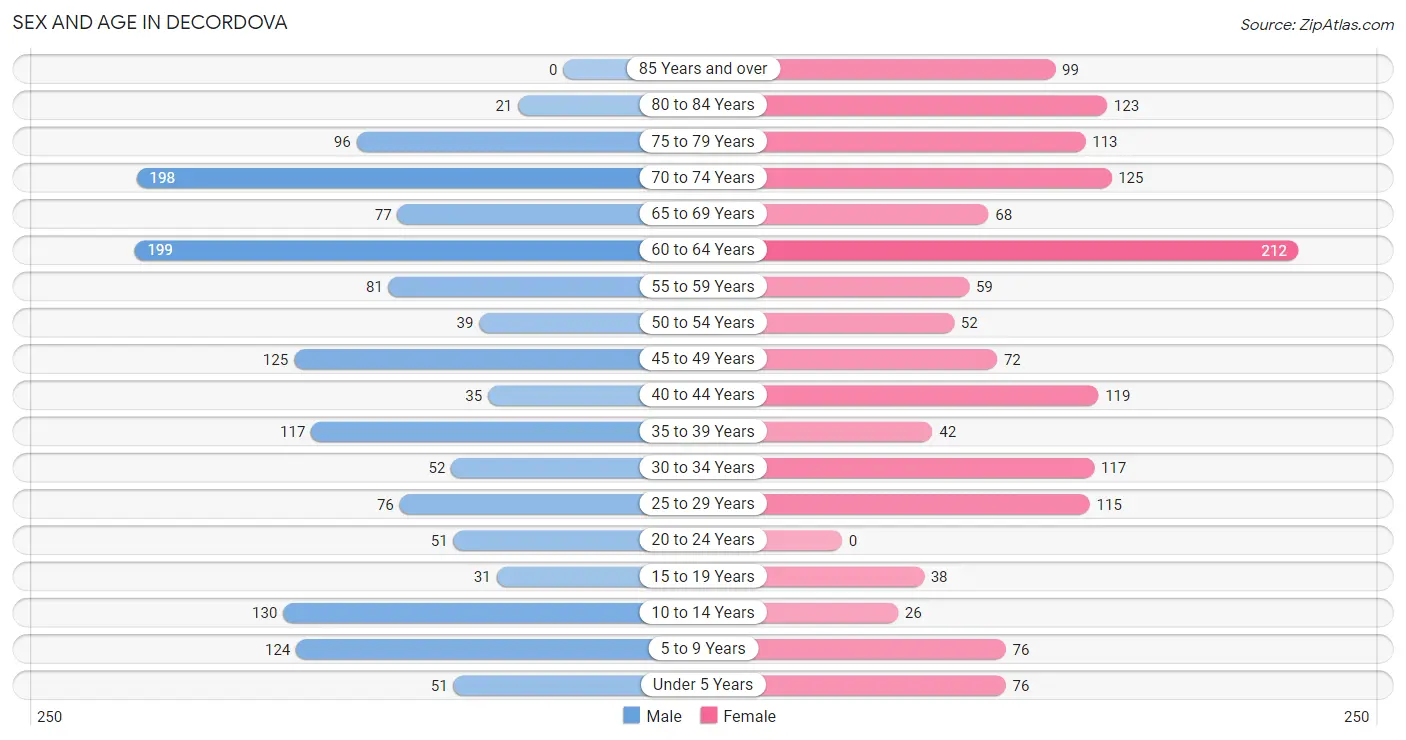
| Age Bracket | Male | Female |
| Under 5 Years | 51 (3.4%) | 76 (5.0%) |
| 5 to 9 Years | 124 (8.3%) | 76 (5.0%) |
| 10 to 14 Years | 130 (8.6%) | 26 (1.7%) |
| 15 to 19 Years | 31 (2.1%) | 38 (2.5%) |
| 20 to 24 Years | 51 (3.4%) | 0 (0.0%) |
| 25 to 29 Years | 76 (5.1%) | 115 (7.5%) |
| 30 to 34 Years | 52 (3.5%) | 117 (7.6%) |
| 35 to 39 Years | 117 (7.8%) | 42 (2.7%) |
| 40 to 44 Years | 35 (2.3%) | 119 (7.8%) |
| 45 to 49 Years | 125 (8.3%) | 72 (4.7%) |
| 50 to 54 Years | 39 (2.6%) | 52 (3.4%) |
| 55 to 59 Years | 81 (5.4%) | 59 (3.8%) |
| 60 to 64 Years | 199 (13.2%) | 212 (13.8%) |
| 65 to 69 Years | 77 (5.1%) | 68 (4.4%) |
| 70 to 74 Years | 198 (13.2%) | 125 (8.2%) |
| 75 to 79 Years | 96 (6.4%) | 113 (7.4%) |
| 80 to 84 Years | 21 (1.4%) | 123 (8.0%) |
| 85 Years and over | 0 (0.0%) | 99 (6.5%) |
| Total | 1,503 (100.0%) | 1,532 (100.0%) |
Families and Households in deCordova
Median Family Size in deCordova
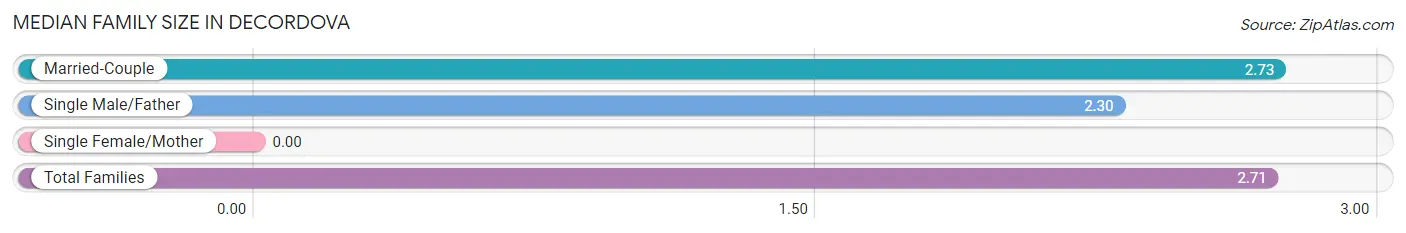
| Family Type | # Families | Family Size |
| Married-Couple | 931 (94.3%) | 2.73 |
| Single Male/Father | 56 (5.7%) | 2.30 |
| Single Female/Mother | 0 (0.0%) | - |
| Total Families | 987 (100.0%) | 2.71 |
Median Household Size in deCordova
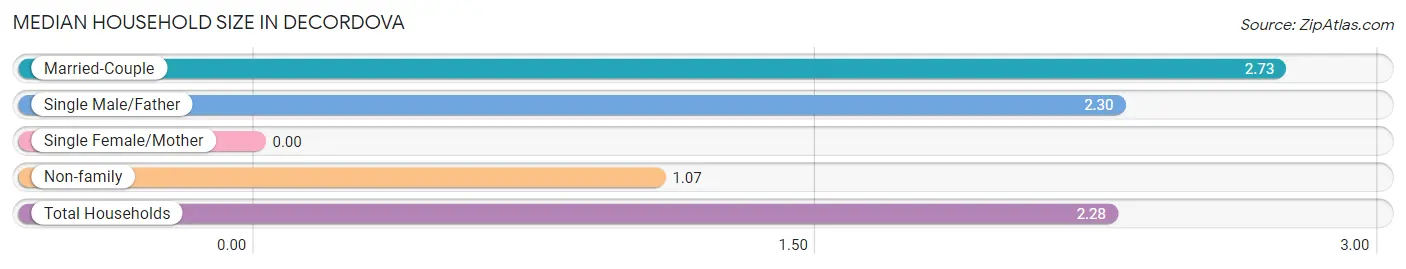
| Household Type | # Households | Household Size |
| Married-Couple | 931 (70.1%) | 2.73 |
| Single Male/Father | 56 (4.2%) | 2.30 |
| Single Female/Mother | 0 (0.0%) | - |
| Non-family | 342 (25.7%) | 1.07 |
| Total Households | 1,329 (100.0%) | 2.28 |
Household Size by Marriage Status in deCordova
Out of a total of 1,329 households in deCordova, 987 (74.3%) are family households, while 342 (25.7%) are nonfamily households. The most numerous type of family households are 2-person households, comprising 665, and the most common type of nonfamily households are 1-person households, comprising 321.
| Household Size | Family Households | Nonfamily Households |
| 1-Person Households | - | 321 (24.1%) |
| 2-Person Households | 665 (50.0%) | 21 (1.6%) |
| 3-Person Households | 120 (9.0%) | 0 (0.0%) |
| 4-Person Households | 152 (11.4%) | 0 (0.0%) |
| 5-Person Households | 50 (3.8%) | 0 (0.0%) |
| 6-Person Households | 0 (0.0%) | 0 (0.0%) |
| 7+ Person Households | 0 (0.0%) | 0 (0.0%) |
| Total | 987 (74.3%) | 342 (25.7%) |
Female Fertility in deCordova
Fertility by Age in deCordova
| Age Bracket | Women with Births | Births / 1,000 Women |
| 15 to 19 years | 0 (0.0%) | 0.0 |
| 20 to 34 years | 0 (0.0%) | 0.0 |
| 35 to 50 years | 0 (0.0%) | 0.0 |
| Total | 0 (0.0%) | 0.0 |
Fertility by Age by Marriage Status in deCordova
| Age Bracket | Married | Unmarried |
| 15 to 19 years | 0 (0.0%) | 0 (0.0%) |
| 20 to 34 years | 0 (0.0%) | 0 (0.0%) |
| 35 to 50 years | 0 (0.0%) | 0 (0.0%) |
| Total | 0 (0.0%) | 0 (0.0%) |
Fertility by Education in deCordova
| Educational Attainment | Women with Births | Births / 1,000 Women |
| Less than High School | 0 (0.0%) | 0.0 |
| High School Diploma | 0 (0.0%) | 0.0 |
| College or Associate's Degree | 0 (0.0%) | 0.0 |
| Bachelor's Degree | 0 (0.0%) | 0.0 |
| Graduate Degree | 0 (0.0%) | 0.0 |
| Total | 0 (0.0%) | 0.0 |
Fertility by Education by Marriage Status in deCordova
| Educational Attainment | Married | Unmarried |
| Less than High School | 0 (0.0%) | 0 (0.0%) |
| High School Diploma | 0 (0.0%) | 0 (0.0%) |
| College or Associate's Degree | 0 (0.0%) | 0 (0.0%) |
| Bachelor's Degree | 0 (0.0%) | 0 (0.0%) |
| Graduate Degree | 0 (0.0%) | 0 (0.0%) |
| Total | 0 (0.0%) | 0 (0.0%) |
Employment Characteristics in deCordova
Employment by Class of Employer in deCordova
Among the 1,247 employed individuals in deCordova, private company employees (737 | 59.1%), local government employees (322 | 25.8%), and not-for-profit organizations (66 | 5.3%) make up the most common classes of employment.
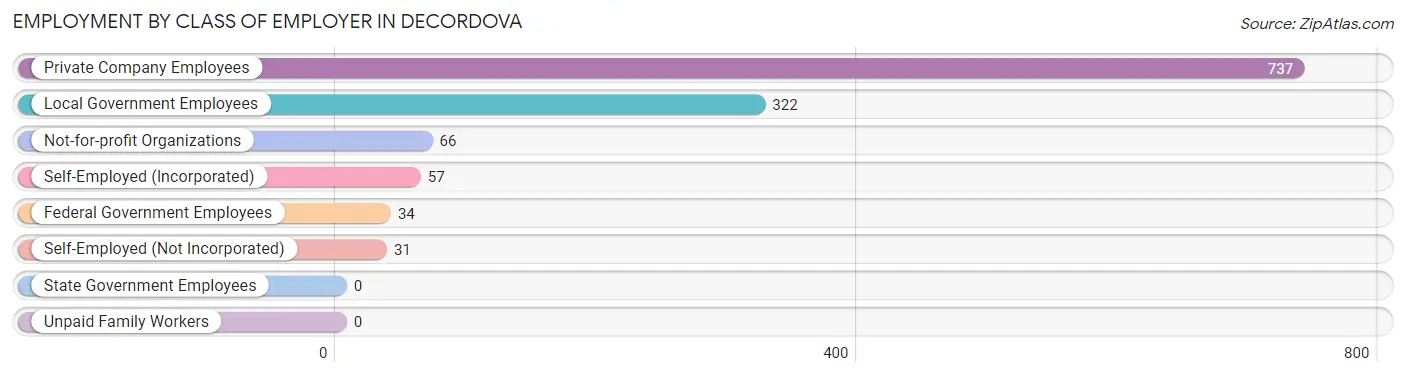
| Employer Class | # Employees | % Employees |
| Private Company Employees | 737 | 59.1% |
| Self-Employed (Incorporated) | 57 | 4.6% |
| Self-Employed (Not Incorporated) | 31 | 2.5% |
| Not-for-profit Organizations | 66 | 5.3% |
| Local Government Employees | 322 | 25.8% |
| State Government Employees | 0 | 0.0% |
| Federal Government Employees | 34 | 2.7% |
| Unpaid Family Workers | 0 | 0.0% |
| Total | 1,247 | 100.0% |
Employment Status by Age in deCordova
According to the labor force statistics for deCordova, out of the total population over 16 years of age (2,530), 51.4% or 1,300 individuals are in the labor force, with 4.2% or 55 of them unemployed. The age group with the highest labor force participation rate is 16 to 19 years, with 100.0% or 47 individuals in the labor force. Within the labor force, the 30 to 34 years age range has the highest percentage of unemployed individuals, with 20.0% or 26 of them being unemployed.
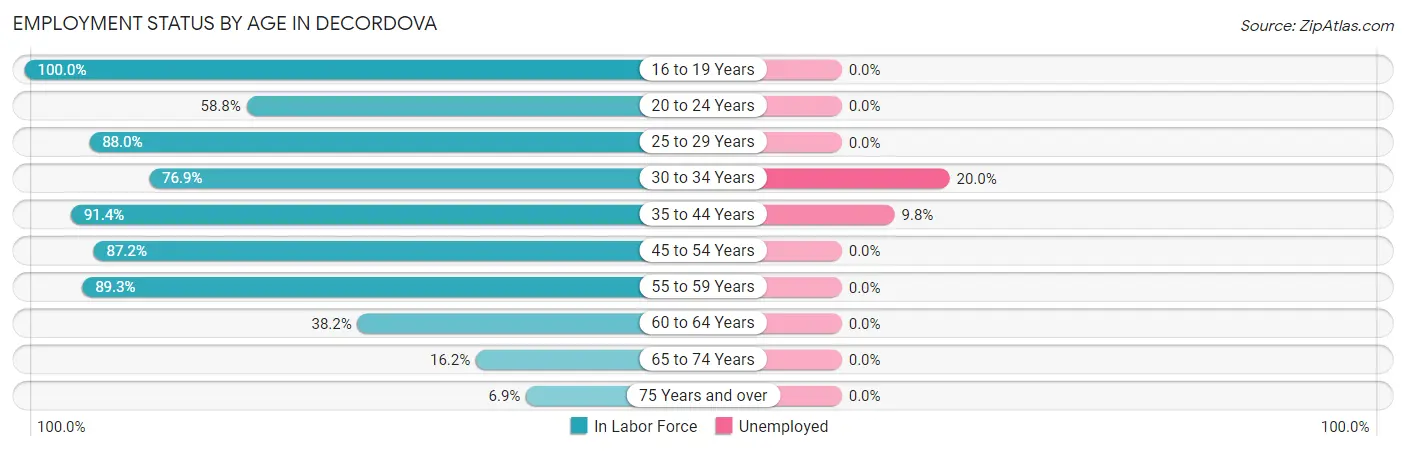
| Age Bracket | In Labor Force | Unemployed |
| 16 to 19 Years | 47 (100.0%) | 0 (0.0%) |
| 20 to 24 Years | 30 (58.8%) | 0 (0.0%) |
| 25 to 29 Years | 168 (88.0%) | 0 (0.0%) |
| 30 to 34 Years | 130 (76.9%) | 26 (20.0%) |
| 35 to 44 Years | 286 (91.4%) | 28 (9.8%) |
| 45 to 54 Years | 251 (87.2%) | 0 (0.0%) |
| 55 to 59 Years | 125 (89.3%) | 0 (0.0%) |
| 60 to 64 Years | 157 (38.2%) | 0 (0.0%) |
| 65 to 74 Years | 76 (16.2%) | 0 (0.0%) |
| 75 Years and over | 31 (6.9%) | 0 (0.0%) |
| Total | 1,300 (51.4%) | 55 (4.2%) |
Employment Status by Educational Attainment in deCordova
According to labor force statistics for deCordova, 73.9% of individuals (1,117) out of the total population between 25 and 64 years of age (1,512) are in the labor force, with 4.8% or 54 of them being unemployed. The group with the highest labor force participation rate are those with the educational attainment of college / associate degree, with 76.7% or 388 individuals in the labor force. Within the labor force, individuals with high school diploma education have the highest percentage of unemployment, with 37.1% or 26 of them being unemployed.
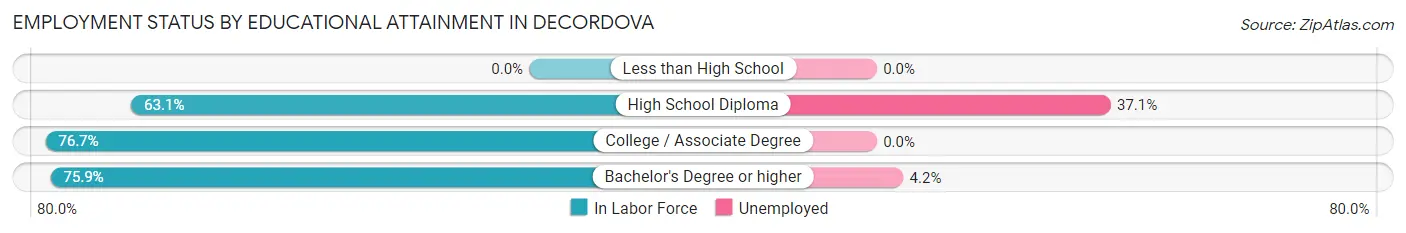
| Educational Attainment | In Labor Force | Unemployed |
| Less than High School | 0 (0.0%) | 0 (0.0%) |
| High School Diploma | 70 (63.1%) | 41 (37.1%) |
| College / Associate Degree | 388 (76.7%) | 0 (0.0%) |
| Bachelor's Degree or higher | 659 (75.9%) | 36 (4.2%) |
| Total | 1,117 (73.9%) | 73 (4.8%) |
Employment Occupations by Sex in deCordova
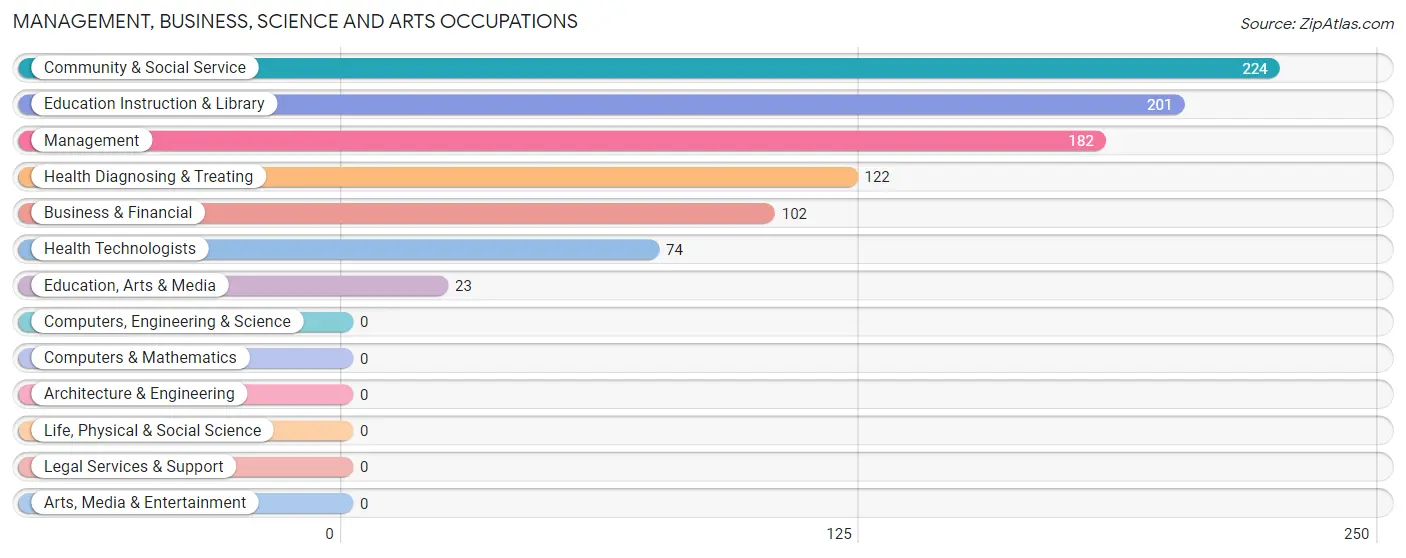
Management, Business, Science and Arts Occupations
The most common Management, Business, Science and Arts occupations in deCordova are Community & Social Service (224 | 18.0%), Education Instruction & Library (201 | 16.1%), Management (182 | 14.6%), Health Diagnosing & Treating (122 | 9.8%), and Business & Financial (102 | 8.2%).
Management, Business, Science and Arts Occupations by Sex
Within the Management, Business, Science and Arts occupations in deCordova, the most male-oriented occupations are Education, Arts & Media (100.0%), Management (76.9%), and Health Technologists (41.9%), while the most female-oriented occupations are Education Instruction & Library (85.6%), Community & Social Service (76.8%), and Business & Financial (66.7%).
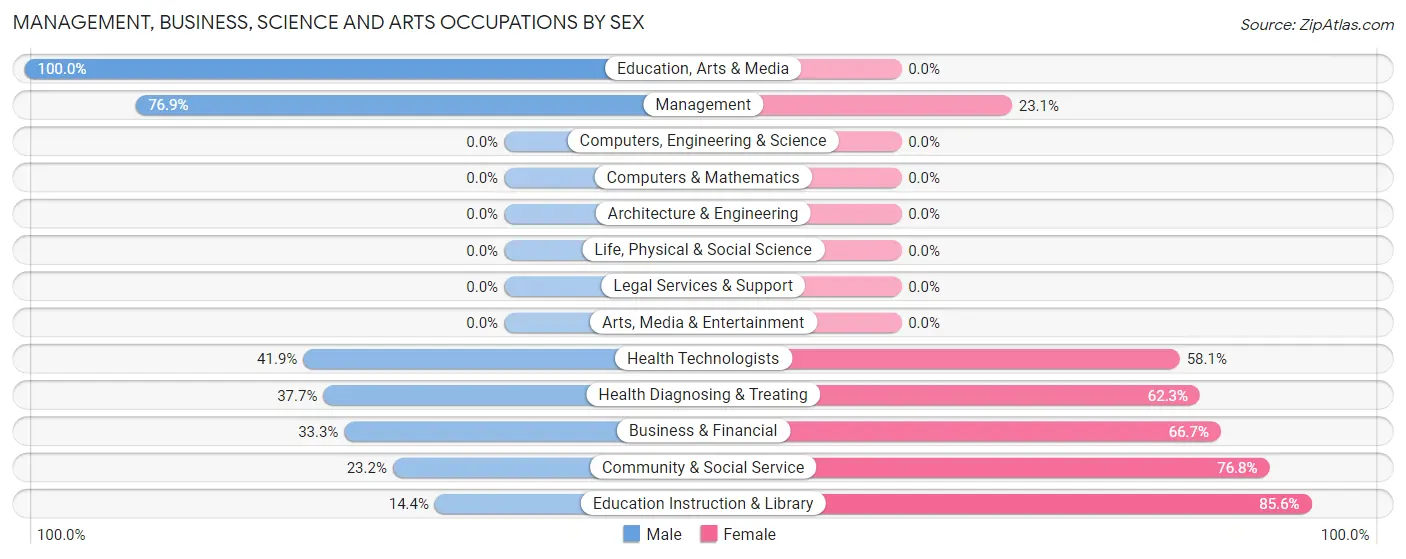
| Occupation | Male | Female |
| Management | 140 (76.9%) | 42 (23.1%) |
| Business & Financial | 34 (33.3%) | 68 (66.7%) |
| Computers, Engineering & Science | 0 (0.0%) | 0 (0.0%) |
| Computers & Mathematics | 0 (0.0%) | 0 (0.0%) |
| Architecture & Engineering | 0 (0.0%) | 0 (0.0%) |
| Life, Physical & Social Science | 0 (0.0%) | 0 (0.0%) |
| Community & Social Service | 52 (23.2%) | 172 (76.8%) |
| Education, Arts & Media | 23 (100.0%) | 0 (0.0%) |
| Legal Services & Support | 0 (0.0%) | 0 (0.0%) |
| Education Instruction & Library | 29 (14.4%) | 172 (85.6%) |
| Arts, Media & Entertainment | 0 (0.0%) | 0 (0.0%) |
| Health Diagnosing & Treating | 46 (37.7%) | 76 (62.3%) |
| Health Technologists | 31 (41.9%) | 43 (58.1%) |
| Total (Category) | 272 (43.2%) | 358 (56.8%) |
| Total (Overall) | 730 (58.5%) | 517 (41.5%) |
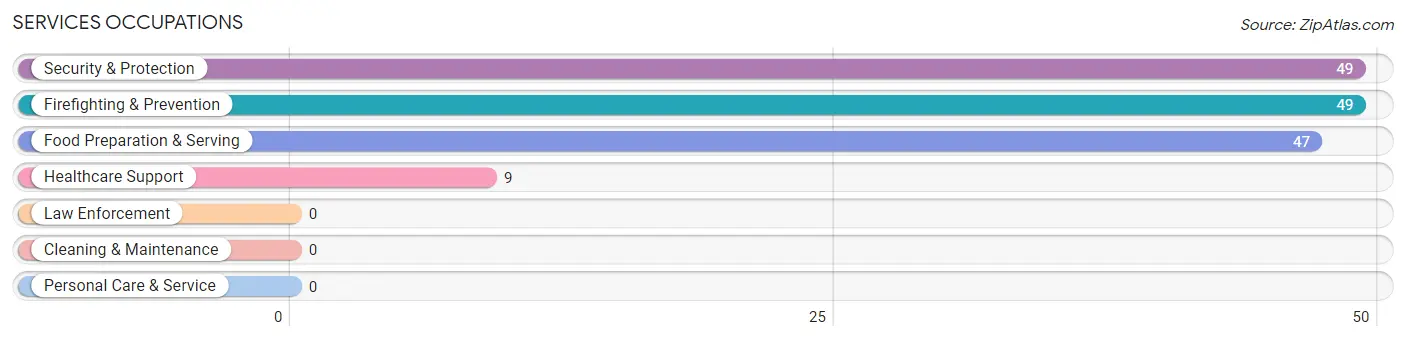
Services Occupations
The most common Services occupations in deCordova are Security & Protection (49 | 3.9%), Firefighting & Prevention (49 | 3.9%), Food Preparation & Serving (47 | 3.8%), and Healthcare Support (9 | 0.7%).
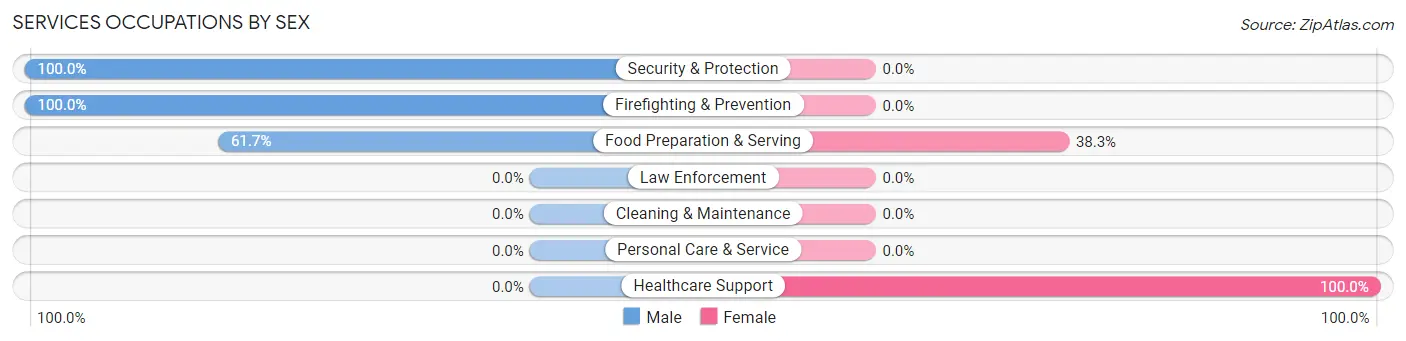
Services Occupations by Sex
Within the Services occupations in deCordova, the most male-oriented occupations are Security & Protection (100.0%), Firefighting & Prevention (100.0%), and Food Preparation & Serving (61.7%), while the most female-oriented occupations are Healthcare Support (100.0%), and Food Preparation & Serving (38.3%).
| Occupation | Male | Female |
| Healthcare Support | 0 (0.0%) | 9 (100.0%) |
| Security & Protection | 49 (100.0%) | 0 (0.0%) |
| Firefighting & Prevention | 49 (100.0%) | 0 (0.0%) |
| Law Enforcement | 0 (0.0%) | 0 (0.0%) |
| Food Preparation & Serving | 29 (61.7%) | 18 (38.3%) |
| Cleaning & Maintenance | 0 (0.0%) | 0 (0.0%) |
| Personal Care & Service | 0 (0.0%) | 0 (0.0%) |
| Total (Category) | 78 (74.3%) | 27 (25.7%) |
| Total (Overall) | 730 (58.5%) | 517 (41.5%) |
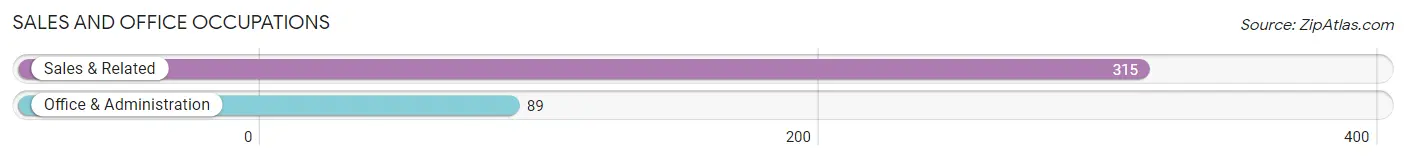
Sales and Office Occupations
The most common Sales and Office occupations in deCordova are Sales & Related (315 | 25.3%), and Office & Administration (89 | 7.1%).
Sales and Office Occupations by Sex
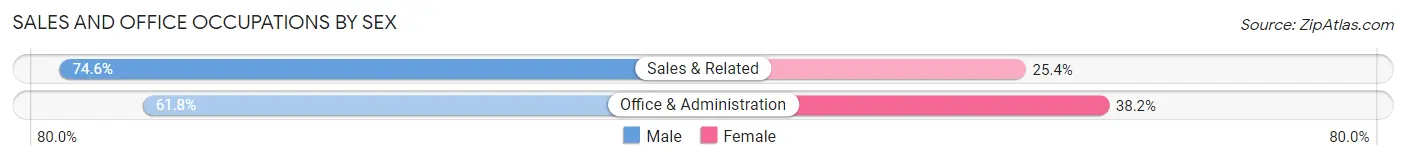
| Occupation | Male | Female |
| Sales & Related | 235 (74.6%) | 80 (25.4%) |
| Office & Administration | 55 (61.8%) | 34 (38.2%) |
| Total (Category) | 290 (71.8%) | 114 (28.2%) |
| Total (Overall) | 730 (58.5%) | 517 (41.5%) |
Natural Resources, Construction and Maintenance Occupations
Natural Resources, Construction and Maintenance Occupations by Sex
| Occupation | Male | Female |
| Farming, Fishing & Forestry | 0 (0.0%) | 0 (0.0%) |
| Construction & Extraction | 0 (0.0%) | 0 (0.0%) |
| Installation, Maintenance & Repair | 0 (0.0%) | 0 (0.0%) |
| Total (Category) | 0 (0.0%) | 0 (0.0%) |
| Total (Overall) | 730 (58.5%) | 517 (41.5%) |
Production, Transportation and Moving Occupations
The most common Production, Transportation and Moving occupations in deCordova are , and Transportation (108 | 8.7%).
Production, Transportation and Moving Occupations by Sex
| Occupation | Male | Female |
| Production | 0 (0.0%) | 0 (0.0%) |
| Transportation | 90 (83.3%) | 18 (16.7%) |
| Material Moving | 0 (0.0%) | 0 (0.0%) |
| Total (Category) | 90 (83.3%) | 18 (16.7%) |
| Total (Overall) | 730 (58.5%) | 517 (41.5%) |
Employment Industries by Sex in deCordova
Employment Industries in deCordova
The major employment industries in deCordova include Educational Services (262 | 21.0%), Transportation & Warehousing (158 | 12.7%), Health Care & Social Assistance (150 | 12.0%), Public Administration (143 | 11.5%), and Retail Trade (122 | 9.8%).
Employment Industries by Sex in deCordova
The deCordova industries that see more men than women are Construction (100.0%), Manufacturing (100.0%), and Accommodation & Food Services (100.0%), whereas the industries that tend to have a higher number of women are Mining, Quarrying, & Extraction (100.0%), Real Estate, Rental & Leasing (100.0%), and Arts, Entertainment & Recreation (100.0%).
| Industry | Male | Female |
| Agriculture, Fishing & Hunting | 0 (0.0%) | 0 (0.0%) |
| Mining, Quarrying, & Extraction | 0 (0.0%) | 28 (100.0%) |
| Construction | 23 (100.0%) | 0 (0.0%) |
| Manufacturing | 19 (100.0%) | 0 (0.0%) |
| Wholesale Trade | 78 (85.7%) | 13 (14.3%) |
| Retail Trade | 90 (73.8%) | 32 (26.2%) |
| Transportation & Warehousing | 120 (75.9%) | 38 (24.0%) |
| Utilities | 0 (0.0%) | 0 (0.0%) |
| Information | 40 (81.6%) | 9 (18.4%) |
| Finance & Insurance | 26 (29.9%) | 61 (70.1%) |
| Real Estate, Rental & Leasing | 0 (0.0%) | 14 (100.0%) |
| Professional & Scientific | 13 (39.4%) | 20 (60.6%) |
| Enterprise Management | 0 (0.0%) | 0 (0.0%) |
| Administrative & Support | 0 (0.0%) | 0 (0.0%) |
| Educational Services | 59 (22.5%) | 203 (77.5%) |
| Health Care & Social Assistance | 69 (46.0%) | 81 (54.0%) |
| Arts, Entertainment & Recreation | 0 (0.0%) | 18 (100.0%) |
| Accommodation & Food Services | 29 (100.0%) | 0 (0.0%) |
| Public Administration | 143 (100.0%) | 0 (0.0%) |
| Total | 730 (58.5%) | 517 (41.5%) |
Education in deCordova
School Enrollment in deCordova
The most common levels of schooling among the 615 students in deCordova are elementary school (143 | 23.3%), high school (122 | 19.8%), and nursery / preschool (111 | 18.0%).
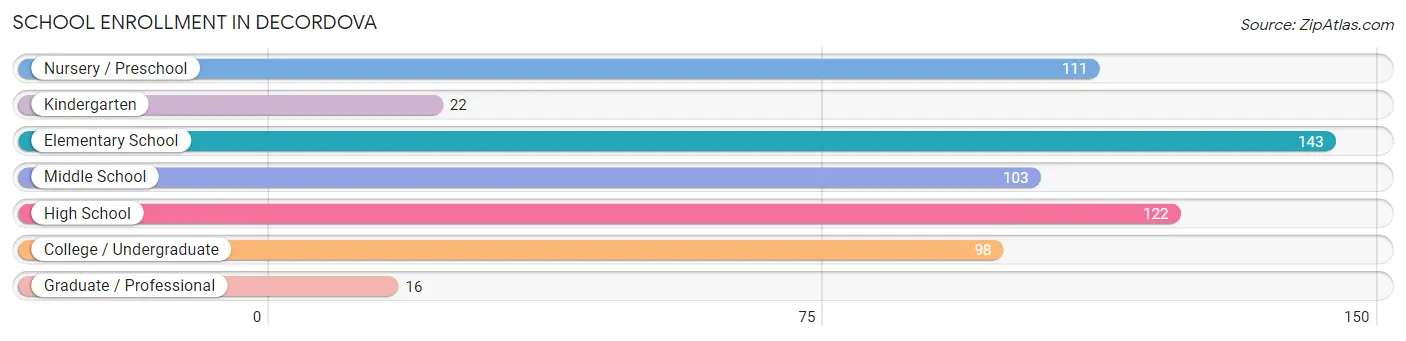
| School Level | # Students | % Students |
| Nursery / Preschool | 111 | 18.0% |
| Kindergarten | 22 | 3.6% |
| Elementary School | 143 | 23.3% |
| Middle School | 103 | 16.8% |
| High School | 122 | 19.8% |
| College / Undergraduate | 98 | 15.9% |
| Graduate / Professional | 16 | 2.6% |
| Total | 615 | 100.0% |
School Enrollment by Age by Funding Source in deCordova
Out of a total of 615 students who are enrolled in schools in deCordova, 117 (19.0%) attend a private institution, while the remaining 498 (81.0%) are enrolled in public schools. The age group of 3 to 4 year olds has the highest likelihood of being enrolled in private schools, with 76 (100.0% in the age bracket) enrolled. Conversely, the age group of 5 to 9 year old has the lowest likelihood of being enrolled in a private school, with 200 (100.0% in the age bracket) attending a public institution.
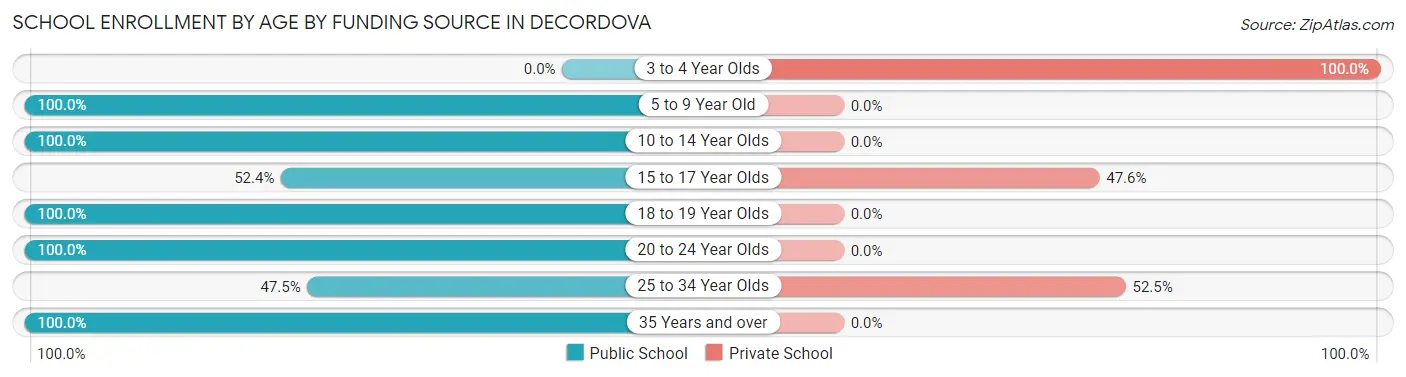
| Age Bracket | Public School | Private School |
| 3 to 4 Year Olds | 0 (0.0%) | 76 (100.0%) |
| 5 to 9 Year Old | 200 (100.0%) | 0 (0.0%) |
| 10 to 14 Year Olds | 156 (100.0%) | 0 (0.0%) |
| 15 to 17 Year Olds | 22 (52.4%) | 20 (47.6%) |
| 18 to 19 Year Olds | 27 (100.0%) | 0 (0.0%) |
| 20 to 24 Year Olds | 30 (100.0%) | 0 (0.0%) |
| 25 to 34 Year Olds | 19 (47.5%) | 21 (52.5%) |
| 35 Years and over | 44 (100.0%) | 0 (0.0%) |
| Total | 498 (81.0%) | 117 (19.0%) |
Educational Attainment by Field of Study in deCordova
Business (341 | 24.2%), arts & humanities (223 | 15.8%), engineering (191 | 13.6%), science & technology (128 | 9.1%), and liberal arts & history (112 | 8.0%) are the most common fields of study among 1,408 individuals in deCordova who have obtained a bachelor's degree or higher.
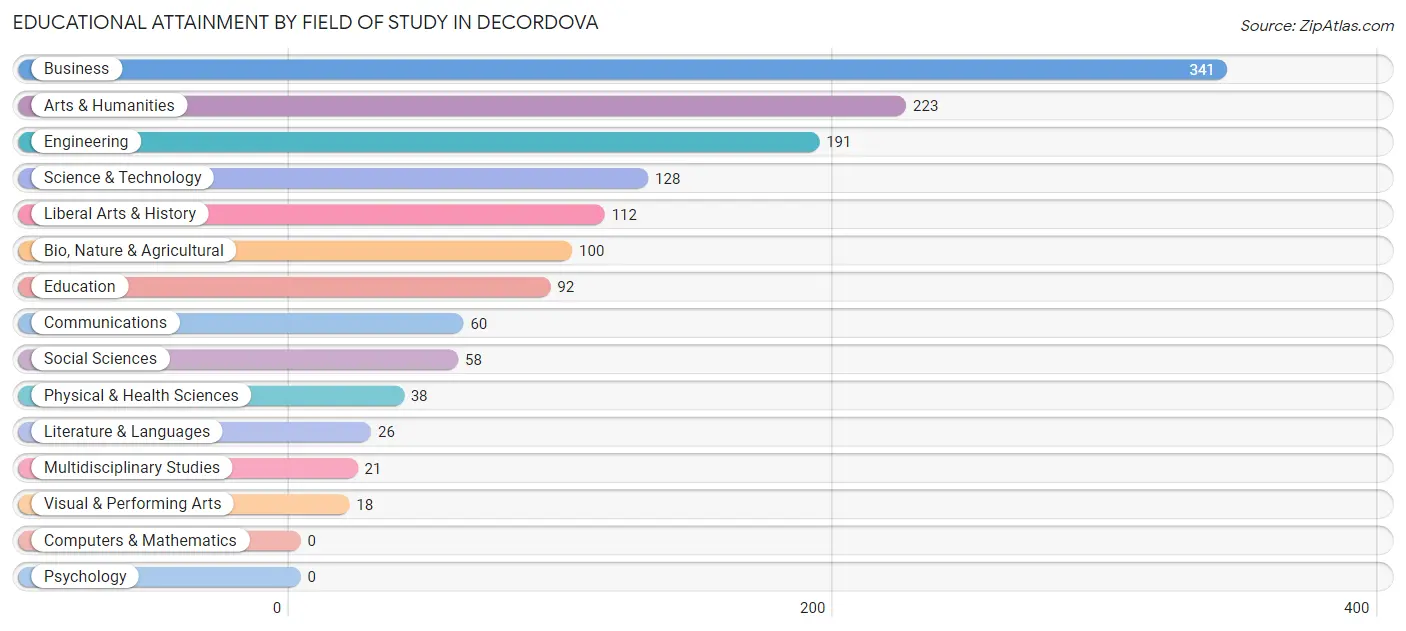
| Field of Study | # Graduates | % Graduates |
| Computers & Mathematics | 0 | 0.0% |
| Bio, Nature & Agricultural | 100 | 7.1% |
| Physical & Health Sciences | 38 | 2.7% |
| Psychology | 0 | 0.0% |
| Social Sciences | 58 | 4.1% |
| Engineering | 191 | 13.6% |
| Multidisciplinary Studies | 21 | 1.5% |
| Science & Technology | 128 | 9.1% |
| Business | 341 | 24.2% |
| Education | 92 | 6.5% |
| Literature & Languages | 26 | 1.8% |
| Liberal Arts & History | 112 | 8.0% |
| Visual & Performing Arts | 18 | 1.3% |
| Communications | 60 | 4.3% |
| Arts & Humanities | 223 | 15.8% |
| Total | 1,408 | 100.0% |
Transportation & Commute in deCordova
Vehicle Availability by Sex in deCordova
The most prevalent vehicle ownership categories in deCordova are males with 2 vehicles (478, accounting for 65.5%) and females with 2 vehicles (353, making up 92.5%).
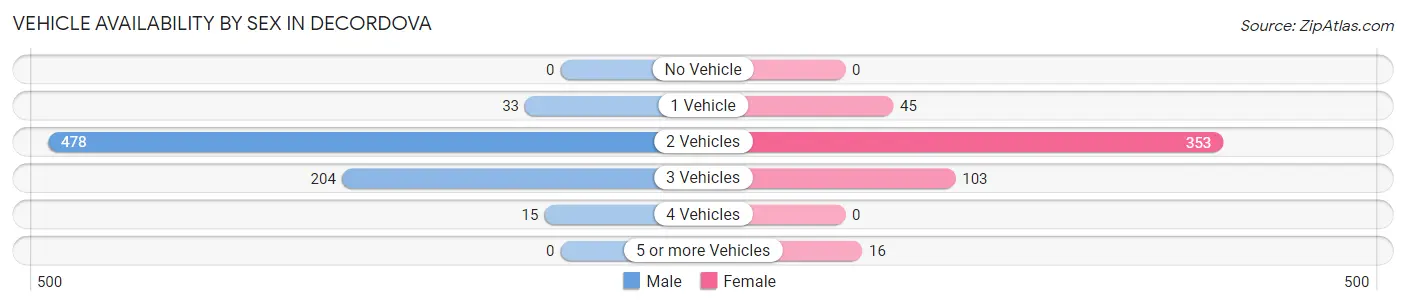
| Vehicles Available | Male | Female |
| No Vehicle | 0 (0.0%) | 0 (0.0%) |
| 1 Vehicle | 33 (4.5%) | 45 (8.7%) |
| 2 Vehicles | 478 (65.5%) | 353 (68.3%) |
| 3 Vehicles | 204 (28.0%) | 103 (19.9%) |
| 4 Vehicles | 15 (2.1%) | 0 (0.0%) |
| 5 or more Vehicles | 0 (0.0%) | 16 (3.1%) |
| Total | 730 (100.0%) | 517 (100.0%) |
Commute Time in deCordova
The most frequently occuring commute durations in deCordova are 45 to 59 minutes (241 commuters, 20.9%), 10 to 14 minutes (190 commuters, 16.5%), and 15 to 19 minutes (139 commuters, 12.1%).
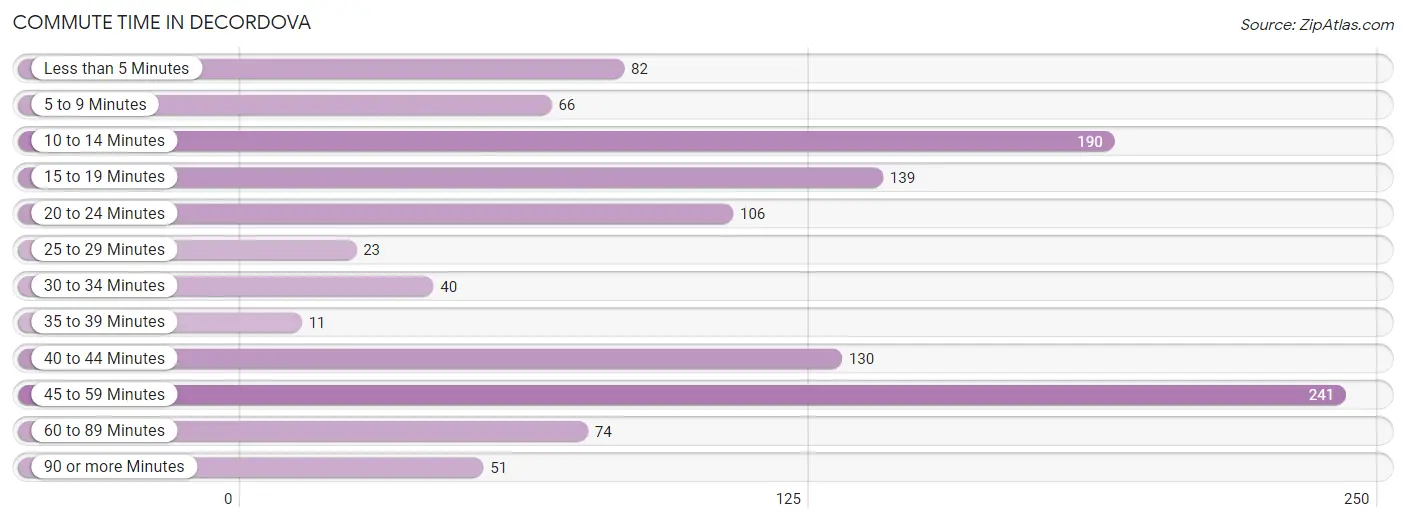
| Commute Time | # Commuters | % Commuters |
| Less than 5 Minutes | 82 | 7.1% |
| 5 to 9 Minutes | 66 | 5.7% |
| 10 to 14 Minutes | 190 | 16.5% |
| 15 to 19 Minutes | 139 | 12.1% |
| 20 to 24 Minutes | 106 | 9.2% |
| 25 to 29 Minutes | 23 | 2.0% |
| 30 to 34 Minutes | 40 | 3.5% |
| 35 to 39 Minutes | 11 | 0.9% |
| 40 to 44 Minutes | 130 | 11.3% |
| 45 to 59 Minutes | 241 | 20.9% |
| 60 to 89 Minutes | 74 | 6.4% |
| 90 or more Minutes | 51 | 4.4% |
Commute Time by Sex in deCordova
The most common commute times in deCordova are 45 to 59 minutes (141 commuters, 19.9%) for males and 45 to 59 minutes (100 commuters, 22.4%) for females.
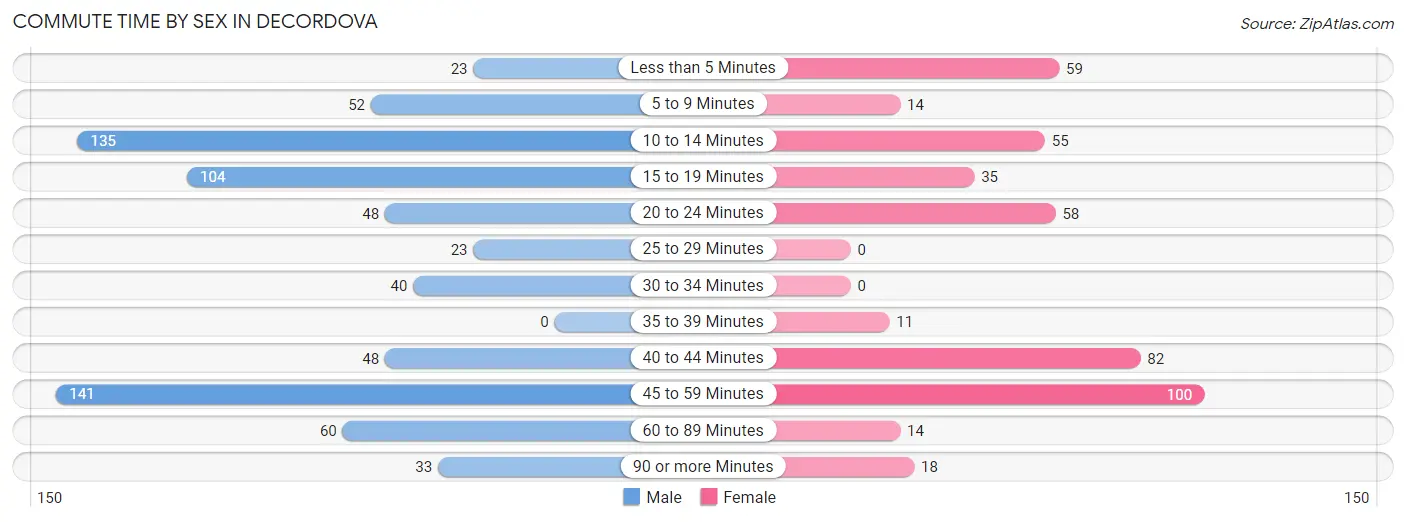
| Commute Time | Male | Female |
| Less than 5 Minutes | 23 (3.3%) | 59 (13.2%) |
| 5 to 9 Minutes | 52 (7.4%) | 14 (3.1%) |
| 10 to 14 Minutes | 135 (19.1%) | 55 (12.3%) |
| 15 to 19 Minutes | 104 (14.7%) | 35 (7.9%) |
| 20 to 24 Minutes | 48 (6.8%) | 58 (13.0%) |
| 25 to 29 Minutes | 23 (3.3%) | 0 (0.0%) |
| 30 to 34 Minutes | 40 (5.7%) | 0 (0.0%) |
| 35 to 39 Minutes | 0 (0.0%) | 11 (2.5%) |
| 40 to 44 Minutes | 48 (6.8%) | 82 (18.4%) |
| 45 to 59 Minutes | 141 (19.9%) | 100 (22.4%) |
| 60 to 89 Minutes | 60 (8.5%) | 14 (3.1%) |
| 90 or more Minutes | 33 (4.7%) | 18 (4.0%) |
Time of Departure to Work by Sex in deCordova
The most frequent times of departure to work in deCordova are 7:30 AM to 7:59 AM (160, 22.6%) for males and 6:30 AM to 6:59 AM (115, 25.8%) for females.
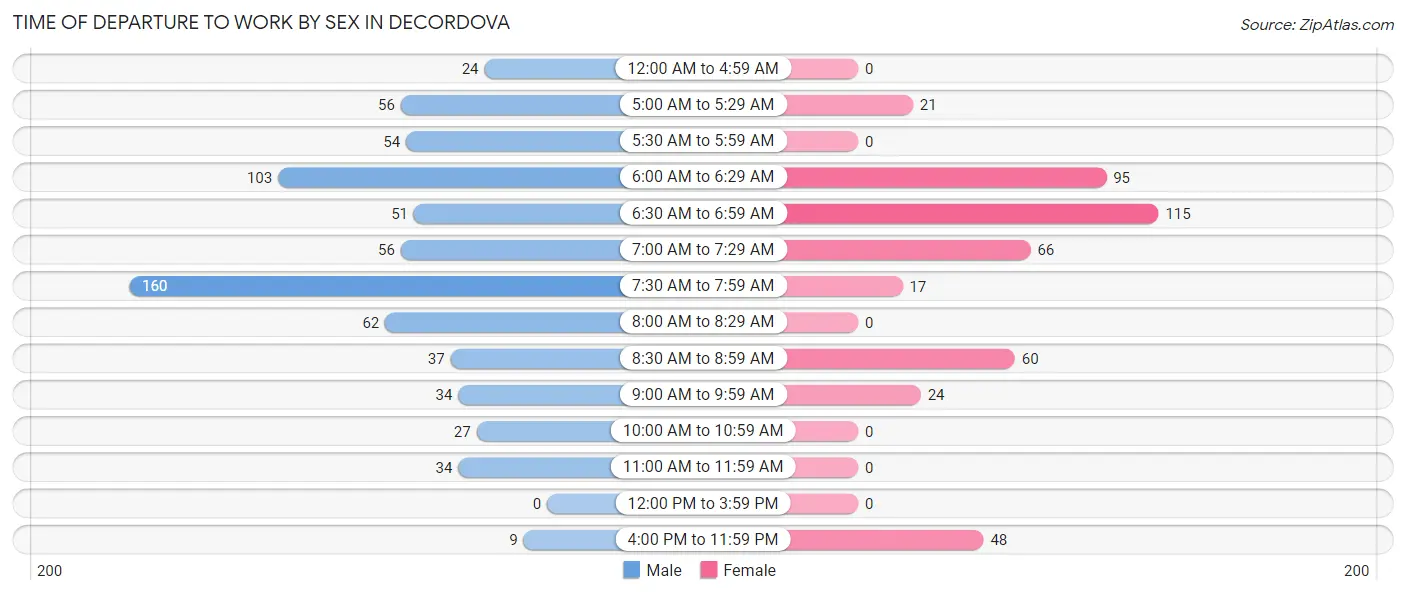
| Time of Departure | Male | Female |
| 12:00 AM to 4:59 AM | 24 (3.4%) | 0 (0.0%) |
| 5:00 AM to 5:29 AM | 56 (7.9%) | 21 (4.7%) |
| 5:30 AM to 5:59 AM | 54 (7.6%) | 0 (0.0%) |
| 6:00 AM to 6:29 AM | 103 (14.6%) | 95 (21.3%) |
| 6:30 AM to 6:59 AM | 51 (7.2%) | 115 (25.8%) |
| 7:00 AM to 7:29 AM | 56 (7.9%) | 66 (14.8%) |
| 7:30 AM to 7:59 AM | 160 (22.6%) | 17 (3.8%) |
| 8:00 AM to 8:29 AM | 62 (8.8%) | 0 (0.0%) |
| 8:30 AM to 8:59 AM | 37 (5.2%) | 60 (13.5%) |
| 9:00 AM to 9:59 AM | 34 (4.8%) | 24 (5.4%) |
| 10:00 AM to 10:59 AM | 27 (3.8%) | 0 (0.0%) |
| 11:00 AM to 11:59 AM | 34 (4.8%) | 0 (0.0%) |
| 12:00 PM to 3:59 PM | 0 (0.0%) | 0 (0.0%) |
| 4:00 PM to 11:59 PM | 9 (1.3%) | 48 (10.8%) |
| Total | 707 (100.0%) | 446 (100.0%) |
Housing Occupancy in deCordova
Occupancy by Ownership in deCordova
Of the total 1,329 dwellings in deCordova, owner-occupied units account for 1,289 (97.0%), while renter-occupied units make up 40 (3.0%).
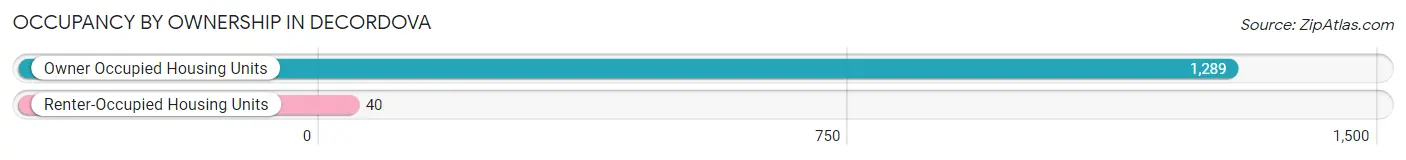
| Occupancy | # Housing Units | % Housing Units |
| Owner Occupied Housing Units | 1,289 | 97.0% |
| Renter-Occupied Housing Units | 40 | 3.0% |
| Total Occupied Housing Units | 1,329 | 100.0% |
Occupancy by Household Size in deCordova
| Household Size | # Housing Units | % Housing Units |
| 1-Person Household | 321 | 24.1% |
| 2-Person Household | 686 | 51.6% |
| 3-Person Household | 120 | 9.0% |
| 4+ Person Household | 202 | 15.2% |
| Total Housing Units | 1,329 | 100.0% |
Occupancy by Ownership by Household Size in deCordova
| Household Size | Owner-occupied | Renter-occupied |
| 1-Person Household | 321 (100.0%) | 0 (0.0%) |
| 2-Person Household | 686 (100.0%) | 0 (0.0%) |
| 3-Person Household | 103 (85.8%) | 17 (14.2%) |
| 4+ Person Household | 179 (88.6%) | 23 (11.4%) |
| Total Housing Units | 1,289 (97.0%) | 40 (3.0%) |
Occupancy by Educational Attainment in deCordova
| Household Size | Owner-occupied | Renter-occupied |
| Less than High School | 0 (0.0%) | 0 (0.0%) |
| High School Diploma | 49 (74.2%) | 17 (25.8%) |
| College/Associate Degree | 513 (100.0%) | 0 (0.0%) |
| Bachelor's Degree or higher | 727 (96.9%) | 23 (3.1%) |
Occupancy by Age of Householder in deCordova
| Age Bracket | # Households | % Households |
| Under 35 Years | 171 | 12.9% |
| 35 to 44 Years | 80 | 6.0% |
| 45 to 54 Years | 178 | 13.4% |
| 55 to 64 Years | 293 | 22.1% |
| 65 to 74 Years | 282 | 21.2% |
| 75 to 84 Years | 242 | 18.2% |
| 85 Years and Over | 83 | 6.2% |
| Total | 1,329 | 100.0% |
Housing Finances in deCordova
Median Income by Occupancy in deCordova
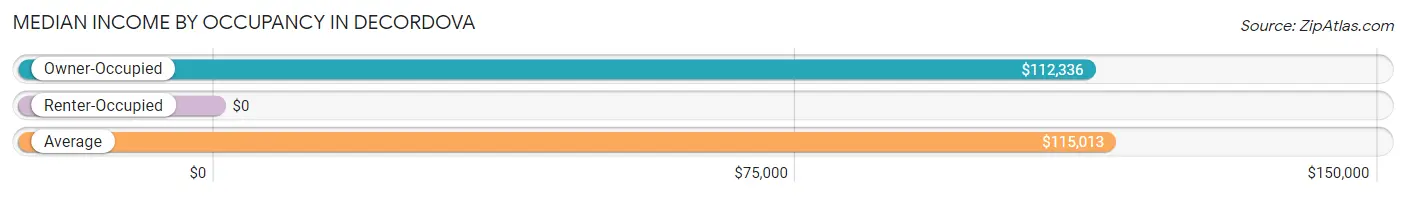
| Occupancy Type | # Households | Median Income |
| Owner-Occupied | 1,289 (97.0%) | $112,336 |
| Renter-Occupied | 40 (3.0%) | $0 |
| Average | 1,329 (100.0%) | $115,013 |
Occupancy by Householder Income Bracket in deCordova
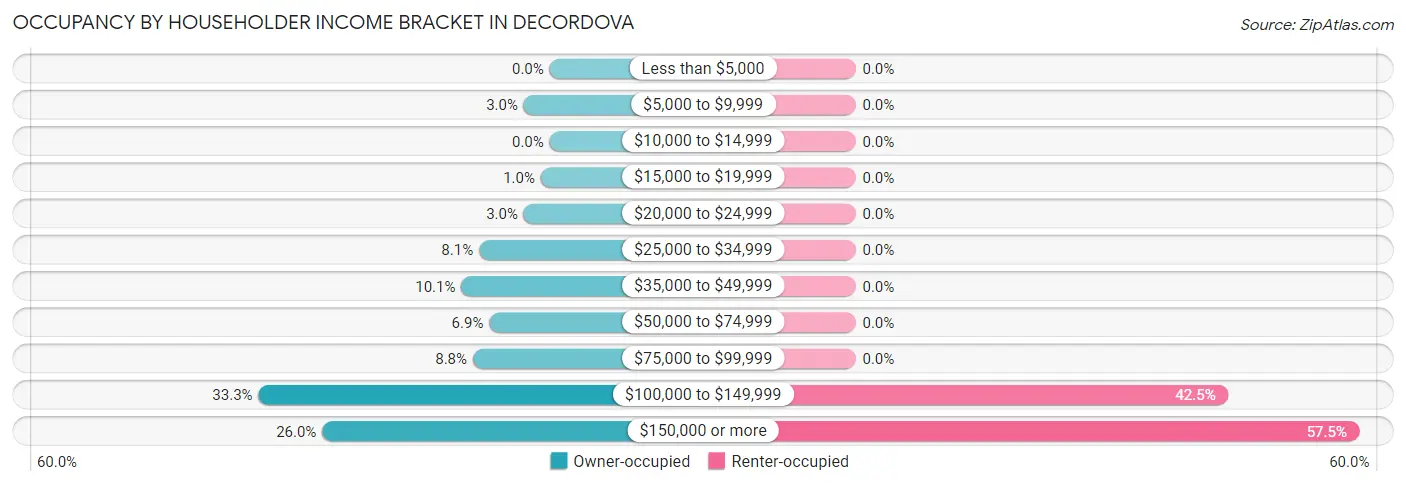
| Income Bracket | Owner-occupied | Renter-occupied |
| Less than $5,000 | 0 (0.0%) | 0 (0.0%) |
| $5,000 to $9,999 | 38 (2.9%) | 0 (0.0%) |
| $10,000 to $14,999 | 0 (0.0%) | 0 (0.0%) |
| $15,000 to $19,999 | 13 (1.0%) | 0 (0.0%) |
| $20,000 to $24,999 | 38 (2.9%) | 0 (0.0%) |
| $25,000 to $34,999 | 104 (8.1%) | 0 (0.0%) |
| $35,000 to $49,999 | 130 (10.1%) | 0 (0.0%) |
| $50,000 to $74,999 | 89 (6.9%) | 0 (0.0%) |
| $75,000 to $99,999 | 113 (8.8%) | 0 (0.0%) |
| $100,000 to $149,999 | 429 (33.3%) | 17 (42.5%) |
| $150,000 or more | 335 (26.0%) | 23 (57.5%) |
| Total | 1,289 (100.0%) | 40 (100.0%) |
Monthly Housing Cost Tiers in deCordova
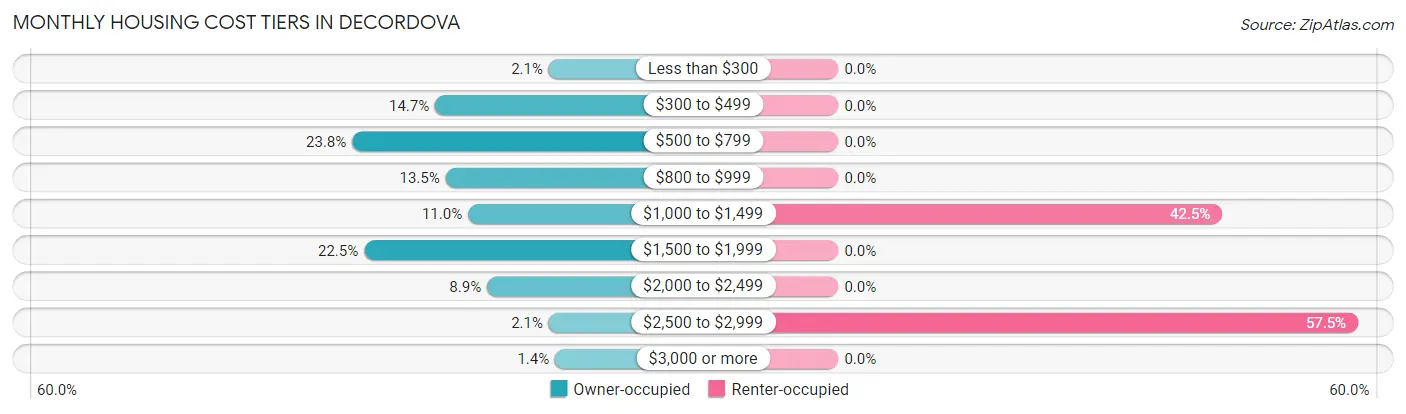
| Monthly Cost | Owner-occupied | Renter-occupied |
| Less than $300 | 27 (2.1%) | 0 (0.0%) |
| $300 to $499 | 189 (14.7%) | 0 (0.0%) |
| $500 to $799 | 307 (23.8%) | 0 (0.0%) |
| $800 to $999 | 174 (13.5%) | 0 (0.0%) |
| $1,000 to $1,499 | 142 (11.0%) | 17 (42.5%) |
| $1,500 to $1,999 | 290 (22.5%) | 0 (0.0%) |
| $2,000 to $2,499 | 115 (8.9%) | 0 (0.0%) |
| $2,500 to $2,999 | 27 (2.1%) | 23 (57.5%) |
| $3,000 or more | 18 (1.4%) | 0 (0.0%) |
| Total | 1,289 (100.0%) | 40 (100.0%) |
Physical Housing Characteristics in deCordova
Housing Structures in deCordova
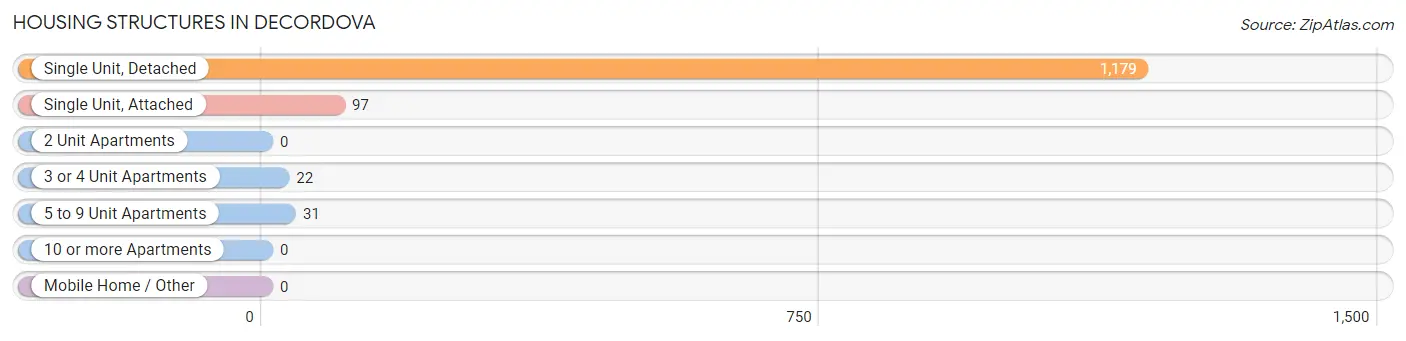
| Structure Type | # Housing Units | % Housing Units |
| Single Unit, Detached | 1,179 | 88.7% |
| Single Unit, Attached | 97 | 7.3% |
| 2 Unit Apartments | 0 | 0.0% |
| 3 or 4 Unit Apartments | 22 | 1.7% |
| 5 to 9 Unit Apartments | 31 | 2.3% |
| 10 or more Apartments | 0 | 0.0% |
| Mobile Home / Other | 0 | 0.0% |
| Total | 1,329 | 100.0% |
Housing Structures by Occupancy in deCordova
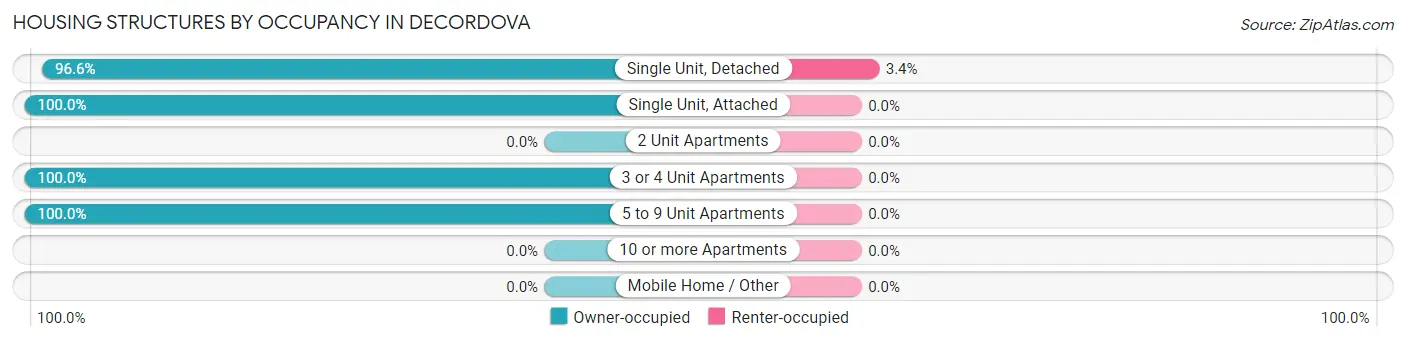
| Structure Type | Owner-occupied | Renter-occupied |
| Single Unit, Detached | 1,139 (96.6%) | 40 (3.4%) |
| Single Unit, Attached | 97 (100.0%) | 0 (0.0%) |
| 2 Unit Apartments | 0 (0.0%) | 0 (0.0%) |
| 3 or 4 Unit Apartments | 22 (100.0%) | 0 (0.0%) |
| 5 to 9 Unit Apartments | 31 (100.0%) | 0 (0.0%) |
| 10 or more Apartments | 0 (0.0%) | 0 (0.0%) |
| Mobile Home / Other | 0 (0.0%) | 0 (0.0%) |
| Total | 1,289 (97.0%) | 40 (3.0%) |
Housing Structures by Number of Rooms in deCordova
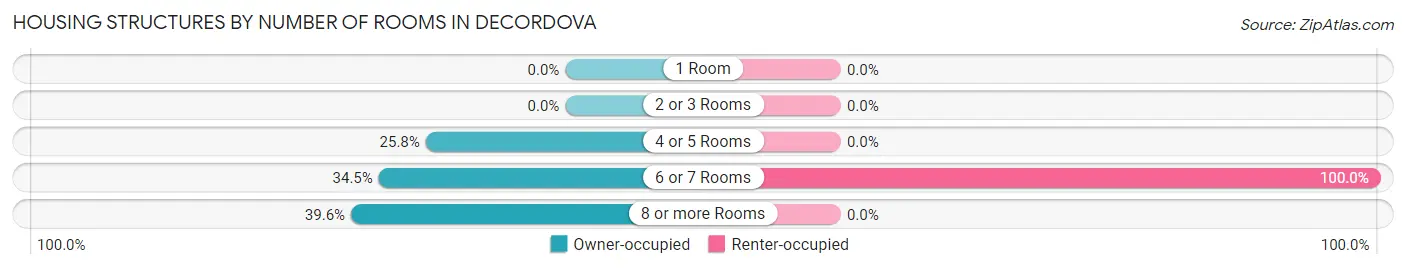
| Number of Rooms | Owner-occupied | Renter-occupied |
| 1 Room | 0 (0.0%) | 0 (0.0%) |
| 2 or 3 Rooms | 0 (0.0%) | 0 (0.0%) |
| 4 or 5 Rooms | 333 (25.8%) | 0 (0.0%) |
| 6 or 7 Rooms | 445 (34.5%) | 40 (100.0%) |
| 8 or more Rooms | 511 (39.6%) | 0 (0.0%) |
| Total | 1,289 (100.0%) | 40 (100.0%) |
Housing Structure by Heating Type in deCordova
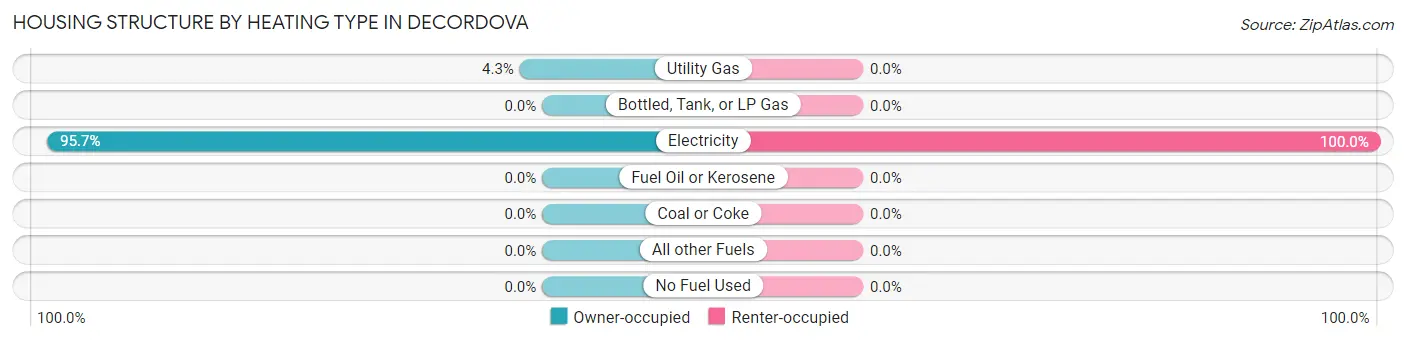
| Heating Type | Owner-occupied | Renter-occupied |
| Utility Gas | 56 (4.3%) | 0 (0.0%) |
| Bottled, Tank, or LP Gas | 0 (0.0%) | 0 (0.0%) |
| Electricity | 1,233 (95.7%) | 40 (100.0%) |
| Fuel Oil or Kerosene | 0 (0.0%) | 0 (0.0%) |
| Coal or Coke | 0 (0.0%) | 0 (0.0%) |
| All other Fuels | 0 (0.0%) | 0 (0.0%) |
| No Fuel Used | 0 (0.0%) | 0 (0.0%) |
| Total | 1,289 (100.0%) | 40 (100.0%) |
Household Vehicle Usage in deCordova
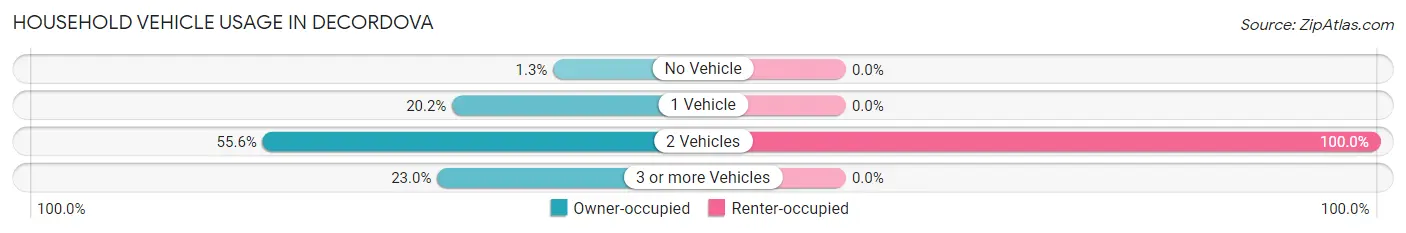
| Vehicles per Household | Owner-occupied | Renter-occupied |
| No Vehicle | 17 (1.3%) | 0 (0.0%) |
| 1 Vehicle | 260 (20.2%) | 0 (0.0%) |
| 2 Vehicles | 716 (55.5%) | 40 (100.0%) |
| 3 or more Vehicles | 296 (23.0%) | 0 (0.0%) |
| Total | 1,289 (100.0%) | 40 (100.0%) |
Real Estate & Mortgages in deCordova
Real Estate and Mortgage Overview in deCordova
| Characteristic | Without Mortgage | With Mortgage |
| Housing Units | 744 | 545 |
| Median Property Value | $284,400 | $303,300 |
| Median Household Income | $86,029 | $235 |
| Monthly Housing Costs | $641 | $18 |
| Real Estate Taxes | $3,088 | $0 |
Property Value by Mortgage Status in deCordova
| Property Value | Without Mortgage | With Mortgage |
| Less than $50,000 | 36 (4.8%) | 0 (0.0%) |
| $50,000 to $99,999 | 12 (1.6%) | 0 (0.0%) |
| $100,000 to $299,999 | 358 (48.1%) | 269 (49.4%) |
| $300,000 to $499,999 | 270 (36.3%) | 214 (39.3%) |
| $500,000 to $749,999 | 39 (5.2%) | 62 (11.4%) |
| $750,000 to $999,999 | 16 (2.1%) | 0 (0.0%) |
| $1,000,000 or more | 13 (1.8%) | 0 (0.0%) |
| Total | 744 (100.0%) | 545 (100.0%) |
Household Income by Mortgage Status in deCordova
| Household Income | Without Mortgage | With Mortgage |
| Less than $10,000 | 38 (5.1%) | 0 (0.0%) |
| $10,000 to $24,999 | 51 (6.9%) | 0 (0.0%) |
| $25,000 to $34,999 | 104 (14.0%) | 0 (0.0%) |
| $35,000 to $49,999 | 116 (15.6%) | 0 (0.0%) |
| $50,000 to $74,999 | 56 (7.5%) | 14 (2.6%) |
| $75,000 to $99,999 | 49 (6.6%) | 33 (6.1%) |
| $100,000 to $149,999 | 230 (30.9%) | 64 (11.7%) |
| $150,000 or more | 100 (13.4%) | 199 (36.5%) |
| Total | 744 (100.0%) | 545 (100.0%) |
Property Value to Household Income Ratio in deCordova
| Value-to-Income Ratio | Without Mortgage | With Mortgage |
| Less than 2.0x | 117 (15.7%) | 137,183 (25,171.2%) |
| 2.0x to 2.9x | 163 (21.9%) | 182 (33.4%) |
| 3.0x to 3.9x | 110 (14.8%) | 171 (31.4%) |
| 4.0x or more | 354 (47.6%) | 117 (21.5%) |
| Total | 744 (100.0%) | 545 (100.0%) |
Real Estate Taxes by Mortgage Status in deCordova
| Property Taxes | Without Mortgage | With Mortgage |
| Less than $800 | 33 (4.4%) | 0 (0.0%) |
| $800 to $1,499 | 84 (11.3%) | 0 (0.0%) |
| $800 to $1,499 | 627 (84.3%) | 30 (5.5%) |
| Total | 744 (100.0%) | 545 (100.0%) |
Health & Disability in deCordova
Health Insurance Coverage by Age in deCordova
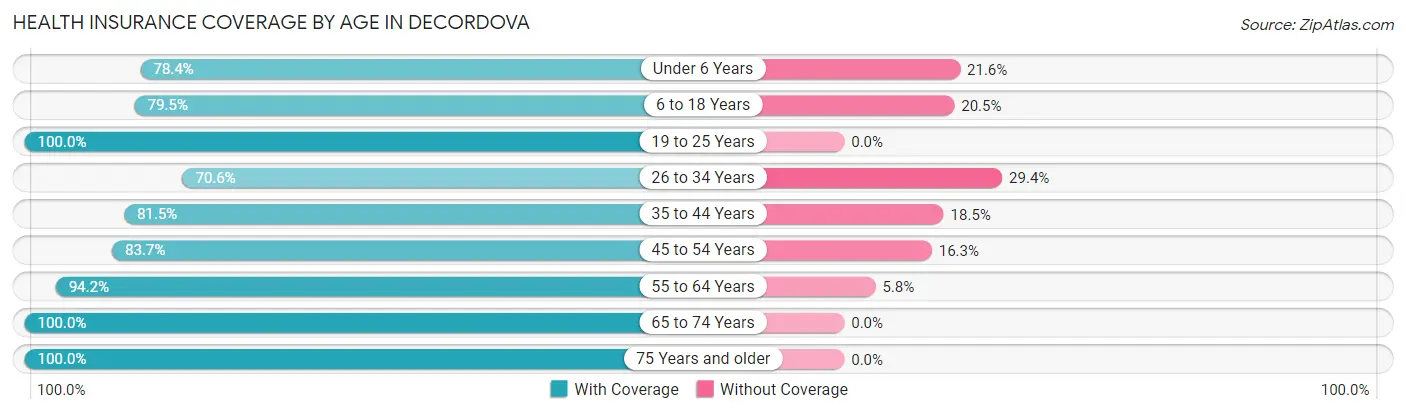
| Age Bracket | With Coverage | Without Coverage |
| Under 6 Years | 127 (78.4%) | 35 (21.6%) |
| 6 to 18 Years | 310 (79.5%) | 80 (20.5%) |
| 19 to 25 Years | 51 (100.0%) | 0 (0.0%) |
| 26 to 34 Years | 254 (70.6%) | 106 (29.4%) |
| 35 to 44 Years | 255 (81.5%) | 58 (18.5%) |
| 45 to 54 Years | 241 (83.7%) | 47 (16.3%) |
| 55 to 64 Years | 519 (94.2%) | 32 (5.8%) |
| 65 to 74 Years | 468 (100.0%) | 0 (0.0%) |
| 75 Years and older | 452 (100.0%) | 0 (0.0%) |
| Total | 2,677 (88.2%) | 358 (11.8%) |
Health Insurance Coverage by Citizenship Status in deCordova
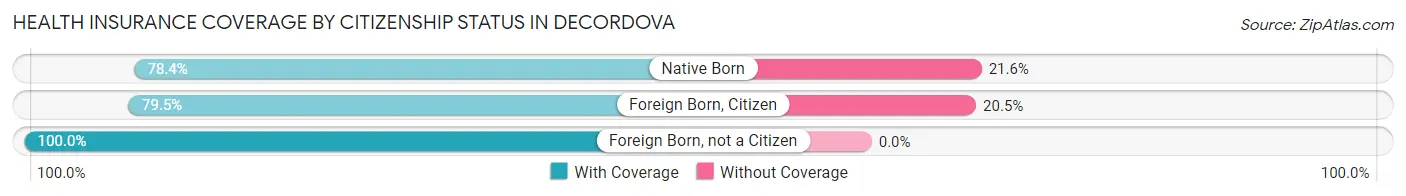
| Citizenship Status | With Coverage | Without Coverage |
| Native Born | 127 (78.4%) | 35 (21.6%) |
| Foreign Born, Citizen | 310 (79.5%) | 80 (20.5%) |
| Foreign Born, not a Citizen | 51 (100.0%) | 0 (0.0%) |
Health Insurance Coverage by Household Income in deCordova
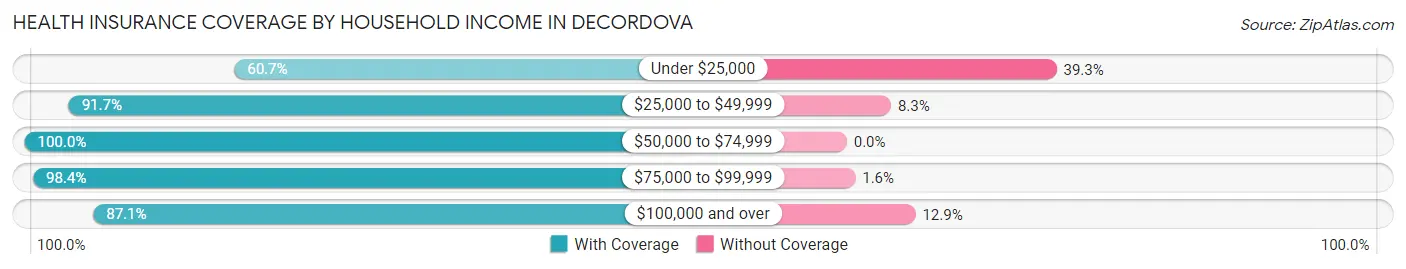
| Household Income | With Coverage | Without Coverage |
| Under $25,000 | 68 (60.7%) | 44 (39.3%) |
| $25,000 to $49,999 | 266 (91.7%) | 24 (8.3%) |
| $50,000 to $74,999 | 158 (100.0%) | 0 (0.0%) |
| $75,000 to $99,999 | 248 (98.4%) | 4 (1.6%) |
| $100,000 and over | 1,937 (87.1%) | 286 (12.9%) |
Public vs Private Health Insurance Coverage by Age in deCordova
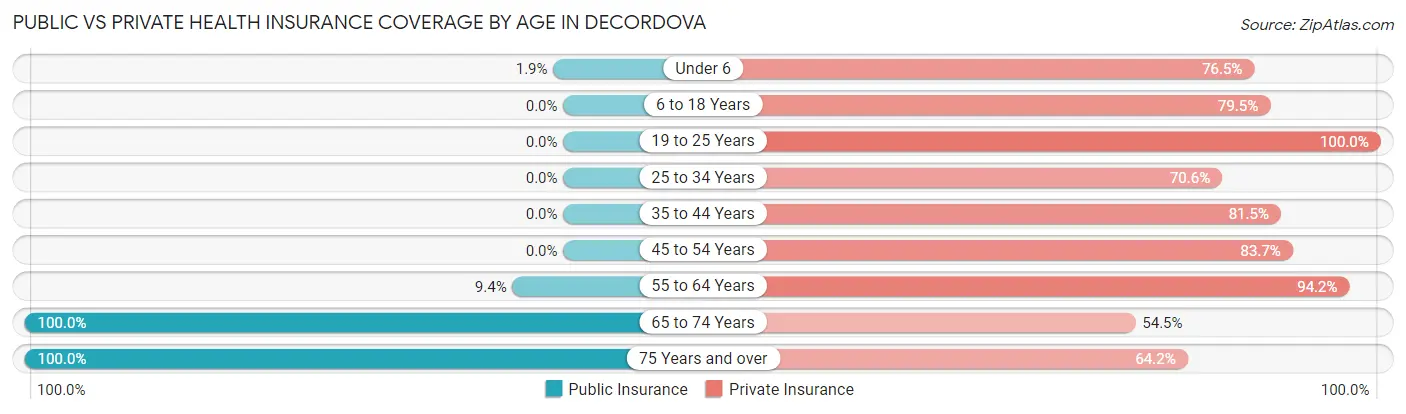
| Age Bracket | Public Insurance | Private Insurance |
| Under 6 | 3 (1.8%) | 124 (76.5%) |
| 6 to 18 Years | 0 (0.0%) | 310 (79.5%) |
| 19 to 25 Years | 0 (0.0%) | 51 (100.0%) |
| 25 to 34 Years | 0 (0.0%) | 254 (70.6%) |
| 35 to 44 Years | 0 (0.0%) | 255 (81.5%) |
| 45 to 54 Years | 0 (0.0%) | 241 (83.7%) |
| 55 to 64 Years | 52 (9.4%) | 519 (94.2%) |
| 65 to 74 Years | 468 (100.0%) | 255 (54.5%) |
| 75 Years and over | 452 (100.0%) | 290 (64.2%) |
| Total | 975 (32.1%) | 2,299 (75.7%) |
Disability Status by Sex by Age in deCordova
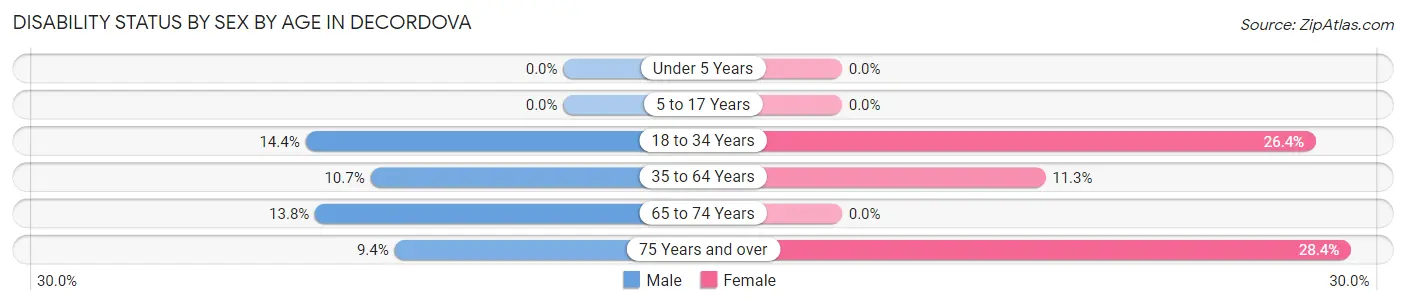
| Age Bracket | Male | Female |
| Under 5 Years | 0 (0.0%) | 0 (0.0%) |
| 5 to 17 Years | 0 (0.0%) | 0 (0.0%) |
| 18 to 34 Years | 27 (14.4%) | 66 (26.4%) |
| 35 to 64 Years | 64 (10.7%) | 63 (11.3%) |
| 65 to 74 Years | 38 (13.8%) | 0 (0.0%) |
| 75 Years and over | 11 (9.4%) | 95 (28.4%) |
Disability Class by Sex by Age in deCordova
Disability Class: Hearing Difficulty
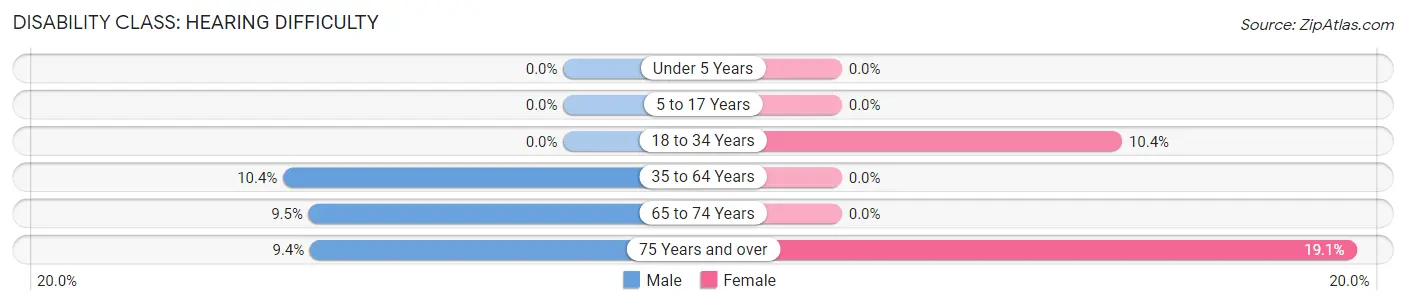
| Age Bracket | Male | Female |
| Under 5 Years | 0 (0.0%) | 0 (0.0%) |
| 5 to 17 Years | 0 (0.0%) | 0 (0.0%) |
| 18 to 34 Years | 0 (0.0%) | 26 (10.4%) |
| 35 to 64 Years | 62 (10.4%) | 0 (0.0%) |
| 65 to 74 Years | 26 (9.5%) | 0 (0.0%) |
| 75 Years and over | 11 (9.4%) | 64 (19.1%) |
Disability Class: Vision Difficulty
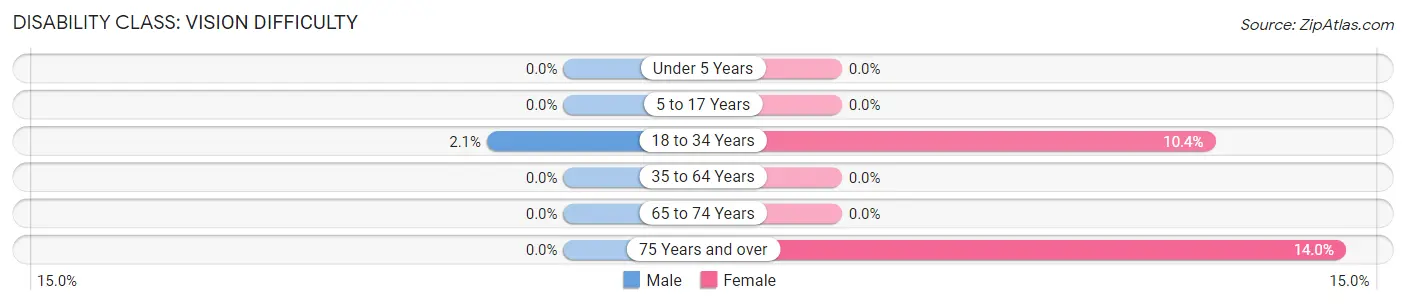
| Age Bracket | Male | Female |
| Under 5 Years | 0 (0.0%) | 0 (0.0%) |
| 5 to 17 Years | 0 (0.0%) | 0 (0.0%) |
| 18 to 34 Years | 4 (2.1%) | 26 (10.4%) |
| 35 to 64 Years | 0 (0.0%) | 0 (0.0%) |
| 65 to 74 Years | 0 (0.0%) | 0 (0.0%) |
| 75 Years and over | 0 (0.0%) | 47 (14.0%) |
Disability Class: Cognitive Difficulty
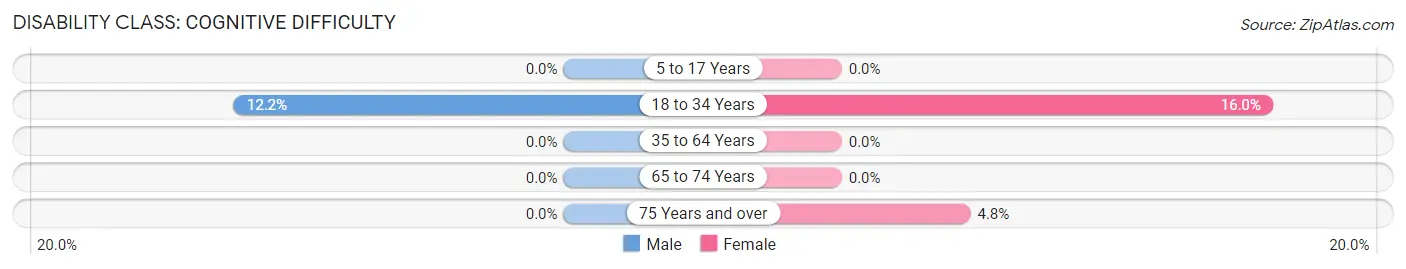
| Age Bracket | Male | Female |
| 5 to 17 Years | 0 (0.0%) | 0 (0.0%) |
| 18 to 34 Years | 23 (12.2%) | 40 (16.0%) |
| 35 to 64 Years | 0 (0.0%) | 0 (0.0%) |
| 65 to 74 Years | 0 (0.0%) | 0 (0.0%) |
| 75 Years and over | 0 (0.0%) | 16 (4.8%) |
Disability Class: Ambulatory Difficulty
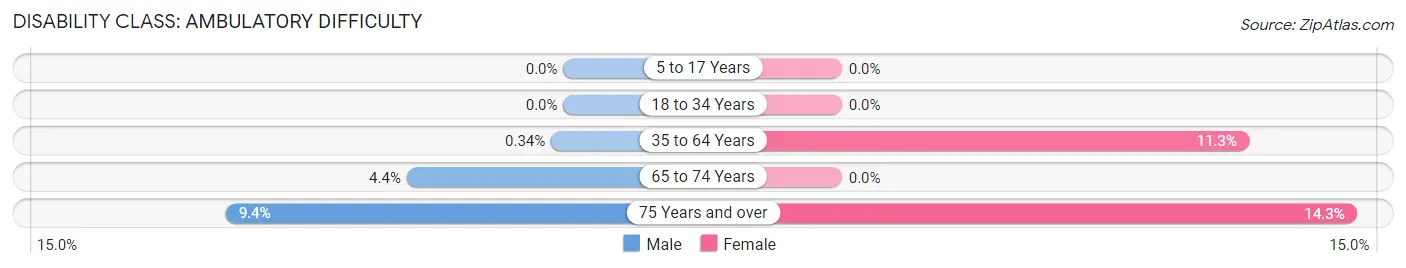
| Age Bracket | Male | Female |
| 5 to 17 Years | 0 (0.0%) | 0 (0.0%) |
| 18 to 34 Years | 0 (0.0%) | 0 (0.0%) |
| 35 to 64 Years | 2 (0.3%) | 63 (11.3%) |
| 65 to 74 Years | 12 (4.4%) | 0 (0.0%) |
| 75 Years and over | 11 (9.4%) | 48 (14.3%) |
Disability Class: Self-Care Difficulty
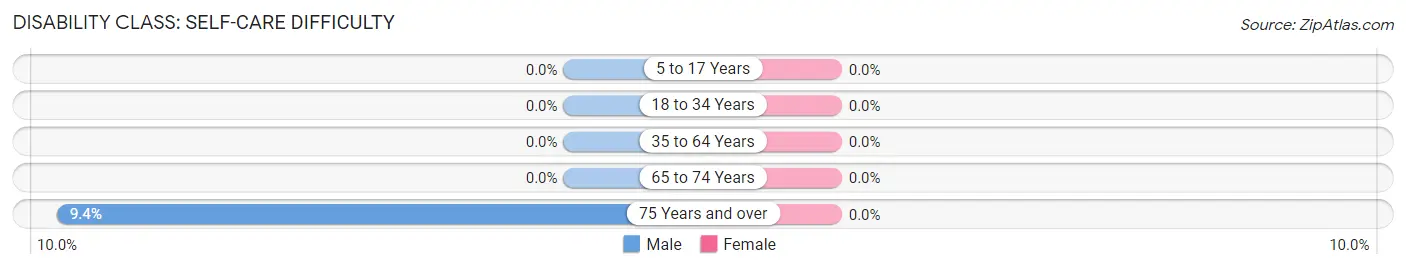
| Age Bracket | Male | Female |
| 5 to 17 Years | 0 (0.0%) | 0 (0.0%) |
| 18 to 34 Years | 0 (0.0%) | 0 (0.0%) |
| 35 to 64 Years | 0 (0.0%) | 0 (0.0%) |
| 65 to 74 Years | 0 (0.0%) | 0 (0.0%) |
| 75 Years and over | 11 (9.4%) | 0 (0.0%) |
Technology Access in deCordova
Computing Device Access in deCordova
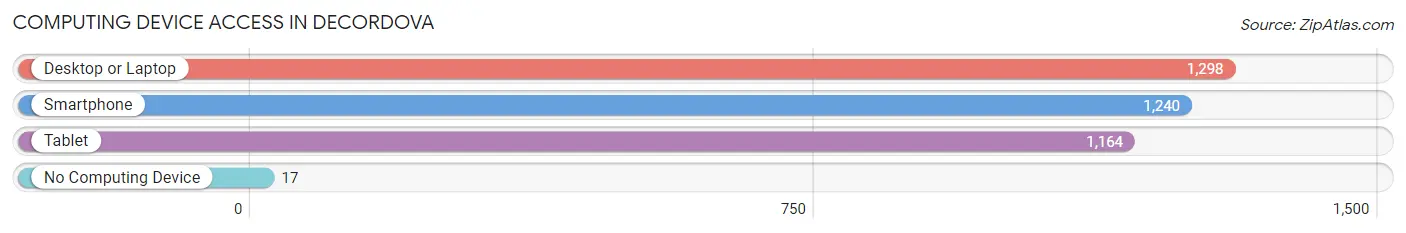
| Device Type | # Households | % Households |
| Desktop or Laptop | 1,298 | 97.7% |
| Smartphone | 1,240 | 93.3% |
| Tablet | 1,164 | 87.6% |
| No Computing Device | 17 | 1.3% |
| Total | 1,329 | 100.0% |
Internet Access in deCordova
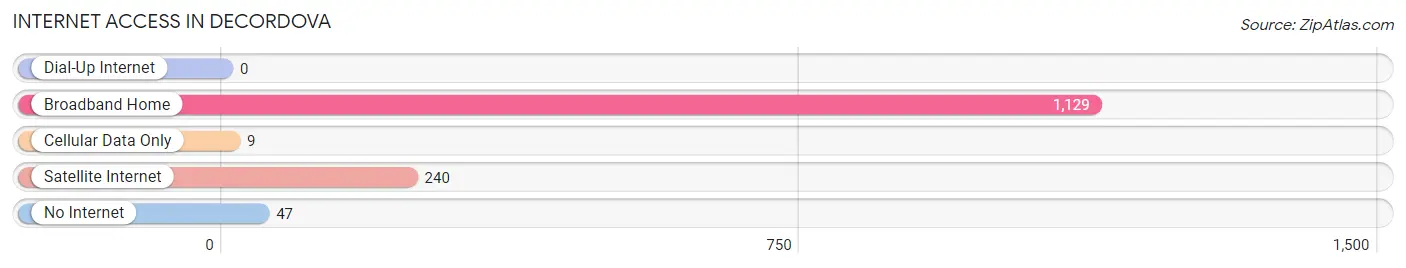
| Internet Type | # Households | % Households |
| Dial-Up Internet | 0 | 0.0% |
| Broadband Home | 1,129 | 85.0% |
| Cellular Data Only | 9 | 0.7% |
| Satellite Internet | 240 | 18.1% |
| No Internet | 47 | 3.5% |
| Total | 1,329 | 100.0% |
deCordova Summary
Decordova, Texas is a small town located in Hood County, Texas. It is situated about 25 miles southwest of Fort Worth and is part of the Dallas-Fort Worth-Arlington metropolitan area. The town was founded in 1881 and was named after the Decordova family, who were early settlers in the area. The population of Decordova was 1,845 as of the 2010 census.
Geography
Decordova is located at 32°37'45" North, 97°45'45" West (32.629, -97.7625). The town is situated in the rolling hills of the Cross Timbers region of North Central Texas. The terrain is mostly flat with some rolling hills. The elevation of Decordova is 845 feet above sea level. The town is located in the Brazos River watershed.
The climate of Decordova is classified as humid subtropical. Summers are hot and humid, with temperatures reaching into the 90s. Winters are mild, with temperatures rarely dropping below freezing. The average annual precipitation is 36.5 inches.
Economy
The economy of Decordova is largely based on agriculture. The town is home to several farms and ranches, which produce a variety of crops, including cotton, corn, wheat, and hay. The town also has a small manufacturing sector, which produces a variety of products, including furniture, clothing, and food products.
The town is also home to several small businesses, including restaurants, retail stores, and service providers. The town is served by several major highways, including Interstate 20, US Highway 377, and State Highway 171.
Demographics
As of the 2010 census, the population of Decordova was 1,845. The racial makeup of the town was 94.3% White, 0.7% African American, 0.3% Native American, 0.2% Asian, 0.1% Pacific Islander, 2.7% from other races, and 1.9% from two or more races. Hispanic or Latino of any race were 5.3% of the population.
The median household income in Decordova was $41,250, and the median family income was $45,938. The per capita income was $19,945. About 11.3% of families and 13.2% of the population were below the poverty line, including 17.2% of those under age 18 and 8.3% of those age 65 or over.
Education
Decordova is served by the Decordova-Fossil Ridge Independent School District. The district has one elementary school, one middle school, and one high school. The town is also home to several private schools, including a Catholic school and a Christian school.
Conclusion
Decordova, Texas is a small town located in Hood County, Texas. It is situated about 25 miles southwest of Fort Worth and is part of the Dallas-Fort Worth-Arlington metropolitan area. The town was founded in 1881 and was named after the Decordova family, who were early settlers in the area. The population of Decordova was 1,845 as of the 2010 census. The town is situated in the rolling hills of the Cross Timbers region of North Central Texas. The economy of Decordova is largely based on agriculture, with some manufacturing and small businesses. The racial makeup of the town was 94.3% White, 0.7% African American, 0.3% Native American, 0.2% Asian, 0.1% Pacific Islander, 2.7% from other races, and 1.9% from two or more races. The median household income in Decordova was $41,250, and the median family income was $45,938. The town is served by the Decordova-Fossil Ridge Independent School District. Decordova is a small town with a rich history and a bright future.
Common Questions
What is Per Capita Income in deCordova?
Per Capita income in deCordova is $53,132.
What is the Median Family Income in deCordova?
Median Family Income in deCordova is $130,045.
What is the Median Household income in deCordova?
Median Household Income in deCordova is $115,013.
What is Income or Wage Gap in deCordova?
Income or Wage Gap in deCordova is 15.6%.
Women in deCordova earn 84.4 cents for every dollar earned by a man.
What is Inequality or Gini Index in deCordova?
Inequality or Gini Index in deCordova is 0.36.
What is the Total Population of deCordova?
Total Population of deCordova is 3,035.
What is the Total Male Population of deCordova?
Total Male Population of deCordova is 1,503.
What is the Total Female Population of deCordova?
Total Female Population of deCordova is 1,532.
What is the Ratio of Males per 100 Females in deCordova?
There are 98.11 Males per 100 Females in deCordova.
What is the Ratio of Females per 100 Males in deCordova?
There are 101.93 Females per 100 Males in deCordova.
What is the Median Population Age in deCordova?
Median Population Age in deCordova is 52.1 Years.
What is the Average Family Size in deCordova
Average Family Size in deCordova is 2.7 People.
What is the Average Household Size in deCordova
Average Household Size in deCordova is 2.3 People.
How Large is the Labor Force in deCordova?
There are 1,300 People in the Labor Forcein in deCordova.
What is the Percentage of People in the Labor Force in deCordova?
51.4% of People are in the Labor Force in deCordova.
What is the Unemployment Rate in deCordova?
Unemployment Rate in deCordova is 4.2%.