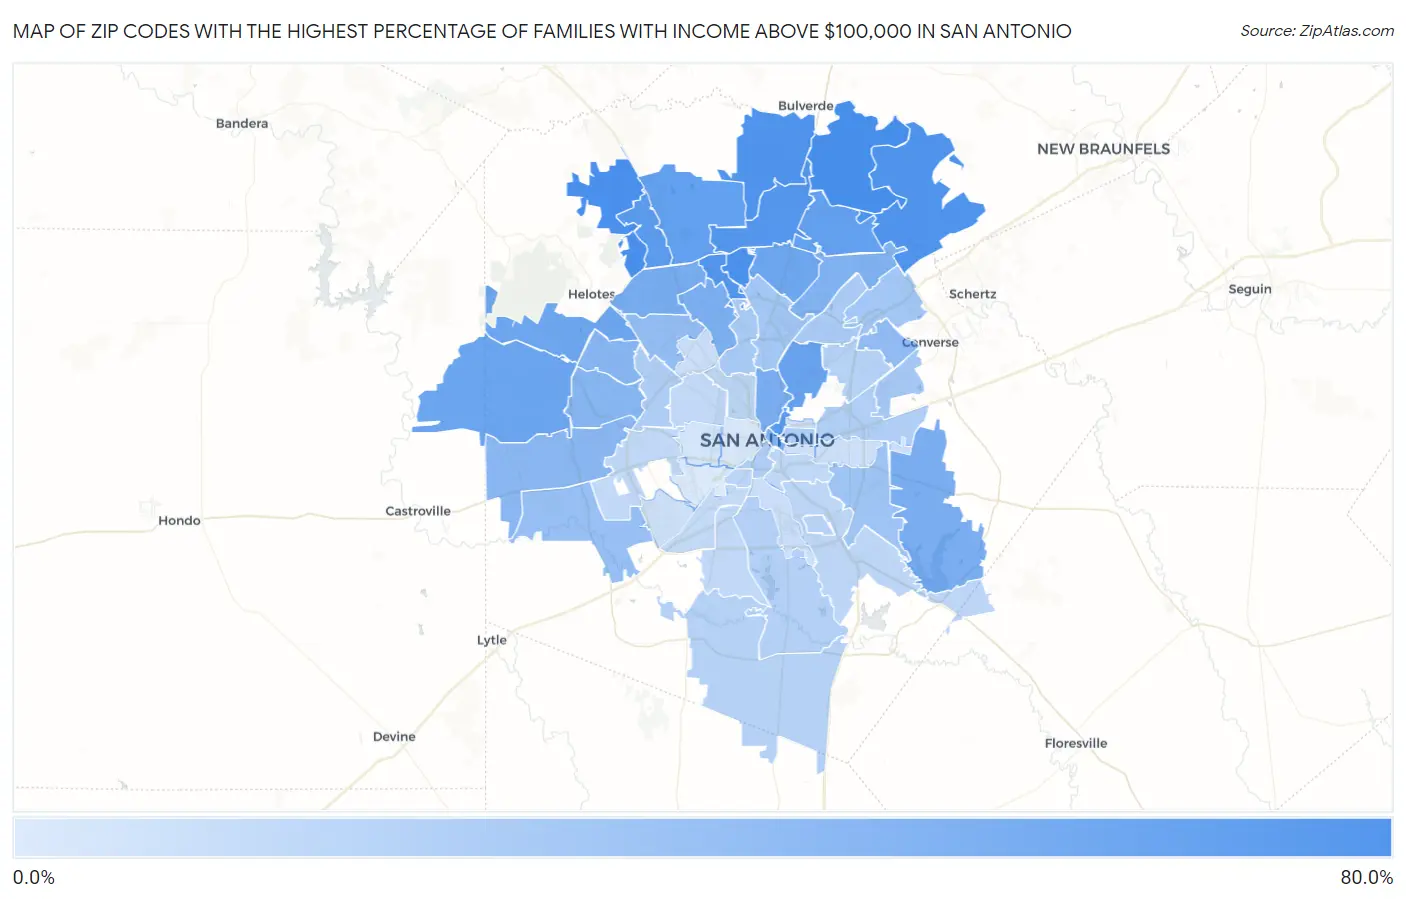
Zip Codes with the Highest Percentage of Families with Income Above $100,000 in San Antonio, TX
RELATED REPORTS & OPTIONS
Family Income | $100k+
San Antonio
Compare Zip Codes
Map of Zip Codes with the Highest Percentage of Families with Income Above $100,000 in San Antonio
8.2%
77.3%
Zip Codes with the Highest Percentage of Families with Income Above $100,000 in San Antonio, TX
| Zip Code | Families with Income > $100k | vs State | vs National | |
| 1. | 78261 | 77.3% | 43.7%(+33.6)#68 | 46.1%(+31.2)#1,363 |
| 2. | 78255 | 76.2% | 43.7%(+32.5)#76 | 46.1%(+30.1)#1,527 |
| 3. | 78248 | 74.9% | 43.7%(+31.2)#83 | 46.1%(+28.8)#1,725 |
| 4. | 78260 | 72.5% | 43.7%(+28.8)#102 | 46.1%(+26.4)#2,132 |
| 5. | 78266 | 72.2% | 43.7%(+28.5)#106 | 46.1%(+26.1)#2,189 |
| 6. | 78231 | 70.8% | 43.7%(+27.1)#118 | 46.1%(+24.7)#2,443 |
| 7. | 78258 | 69.0% | 43.7%(+25.3)#138 | 46.1%(+22.9)#2,814 |
| 8. | 78215 | 66.4% | 43.7%(+22.7)#166 | 46.1%(+20.3)#3,399 |
| 9. | 78256 | 65.3% | 43.7%(+21.6)#178 | 46.1%(+19.2)#3,673 |
| 10. | 78259 | 62.4% | 43.7%(+18.7)#215 | 46.1%(+16.3)#4,448 |
| 11. | 78257 | 62.4% | 43.7%(+18.7)#216 | 46.1%(+16.3)#4,450 |
| 12. | 78209 | 59.6% | 43.7%(+15.9)#262 | 46.1%(+13.5)#5,246 |
| 13. | 78253 | 56.6% | 43.7%(+12.9)#300 | 46.1%(+10.5)#6,213 |
| 14. | 78254 | 56.2% | 43.7%(+12.5)#308 | 46.1%(+10.1)#6,353 |
| 15. | 78232 | 56.1% | 43.7%(+12.4)#314 | 46.1%(+10.0)#6,399 |
| 16. | 78249 | 50.9% | 43.7%(+7.20)#425 | 46.1%(+4.80)#8,441 |
| 17. | 78212 | 50.5% | 43.7%(+6.80)#435 | 46.1%(+4.40)#8,611 |
| 18. | 78263 | 50.5% | 43.7%(+6.80)#437 | 46.1%(+4.40)#8,626 |
| 19. | 78230 | 48.8% | 43.7%(+5.10)#475 | 46.1%(+2.70)#9,348 |
| 20. | 78247 | 46.6% | 43.7%(+2.90)#539 | 46.1%(+0.500)#10,493 |
| 21. | 78205 | 45.6% | 43.7%(+1.90)#573 | 46.1%(-0.500)#11,036 |
| 22. | 78251 | 43.1% | 43.7%(-0.600)#649 | 46.1%(-3.00)#12,409 |
| 23. | 78250 | 42.9% | 43.7%(-0.800)#657 | 46.1%(-3.20)#12,538 |
| 24. | 78245 | 42.2% | 43.7%(-1.50)#685 | 46.1%(-3.90)#12,980 |
| 25. | 78239 | 38.9% | 43.7%(-4.80)#814 | 46.1%(-7.20)#15,143 |
| 26. | 78240 | 37.9% | 43.7%(-5.80)#851 | 46.1%(-8.20)#15,811 |
| 27. | 78252 | 36.4% | 43.7%(-7.30)#906 | 46.1%(-9.70)#16,891 |
| 28. | 78222 | 32.4% | 43.7%(-11.3)#1,082 | 46.1%(-13.7)#19,735 |
| 29. | 78233 | 31.0% | 43.7%(-12.7)#1,146 | 46.1%(-15.1)#20,709 |
| 30. | 78216 | 30.8% | 43.7%(-12.9)#1,157 | 46.1%(-15.3)#20,846 |
| 31. | 78244 | 29.4% | 43.7%(-14.3)#1,224 | 46.1%(-16.7)#21,827 |
| 32. | 78213 | 28.9% | 43.7%(-14.8)#1,242 | 46.1%(-17.2)#22,165 |
| 33. | 78217 | 27.9% | 43.7%(-15.8)#1,297 | 46.1%(-18.2)#22,831 |
| 34. | 78204 | 26.3% | 43.7%(-17.4)#1,348 | 46.1%(-19.8)#23,876 |
| 35. | 78238 | 26.0% | 43.7%(-17.7)#1,365 | 46.1%(-20.1)#24,090 |
| 36. | 78202 | 25.8% | 43.7%(-17.9)#1,372 | 46.1%(-20.3)#24,224 |
| 37. | 78219 | 24.9% | 43.7%(-18.8)#1,411 | 46.1%(-21.2)#24,786 |
| 38. | 78221 | 23.7% | 43.7%(-20.0)#1,463 | 46.1%(-22.4)#25,450 |
| 39. | 78264 | 23.4% | 43.7%(-20.3)#1,470 | 46.1%(-22.7)#25,601 |
| 40. | 78218 | 23.3% | 43.7%(-20.4)#1,474 | 46.1%(-22.8)#25,647 |
| 41. | 78235 | 22.5% | 43.7%(-21.2)#1,504 | 46.1%(-23.6)#26,064 |
| 42. | 78225 | 21.2% | 43.7%(-22.5)#1,537 | 46.1%(-24.9)#26,703 |
| 43. | 78201 | 20.5% | 43.7%(-23.2)#1,554 | 46.1%(-25.6)#27,005 |
| 44. | 78223 | 20.3% | 43.7%(-23.4)#1,558 | 46.1%(-25.8)#27,104 |
| 45. | 78210 | 19.2% | 43.7%(-24.5)#1,590 | 46.1%(-26.9)#27,595 |
| 46. | 78228 | 18.9% | 43.7%(-24.8)#1,599 | 46.1%(-27.2)#27,718 |
| 47. | 78224 | 18.9% | 43.7%(-24.8)#1,601 | 46.1%(-27.2)#27,726 |
| 48. | 78227 | 18.7% | 43.7%(-25.0)#1,605 | 46.1%(-27.4)#27,815 |
| 49. | 78211 | 17.3% | 43.7%(-26.4)#1,636 | 46.1%(-28.8)#28,343 |
| 50. | 78229 | 14.9% | 43.7%(-28.8)#1,677 | 46.1%(-31.2)#29,134 |
| 51. | 78214 | 14.7% | 43.7%(-29.0)#1,681 | 46.1%(-31.4)#29,193 |
| 52. | 78242 | 14.0% | 43.7%(-29.7)#1,701 | 46.1%(-32.1)#29,395 |
| 53. | 78208 | 14.0% | 43.7%(-29.7)#1,702 | 46.1%(-32.1)#29,401 |
| 54. | 78220 | 13.7% | 43.7%(-30.0)#1,704 | 46.1%(-32.4)#29,478 |
| 55. | 78203 | 12.9% | 43.7%(-30.8)#1,725 | 46.1%(-33.2)#29,728 |
| 56. | 78237 | 11.4% | 43.7%(-32.3)#1,742 | 46.1%(-34.7)#30,068 |
| 57. | 78207 | 9.5% | 43.7%(-34.2)#1,766 | 46.1%(-36.6)#30,415 |
| 58. | 78226 | 8.2% | 43.7%(-35.5)#1,778 | 46.1%(-37.9)#30,619 |
1
Common Questions
What are the Top 10 Zip Codes with the Highest Percentage of Families with Income Above $100,000 in San Antonio, TX?
Top 10 Zip Codes with the Highest Percentage of Families with Income Above $100,000 in San Antonio, TX are:
What zip code has the Highest Percentage of Families with Income Above $100,000 in San Antonio, TX?
78261 has the Highest Percentage of Families with Income Above $100,000 in San Antonio, TX with 77.3%.
What is the Percentage of Families with Income Above $100,000 in San Antonio, TX?
Percentage of Families with Income Above $100,000 in San Antonio is 33.5%.
What is the Percentage of Families with Income Above $100,000 in Texas?
Percentage of Families with Income Above $100,000 in Texas is 43.7%.
What is the Percentage of Families with Income Above $100,000 in the United States?
Percentage of Families with Income Above $100,000 in the United States is 46.1%.