Zip Codes with the Highest Percentage of Population Employed in Real Estate, Rental & Leasing in Cookeville, TN
RELATED REPORTS & OPTIONS
Real Estate, Rental & Leasing
Cookeville
Compare Zip Codes
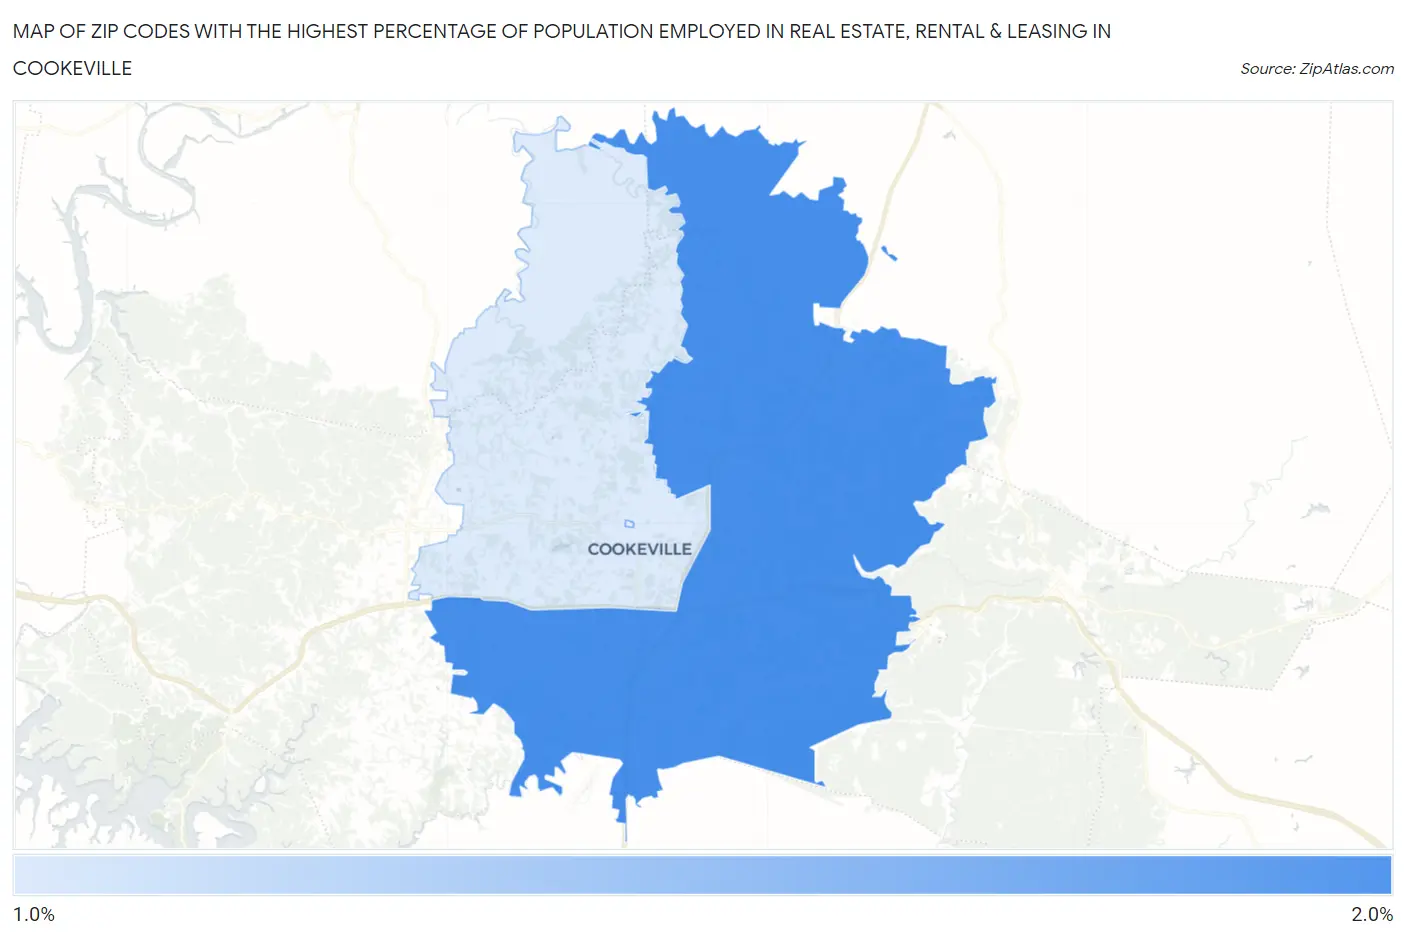
Map of Zip Codes with the Highest Percentage of Population Employed in Real Estate, Rental & Leasing in Cookeville
1.4%
1.6%
Zip Codes with the Highest Percentage of Population Employed in Real Estate, Rental & Leasing in Cookeville, TN
| Zip Code | % Employed | vs State | vs National | |
| 1. | 38506 | 1.6% | 1.7%(-0.172)#202 | 1.9%(-0.330)#10,707 |
| 2. | 38501 | 1.4% | 1.7%(-0.323)#221 | 1.9%(-0.480)#11,879 |
1
Common Questions
What are the Top Zip Codes with the Highest Percentage of Population Employed in Real Estate, Rental & Leasing in Cookeville, TN?
Top Zip Codes with the Highest Percentage of Population Employed in Real Estate, Rental & Leasing in Cookeville, TN are:
What zip code has the Highest Percentage of Population Employed in Real Estate, Rental & Leasing in Cookeville, TN?
38506 has the Highest Percentage of Population Employed in Real Estate, Rental & Leasing in Cookeville, TN with 1.6%.
What is the Percentage of Population Employed in Real Estate, Rental & Leasing in Cookeville, TN?
Percentage of Population Employed in Real Estate, Rental & Leasing in Cookeville is 1.6%.
What is the Percentage of Population Employed in Real Estate, Rental & Leasing in Tennessee?
Percentage of Population Employed in Real Estate, Rental & Leasing in Tennessee is 1.7%.
What is the Percentage of Population Employed in Real Estate, Rental & Leasing in the United States?
Percentage of Population Employed in Real Estate, Rental & Leasing in the United States is 1.9%.