Benton, TN Map & Demographics
Benton Map
Benton Overview
$21,643
PER CAPITA INCOME
$60,673
AVG FAMILY INCOME
$37,569
AVG HOUSEHOLD INCOME
26.5%
WAGE / INCOME GAP [ % ]
73.5¢/ $1
WAGE / INCOME GAP [ $ ]
0.45
INEQUALITY / GINI INDEX
1,584
TOTAL POPULATION
734
MALE POPULATION
850
FEMALE POPULATION
86.35
MALES / 100 FEMALES
115.80
FEMALES / 100 MALES
38.9
MEDIAN AGE
3.0
AVG FAMILY SIZE
2.4
AVG HOUSEHOLD SIZE
583
LABOR FORCE [ PEOPLE ]
45.8%
PERCENT IN LABOR FORCE
7.5%
UNEMPLOYMENT RATE
Benton Zip Codes
Benton Area Codes
Income in Benton
Income Overview in Benton
Per Capita Income in Benton is $21,643, while median incomes of families and households are $60,673 and $37,569 respectively.
| Characteristic | Number | Measure |
| Per Capita Income | 1,584 | $21,643 |
| Median Family Income | 397 | $60,673 |
| Mean Family Income | 397 | $67,652 |
| Median Household Income | 611 | $37,569 |
| Mean Household Income | 611 | $53,506 |
| Income Deficit | 397 | $0 |
| Wage / Income Gap (%) | 1,584 | 26.54% |
| Wage / Income Gap ($) | 1,584 | 73.46¢ per $1 |
| Gini / Inequality Index | 1,584 | 0.45 |
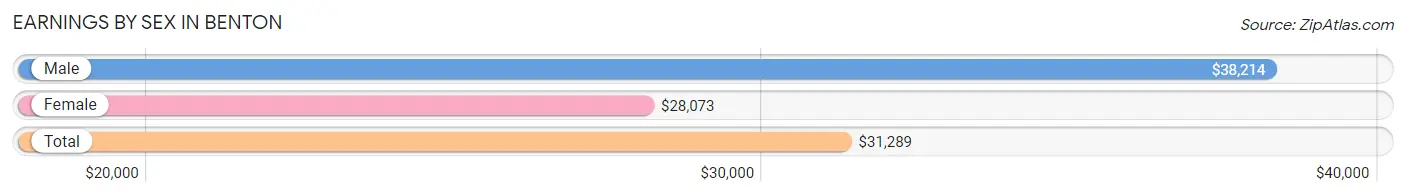
Earnings by Sex in Benton
Average Earnings in Benton are $31,289, $38,214 for men and $28,073 for women, a difference of 26.5%.
| Sex | Number | Average Earnings |
| Male | 368 (55.0%) | $38,214 |
| Female | 301 (45.0%) | $28,073 |
| Total | 669 (100.0%) | $31,289 |
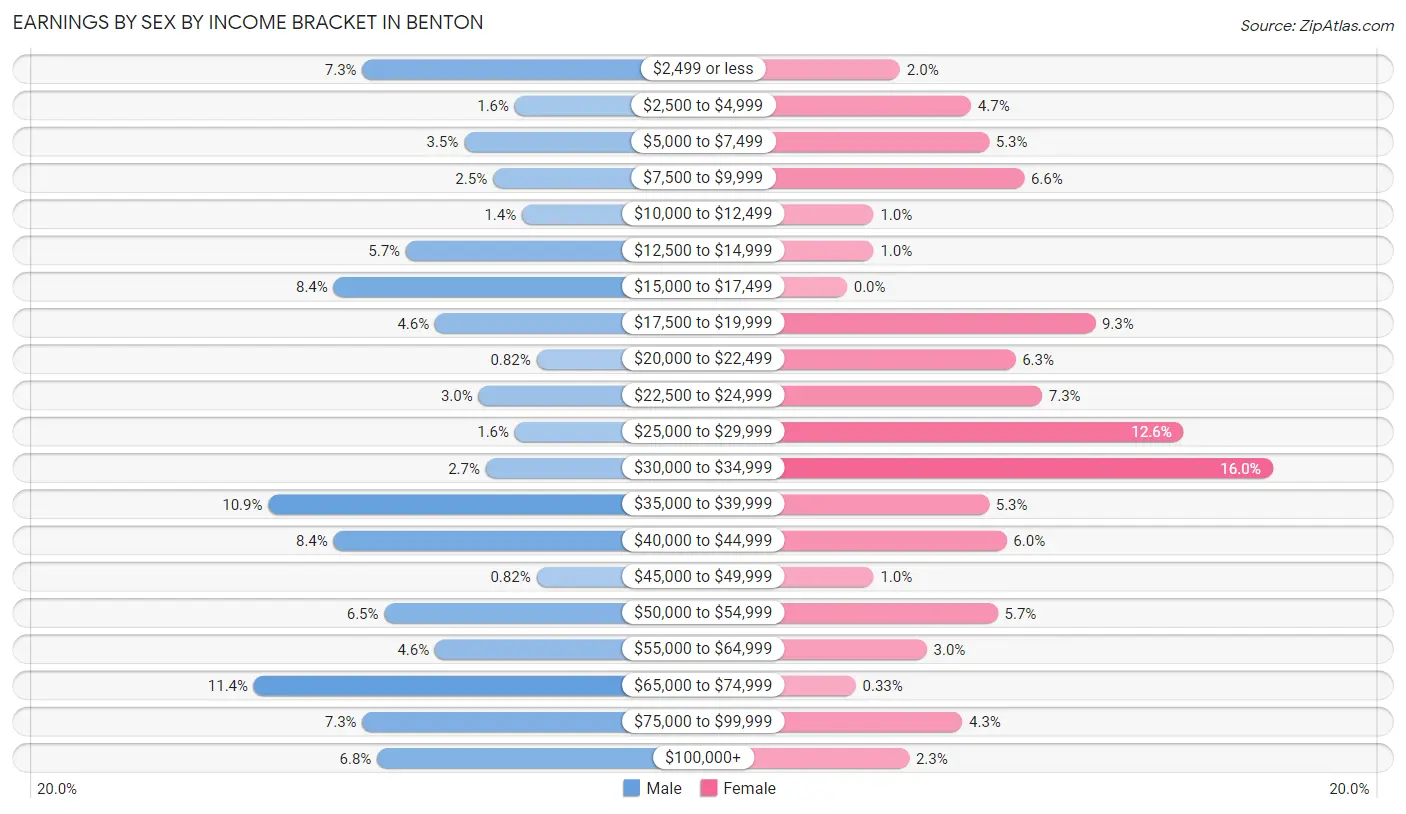
Earnings by Sex by Income Bracket in Benton
The most common earnings brackets in Benton are $65,000 to $74,999 for men (42 | 11.4%) and $30,000 to $34,999 for women (48 | 16.0%).
| Income | Male | Female |
| $2,499 or less | 27 (7.3%) | 6 (2.0%) |
| $2,500 to $4,999 | 6 (1.6%) | 14 (4.6%) |
| $5,000 to $7,499 | 13 (3.5%) | 16 (5.3%) |
| $7,500 to $9,999 | 9 (2.5%) | 20 (6.6%) |
| $10,000 to $12,499 | 5 (1.4%) | 3 (1.0%) |
| $12,500 to $14,999 | 21 (5.7%) | 3 (1.0%) |
| $15,000 to $17,499 | 31 (8.4%) | 0 (0.0%) |
| $17,500 to $19,999 | 17 (4.6%) | 28 (9.3%) |
| $20,000 to $22,499 | 3 (0.8%) | 19 (6.3%) |
| $22,500 to $24,999 | 11 (3.0%) | 22 (7.3%) |
| $25,000 to $29,999 | 6 (1.6%) | 38 (12.6%) |
| $30,000 to $34,999 | 10 (2.7%) | 48 (16.0%) |
| $35,000 to $39,999 | 40 (10.9%) | 16 (5.3%) |
| $40,000 to $44,999 | 31 (8.4%) | 18 (6.0%) |
| $45,000 to $49,999 | 3 (0.8%) | 3 (1.0%) |
| $50,000 to $54,999 | 24 (6.5%) | 17 (5.7%) |
| $55,000 to $64,999 | 17 (4.6%) | 9 (3.0%) |
| $65,000 to $74,999 | 42 (11.4%) | 1 (0.3%) |
| $75,000 to $99,999 | 27 (7.3%) | 13 (4.3%) |
| $100,000+ | 25 (6.8%) | 7 (2.3%) |
| Total | 368 (100.0%) | 301 (100.0%) |
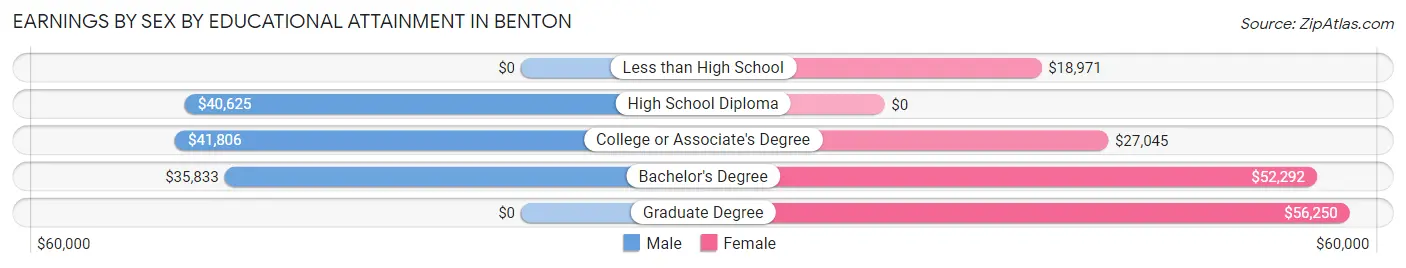
Earnings by Sex by Educational Attainment in Benton
Average earnings in Benton are $41,033 for men and $26,591 for women, a difference of 35.2%. Men with an educational attainment of college or associate's degree enjoy the highest average annual earnings of $41,806, while those with bachelor's degree education earn the least with $35,833. Women with an educational attainment of graduate degree earn the most with the average annual earnings of $56,250, while those with less than high school education have the smallest earnings of $18,971.
| Educational Attainment | Male Income | Female Income |
| Less than High School | - | - |
| High School Diploma | $40,625 | $0 |
| College or Associate's Degree | $41,806 | $27,045 |
| Bachelor's Degree | $35,833 | $52,292 |
| Graduate Degree | - | - |
| Total | $41,033 | $26,591 |
Family Income in Benton
Family Income Brackets in Benton
According to the Benton family income data, there are 89 families falling into the $100,000 to $149,999 income range, which is the most common income bracket and makes up 22.4% of all families. Conversely, the $150,000 to $199,999 income bracket is the least frequent group with only 4 families (1.0%) belonging to this category.
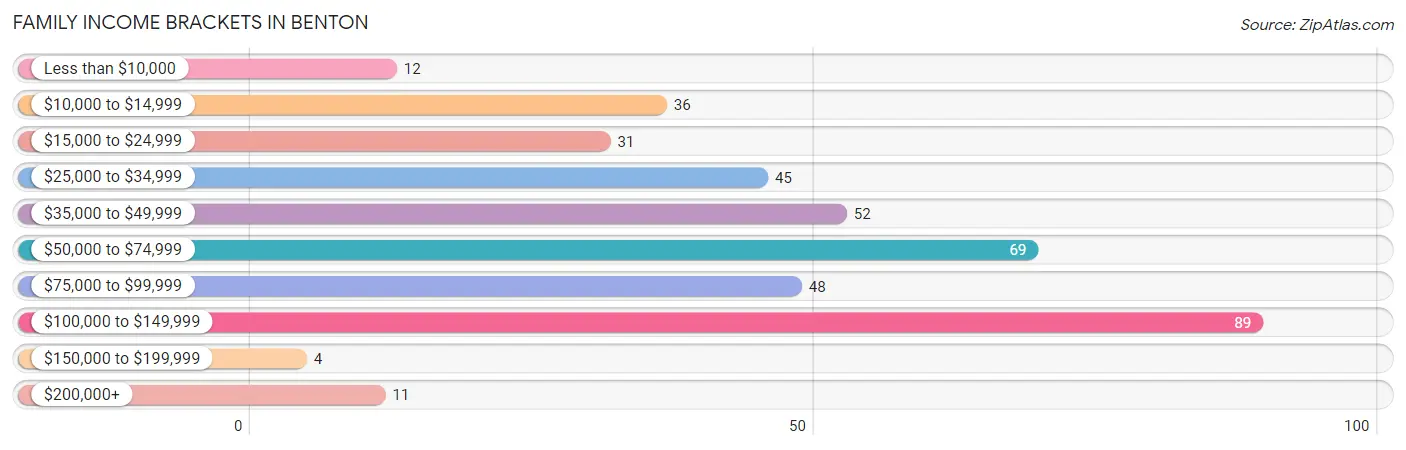
| Income Bracket | # Families | % Families |
| Less than $10,000 | 12 | 3.0% |
| $10,000 to $14,999 | 36 | 9.1% |
| $15,000 to $24,999 | 31 | 7.8% |
| $25,000 to $34,999 | 45 | 11.3% |
| $35,000 to $49,999 | 52 | 13.1% |
| $50,000 to $74,999 | 69 | 17.4% |
| $75,000 to $99,999 | 48 | 12.1% |
| $100,000 to $149,999 | 89 | 22.4% |
| $150,000 to $199,999 | 4 | 1.0% |
| $200,000+ | 11 | 2.8% |
Family Income by Famaliy Size in Benton
3-person families (99 | 24.9%) account for the highest median family income in Benton with $76,250 per family, while 3-person families (99 | 24.9%) have the highest median income of $25,417 per family member.
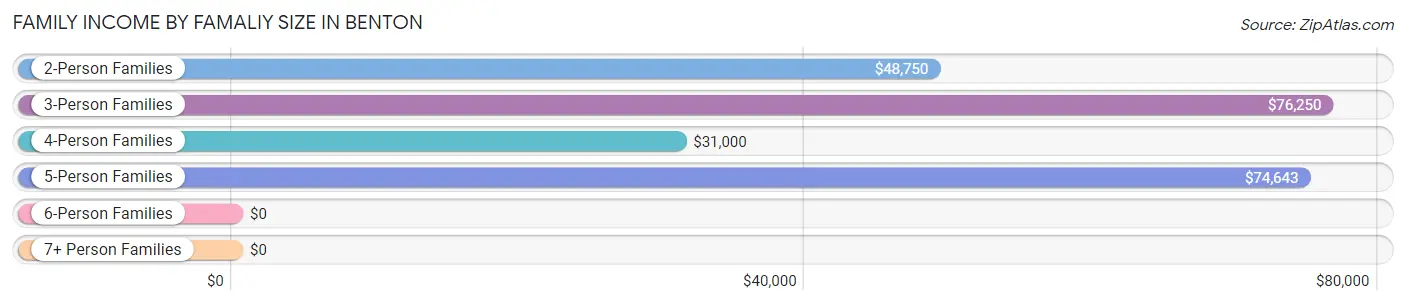
| Income Bracket | # Families | Median Income |
| 2-Person Families | 192 (48.4%) | $48,750 |
| 3-Person Families | 99 (24.9%) | $76,250 |
| 4-Person Families | 88 (22.2%) | $31,000 |
| 5-Person Families | 18 (4.5%) | $74,643 |
| 6-Person Families | 0 (0.0%) | $0 |
| 7+ Person Families | 0 (0.0%) | $0 |
| Total | 397 (100.0%) | $60,673 |
Family Income by Number of Earners in Benton
The median family income in Benton is $60,673, with families comprising 3+ earners (24) having the highest median family income of $118,750, while families with no earners (88) have the lowest median family income of $23,542, accounting for 6.0% and 22.2% of families, respectively.
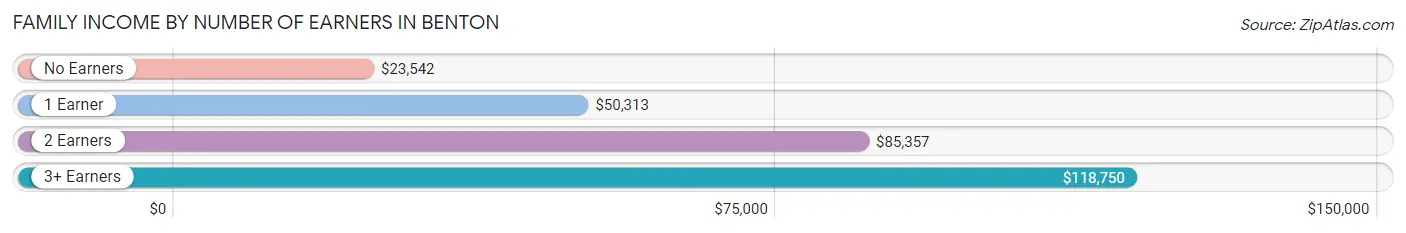
| Number of Earners | # Families | Median Income |
| No Earners | 88 (22.2%) | $23,542 |
| 1 Earner | 161 (40.6%) | $50,313 |
| 2 Earners | 124 (31.2%) | $85,357 |
| 3+ Earners | 24 (6.0%) | $118,750 |
| Total | 397 (100.0%) | $60,673 |
Household Income in Benton
Household Income Brackets in Benton
With 105 households falling in the category, the $10,000 to $14,999 income range is the most frequent in Benton, accounting for 17.2% of all households. In contrast, only 4 households (0.6%) fall into the $150,000 to $199,999 income bracket, making it the least populous group.
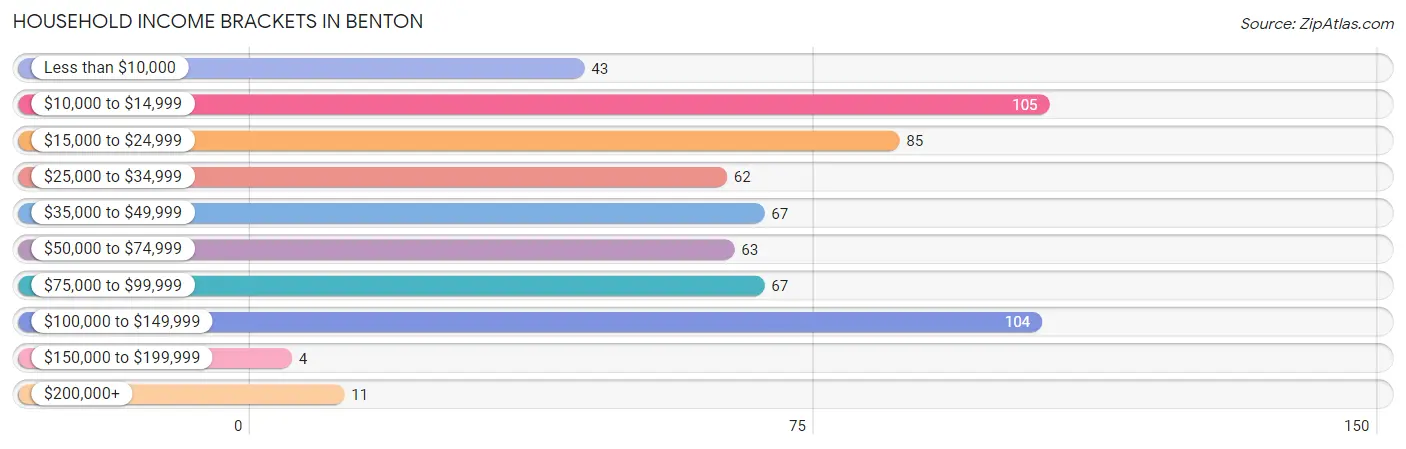
| Income Bracket | # Households | % Households |
| Less than $10,000 | 43 | 7.0% |
| $10,000 to $14,999 | 105 | 17.2% |
| $15,000 to $24,999 | 85 | 13.9% |
| $25,000 to $34,999 | 62 | 10.1% |
| $35,000 to $49,999 | 67 | 11.0% |
| $50,000 to $74,999 | 63 | 10.3% |
| $75,000 to $99,999 | 67 | 11.0% |
| $100,000 to $149,999 | 104 | 17.0% |
| $150,000 to $199,999 | 4 | 0.7% |
| $200,000+ | 11 | 1.8% |
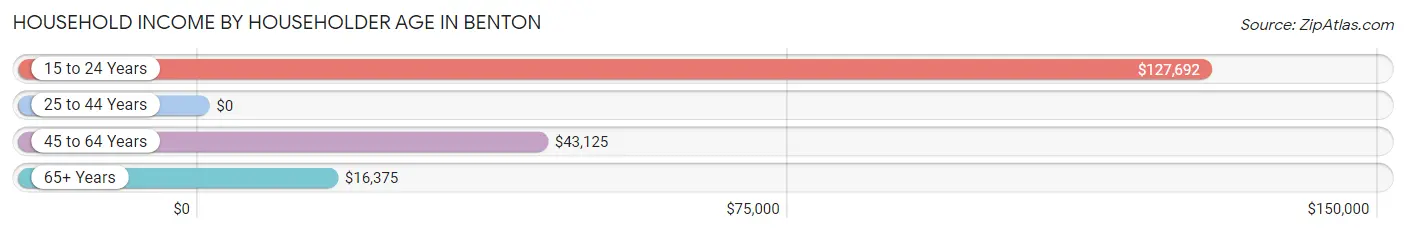
Household Income by Householder Age in Benton
The median household income in Benton is $37,569, with the highest median household income of $127,692 found in the 15 to 24 years age bracket for the primary householder. A total of 24 households (3.9%) fall into this category. Meanwhile, the 25 to 44 years age bracket for the primary householder has the lowest median household income of $0, with 168 households (27.5%) in this group.
| Income Bracket | # Households | Median Income |
| 15 to 24 Years | 24 (3.9%) | $127,692 |
| 25 to 44 Years | 168 (27.5%) | $0 |
| 45 to 64 Years | 224 (36.7%) | $43,125 |
| 65+ Years | 195 (31.9%) | $16,375 |
| Total | 611 (100.0%) | $37,569 |
Poverty in Benton
Income Below Poverty by Sex and Age in Benton
With 15.7% poverty level for males and 21.6% for females among the residents of Benton, 5 year old males and 12 to 14 year old females are the most vulnerable to poverty, with 5 males (62.5%) and 26 females (55.3%) in their respective age groups living below the poverty level.
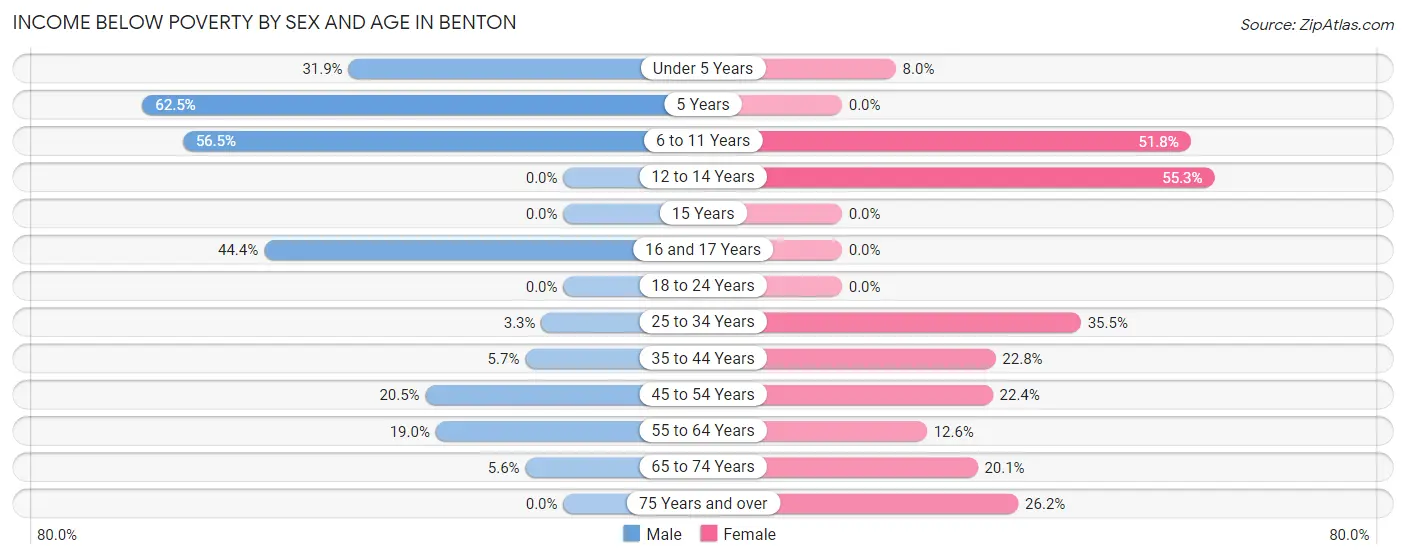
| Age Bracket | Male | Female |
| Under 5 Years | 15 (31.9%) | 6 (8.0%) |
| 5 Years | 5 (62.5%) | 0 (0.0%) |
| 6 to 11 Years | 26 (56.5%) | 29 (51.8%) |
| 12 to 14 Years | 0 (0.0%) | 26 (55.3%) |
| 15 Years | 0 (0.0%) | 0 (0.0%) |
| 16 and 17 Years | 4 (44.4%) | 0 (0.0%) |
| 18 to 24 Years | 0 (0.0%) | 0 (0.0%) |
| 25 to 34 Years | 3 (3.3%) | 22 (35.5%) |
| 35 to 44 Years | 3 (5.7%) | 26 (22.8%) |
| 45 to 54 Years | 17 (20.5%) | 15 (22.4%) |
| 55 to 64 Years | 18 (19.0%) | 15 (12.6%) |
| 65 to 74 Years | 4 (5.6%) | 28 (20.1%) |
| 75 Years and over | 0 (0.0%) | 11 (26.2%) |
| Total | 95 (15.7%) | 178 (21.6%) |
Income Above Poverty by Sex and Age in Benton
According to the poverty statistics in Benton, males aged 12 to 14 years and females aged 5 years are the age groups that are most secure financially, with 100.0% of males and 100.0% of females in these age groups living above the poverty line.
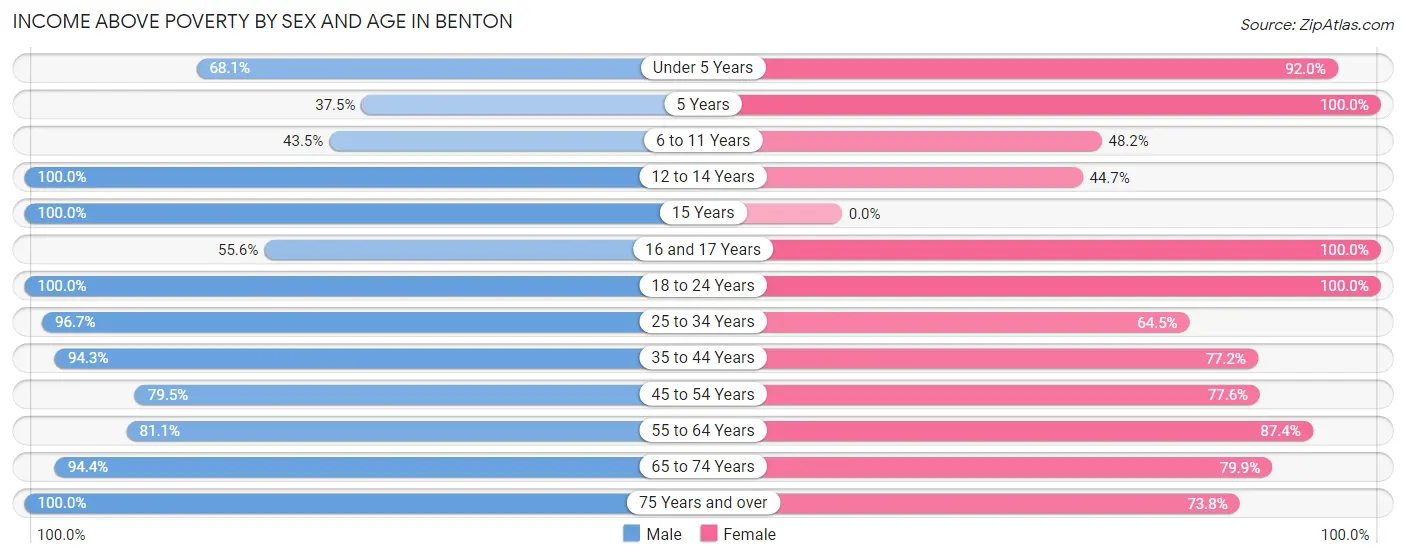
| Age Bracket | Male | Female |
| Under 5 Years | 32 (68.1%) | 69 (92.0%) |
| 5 Years | 3 (37.5%) | 6 (100.0%) |
| 6 to 11 Years | 20 (43.5%) | 27 (48.2%) |
| 12 to 14 Years | 4 (100.0%) | 21 (44.7%) |
| 15 Years | 4 (100.0%) | 0 (0.0%) |
| 16 and 17 Years | 5 (55.6%) | 13 (100.0%) |
| 18 to 24 Years | 65 (100.0%) | 85 (100.0%) |
| 25 to 34 Years | 89 (96.7%) | 40 (64.5%) |
| 35 to 44 Years | 50 (94.3%) | 88 (77.2%) |
| 45 to 54 Years | 66 (79.5%) | 52 (77.6%) |
| 55 to 64 Years | 77 (81.0%) | 104 (87.4%) |
| 65 to 74 Years | 67 (94.4%) | 111 (79.9%) |
| 75 Years and over | 29 (100.0%) | 31 (73.8%) |
| Total | 511 (84.3%) | 647 (78.4%) |
Income Below Poverty Among Married-Couple Families in Benton
The poverty statistics for married-couple families in Benton show that 8.7% or 22 of the total 254 families live below the poverty line. Families with 1 or 2 children have the highest poverty rate of 21.4%, comprising of 15 families. On the other hand, families with 3 or 4 children have the lowest poverty rate of 0.0%, which includes 0 families.
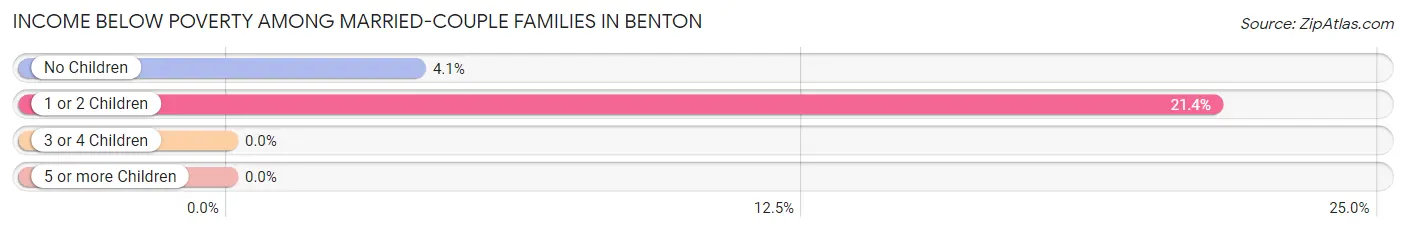
| Children | Above Poverty | Below Poverty |
| No Children | 164 (95.9%) | 7 (4.1%) |
| 1 or 2 Children | 55 (78.6%) | 15 (21.4%) |
| 3 or 4 Children | 13 (100.0%) | 0 (0.0%) |
| 5 or more Children | 0 (0.0%) | 0 (0.0%) |
| Total | 232 (91.3%) | 22 (8.7%) |
Income Below Poverty Among Single-Parent Households in Benton
According to the poverty data in Benton, 53.1% or 17 single-father households and 24.3% or 27 single-mother households are living below the poverty line. Among single-father households, those with 1 or 2 children have the highest poverty rate, with 17 households (100.0%) experiencing poverty. Likewise, among single-mother households, those with 3 or 4 children have the highest poverty rate, with 21 households (100.0%) falling below the poverty line.
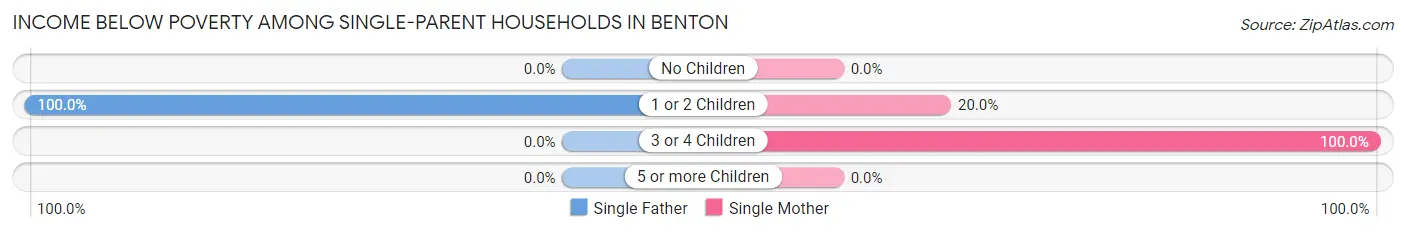
| Children | Single Father | Single Mother |
| No Children | 0 (0.0%) | 0 (0.0%) |
| 1 or 2 Children | 17 (100.0%) | 6 (20.0%) |
| 3 or 4 Children | 0 (0.0%) | 21 (100.0%) |
| 5 or more Children | 0 (0.0%) | 0 (0.0%) |
| Total | 17 (53.1%) | 27 (24.3%) |
Income Below Poverty Among Married-Couple vs Single-Parent Households in Benton
The poverty data for Benton shows that 22 of the married-couple family households (8.7%) and 44 of the single-parent households (30.8%) are living below the poverty level. Within the married-couple family households, those with 1 or 2 children have the highest poverty rate, with 15 households (21.4%) falling below the poverty line. Among the single-parent households, those with 3 or 4 children have the highest poverty rate, with 21 household (100.0%) living below poverty.
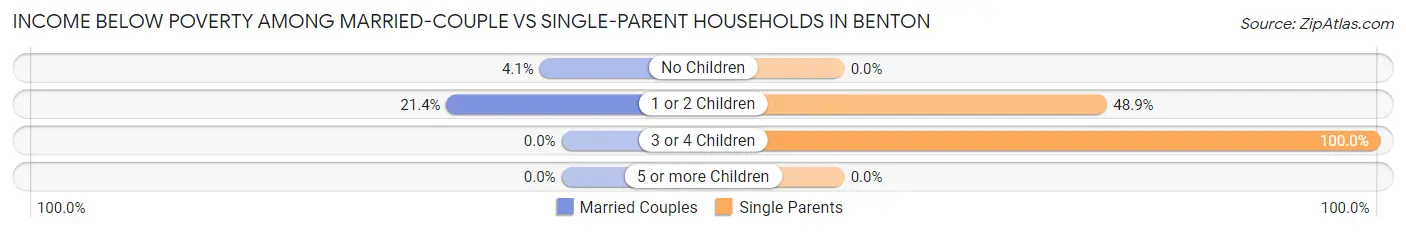
| Children | Married-Couple Families | Single-Parent Households |
| No Children | 7 (4.1%) | 0 (0.0%) |
| 1 or 2 Children | 15 (21.4%) | 23 (48.9%) |
| 3 or 4 Children | 0 (0.0%) | 21 (100.0%) |
| 5 or more Children | 0 (0.0%) | 0 (0.0%) |
| Total | 22 (8.7%) | 44 (30.8%) |
Race in Benton
The most populous races in Benton are White / Caucasian (1,427 | 90.1%), Two or more Races (120 | 7.6%), and Black / African American (33 | 2.1%).
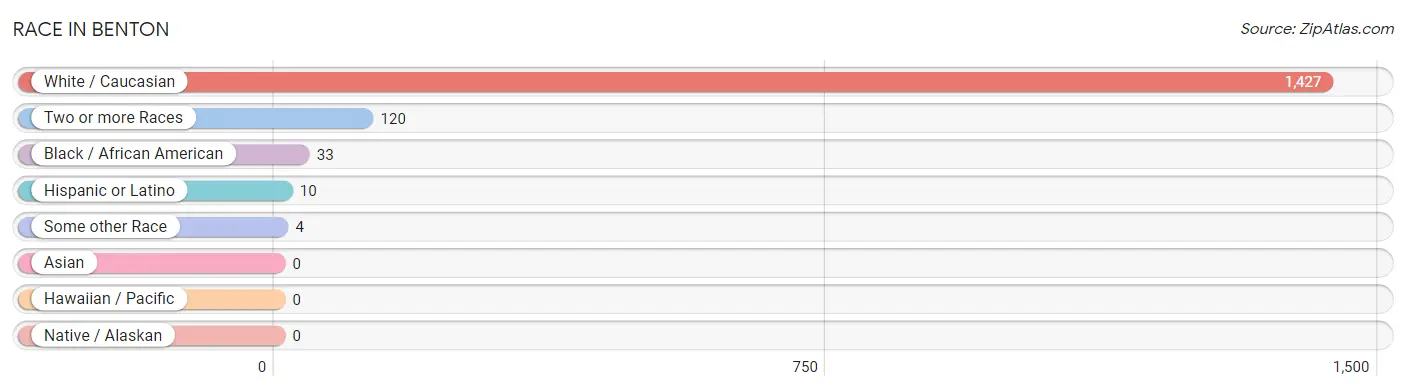
| Race | # Population | % Population |
| Asian | 0 | 0.0% |
| Black / African American | 33 | 2.1% |
| Hawaiian / Pacific | 0 | 0.0% |
| Hispanic or Latino | 10 | 0.6% |
| Native / Alaskan | 0 | 0.0% |
| White / Caucasian | 1,427 | 90.1% |
| Two or more Races | 120 | 7.6% |
| Some other Race | 4 | 0.3% |
| Total | 1,584 | 100.0% |
Ancestry in Benton
The most populous ancestries reported in Benton are Irish (318 | 20.1%), German (199 | 12.6%), English (172 | 10.9%), American (168 | 10.6%), and Cherokee (60 | 3.8%), together accounting for 57.9% of all Benton residents.
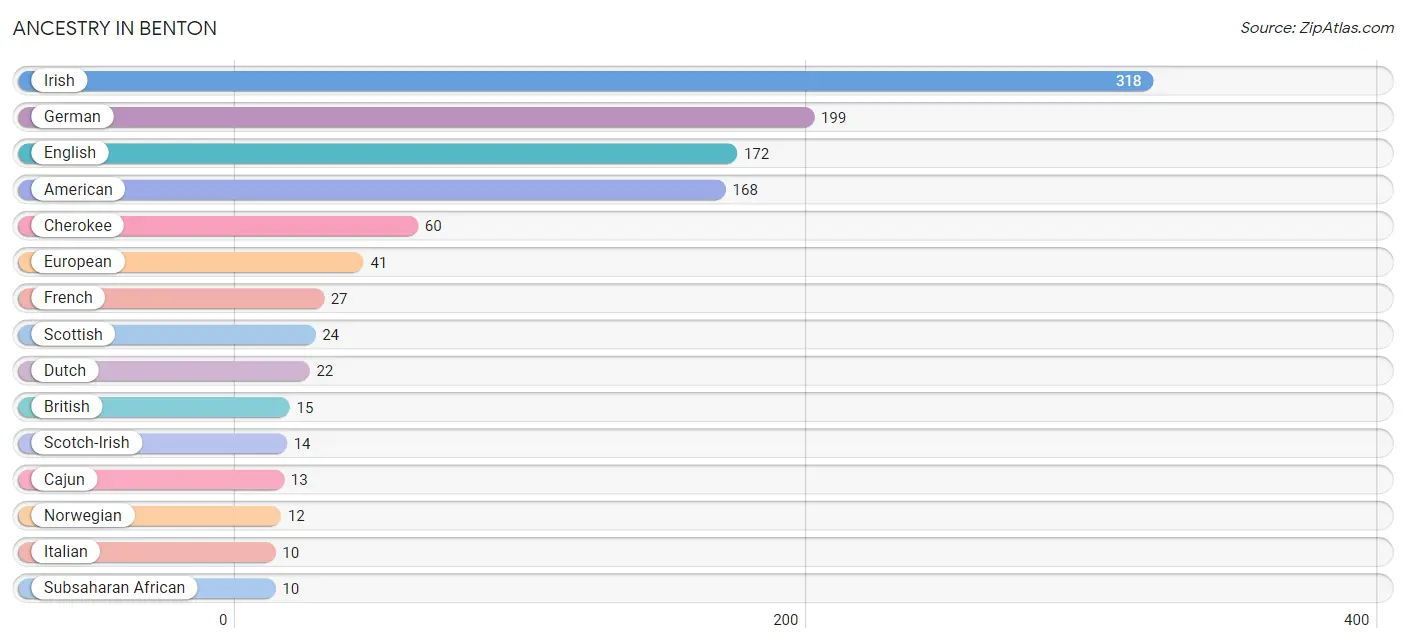
| Ancestry | # Population | % Population |
| African | 5 | 0.3% |
| American | 168 | 10.6% |
| Australian | 5 | 0.3% |
| Blackfeet | 2 | 0.1% |
| British | 15 | 0.9% |
| Cajun | 13 | 0.8% |
| Central American | 4 | 0.3% |
| Cherokee | 60 | 3.8% |
| Dutch | 22 | 1.4% |
| Eastern European | 3 | 0.2% |
| English | 172 | 10.9% |
| European | 41 | 2.6% |
| French | 27 | 1.7% |
| German | 199 | 12.6% |
| Irish | 318 | 20.1% |
| Italian | 10 | 0.6% |
| Liberian | 5 | 0.3% |
| Mexican | 6 | 0.4% |
| Norwegian | 12 | 0.8% |
| Panamanian | 4 | 0.3% |
| Scotch-Irish | 14 | 0.9% |
| Scottish | 24 | 1.5% |
| Subsaharan African | 10 | 0.6% | View All 23 Rows |
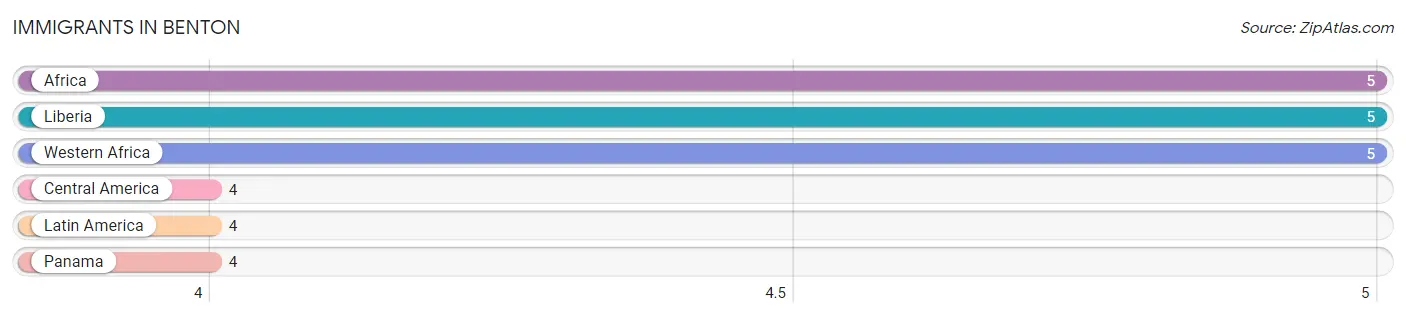
Immigrants in Benton
The most numerous immigrant groups reported in Benton came from Africa (5 | 0.3%), Liberia (5 | 0.3%), Western Africa (5 | 0.3%), Central America (4 | 0.3%), and Latin America (4 | 0.3%), together accounting for 1.5% of all Benton residents.
| Immigration Origin | # Population | % Population |
| Africa | 5 | 0.3% |
| Central America | 4 | 0.3% |
| Latin America | 4 | 0.3% |
| Liberia | 5 | 0.3% |
| Panama | 4 | 0.3% |
| Western Africa | 5 | 0.3% | View All 6 Rows |
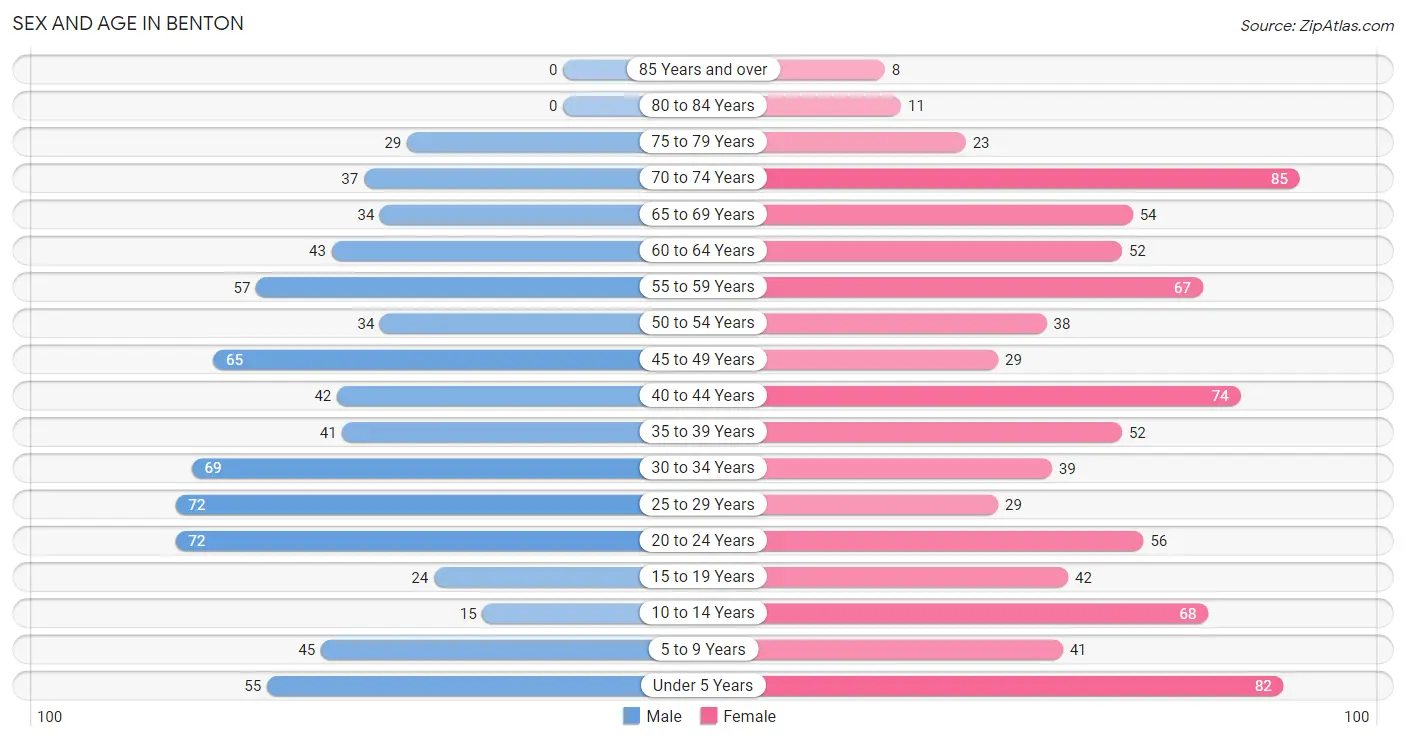
Sex and Age in Benton
Sex and Age in Benton
The most populous age groups in Benton are 20 to 24 Years (72 | 9.8%) for men and 70 to 74 Years (85 | 10.0%) for women.
| Age Bracket | Male | Female |
| Under 5 Years | 55 (7.5%) | 82 (9.7%) |
| 5 to 9 Years | 45 (6.1%) | 41 (4.8%) |
| 10 to 14 Years | 15 (2.0%) | 68 (8.0%) |
| 15 to 19 Years | 24 (3.3%) | 42 (4.9%) |
| 20 to 24 Years | 72 (9.8%) | 56 (6.6%) |
| 25 to 29 Years | 72 (9.8%) | 29 (3.4%) |
| 30 to 34 Years | 69 (9.4%) | 39 (4.6%) |
| 35 to 39 Years | 41 (5.6%) | 52 (6.1%) |
| 40 to 44 Years | 42 (5.7%) | 74 (8.7%) |
| 45 to 49 Years | 65 (8.9%) | 29 (3.4%) |
| 50 to 54 Years | 34 (4.6%) | 38 (4.5%) |
| 55 to 59 Years | 57 (7.8%) | 67 (7.9%) |
| 60 to 64 Years | 43 (5.9%) | 52 (6.1%) |
| 65 to 69 Years | 34 (4.6%) | 54 (6.4%) |
| 70 to 74 Years | 37 (5.0%) | 85 (10.0%) |
| 75 to 79 Years | 29 (4.0%) | 23 (2.7%) |
| 80 to 84 Years | 0 (0.0%) | 11 (1.3%) |
| 85 Years and over | 0 (0.0%) | 8 (0.9%) |
| Total | 734 (100.0%) | 850 (100.0%) |
Families and Households in Benton
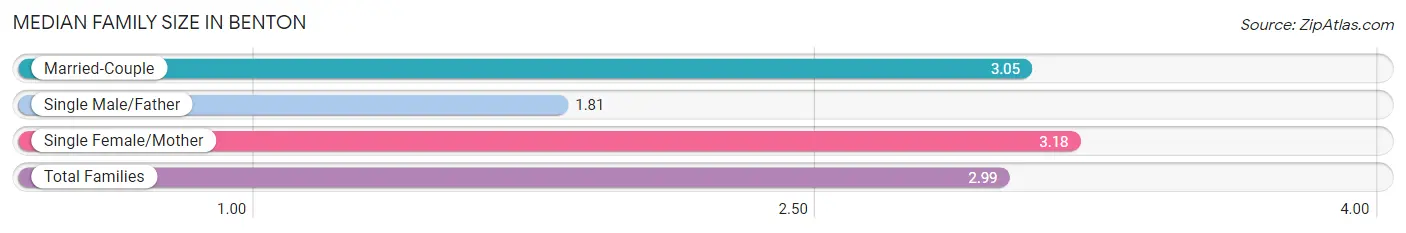
Median Family Size in Benton
The median family size in Benton is 2.99 persons per family, with single female/mother families (111 | 28.0%) accounting for the largest median family size of 3.18 persons per family. On the other hand, single male/father families (32 | 8.1%) represent the smallest median family size with 1.81 persons per family.
| Family Type | # Families | Family Size |
| Married-Couple | 254 (64.0%) | 3.05 |
| Single Male/Father | 32 (8.1%) | 1.81 |
| Single Female/Mother | 111 (28.0%) | 3.18 |
| Total Families | 397 (100.0%) | 2.99 |
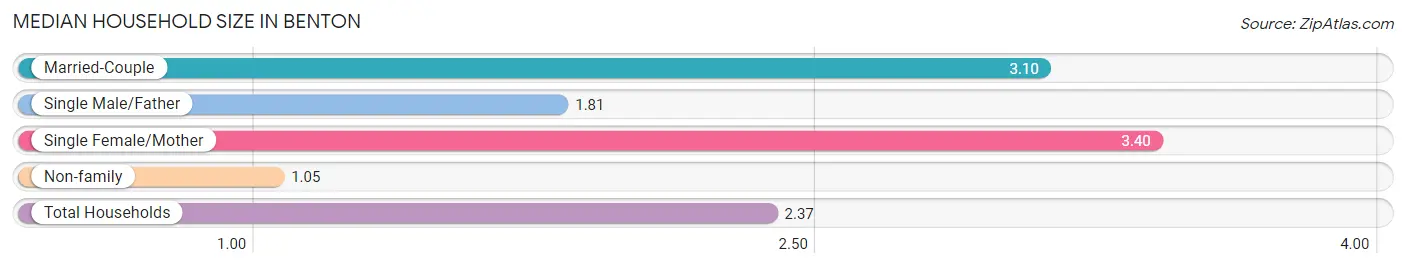
Median Household Size in Benton
The median household size in Benton is 2.37 persons per household, with single female/mother households (111 | 18.2%) accounting for the largest median household size of 3.4 persons per household. non-family households (214 | 35.0%) represent the smallest median household size with 1.05 persons per household.
| Household Type | # Households | Household Size |
| Married-Couple | 254 (41.6%) | 3.10 |
| Single Male/Father | 32 (5.2%) | 1.81 |
| Single Female/Mother | 111 (18.2%) | 3.40 |
| Non-family | 214 (35.0%) | 1.05 |
| Total Households | 611 (100.0%) | 2.37 |
Household Size by Marriage Status in Benton
Out of a total of 611 households in Benton, 397 (65.0%) are family households, while 214 (35.0%) are nonfamily households. The most numerous type of family households are 2-person households, comprising 191, and the most common type of nonfamily households are 1-person households, comprising 208.
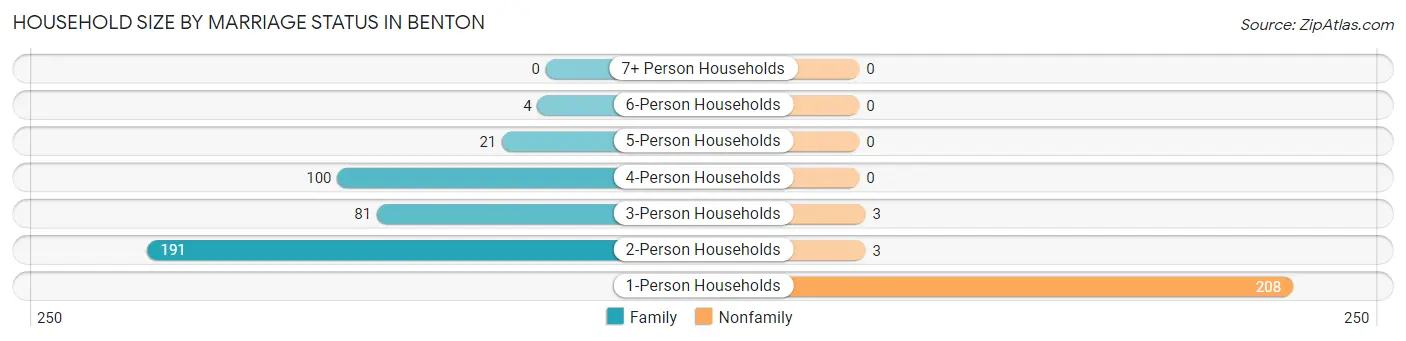
| Household Size | Family Households | Nonfamily Households |
| 1-Person Households | - | 208 (34.0%) |
| 2-Person Households | 191 (31.3%) | 3 (0.5%) |
| 3-Person Households | 81 (13.3%) | 3 (0.5%) |
| 4-Person Households | 100 (16.4%) | 0 (0.0%) |
| 5-Person Households | 21 (3.4%) | 0 (0.0%) |
| 6-Person Households | 4 (0.6%) | 0 (0.0%) |
| 7+ Person Households | 0 (0.0%) | 0 (0.0%) |
| Total | 397 (65.0%) | 214 (35.0%) |
Female Fertility in Benton
Fertility by Age in Benton
Average fertility rate in Benton is 40.0 births per 1,000 women. Women in the age bracket of 20 to 34 years have the highest fertility rate with 105.0 births per 1,000 women. Women in the age bracket of 20 to 34 years acount for 100.0% of all women with births.
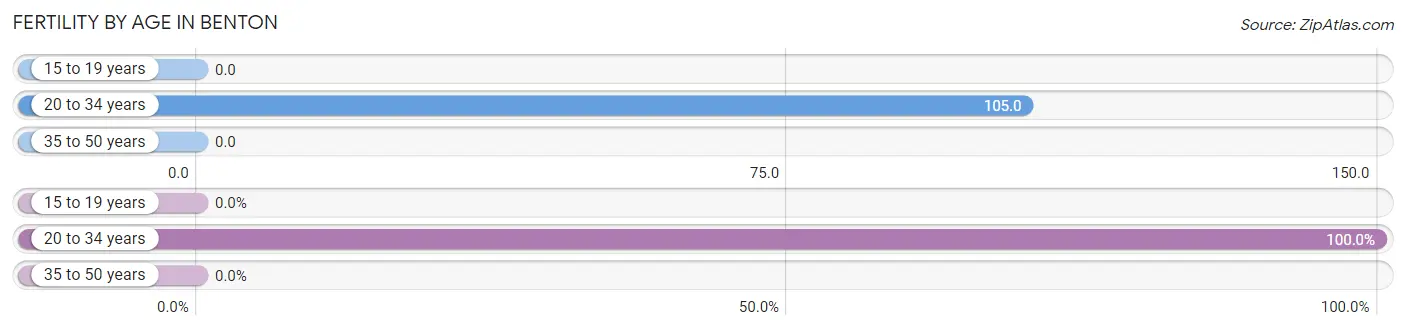
| Age Bracket | Women with Births | Births / 1,000 Women |
| 15 to 19 years | 0 (0.0%) | 0.0 |
| 20 to 34 years | 13 (100.0%) | 105.0 |
| 35 to 50 years | 0 (0.0%) | 0.0 |
| Total | 13 (100.0%) | 40.0 |
Fertility by Age by Marriage Status in Benton
69.2% of women with births (13) in Benton are married. The highest percentage of unmarried women with births falls into 20 to 34 years age bracket with 30.8% of them unmarried at the time of birth, while the lowest percentage of unmarried women with births belong to 20 to 34 years age bracket with 30.8% of them unmarried.
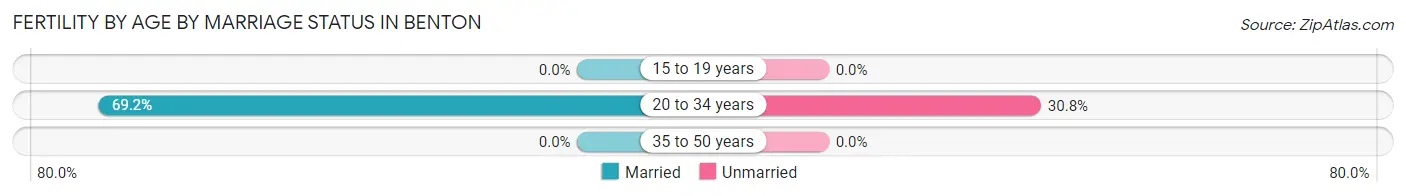
| Age Bracket | Married | Unmarried |
| 15 to 19 years | 0 (0.0%) | 0 (0.0%) |
| 20 to 34 years | 9 (69.2%) | 4 (30.8%) |
| 35 to 50 years | 0 (0.0%) | 0 (0.0%) |
| Total | 9 (69.2%) | 4 (30.8%) |
Fertility by Education in Benton
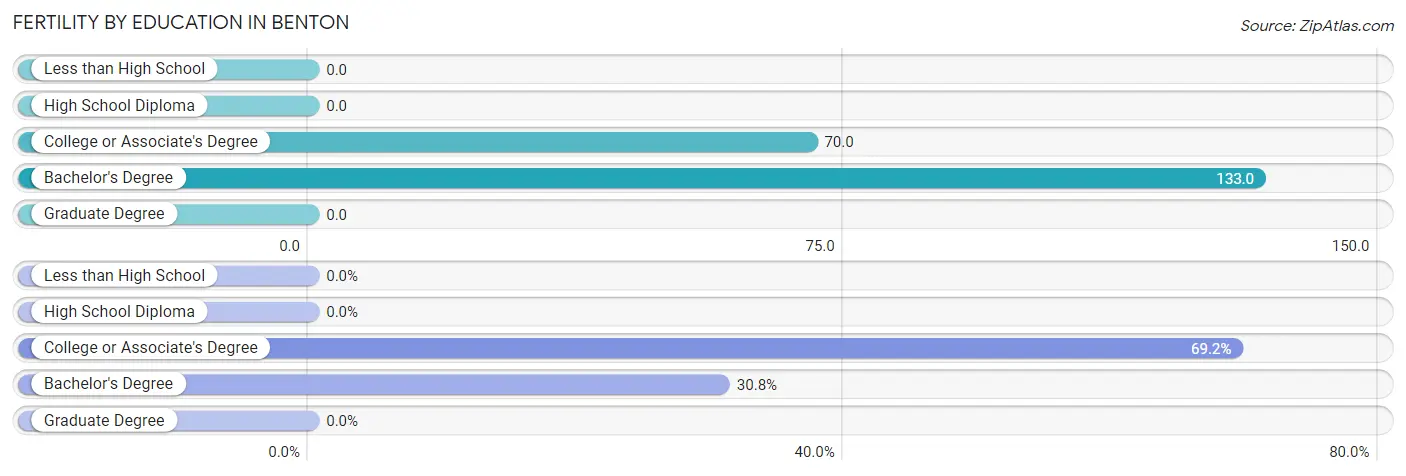
| Educational Attainment | Women with Births | Births / 1,000 Women |
| Less than High School | 0 (0.0%) | 0.0 |
| High School Diploma | 0 (0.0%) | 0.0 |
| College or Associate's Degree | 9 (69.2%) | 70.0 |
| Bachelor's Degree | 4 (30.8%) | 133.0 |
| Graduate Degree | 0 (0.0%) | 0.0 |
| Total | 13 (100.0%) | 40.0 |
Fertility by Education by Marriage Status in Benton
30.8% of women with births in Benton are unmarried. Women with the educational attainment of bachelor's degree are most likely to be married with 100.0% of them married at childbirth, while women with the educational attainment of college or associate's degree are least likely to be married with 44.4% of them unmarried at childbirth.
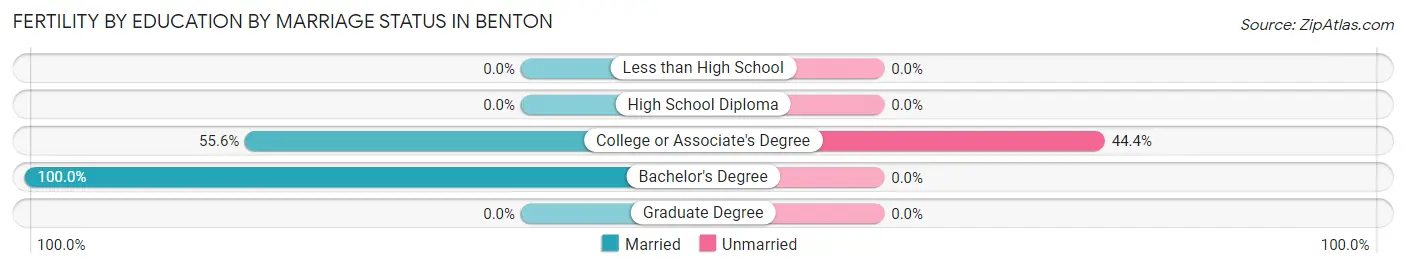
| Educational Attainment | Married | Unmarried |
| Less than High School | 0 (0.0%) | 0 (0.0%) |
| High School Diploma | 0 (0.0%) | 0 (0.0%) |
| College or Associate's Degree | 5 (55.6%) | 4 (44.4%) |
| Bachelor's Degree | 4 (100.0%) | 0 (0.0%) |
| Graduate Degree | 0 (0.0%) | 0 (0.0%) |
| Total | 9 (69.2%) | 4 (30.8%) |
Employment Characteristics in Benton
Employment by Class of Employer in Benton
Among the 535 employed individuals in Benton, private company employees (448 | 83.7%), local government employees (44 | 8.2%), and not-for-profit organizations (15 | 2.8%) make up the most common classes of employment.
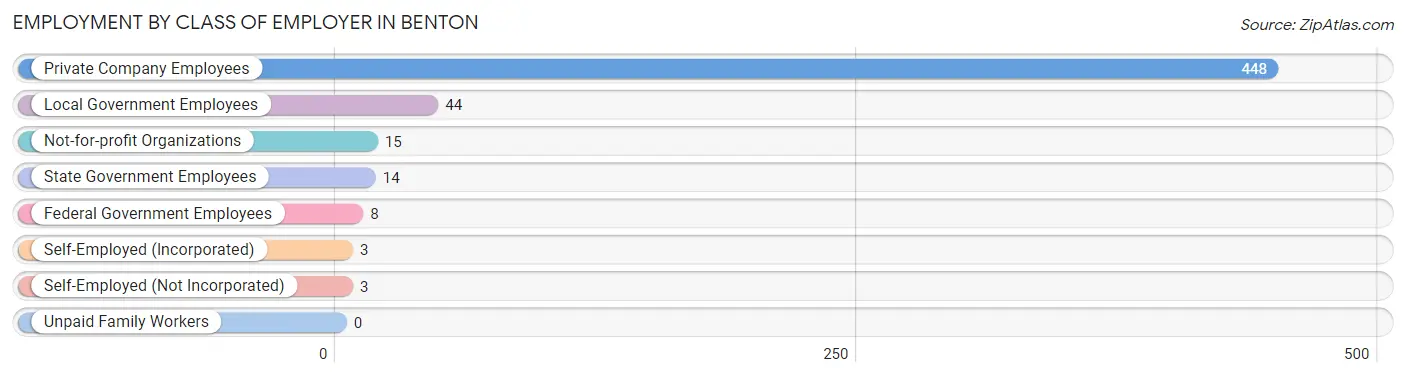
| Employer Class | # Employees | % Employees |
| Private Company Employees | 448 | 83.7% |
| Self-Employed (Incorporated) | 3 | 0.6% |
| Self-Employed (Not Incorporated) | 3 | 0.6% |
| Not-for-profit Organizations | 15 | 2.8% |
| Local Government Employees | 44 | 8.2% |
| State Government Employees | 14 | 2.6% |
| Federal Government Employees | 8 | 1.5% |
| Unpaid Family Workers | 0 | 0.0% |
| Total | 535 | 100.0% |
Employment Status by Age in Benton
According to the labor force statistics for Benton, out of the total population over 16 years of age (1,274), 45.8% or 583 individuals are in the labor force, with 7.5% or 44 of them unemployed. The age group with the highest labor force participation rate is 20 to 24 years, with 78.9% or 101 individuals in the labor force. Within the labor force, the 16 to 19 years age range has the highest percentage of unemployed individuals, with 62.9% or 22 of them being unemployed.
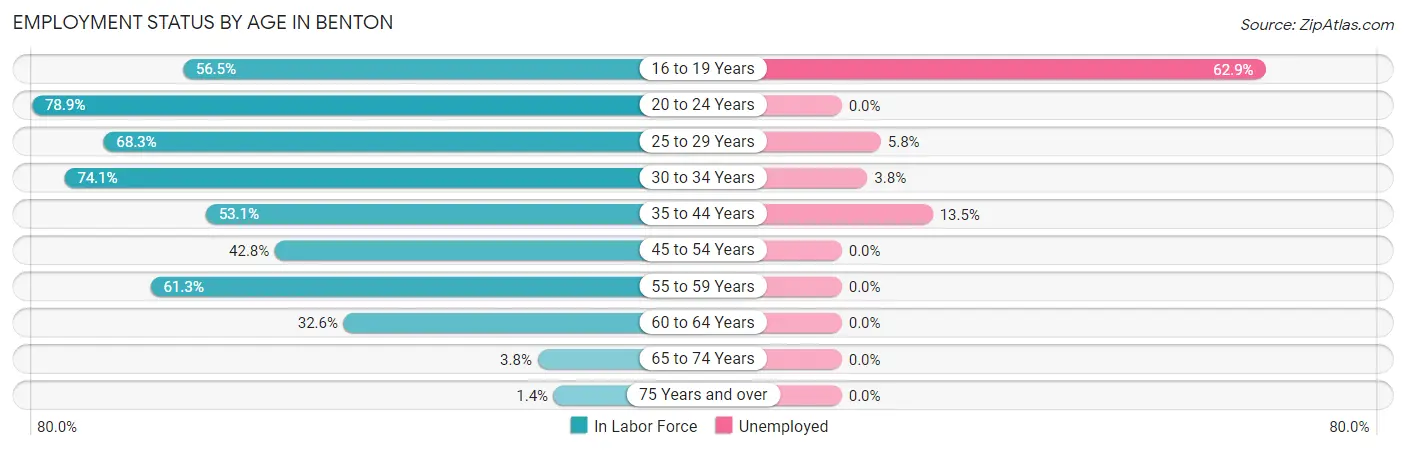
| Age Bracket | In Labor Force | Unemployed |
| 16 to 19 Years | 35 (56.5%) | 22 (62.9%) |
| 20 to 24 Years | 101 (78.9%) | 0 (0.0%) |
| 25 to 29 Years | 69 (68.3%) | 4 (5.8%) |
| 30 to 34 Years | 80 (74.1%) | 3 (3.8%) |
| 35 to 44 Years | 111 (53.1%) | 15 (13.5%) |
| 45 to 54 Years | 71 (42.8%) | 0 (0.0%) |
| 55 to 59 Years | 76 (61.3%) | 0 (0.0%) |
| 60 to 64 Years | 31 (32.6%) | 0 (0.0%) |
| 65 to 74 Years | 8 (3.8%) | 0 (0.0%) |
| 75 Years and over | 1 (1.4%) | 0 (0.0%) |
| Total | 583 (45.8%) | 44 (7.5%) |
Employment Status by Educational Attainment in Benton
According to labor force statistics for Benton, 54.5% of individuals (438) out of the total population between 25 and 64 years of age (803) are in the labor force, with 5.0% or 22 of them being unemployed. The group with the highest labor force participation rate are those with the educational attainment of bachelor's degree or higher, with 88.2% or 60 individuals in the labor force. Within the labor force, individuals with college / associate degree education have the highest percentage of unemployment, with 9.7% or 19 of them being unemployed.
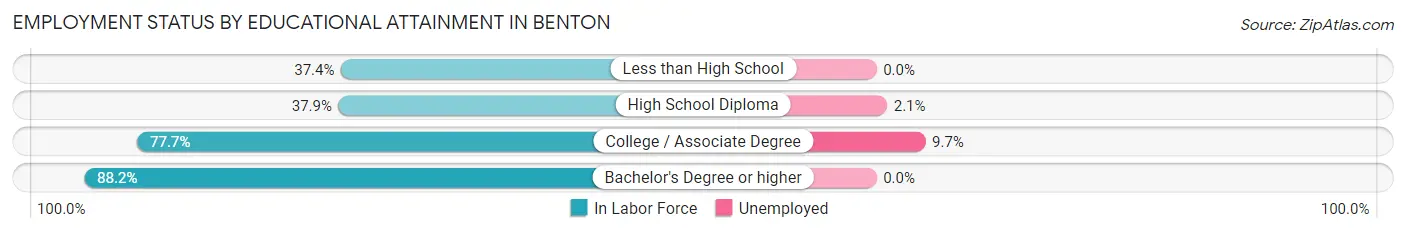
| Educational Attainment | In Labor Force | Unemployed |
| Less than High School | 40 (37.4%) | 0 (0.0%) |
| High School Diploma | 143 (37.9%) | 8 (2.1%) |
| College / Associate Degree | 195 (77.7%) | 24 (9.7%) |
| Bachelor's Degree or higher | 60 (88.2%) | 0 (0.0%) |
| Total | 438 (54.5%) | 40 (5.0%) |
Employment Occupations by Sex in Benton
Management, Business, Science and Arts Occupations
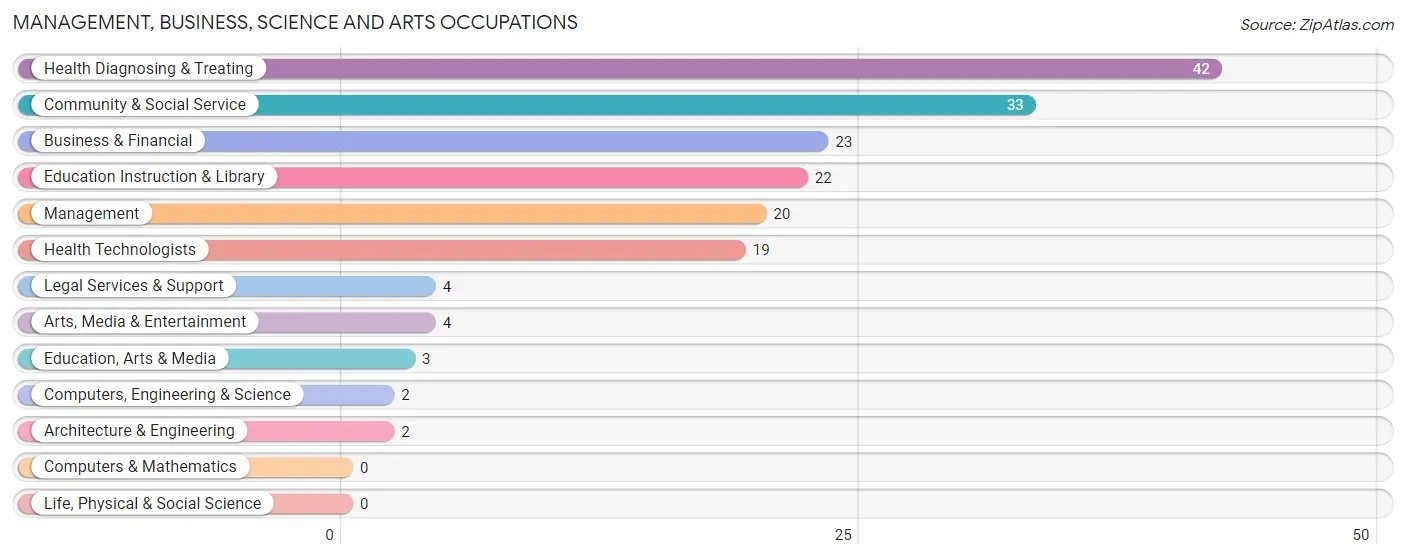
The most common Management, Business, Science and Arts occupations in Benton are Health Diagnosing & Treating (42 | 7.8%), Community & Social Service (33 | 6.1%), Business & Financial (23 | 4.3%), Education Instruction & Library (22 | 4.1%), and Management (20 | 3.7%).
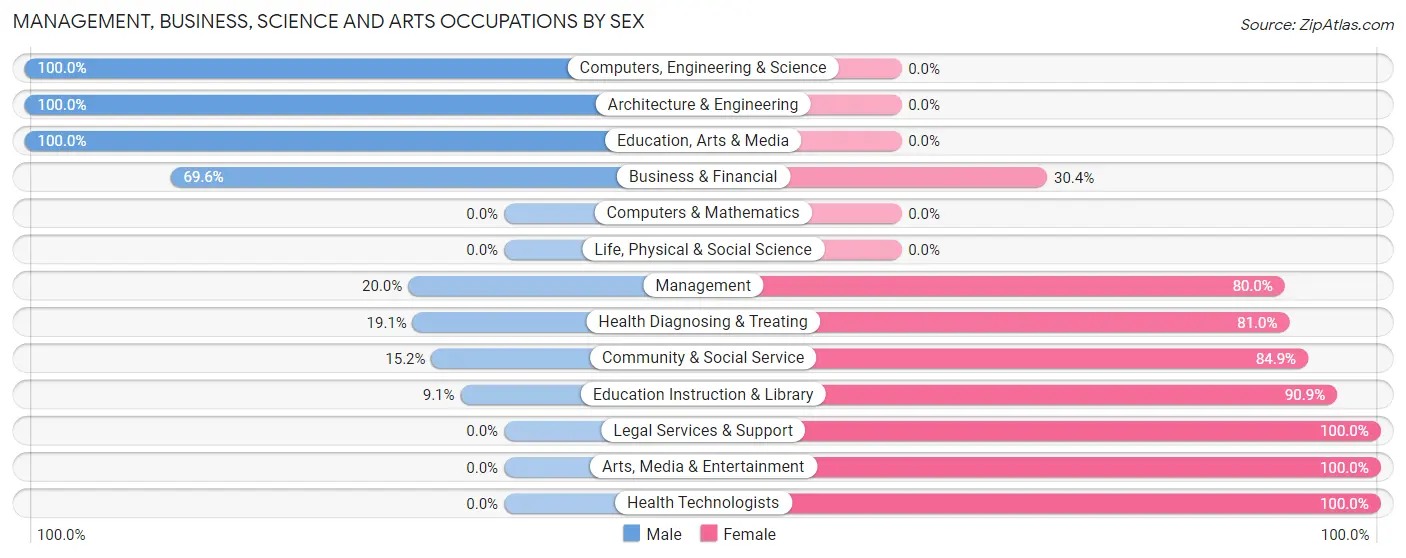
Management, Business, Science and Arts Occupations by Sex
Within the Management, Business, Science and Arts occupations in Benton, the most male-oriented occupations are Computers, Engineering & Science (100.0%), Architecture & Engineering (100.0%), and Education, Arts & Media (100.0%), while the most female-oriented occupations are Legal Services & Support (100.0%), Arts, Media & Entertainment (100.0%), and Health Technologists (100.0%).
| Occupation | Male | Female |
| Management | 4 (20.0%) | 16 (80.0%) |
| Business & Financial | 16 (69.6%) | 7 (30.4%) |
| Computers, Engineering & Science | 2 (100.0%) | 0 (0.0%) |
| Computers & Mathematics | 0 (0.0%) | 0 (0.0%) |
| Architecture & Engineering | 2 (100.0%) | 0 (0.0%) |
| Life, Physical & Social Science | 0 (0.0%) | 0 (0.0%) |
| Community & Social Service | 5 (15.1%) | 28 (84.9%) |
| Education, Arts & Media | 3 (100.0%) | 0 (0.0%) |
| Legal Services & Support | 0 (0.0%) | 4 (100.0%) |
| Education Instruction & Library | 2 (9.1%) | 20 (90.9%) |
| Arts, Media & Entertainment | 0 (0.0%) | 4 (100.0%) |
| Health Diagnosing & Treating | 8 (19.1%) | 34 (80.9%) |
| Health Technologists | 0 (0.0%) | 19 (100.0%) |
| Total (Category) | 35 (29.2%) | 85 (70.8%) |
| Total (Overall) | 307 (57.0%) | 232 (43.0%) |
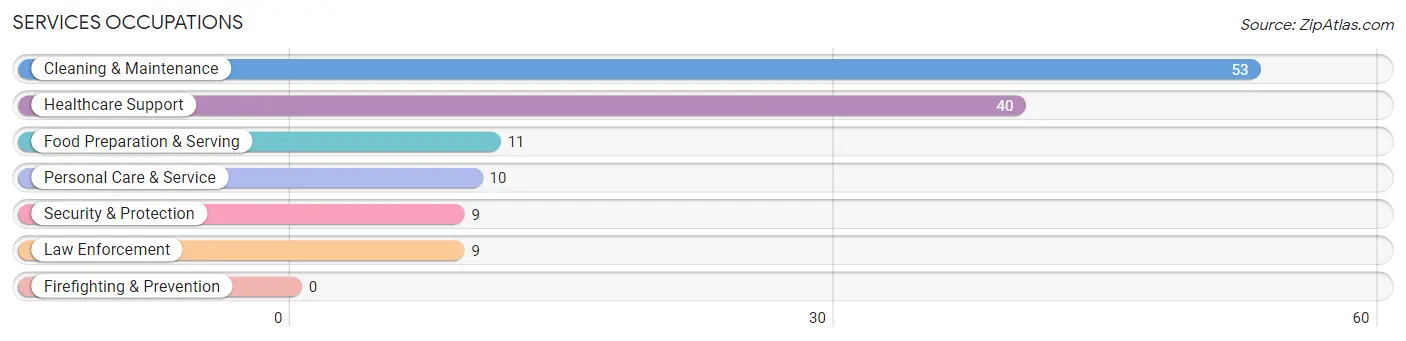
Services Occupations
The most common Services occupations in Benton are Cleaning & Maintenance (53 | 9.8%), Healthcare Support (40 | 7.4%), Food Preparation & Serving (11 | 2.0%), Personal Care & Service (10 | 1.9%), and Security & Protection (9 | 1.7%).
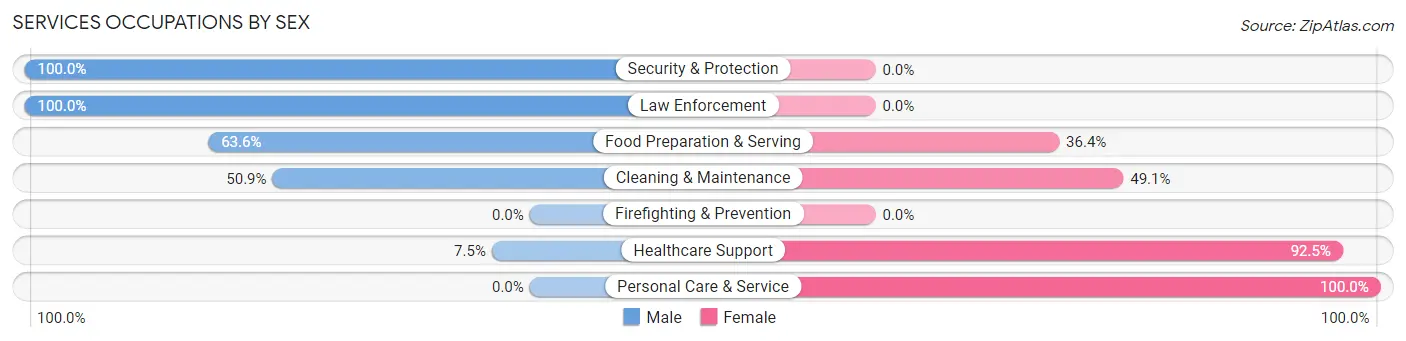
Services Occupations by Sex
Within the Services occupations in Benton, the most male-oriented occupations are Security & Protection (100.0%), Law Enforcement (100.0%), and Food Preparation & Serving (63.6%), while the most female-oriented occupations are Personal Care & Service (100.0%), Healthcare Support (92.5%), and Cleaning & Maintenance (49.1%).
| Occupation | Male | Female |
| Healthcare Support | 3 (7.5%) | 37 (92.5%) |
| Security & Protection | 9 (100.0%) | 0 (0.0%) |
| Firefighting & Prevention | 0 (0.0%) | 0 (0.0%) |
| Law Enforcement | 9 (100.0%) | 0 (0.0%) |
| Food Preparation & Serving | 7 (63.6%) | 4 (36.4%) |
| Cleaning & Maintenance | 27 (50.9%) | 26 (49.1%) |
| Personal Care & Service | 0 (0.0%) | 10 (100.0%) |
| Total (Category) | 46 (37.4%) | 77 (62.6%) |
| Total (Overall) | 307 (57.0%) | 232 (43.0%) |
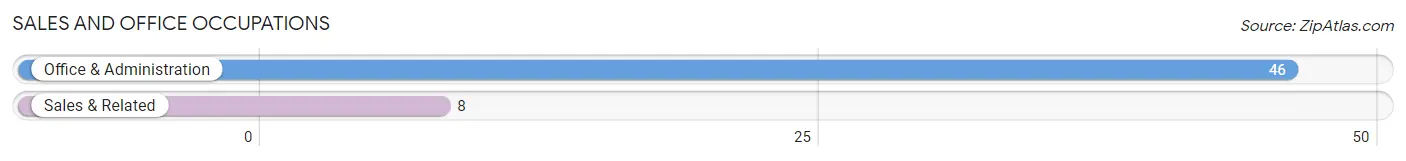
Sales and Office Occupations
The most common Sales and Office occupations in Benton are Office & Administration (46 | 8.5%), and Sales & Related (8 | 1.5%).
Sales and Office Occupations by Sex
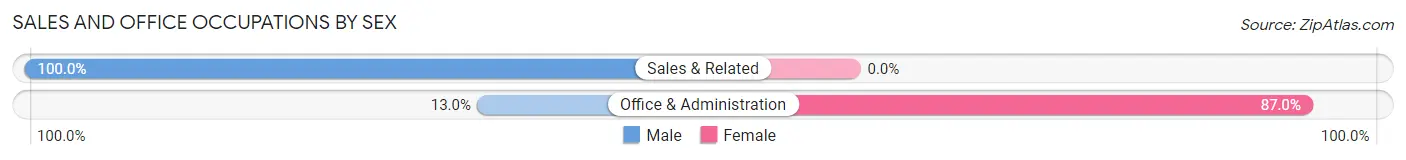
| Occupation | Male | Female |
| Sales & Related | 8 (100.0%) | 0 (0.0%) |
| Office & Administration | 6 (13.0%) | 40 (87.0%) |
| Total (Category) | 14 (25.9%) | 40 (74.1%) |
| Total (Overall) | 307 (57.0%) | 232 (43.0%) |
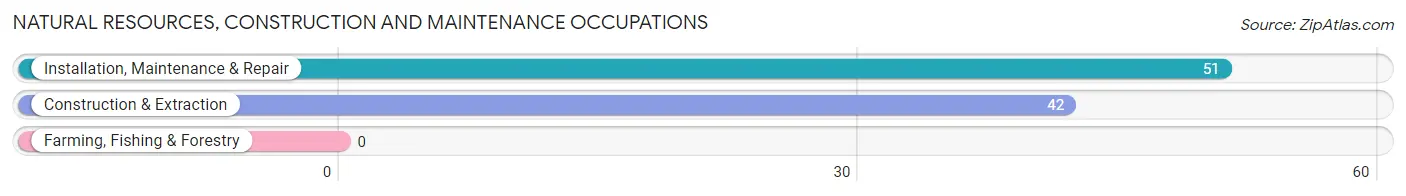
Natural Resources, Construction and Maintenance Occupations
The most common Natural Resources, Construction and Maintenance occupations in Benton are Installation, Maintenance & Repair (51 | 9.5%), and Construction & Extraction (42 | 7.8%).
Natural Resources, Construction and Maintenance Occupations by Sex
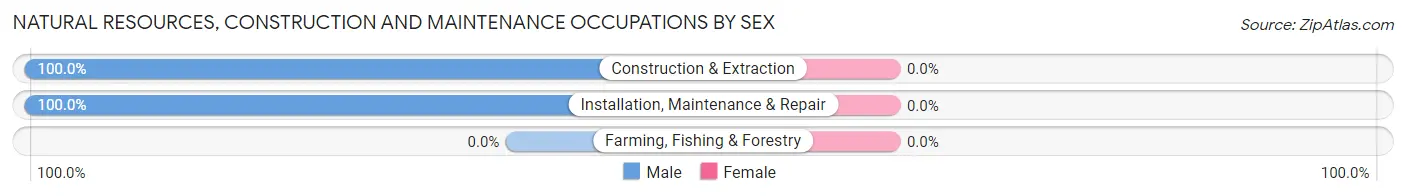
| Occupation | Male | Female |
| Farming, Fishing & Forestry | 0 (0.0%) | 0 (0.0%) |
| Construction & Extraction | 42 (100.0%) | 0 (0.0%) |
| Installation, Maintenance & Repair | 51 (100.0%) | 0 (0.0%) |
| Total (Category) | 93 (100.0%) | 0 (0.0%) |
| Total (Overall) | 307 (57.0%) | 232 (43.0%) |
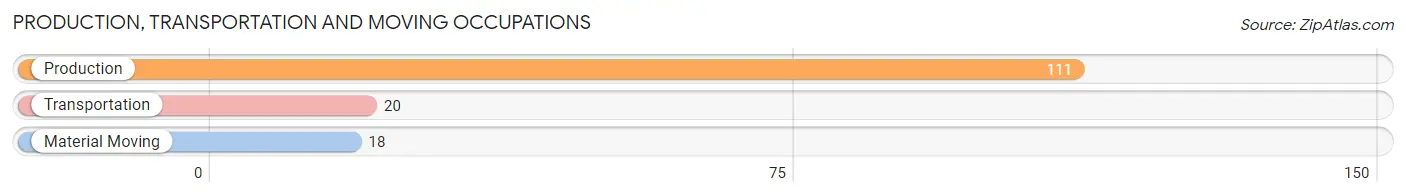
Production, Transportation and Moving Occupations
The most common Production, Transportation and Moving occupations in Benton are Production (111 | 20.6%), Transportation (20 | 3.7%), and Material Moving (18 | 3.3%).
Production, Transportation and Moving Occupations by Sex
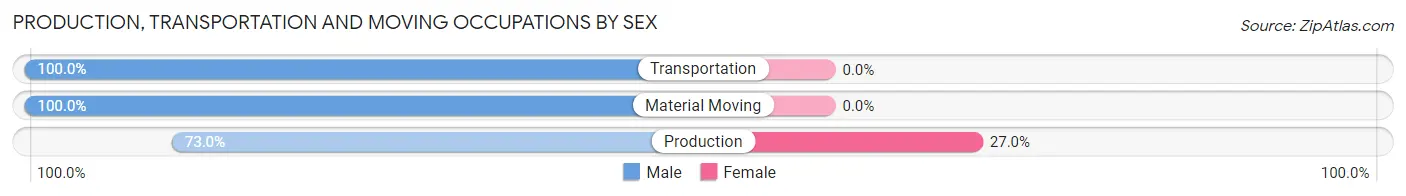
| Occupation | Male | Female |
| Production | 81 (73.0%) | 30 (27.0%) |
| Transportation | 20 (100.0%) | 0 (0.0%) |
| Material Moving | 18 (100.0%) | 0 (0.0%) |
| Total (Category) | 119 (79.9%) | 30 (20.1%) |
| Total (Overall) | 307 (57.0%) | 232 (43.0%) |
Employment Industries by Sex in Benton
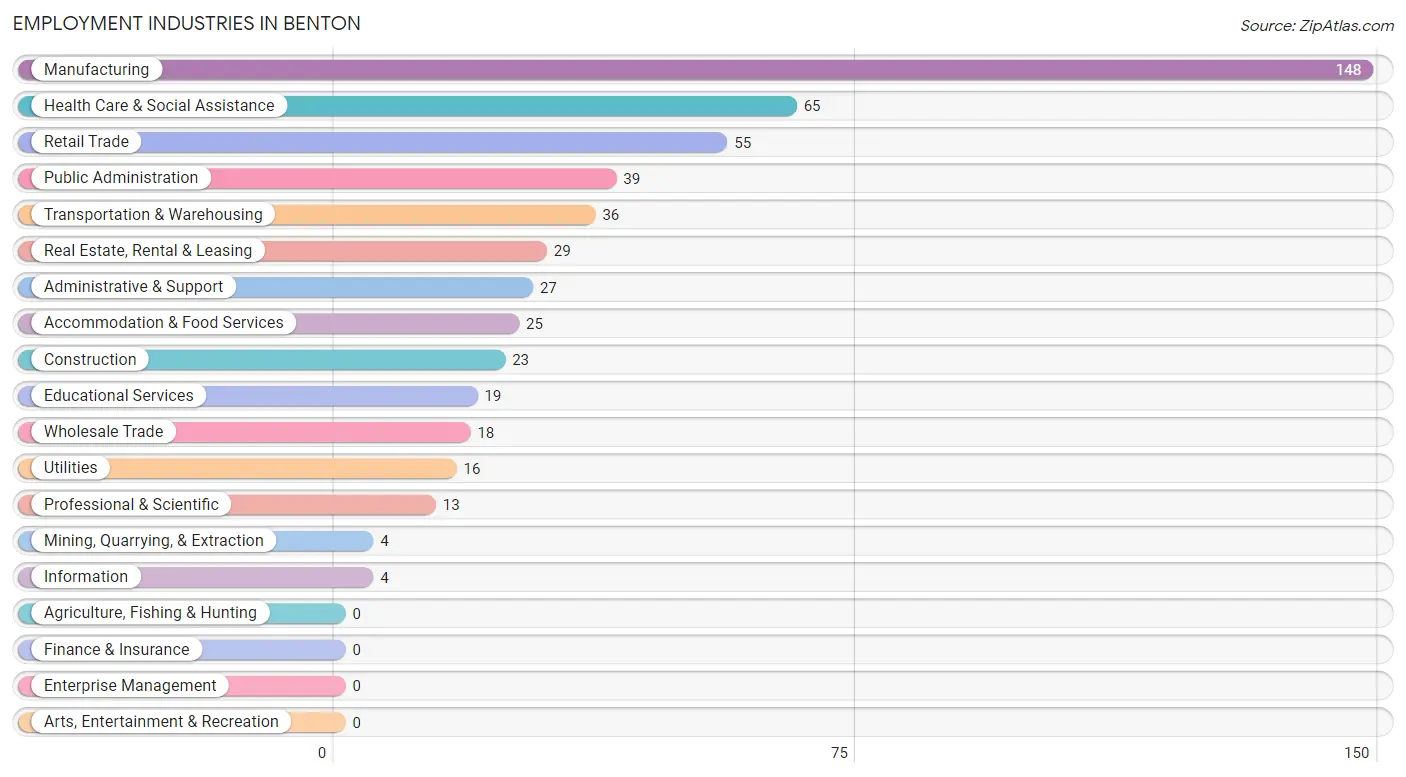
Employment Industries in Benton
The major employment industries in Benton include Manufacturing (148 | 27.5%), Health Care & Social Assistance (65 | 12.1%), Retail Trade (55 | 10.2%), Public Administration (39 | 7.2%), and Transportation & Warehousing (36 | 6.7%).
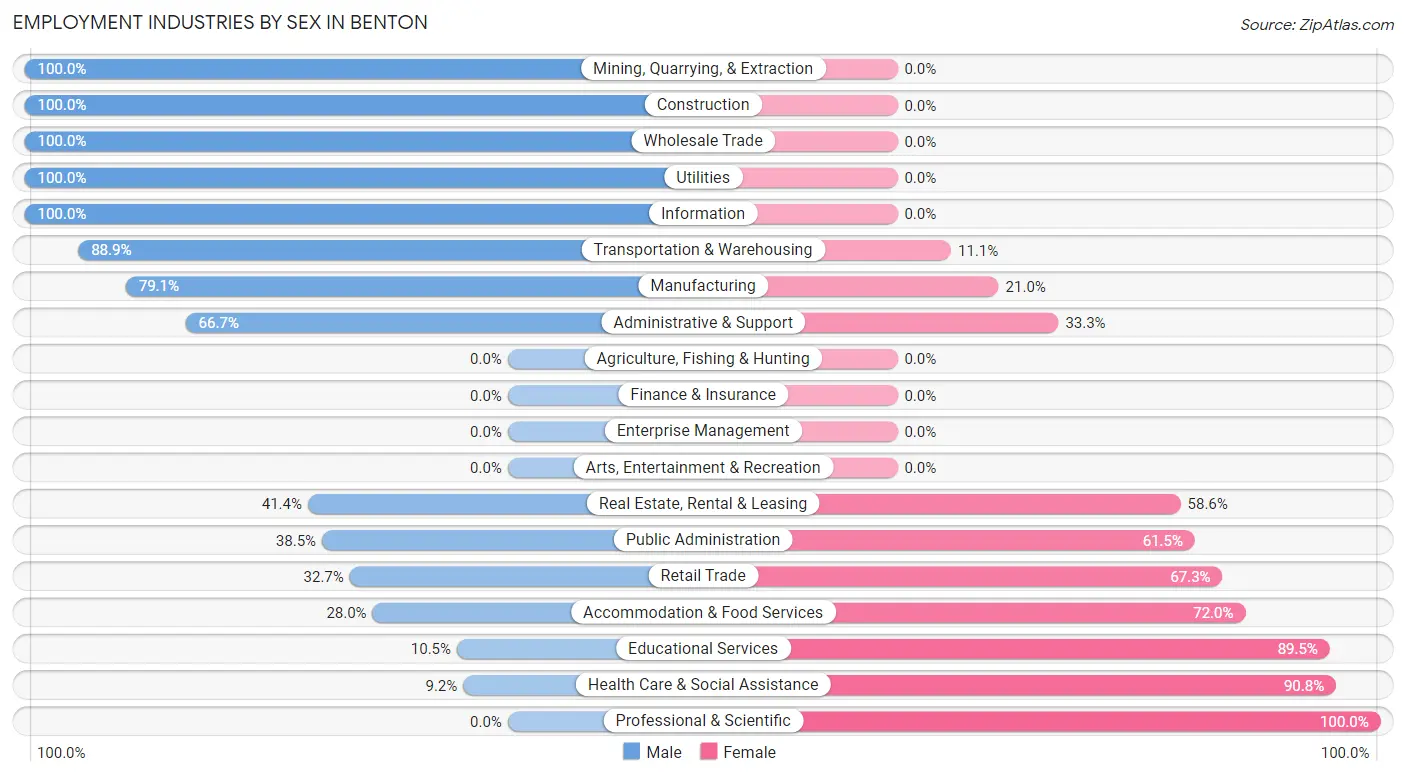
Employment Industries by Sex in Benton
The Benton industries that see more men than women are Mining, Quarrying, & Extraction (100.0%), Construction (100.0%), and Wholesale Trade (100.0%), whereas the industries that tend to have a higher number of women are Professional & Scientific (100.0%), Health Care & Social Assistance (90.8%), and Educational Services (89.5%).
| Industry | Male | Female |
| Agriculture, Fishing & Hunting | 0 (0.0%) | 0 (0.0%) |
| Mining, Quarrying, & Extraction | 4 (100.0%) | 0 (0.0%) |
| Construction | 23 (100.0%) | 0 (0.0%) |
| Manufacturing | 117 (79.0%) | 31 (20.9%) |
| Wholesale Trade | 18 (100.0%) | 0 (0.0%) |
| Retail Trade | 18 (32.7%) | 37 (67.3%) |
| Transportation & Warehousing | 32 (88.9%) | 4 (11.1%) |
| Utilities | 16 (100.0%) | 0 (0.0%) |
| Information | 4 (100.0%) | 0 (0.0%) |
| Finance & Insurance | 0 (0.0%) | 0 (0.0%) |
| Real Estate, Rental & Leasing | 12 (41.4%) | 17 (58.6%) |
| Professional & Scientific | 0 (0.0%) | 13 (100.0%) |
| Enterprise Management | 0 (0.0%) | 0 (0.0%) |
| Administrative & Support | 18 (66.7%) | 9 (33.3%) |
| Educational Services | 2 (10.5%) | 17 (89.5%) |
| Health Care & Social Assistance | 6 (9.2%) | 59 (90.8%) |
| Arts, Entertainment & Recreation | 0 (0.0%) | 0 (0.0%) |
| Accommodation & Food Services | 7 (28.0%) | 18 (72.0%) |
| Public Administration | 15 (38.5%) | 24 (61.5%) |
| Total | 307 (57.0%) | 232 (43.0%) |
Education in Benton
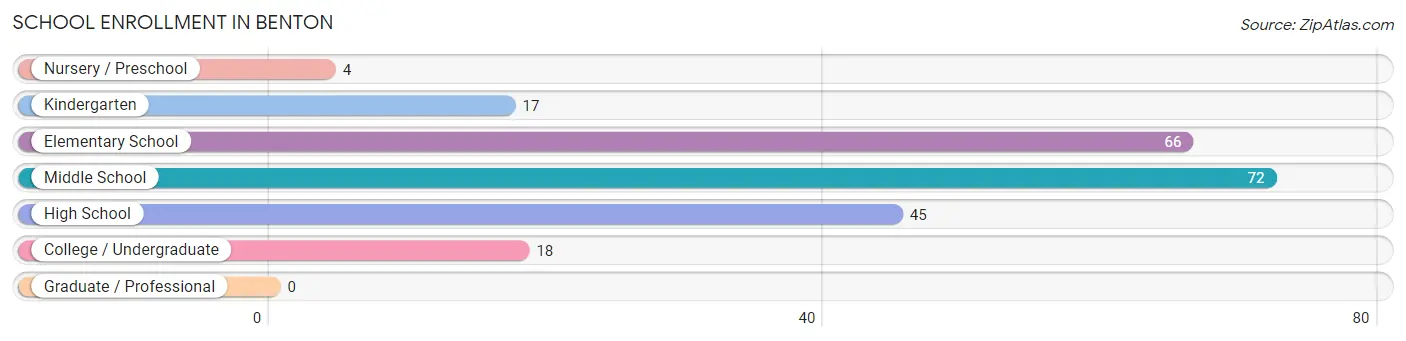
School Enrollment in Benton
The most common levels of schooling among the 222 students in Benton are middle school (72 | 32.4%), elementary school (66 | 29.7%), and high school (45 | 20.3%).
| School Level | # Students | % Students |
| Nursery / Preschool | 4 | 1.8% |
| Kindergarten | 17 | 7.7% |
| Elementary School | 66 | 29.7% |
| Middle School | 72 | 32.4% |
| High School | 45 | 20.3% |
| College / Undergraduate | 18 | 8.1% |
| Graduate / Professional | 0 | 0.0% |
| Total | 222 | 100.0% |
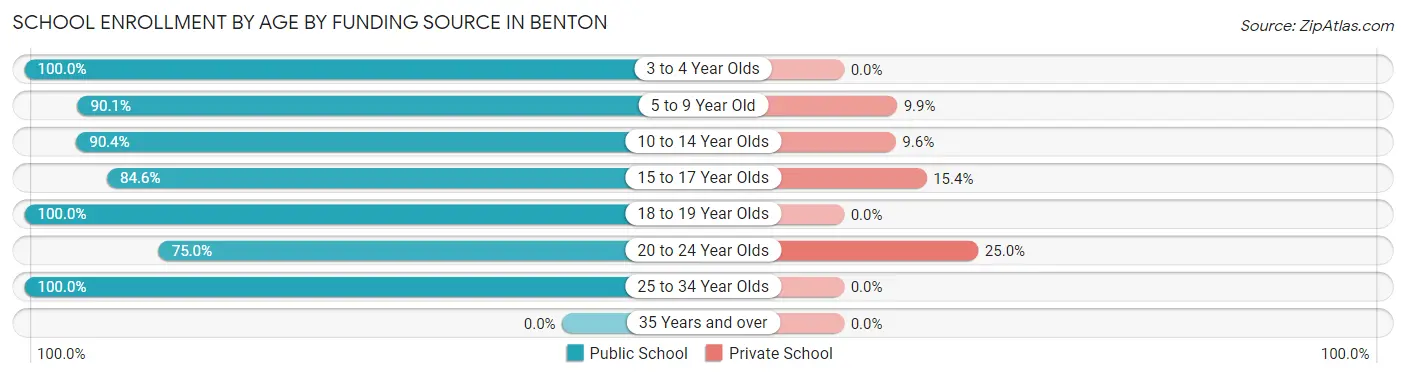
School Enrollment by Age by Funding Source in Benton
Out of a total of 222 students who are enrolled in schools in Benton, 23 (10.4%) attend a private institution, while the remaining 199 (89.6%) are enrolled in public schools. The age group of 20 to 24 year olds has the highest likelihood of being enrolled in private schools, with 3 (25.0% in the age bracket) enrolled. Conversely, the age group of 3 to 4 year olds has the lowest likelihood of being enrolled in a private school, with 4 (100.0% in the age bracket) attending a public institution.
| Age Bracket | Public School | Private School |
| 3 to 4 Year Olds | 4 (100.0%) | 0 (0.0%) |
| 5 to 9 Year Old | 73 (90.1%) | 8 (9.9%) |
| 10 to 14 Year Olds | 75 (90.4%) | 8 (9.6%) |
| 15 to 17 Year Olds | 22 (84.6%) | 4 (15.4%) |
| 18 to 19 Year Olds | 12 (100.0%) | 0 (0.0%) |
| 20 to 24 Year Olds | 9 (75.0%) | 3 (25.0%) |
| 25 to 34 Year Olds | 4 (100.0%) | 0 (0.0%) |
| 35 Years and over | 0 (0.0%) | 0 (0.0%) |
| Total | 199 (89.6%) | 23 (10.4%) |
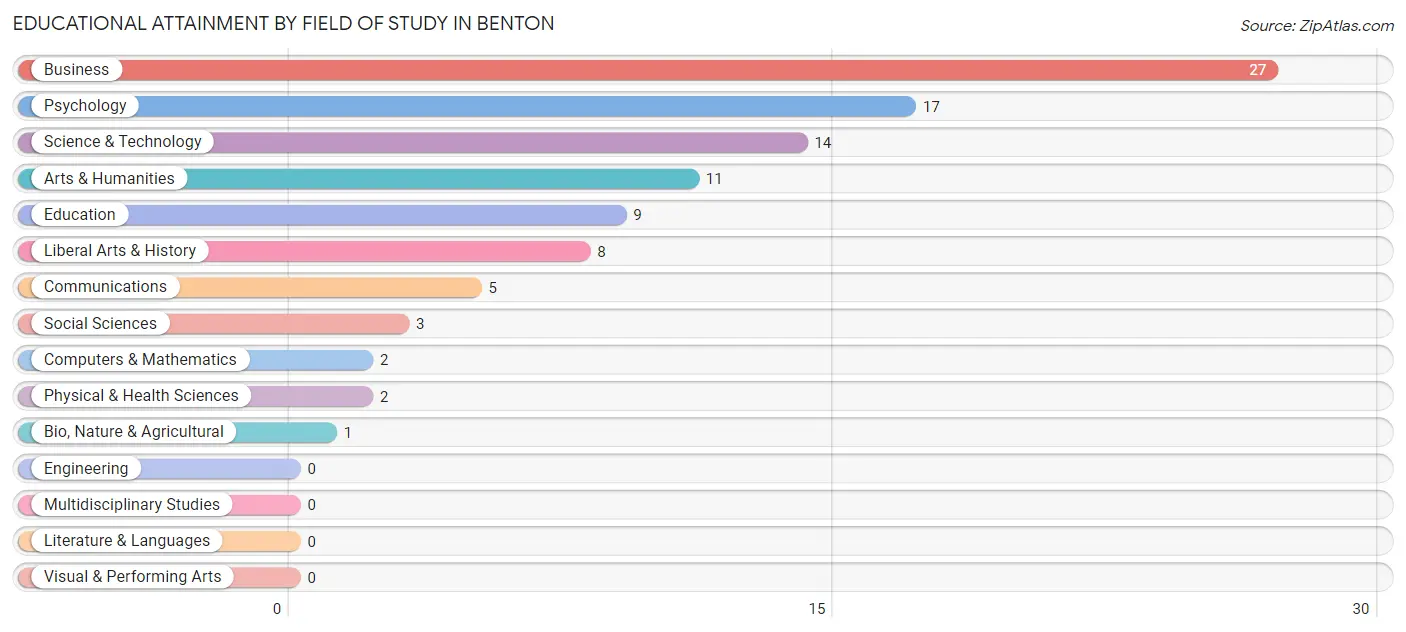
Educational Attainment by Field of Study in Benton
Business (27 | 27.3%), psychology (17 | 17.2%), science & technology (14 | 14.1%), arts & humanities (11 | 11.1%), and education (9 | 9.1%) are the most common fields of study among 99 individuals in Benton who have obtained a bachelor's degree or higher.
| Field of Study | # Graduates | % Graduates |
| Computers & Mathematics | 2 | 2.0% |
| Bio, Nature & Agricultural | 1 | 1.0% |
| Physical & Health Sciences | 2 | 2.0% |
| Psychology | 17 | 17.2% |
| Social Sciences | 3 | 3.0% |
| Engineering | 0 | 0.0% |
| Multidisciplinary Studies | 0 | 0.0% |
| Science & Technology | 14 | 14.1% |
| Business | 27 | 27.3% |
| Education | 9 | 9.1% |
| Literature & Languages | 0 | 0.0% |
| Liberal Arts & History | 8 | 8.1% |
| Visual & Performing Arts | 0 | 0.0% |
| Communications | 5 | 5.1% |
| Arts & Humanities | 11 | 11.1% |
| Total | 99 | 100.0% |
Transportation & Commute in Benton
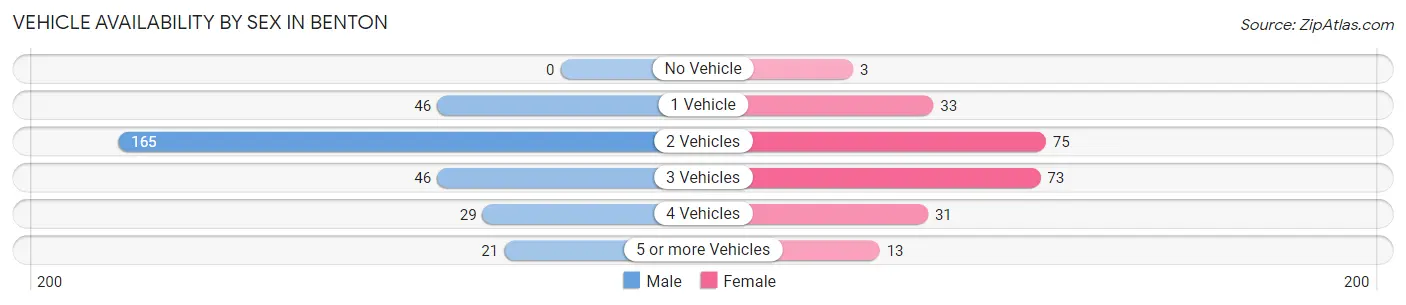
Vehicle Availability by Sex in Benton
The most prevalent vehicle ownership categories in Benton are males with 2 vehicles (165, accounting for 53.7%) and females with 2 vehicles (75, making up 72.4%).
| Vehicles Available | Male | Female |
| No Vehicle | 0 (0.0%) | 3 (1.3%) |
| 1 Vehicle | 46 (15.0%) | 33 (14.5%) |
| 2 Vehicles | 165 (53.7%) | 75 (32.9%) |
| 3 Vehicles | 46 (15.0%) | 73 (32.0%) |
| 4 Vehicles | 29 (9.5%) | 31 (13.6%) |
| 5 or more Vehicles | 21 (6.8%) | 13 (5.7%) |
| Total | 307 (100.0%) | 228 (100.0%) |
Commute Time in Benton
The most frequently occuring commute durations in Benton are 30 to 34 minutes (123 commuters, 24.2%), 20 to 24 minutes (76 commuters, 14.9%), and 10 to 14 minutes (73 commuters, 14.3%).
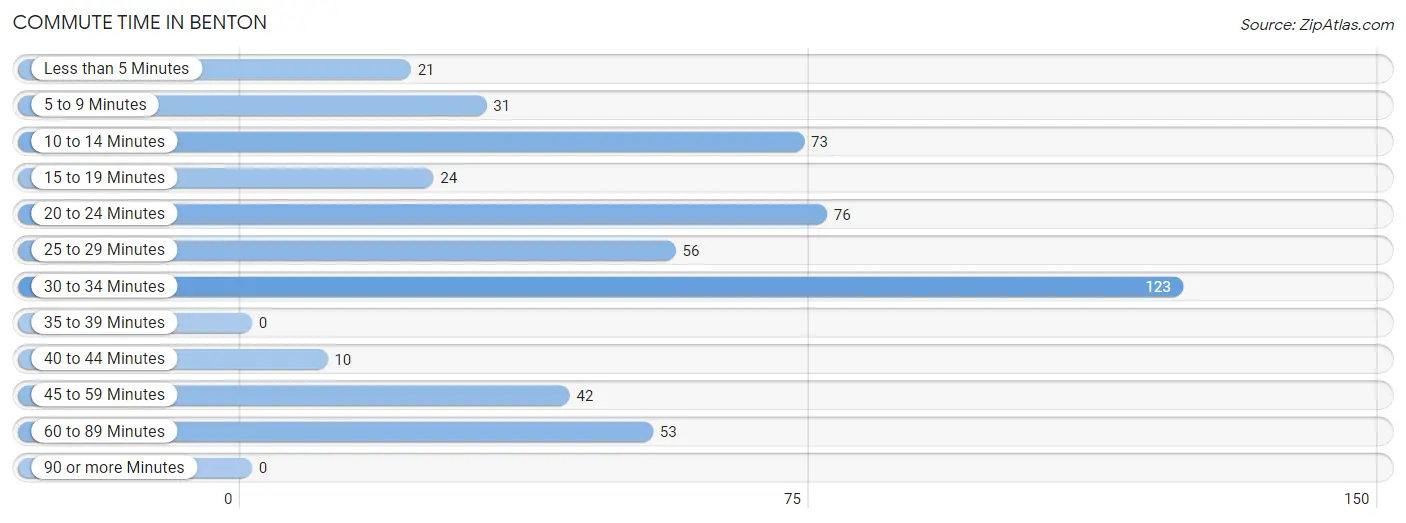
| Commute Time | # Commuters | % Commuters |
| Less than 5 Minutes | 21 | 4.1% |
| 5 to 9 Minutes | 31 | 6.1% |
| 10 to 14 Minutes | 73 | 14.3% |
| 15 to 19 Minutes | 24 | 4.7% |
| 20 to 24 Minutes | 76 | 14.9% |
| 25 to 29 Minutes | 56 | 11.0% |
| 30 to 34 Minutes | 123 | 24.2% |
| 35 to 39 Minutes | 0 | 0.0% |
| 40 to 44 Minutes | 10 | 2.0% |
| 45 to 59 Minutes | 42 | 8.3% |
| 60 to 89 Minutes | 53 | 10.4% |
| 90 or more Minutes | 0 | 0.0% |
Commute Time by Sex in Benton
The most common commute times in Benton are 30 to 34 minutes (101 commuters, 34.2%) for males and 20 to 24 minutes (56 commuters, 26.2%) for females.
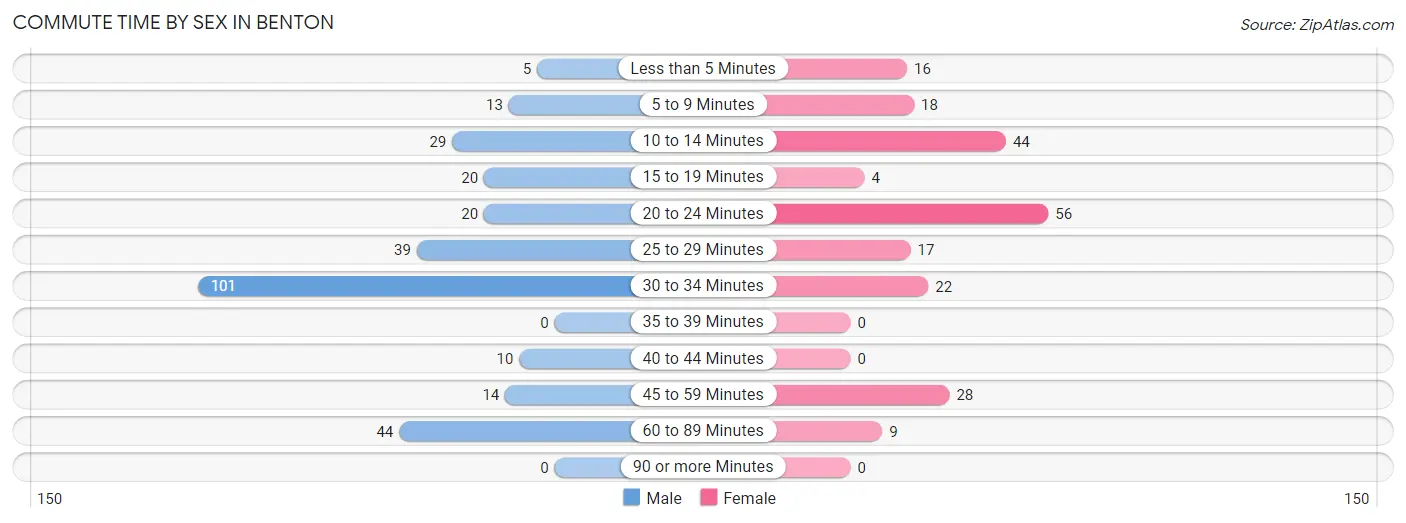
| Commute Time | Male | Female |
| Less than 5 Minutes | 5 (1.7%) | 16 (7.5%) |
| 5 to 9 Minutes | 13 (4.4%) | 18 (8.4%) |
| 10 to 14 Minutes | 29 (9.8%) | 44 (20.6%) |
| 15 to 19 Minutes | 20 (6.8%) | 4 (1.9%) |
| 20 to 24 Minutes | 20 (6.8%) | 56 (26.2%) |
| 25 to 29 Minutes | 39 (13.2%) | 17 (7.9%) |
| 30 to 34 Minutes | 101 (34.2%) | 22 (10.3%) |
| 35 to 39 Minutes | 0 (0.0%) | 0 (0.0%) |
| 40 to 44 Minutes | 10 (3.4%) | 0 (0.0%) |
| 45 to 59 Minutes | 14 (4.8%) | 28 (13.1%) |
| 60 to 89 Minutes | 44 (14.9%) | 9 (4.2%) |
| 90 or more Minutes | 0 (0.0%) | 0 (0.0%) |
Time of Departure to Work by Sex in Benton
The most frequent times of departure to work in Benton are 12:00 AM to 4:59 AM (70, 23.7%) for males and 10:00 AM to 10:59 AM (31, 14.5%) for females.
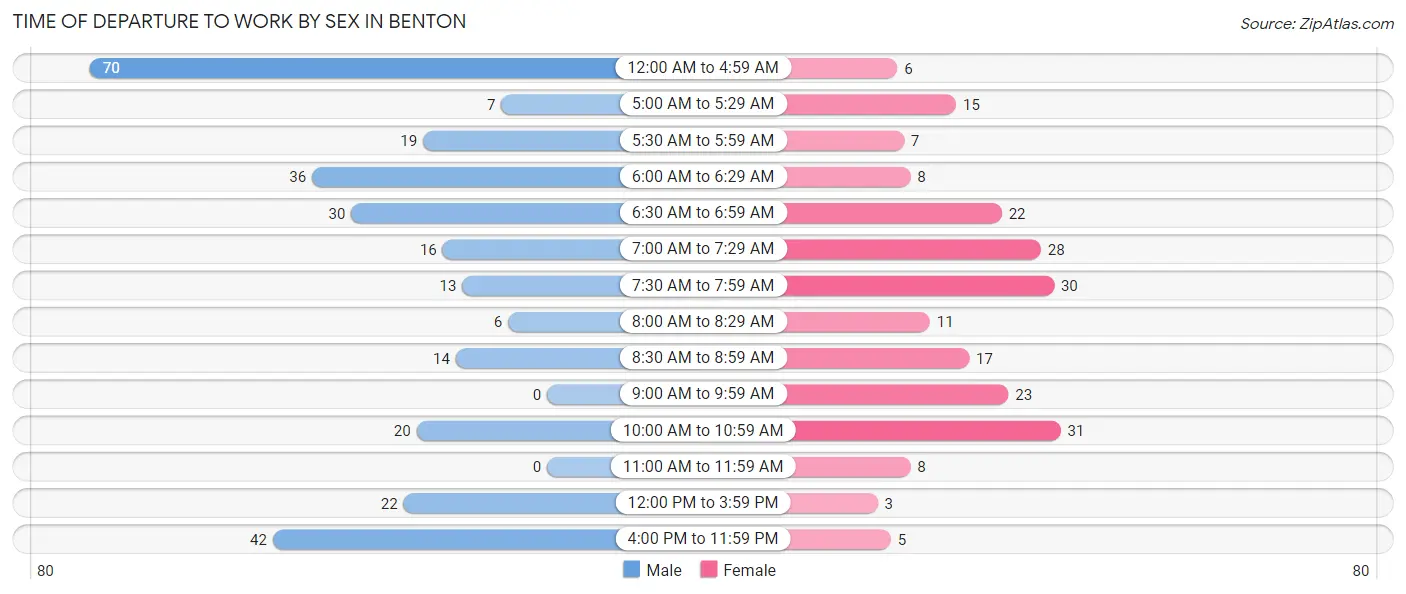
| Time of Departure | Male | Female |
| 12:00 AM to 4:59 AM | 70 (23.7%) | 6 (2.8%) |
| 5:00 AM to 5:29 AM | 7 (2.4%) | 15 (7.0%) |
| 5:30 AM to 5:59 AM | 19 (6.4%) | 7 (3.3%) |
| 6:00 AM to 6:29 AM | 36 (12.2%) | 8 (3.7%) |
| 6:30 AM to 6:59 AM | 30 (10.2%) | 22 (10.3%) |
| 7:00 AM to 7:29 AM | 16 (5.4%) | 28 (13.1%) |
| 7:30 AM to 7:59 AM | 13 (4.4%) | 30 (14.0%) |
| 8:00 AM to 8:29 AM | 6 (2.0%) | 11 (5.1%) |
| 8:30 AM to 8:59 AM | 14 (4.8%) | 17 (7.9%) |
| 9:00 AM to 9:59 AM | 0 (0.0%) | 23 (10.7%) |
| 10:00 AM to 10:59 AM | 20 (6.8%) | 31 (14.5%) |
| 11:00 AM to 11:59 AM | 0 (0.0%) | 8 (3.7%) |
| 12:00 PM to 3:59 PM | 22 (7.5%) | 3 (1.4%) |
| 4:00 PM to 11:59 PM | 42 (14.2%) | 5 (2.3%) |
| Total | 295 (100.0%) | 214 (100.0%) |
Housing Occupancy in Benton
Occupancy by Ownership in Benton
Of the total 611 dwellings in Benton, owner-occupied units account for 343 (56.1%), while renter-occupied units make up 268 (43.9%).
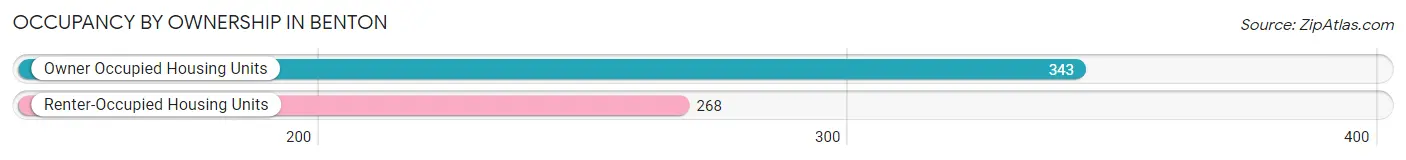
| Occupancy | # Housing Units | % Housing Units |
| Owner Occupied Housing Units | 343 | 56.1% |
| Renter-Occupied Housing Units | 268 | 43.9% |
| Total Occupied Housing Units | 611 | 100.0% |
Occupancy by Household Size in Benton
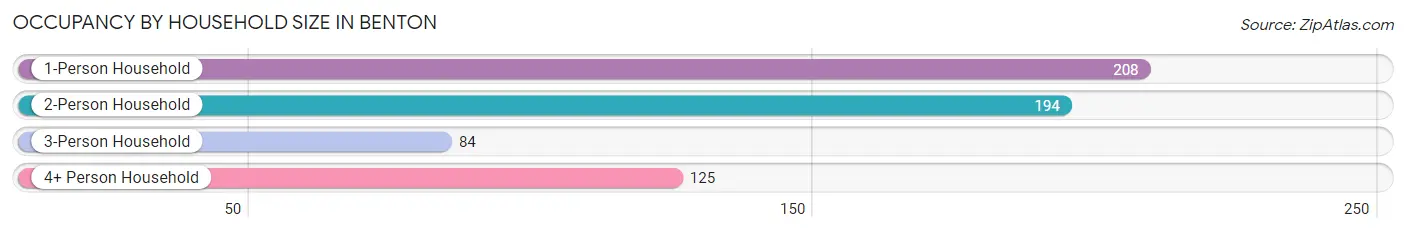
| Household Size | # Housing Units | % Housing Units |
| 1-Person Household | 208 | 34.0% |
| 2-Person Household | 194 | 31.8% |
| 3-Person Household | 84 | 13.8% |
| 4+ Person Household | 125 | 20.5% |
| Total Housing Units | 611 | 100.0% |
Occupancy by Ownership by Household Size in Benton
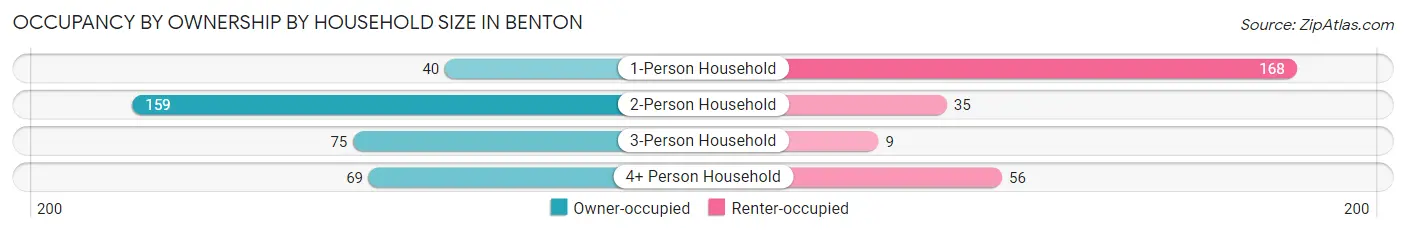
| Household Size | Owner-occupied | Renter-occupied |
| 1-Person Household | 40 (19.2%) | 168 (80.8%) |
| 2-Person Household | 159 (82.0%) | 35 (18.0%) |
| 3-Person Household | 75 (89.3%) | 9 (10.7%) |
| 4+ Person Household | 69 (55.2%) | 56 (44.8%) |
| Total Housing Units | 343 (56.1%) | 268 (43.9%) |
Occupancy by Educational Attainment in Benton
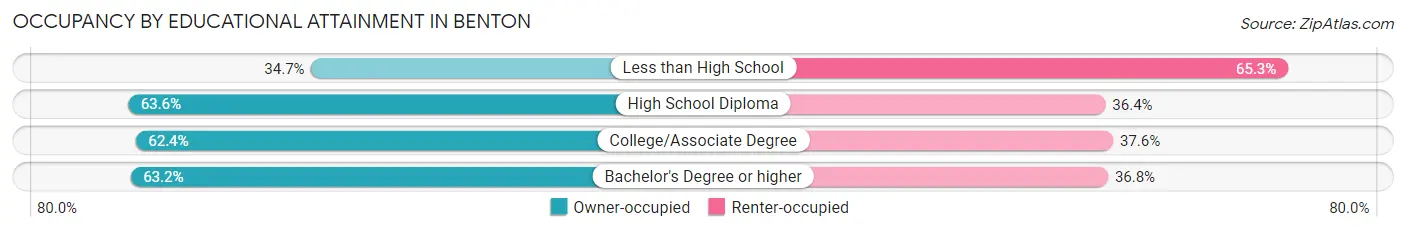
| Household Size | Owner-occupied | Renter-occupied |
| Less than High School | 52 (34.7%) | 98 (65.3%) |
| High School Diploma | 140 (63.6%) | 80 (36.4%) |
| College/Associate Degree | 108 (62.4%) | 65 (37.6%) |
| Bachelor's Degree or higher | 43 (63.2%) | 25 (36.8%) |
Occupancy by Age of Householder in Benton
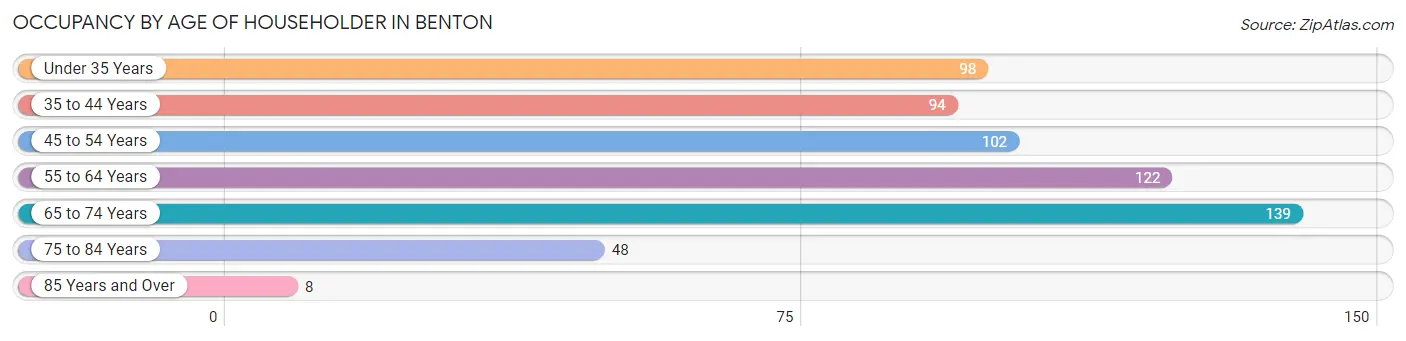
| Age Bracket | # Households | % Households |
| Under 35 Years | 98 | 16.0% |
| 35 to 44 Years | 94 | 15.4% |
| 45 to 54 Years | 102 | 16.7% |
| 55 to 64 Years | 122 | 20.0% |
| 65 to 74 Years | 139 | 22.8% |
| 75 to 84 Years | 48 | 7.9% |
| 85 Years and Over | 8 | 1.3% |
| Total | 611 | 100.0% |
Housing Finances in Benton
Median Income by Occupancy in Benton
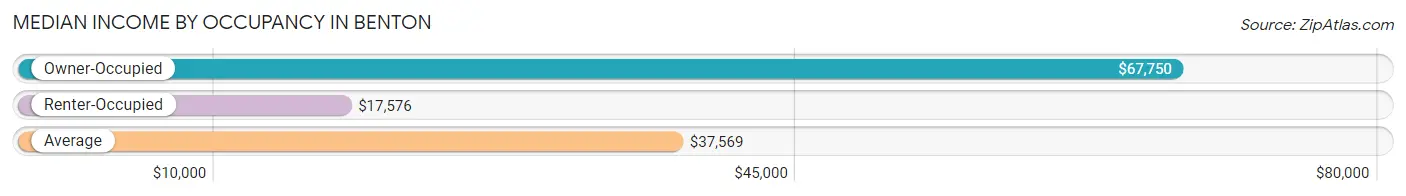
| Occupancy Type | # Households | Median Income |
| Owner-Occupied | 343 (56.1%) | $67,750 |
| Renter-Occupied | 268 (43.9%) | $17,576 |
| Average | 611 (100.0%) | $37,569 |
Occupancy by Householder Income Bracket in Benton
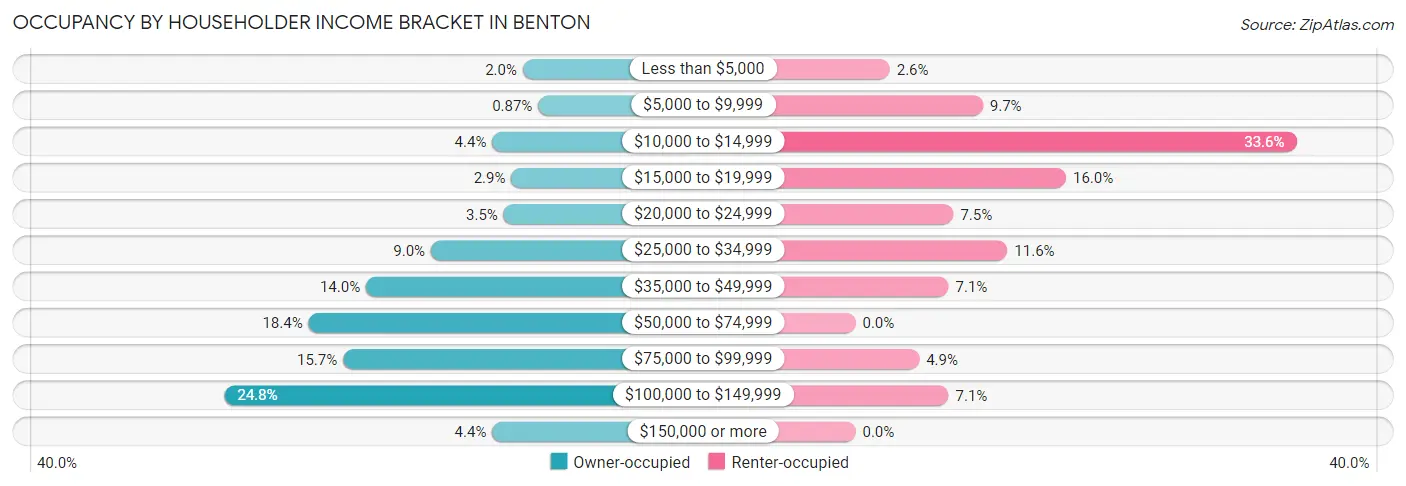
| Income Bracket | Owner-occupied | Renter-occupied |
| Less than $5,000 | 7 (2.0%) | 7 (2.6%) |
| $5,000 to $9,999 | 3 (0.9%) | 26 (9.7%) |
| $10,000 to $14,999 | 15 (4.4%) | 90 (33.6%) |
| $15,000 to $19,999 | 10 (2.9%) | 43 (16.0%) |
| $20,000 to $24,999 | 12 (3.5%) | 20 (7.5%) |
| $25,000 to $34,999 | 31 (9.0%) | 31 (11.6%) |
| $35,000 to $49,999 | 48 (14.0%) | 19 (7.1%) |
| $50,000 to $74,999 | 63 (18.4%) | 0 (0.0%) |
| $75,000 to $99,999 | 54 (15.7%) | 13 (4.9%) |
| $100,000 to $149,999 | 85 (24.8%) | 19 (7.1%) |
| $150,000 or more | 15 (4.4%) | 0 (0.0%) |
| Total | 343 (100.0%) | 268 (100.0%) |
Monthly Housing Cost Tiers in Benton
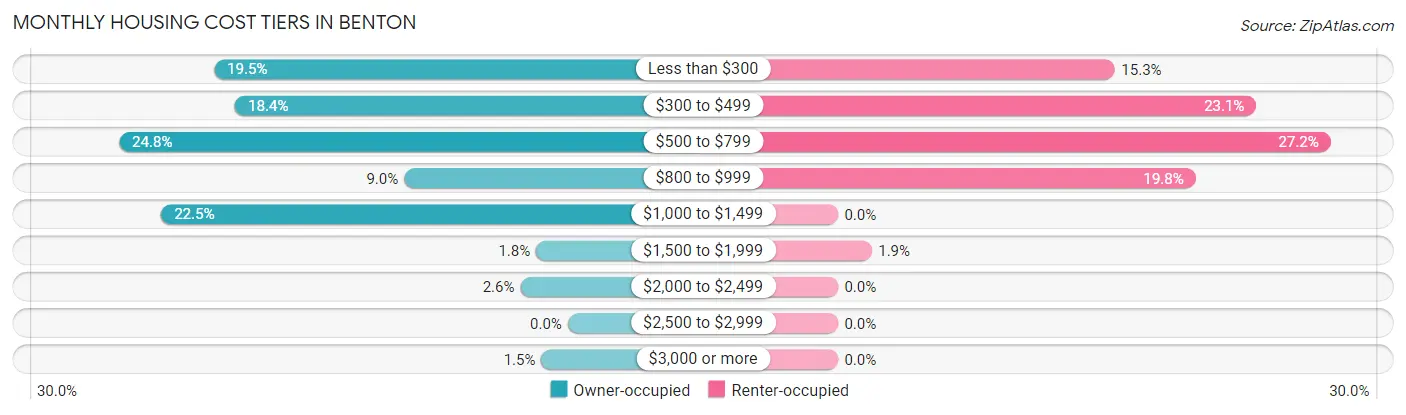
| Monthly Cost | Owner-occupied | Renter-occupied |
| Less than $300 | 67 (19.5%) | 41 (15.3%) |
| $300 to $499 | 63 (18.4%) | 62 (23.1%) |
| $500 to $799 | 85 (24.8%) | 73 (27.2%) |
| $800 to $999 | 31 (9.0%) | 53 (19.8%) |
| $1,000 to $1,499 | 77 (22.5%) | 0 (0.0%) |
| $1,500 to $1,999 | 6 (1.8%) | 5 (1.9%) |
| $2,000 to $2,499 | 9 (2.6%) | 0 (0.0%) |
| $2,500 to $2,999 | 0 (0.0%) | 0 (0.0%) |
| $3,000 or more | 5 (1.5%) | 0 (0.0%) |
| Total | 343 (100.0%) | 268 (100.0%) |
Physical Housing Characteristics in Benton
Housing Structures in Benton
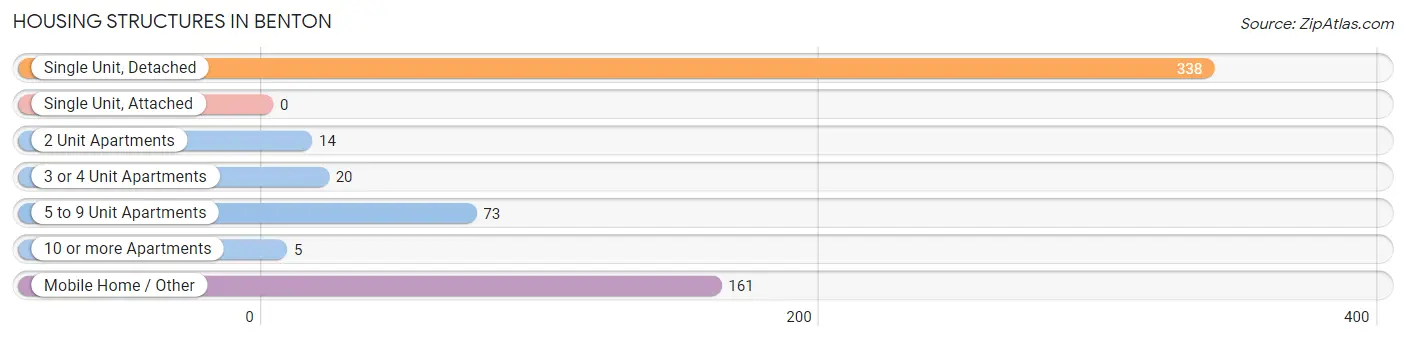
| Structure Type | # Housing Units | % Housing Units |
| Single Unit, Detached | 338 | 55.3% |
| Single Unit, Attached | 0 | 0.0% |
| 2 Unit Apartments | 14 | 2.3% |
| 3 or 4 Unit Apartments | 20 | 3.3% |
| 5 to 9 Unit Apartments | 73 | 11.9% |
| 10 or more Apartments | 5 | 0.8% |
| Mobile Home / Other | 161 | 26.4% |
| Total | 611 | 100.0% |
Housing Structures by Occupancy in Benton
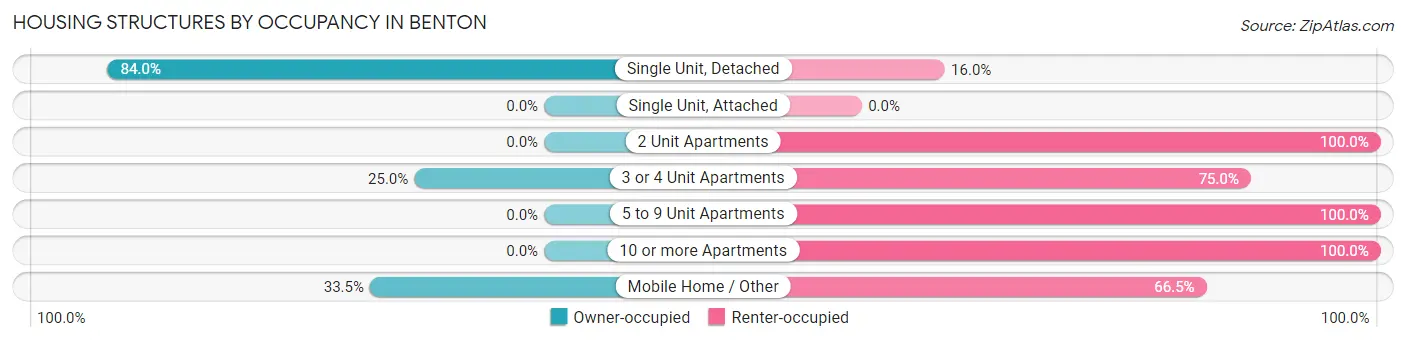
| Structure Type | Owner-occupied | Renter-occupied |
| Single Unit, Detached | 284 (84.0%) | 54 (16.0%) |
| Single Unit, Attached | 0 (0.0%) | 0 (0.0%) |
| 2 Unit Apartments | 0 (0.0%) | 14 (100.0%) |
| 3 or 4 Unit Apartments | 5 (25.0%) | 15 (75.0%) |
| 5 to 9 Unit Apartments | 0 (0.0%) | 73 (100.0%) |
| 10 or more Apartments | 0 (0.0%) | 5 (100.0%) |
| Mobile Home / Other | 54 (33.5%) | 107 (66.5%) |
| Total | 343 (56.1%) | 268 (43.9%) |
Housing Structures by Number of Rooms in Benton
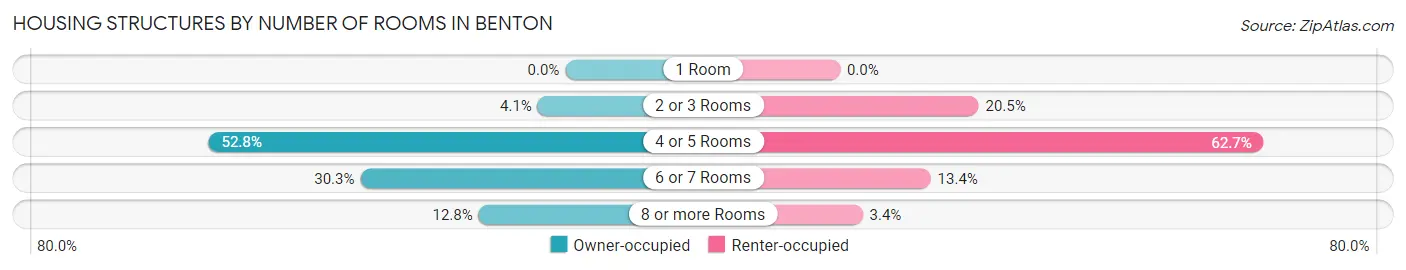
| Number of Rooms | Owner-occupied | Renter-occupied |
| 1 Room | 0 (0.0%) | 0 (0.0%) |
| 2 or 3 Rooms | 14 (4.1%) | 55 (20.5%) |
| 4 or 5 Rooms | 181 (52.8%) | 168 (62.7%) |
| 6 or 7 Rooms | 104 (30.3%) | 36 (13.4%) |
| 8 or more Rooms | 44 (12.8%) | 9 (3.4%) |
| Total | 343 (100.0%) | 268 (100.0%) |
Housing Structure by Heating Type in Benton
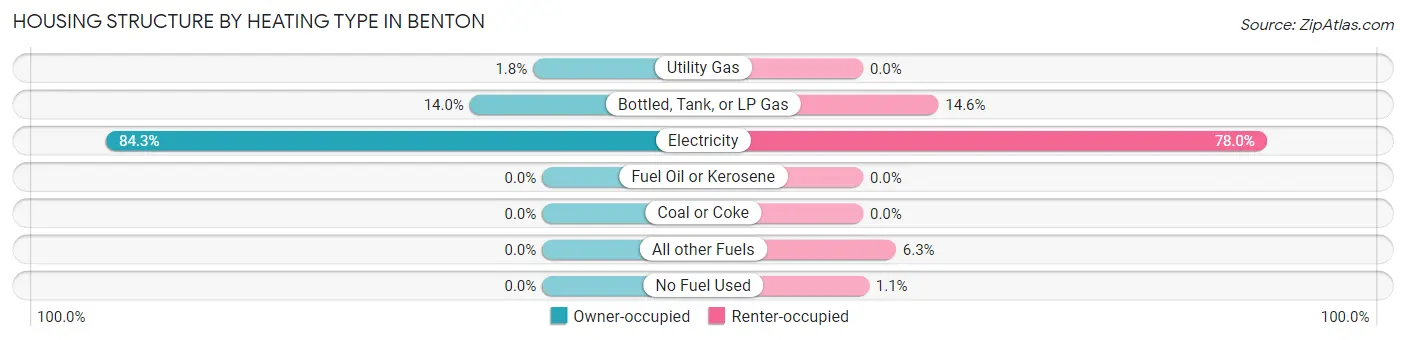
| Heating Type | Owner-occupied | Renter-occupied |
| Utility Gas | 6 (1.8%) | 0 (0.0%) |
| Bottled, Tank, or LP Gas | 48 (14.0%) | 39 (14.5%) |
| Electricity | 289 (84.3%) | 209 (78.0%) |
| Fuel Oil or Kerosene | 0 (0.0%) | 0 (0.0%) |
| Coal or Coke | 0 (0.0%) | 0 (0.0%) |
| All other Fuels | 0 (0.0%) | 17 (6.3%) |
| No Fuel Used | 0 (0.0%) | 3 (1.1%) |
| Total | 343 (100.0%) | 268 (100.0%) |
Household Vehicle Usage in Benton
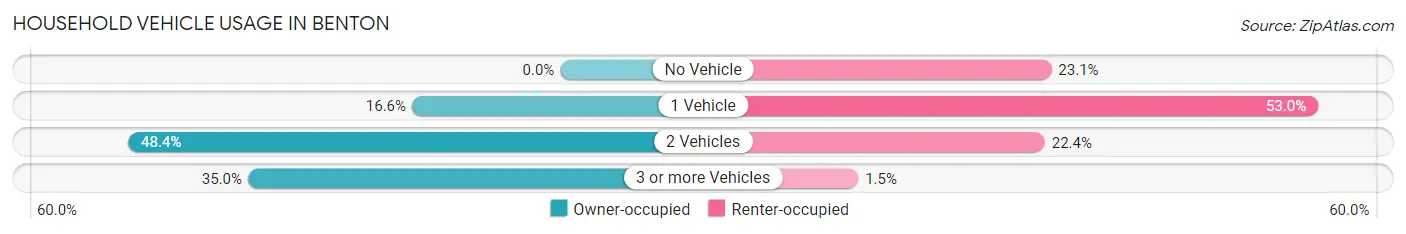
| Vehicles per Household | Owner-occupied | Renter-occupied |
| No Vehicle | 0 (0.0%) | 62 (23.1%) |
| 1 Vehicle | 57 (16.6%) | 142 (53.0%) |
| 2 Vehicles | 166 (48.4%) | 60 (22.4%) |
| 3 or more Vehicles | 120 (35.0%) | 4 (1.5%) |
| Total | 343 (100.0%) | 268 (100.0%) |
Real Estate & Mortgages in Benton
Real Estate and Mortgage Overview in Benton
| Characteristic | Without Mortgage | With Mortgage |
| Housing Units | 188 | 155 |
| Median Property Value | $98,600 | $172,700 |
| Median Household Income | $50,000 | $15 |
| Monthly Housing Costs | $376 | $5 |
| Real Estate Taxes | $779 | $5 |
Property Value by Mortgage Status in Benton
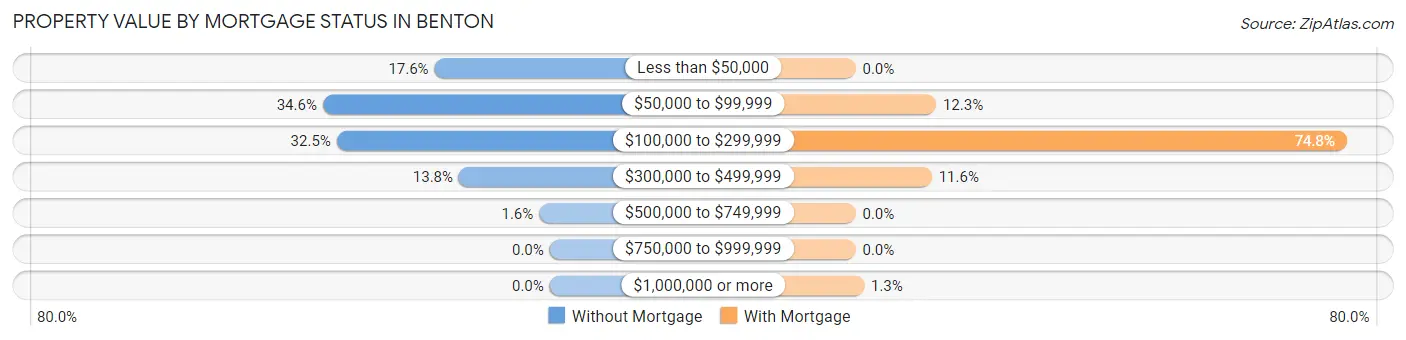
| Property Value | Without Mortgage | With Mortgage |
| Less than $50,000 | 33 (17.5%) | 0 (0.0%) |
| $50,000 to $99,999 | 65 (34.6%) | 19 (12.3%) |
| $100,000 to $299,999 | 61 (32.5%) | 116 (74.8%) |
| $300,000 to $499,999 | 26 (13.8%) | 18 (11.6%) |
| $500,000 to $749,999 | 3 (1.6%) | 0 (0.0%) |
| $750,000 to $999,999 | 0 (0.0%) | 0 (0.0%) |
| $1,000,000 or more | 0 (0.0%) | 2 (1.3%) |
| Total | 188 (100.0%) | 155 (100.0%) |
Household Income by Mortgage Status in Benton
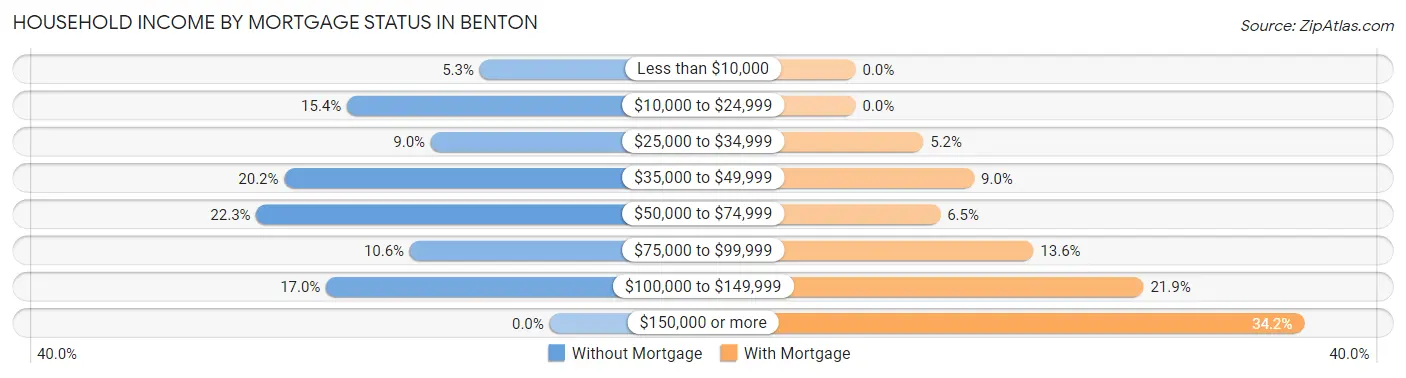
| Household Income | Without Mortgage | With Mortgage |
| Less than $10,000 | 10 (5.3%) | 0 (0.0%) |
| $10,000 to $24,999 | 29 (15.4%) | 0 (0.0%) |
| $25,000 to $34,999 | 17 (9.0%) | 8 (5.2%) |
| $35,000 to $49,999 | 38 (20.2%) | 14 (9.0%) |
| $50,000 to $74,999 | 42 (22.3%) | 10 (6.5%) |
| $75,000 to $99,999 | 20 (10.6%) | 21 (13.6%) |
| $100,000 to $149,999 | 32 (17.0%) | 34 (21.9%) |
| $150,000 or more | 0 (0.0%) | 53 (34.2%) |
| Total | 188 (100.0%) | 155 (100.0%) |
Property Value to Household Income Ratio in Benton
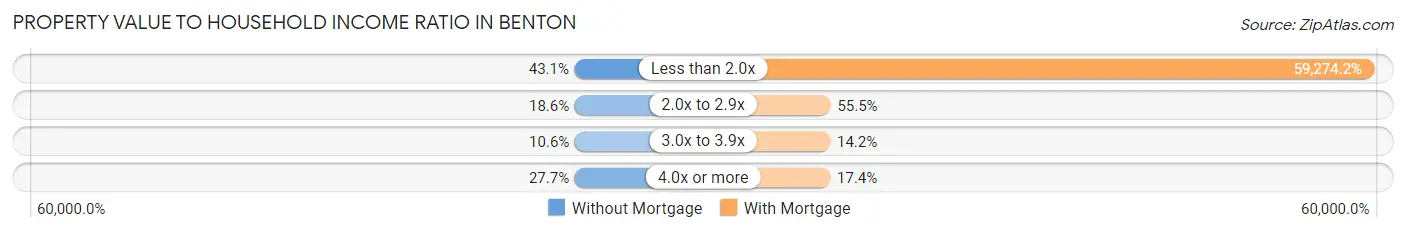
| Value-to-Income Ratio | Without Mortgage | With Mortgage |
| Less than 2.0x | 81 (43.1%) | 91,875 (59,274.2%) |
| 2.0x to 2.9x | 35 (18.6%) | 86 (55.5%) |
| 3.0x to 3.9x | 20 (10.6%) | 22 (14.2%) |
| 4.0x or more | 52 (27.7%) | 27 (17.4%) |
| Total | 188 (100.0%) | 155 (100.0%) |
Real Estate Taxes by Mortgage Status in Benton
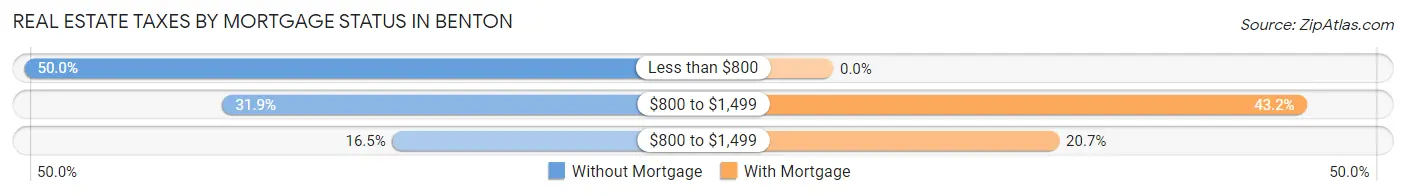
| Property Taxes | Without Mortgage | With Mortgage |
| Less than $800 | 94 (50.0%) | 0 (0.0%) |
| $800 to $1,499 | 60 (31.9%) | 67 (43.2%) |
| $800 to $1,499 | 31 (16.5%) | 32 (20.6%) |
| Total | 188 (100.0%) | 155 (100.0%) |
Health & Disability in Benton
Health Insurance Coverage by Age in Benton
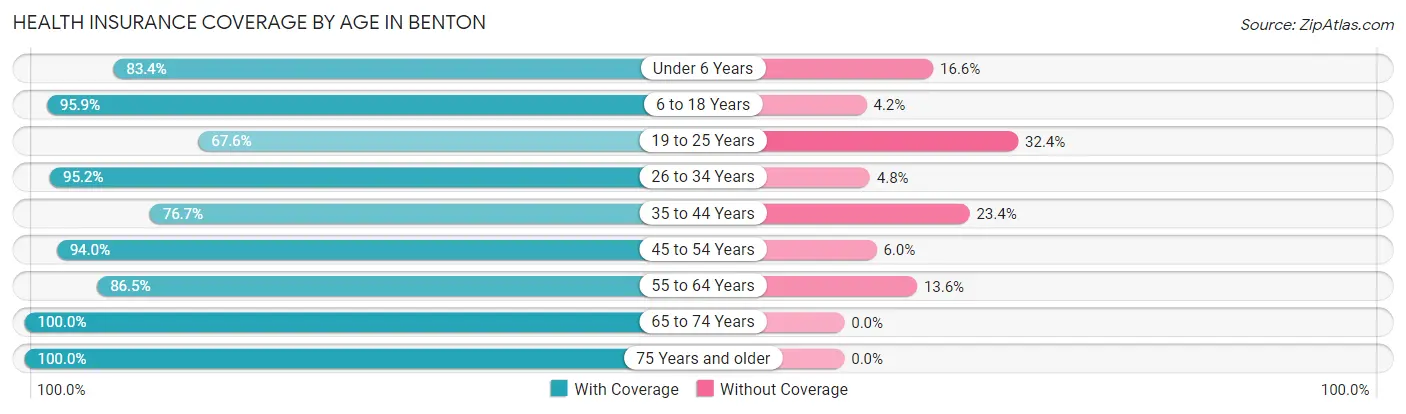
| Age Bracket | With Coverage | Without Coverage |
| Under 6 Years | 126 (83.4%) | 25 (16.6%) |
| 6 to 18 Years | 185 (95.9%) | 8 (4.2%) |
| 19 to 25 Years | 98 (67.6%) | 47 (32.4%) |
| 26 to 34 Years | 140 (95.2%) | 7 (4.8%) |
| 35 to 44 Years | 128 (76.6%) | 39 (23.4%) |
| 45 to 54 Years | 141 (94.0%) | 9 (6.0%) |
| 55 to 64 Years | 185 (86.5%) | 29 (13.6%) |
| 65 to 74 Years | 210 (100.0%) | 0 (0.0%) |
| 75 Years and older | 71 (100.0%) | 0 (0.0%) |
| Total | 1,284 (88.7%) | 164 (11.3%) |
Health Insurance Coverage by Citizenship Status in Benton
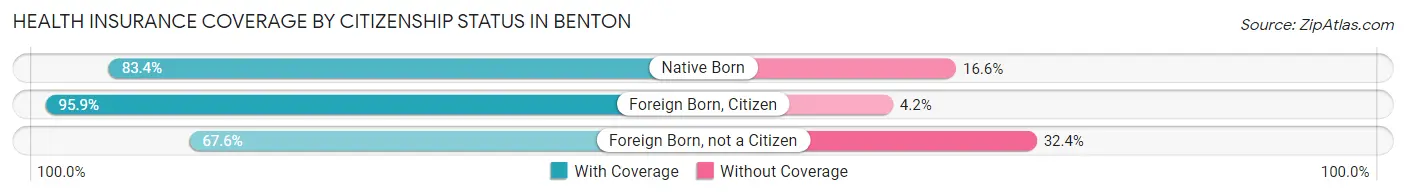
| Citizenship Status | With Coverage | Without Coverage |
| Native Born | 126 (83.4%) | 25 (16.6%) |
| Foreign Born, Citizen | 185 (95.9%) | 8 (4.2%) |
| Foreign Born, not a Citizen | 98 (67.6%) | 47 (32.4%) |
Health Insurance Coverage by Household Income in Benton
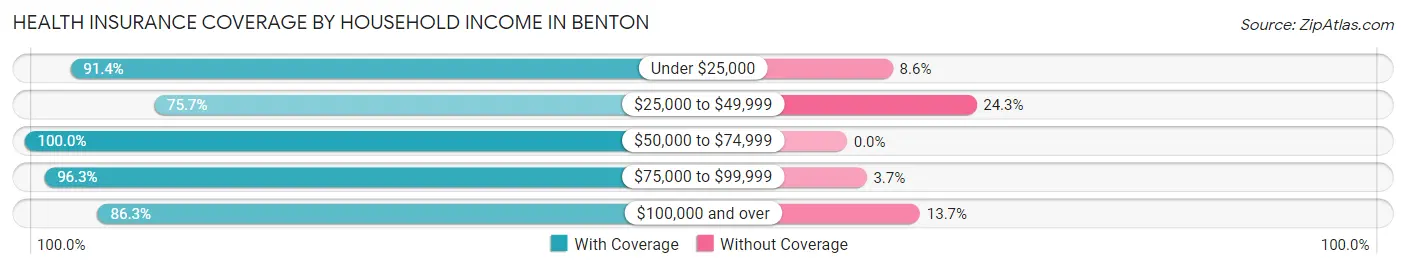
| Household Income | With Coverage | Without Coverage |
| Under $25,000 | 362 (91.4%) | 34 (8.6%) |
| $25,000 to $49,999 | 231 (75.7%) | 74 (24.3%) |
| $50,000 to $74,999 | 199 (100.0%) | 0 (0.0%) |
| $75,000 to $99,999 | 183 (96.3%) | 7 (3.7%) |
| $100,000 and over | 309 (86.3%) | 49 (13.7%) |
Public vs Private Health Insurance Coverage by Age in Benton
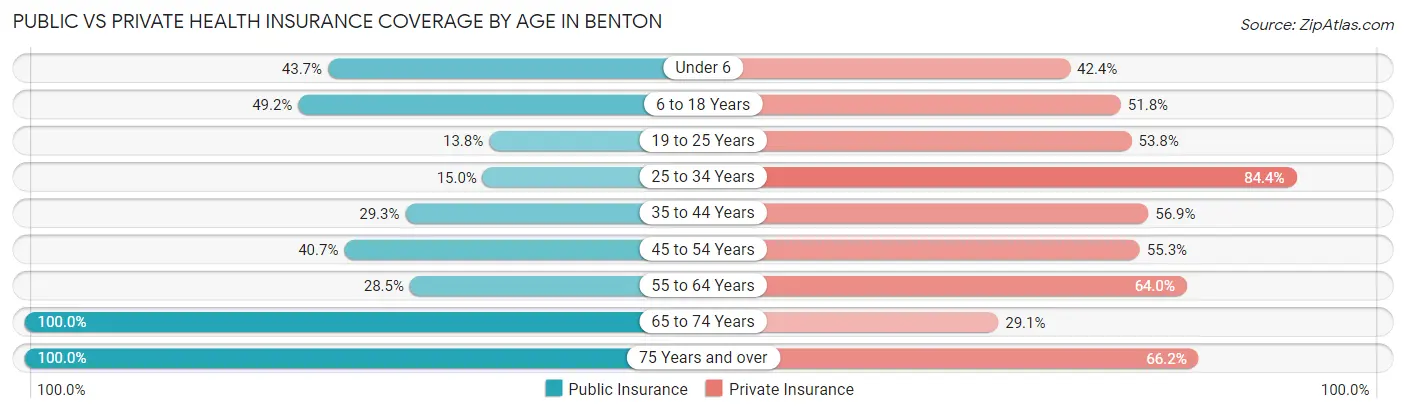
| Age Bracket | Public Insurance | Private Insurance |
| Under 6 | 66 (43.7%) | 64 (42.4%) |
| 6 to 18 Years | 95 (49.2%) | 100 (51.8%) |
| 19 to 25 Years | 20 (13.8%) | 78 (53.8%) |
| 25 to 34 Years | 22 (15.0%) | 124 (84.4%) |
| 35 to 44 Years | 49 (29.3%) | 95 (56.9%) |
| 45 to 54 Years | 61 (40.7%) | 83 (55.3%) |
| 55 to 64 Years | 61 (28.5%) | 137 (64.0%) |
| 65 to 74 Years | 210 (100.0%) | 61 (29.0%) |
| 75 Years and over | 71 (100.0%) | 47 (66.2%) |
| Total | 655 (45.2%) | 789 (54.5%) |
Disability Status by Sex by Age in Benton
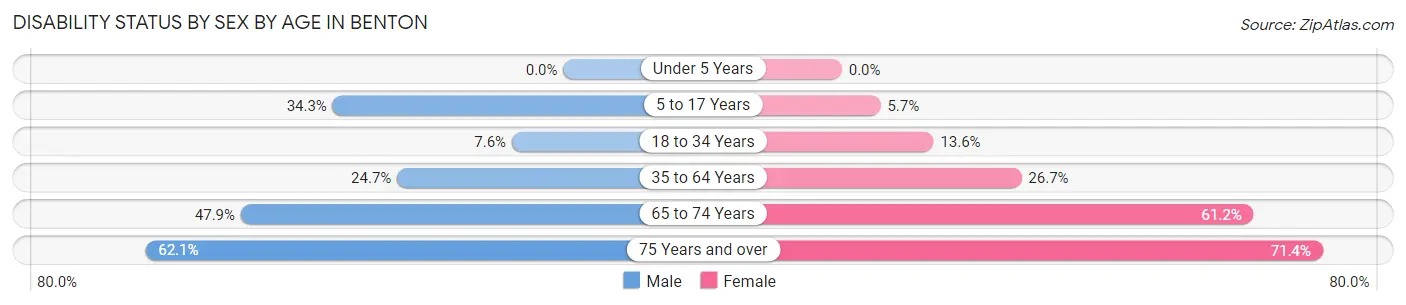
| Age Bracket | Male | Female |
| Under 5 Years | 0 (0.0%) | 0 (0.0%) |
| 5 to 17 Years | 25 (34.3%) | 7 (5.7%) |
| 18 to 34 Years | 12 (7.6%) | 20 (13.6%) |
| 35 to 64 Years | 57 (24.7%) | 80 (26.7%) |
| 65 to 74 Years | 34 (47.9%) | 85 (61.2%) |
| 75 Years and over | 18 (62.1%) | 30 (71.4%) |
Disability Class by Sex by Age in Benton
Disability Class: Hearing Difficulty
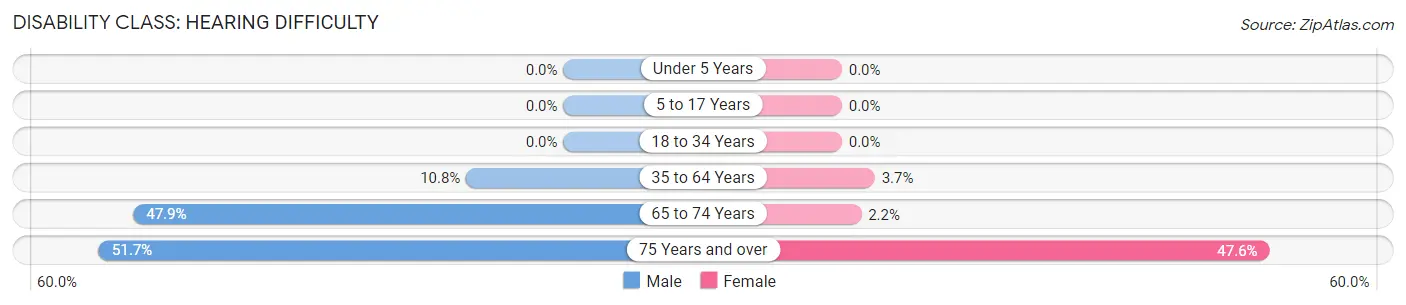
| Age Bracket | Male | Female |
| Under 5 Years | 0 (0.0%) | 0 (0.0%) |
| 5 to 17 Years | 0 (0.0%) | 0 (0.0%) |
| 18 to 34 Years | 0 (0.0%) | 0 (0.0%) |
| 35 to 64 Years | 25 (10.8%) | 11 (3.7%) |
| 65 to 74 Years | 34 (47.9%) | 3 (2.2%) |
| 75 Years and over | 15 (51.7%) | 20 (47.6%) |
Disability Class: Vision Difficulty
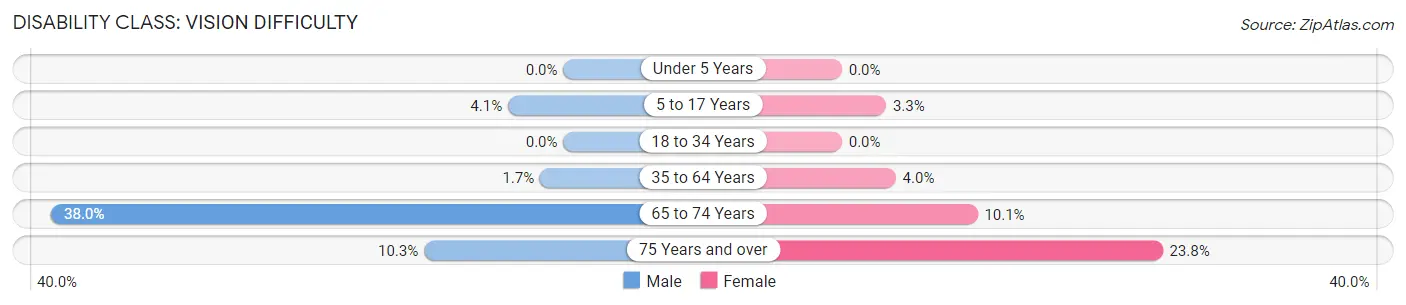
| Age Bracket | Male | Female |
| Under 5 Years | 0 (0.0%) | 0 (0.0%) |
| 5 to 17 Years | 3 (4.1%) | 4 (3.3%) |
| 18 to 34 Years | 0 (0.0%) | 0 (0.0%) |
| 35 to 64 Years | 4 (1.7%) | 12 (4.0%) |
| 65 to 74 Years | 27 (38.0%) | 14 (10.1%) |
| 75 Years and over | 3 (10.3%) | 10 (23.8%) |
Disability Class: Cognitive Difficulty
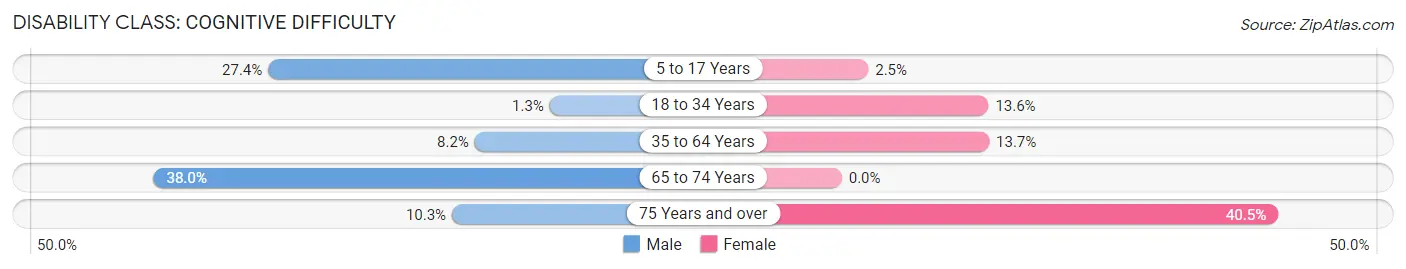
| Age Bracket | Male | Female |
| 5 to 17 Years | 20 (27.4%) | 3 (2.5%) |
| 18 to 34 Years | 2 (1.3%) | 20 (13.6%) |
| 35 to 64 Years | 19 (8.2%) | 41 (13.7%) |
| 65 to 74 Years | 27 (38.0%) | 0 (0.0%) |
| 75 Years and over | 3 (10.3%) | 17 (40.5%) |
Disability Class: Ambulatory Difficulty
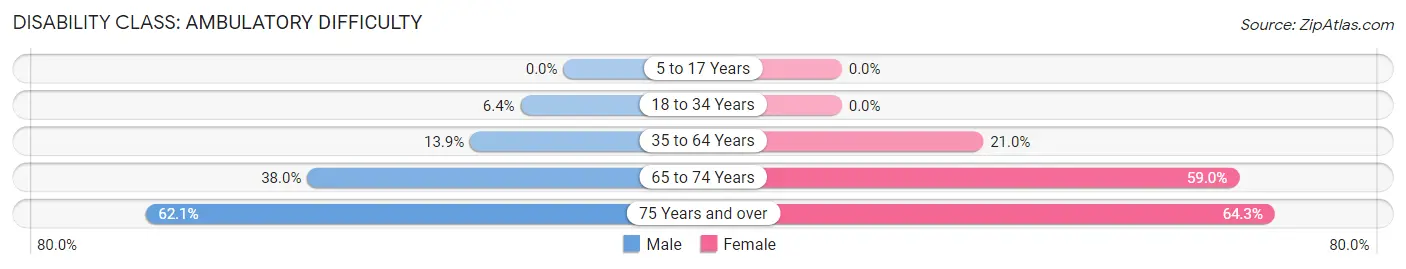
| Age Bracket | Male | Female |
| 5 to 17 Years | 0 (0.0%) | 0 (0.0%) |
| 18 to 34 Years | 10 (6.4%) | 0 (0.0%) |
| 35 to 64 Years | 32 (13.9%) | 63 (21.0%) |
| 65 to 74 Years | 27 (38.0%) | 82 (59.0%) |
| 75 Years and over | 18 (62.1%) | 27 (64.3%) |
Disability Class: Self-Care Difficulty
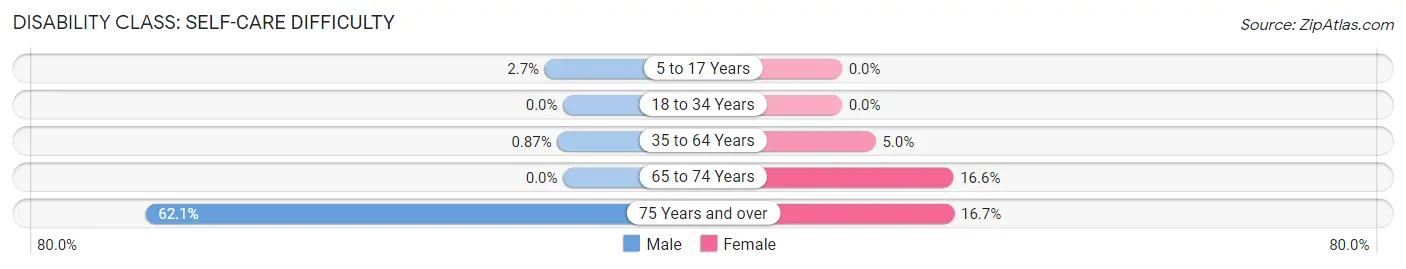
| Age Bracket | Male | Female |
| 5 to 17 Years | 2 (2.7%) | 0 (0.0%) |
| 18 to 34 Years | 0 (0.0%) | 0 (0.0%) |
| 35 to 64 Years | 2 (0.9%) | 15 (5.0%) |
| 65 to 74 Years | 0 (0.0%) | 23 (16.6%) |
| 75 Years and over | 18 (62.1%) | 7 (16.7%) |
Technology Access in Benton
Computing Device Access in Benton
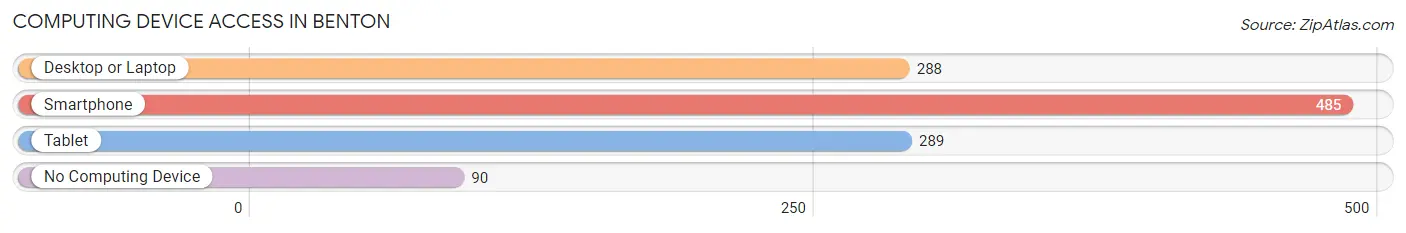
| Device Type | # Households | % Households |
| Desktop or Laptop | 288 | 47.1% |
| Smartphone | 485 | 79.4% |
| Tablet | 289 | 47.3% |
| No Computing Device | 90 | 14.7% |
| Total | 611 | 100.0% |
Internet Access in Benton
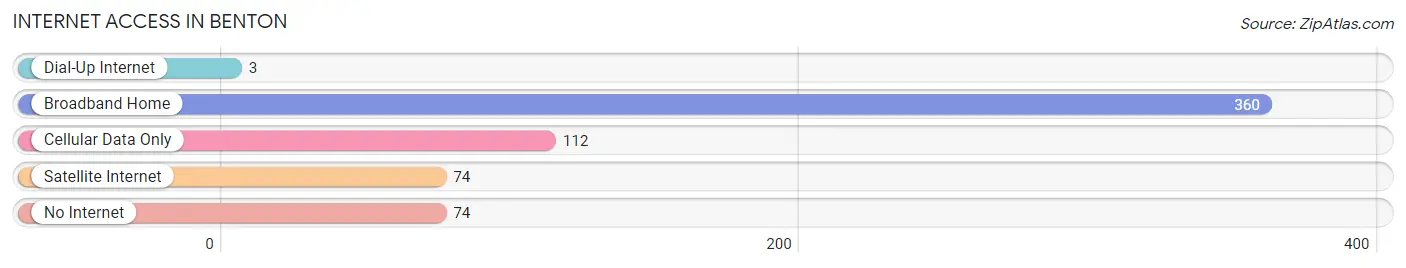
| Internet Type | # Households | % Households |
| Dial-Up Internet | 3 | 0.5% |
| Broadband Home | 360 | 58.9% |
| Cellular Data Only | 112 | 18.3% |
| Satellite Internet | 74 | 12.1% |
| No Internet | 74 | 12.1% |
| Total | 611 | 100.0% |
Benton Summary
Benton is a small town located in Polk County, Tennessee. It is situated in the foothills of the Appalachian Mountains and is home to a population of approximately 1,500 people. The town was founded in 1836 and has a rich history of coal mining, farming, and timber production.
Geography
Benton is located in the southeastern corner of Polk County, Tennessee. It is situated in the foothills of the Appalachian Mountains and is surrounded by the Cherokee National Forest. The town is located at an elevation of 1,400 feet and is approximately 20 miles from the nearest major city, Chattanooga. The town is situated on the banks of the Hiwassee River and is home to several small creeks and streams.
Economy
Benton’s economy is largely based on agriculture and timber production. The town is home to several small farms and ranches, as well as a few larger timber companies. The town also has a small manufacturing sector, which includes a few small factories and a few larger companies. The town is also home to a few small businesses, such as restaurants, convenience stores, and gas stations.
Demographics
As of the 2010 census, the population of Benton was 1,500 people. The racial makeup of the town was 95.3% White, 0.7% African American, 0.3% Native American, 0.3% Asian, 0.1% Pacific Islander, and 3.3% from other races. The median household income in Benton was $30,000, and the median family income was $35,000. The town has a poverty rate of 17.3%.
Education
Benton is served by the Polk County School District, which includes two elementary schools, one middle school, and one high school. The town is also home to a few private schools, including a Christian school and a Montessori school.
Conclusion
Benton is a small town located in Polk County, Tennessee. It is situated in the foothills of the Appalachian Mountains and is home to a population of approximately 1,500 people. The town was founded in 1836 and has a rich history of coal mining, farming, and timber production. The town’s economy is largely based on agriculture and timber production, and it is also home to a few small businesses. The town is served by the Polk County School District, which includes two elementary schools, one middle school, and one high school. The racial makeup of the town is 95.3% White, 0.7% African American, 0.3% Native American, 0.3% Asian, 0.1% Pacific Islander, and 3.3% from other races. The median household income in Benton was $30,000, and the median family income was $35,000. The town has a poverty rate of 17.3%.
Common Questions
What is Per Capita Income in Benton?
Per Capita income in Benton is $21,643.
What is the Median Family Income in Benton?
Median Family Income in Benton is $60,673.
What is the Median Household income in Benton?
Median Household Income in Benton is $37,569.
What is Income or Wage Gap in Benton?
Income or Wage Gap in Benton is 26.5%.
Women in Benton earn 73.5 cents for every dollar earned by a man.
What is Inequality or Gini Index in Benton?
Inequality or Gini Index in Benton is 0.45.
What is the Total Population of Benton?
Total Population of Benton is 1,584.
What is the Total Male Population of Benton?
Total Male Population of Benton is 734.
What is the Total Female Population of Benton?
Total Female Population of Benton is 850.
What is the Ratio of Males per 100 Females in Benton?
There are 86.35 Males per 100 Females in Benton.
What is the Ratio of Females per 100 Males in Benton?
There are 115.80 Females per 100 Males in Benton.
What is the Median Population Age in Benton?
Median Population Age in Benton is 38.9 Years.
What is the Average Family Size in Benton
Average Family Size in Benton is 3.0 People.
What is the Average Household Size in Benton
Average Household Size in Benton is 2.4 People.
How Large is the Labor Force in Benton?
There are 583 People in the Labor Forcein in Benton.
What is the Percentage of People in the Labor Force in Benton?
45.8% of People are in the Labor Force in Benton.
What is the Unemployment Rate in Benton?
Unemployment Rate in Benton is 7.5%.