Zip Codes with the Highest Percentage of Population Employed in Real Estate, Rental & Leasing in Morristown, TN
RELATED REPORTS & OPTIONS
Real Estate, Rental & Leasing
Morristown
Compare Zip Codes
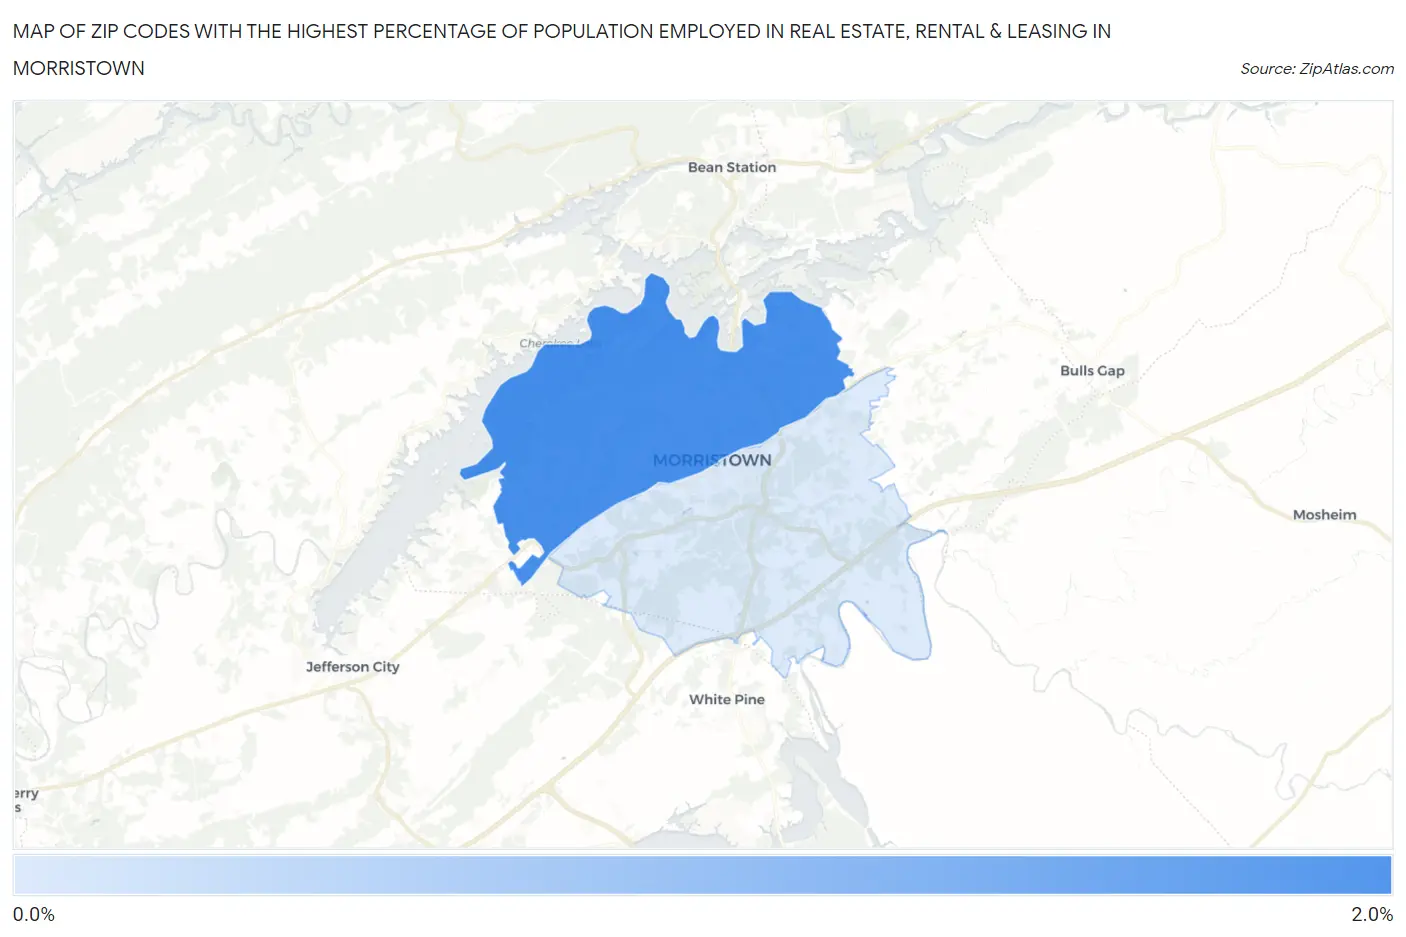
Map of Zip Codes with the Highest Percentage of Population Employed in Real Estate, Rental & Leasing in Morristown
0.53%
1.9%
Zip Codes with the Highest Percentage of Population Employed in Real Estate, Rental & Leasing in Morristown, TN
| Zip Code | % Employed | vs State | vs National | |
| 1. | 37814 | 1.9% | 1.7%(+0.128)#169 | 1.9%(-0.030)#8,700 |
| 2. | 37813 | 0.53% | 1.7%(-1.20)#372 | 1.9%(-1.36)#18,815 |
1
Common Questions
What are the Top Zip Codes with the Highest Percentage of Population Employed in Real Estate, Rental & Leasing in Morristown, TN?
Top Zip Codes with the Highest Percentage of Population Employed in Real Estate, Rental & Leasing in Morristown, TN are:
What zip code has the Highest Percentage of Population Employed in Real Estate, Rental & Leasing in Morristown, TN?
37814 has the Highest Percentage of Population Employed in Real Estate, Rental & Leasing in Morristown, TN with 1.9%.
What is the Percentage of Population Employed in Real Estate, Rental & Leasing in Morristown, TN?
Percentage of Population Employed in Real Estate, Rental & Leasing in Morristown is 1.8%.
What is the Percentage of Population Employed in Real Estate, Rental & Leasing in Tennessee?
Percentage of Population Employed in Real Estate, Rental & Leasing in Tennessee is 1.7%.
What is the Percentage of Population Employed in Real Estate, Rental & Leasing in the United States?
Percentage of Population Employed in Real Estate, Rental & Leasing in the United States is 1.9%.