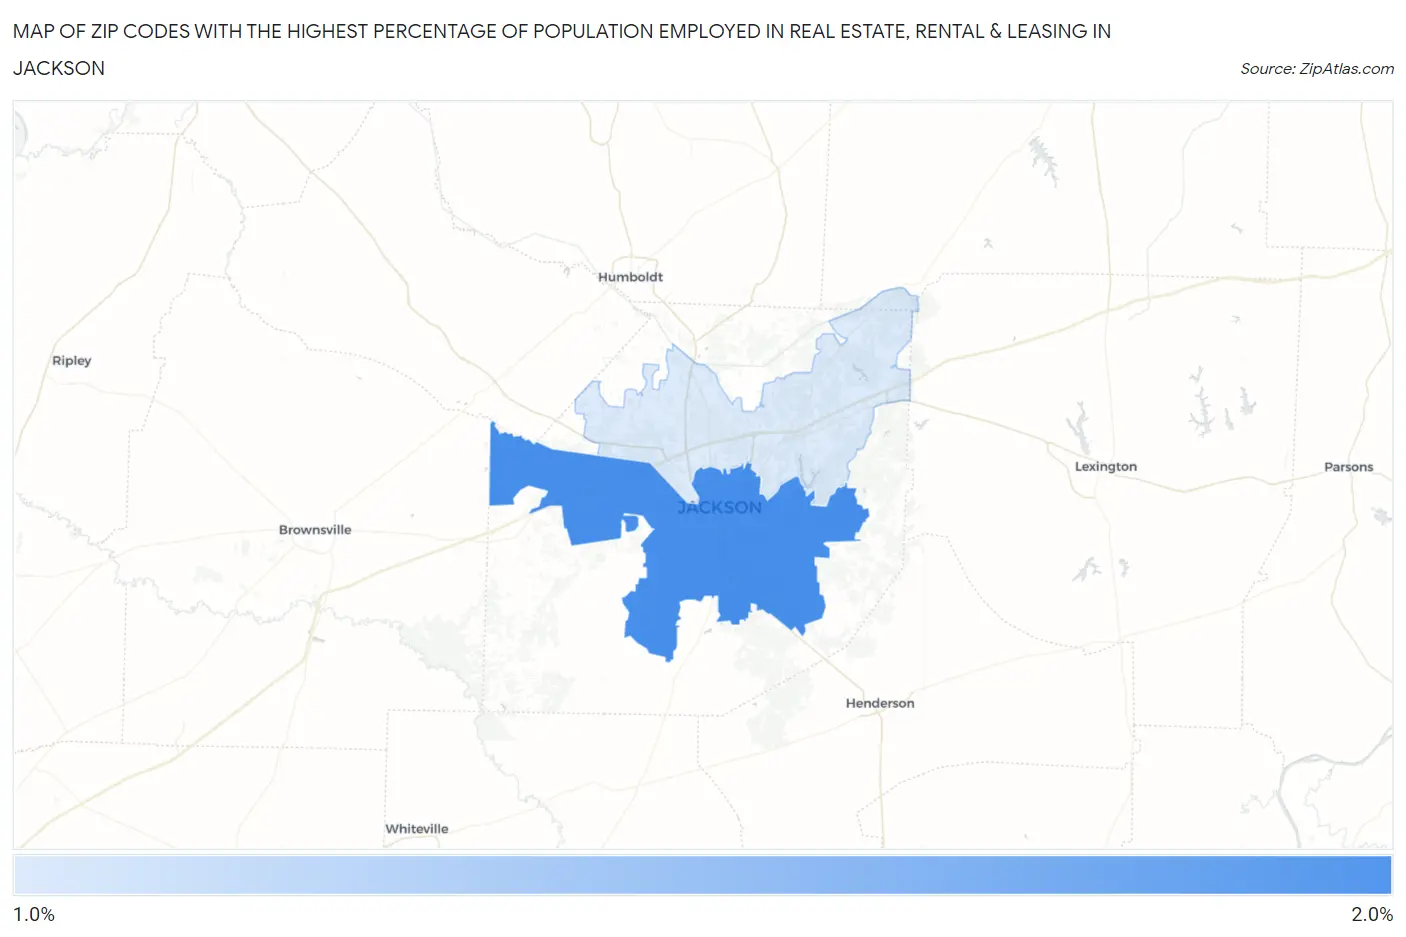
Zip Codes with the Highest Percentage of Population Employed in Real Estate, Rental & Leasing in Jackson, TN
RELATED REPORTS & OPTIONS
Real Estate, Rental & Leasing
Jackson
Compare Zip Codes
Map of Zip Codes with the Highest Percentage of Population Employed in Real Estate, Rental & Leasing in Jackson
1.2%
2.0%
Zip Codes with the Highest Percentage of Population Employed in Real Estate, Rental & Leasing in Jackson, TN
| Zip Code | % Employed | vs State | vs National | |
| 1. | 38301 | 2.0% | 1.7%(+0.227)#155 | 1.9%(+0.070)#8,056 |
| 2. | 38305 | 1.2% | 1.7%(-0.537)#259 | 1.9%(-0.694)#13,501 |
1
Common Questions
What are the Top Zip Codes with the Highest Percentage of Population Employed in Real Estate, Rental & Leasing in Jackson, TN?
Top Zip Codes with the Highest Percentage of Population Employed in Real Estate, Rental & Leasing in Jackson, TN are:
What zip code has the Highest Percentage of Population Employed in Real Estate, Rental & Leasing in Jackson, TN?
38301 has the Highest Percentage of Population Employed in Real Estate, Rental & Leasing in Jackson, TN with 2.0%.
What is the Percentage of Population Employed in Real Estate, Rental & Leasing in Jackson, TN?
Percentage of Population Employed in Real Estate, Rental & Leasing in Jackson is 1.5%.
What is the Percentage of Population Employed in Real Estate, Rental & Leasing in Tennessee?
Percentage of Population Employed in Real Estate, Rental & Leasing in Tennessee is 1.7%.
What is the Percentage of Population Employed in Real Estate, Rental & Leasing in the United States?
Percentage of Population Employed in Real Estate, Rental & Leasing in the United States is 1.9%.