Zip Codes with the Highest Percentage of Population Employed in Real Estate, Rental & Leasing in Greeneville, TN
RELATED REPORTS & OPTIONS
Real Estate, Rental & Leasing
Greeneville
Compare Zip Codes
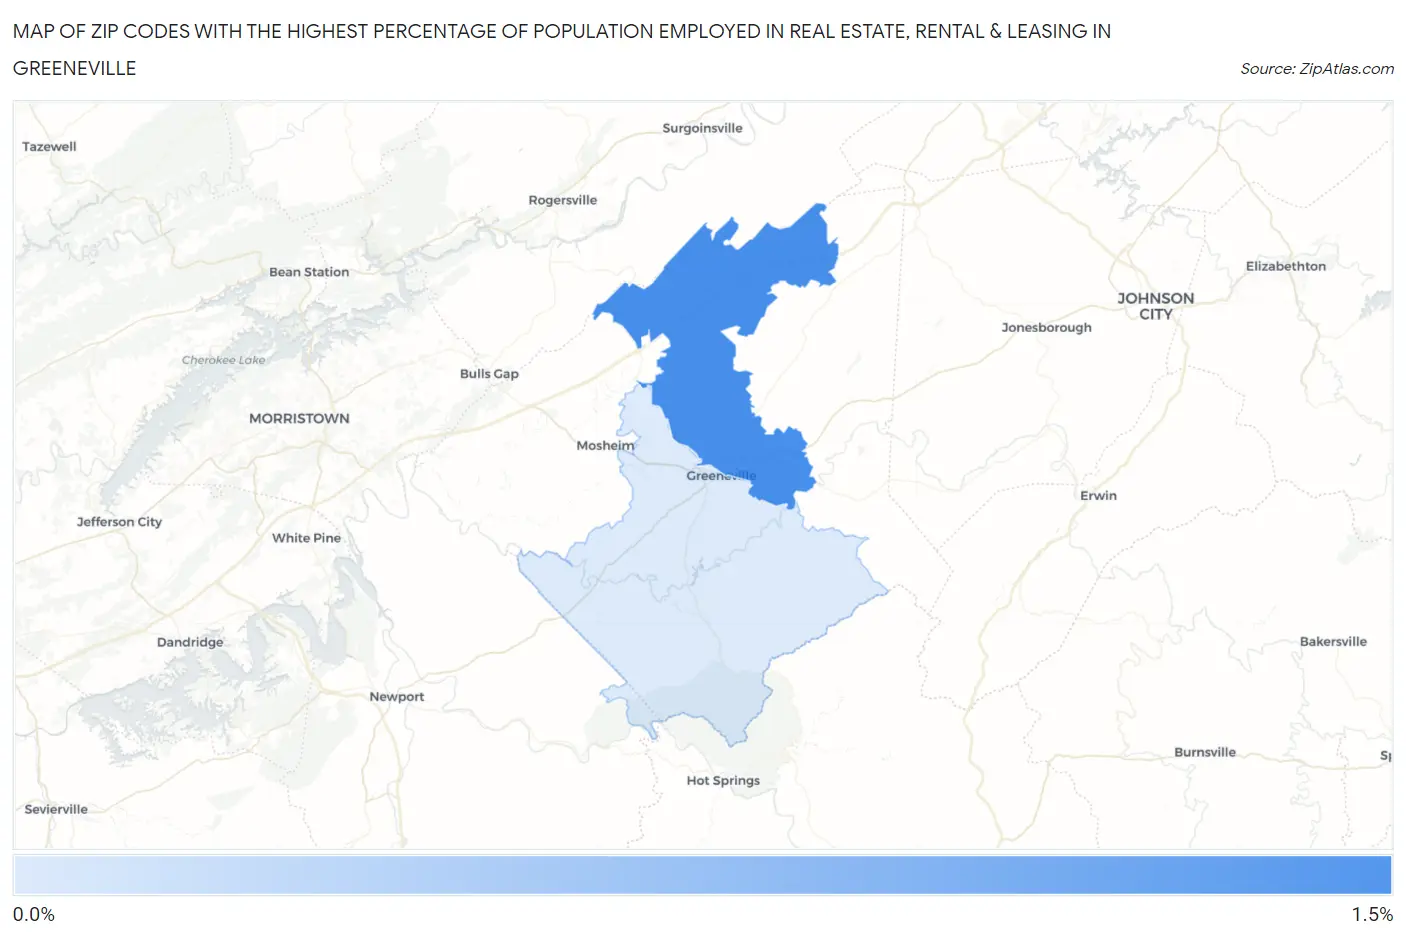
Map of Zip Codes with the Highest Percentage of Population Employed in Real Estate, Rental & Leasing in Greeneville
0.49%
1.5%
Zip Codes with the Highest Percentage of Population Employed in Real Estate, Rental & Leasing in Greeneville, TN
| Zip Code | % Employed | vs State | vs National | |
| 1. | 37745 | 1.5% | 1.7%(-0.273)#214 | 1.9%(-0.430)#11,469 |
| 2. | 37743 | 0.49% | 1.7%(-1.25)#382 | 1.9%(-1.41)#19,185 |
1
Common Questions
What are the Top Zip Codes with the Highest Percentage of Population Employed in Real Estate, Rental & Leasing in Greeneville, TN?
Top Zip Codes with the Highest Percentage of Population Employed in Real Estate, Rental & Leasing in Greeneville, TN are:
What zip code has the Highest Percentage of Population Employed in Real Estate, Rental & Leasing in Greeneville, TN?
37745 has the Highest Percentage of Population Employed in Real Estate, Rental & Leasing in Greeneville, TN with 1.5%.
What is the Percentage of Population Employed in Real Estate, Rental & Leasing in Greeneville, TN?
Percentage of Population Employed in Real Estate, Rental & Leasing in Greeneville is 2.0%.
What is the Percentage of Population Employed in Real Estate, Rental & Leasing in Tennessee?
Percentage of Population Employed in Real Estate, Rental & Leasing in Tennessee is 1.7%.
What is the Percentage of Population Employed in Real Estate, Rental & Leasing in the United States?
Percentage of Population Employed in Real Estate, Rental & Leasing in the United States is 1.9%.