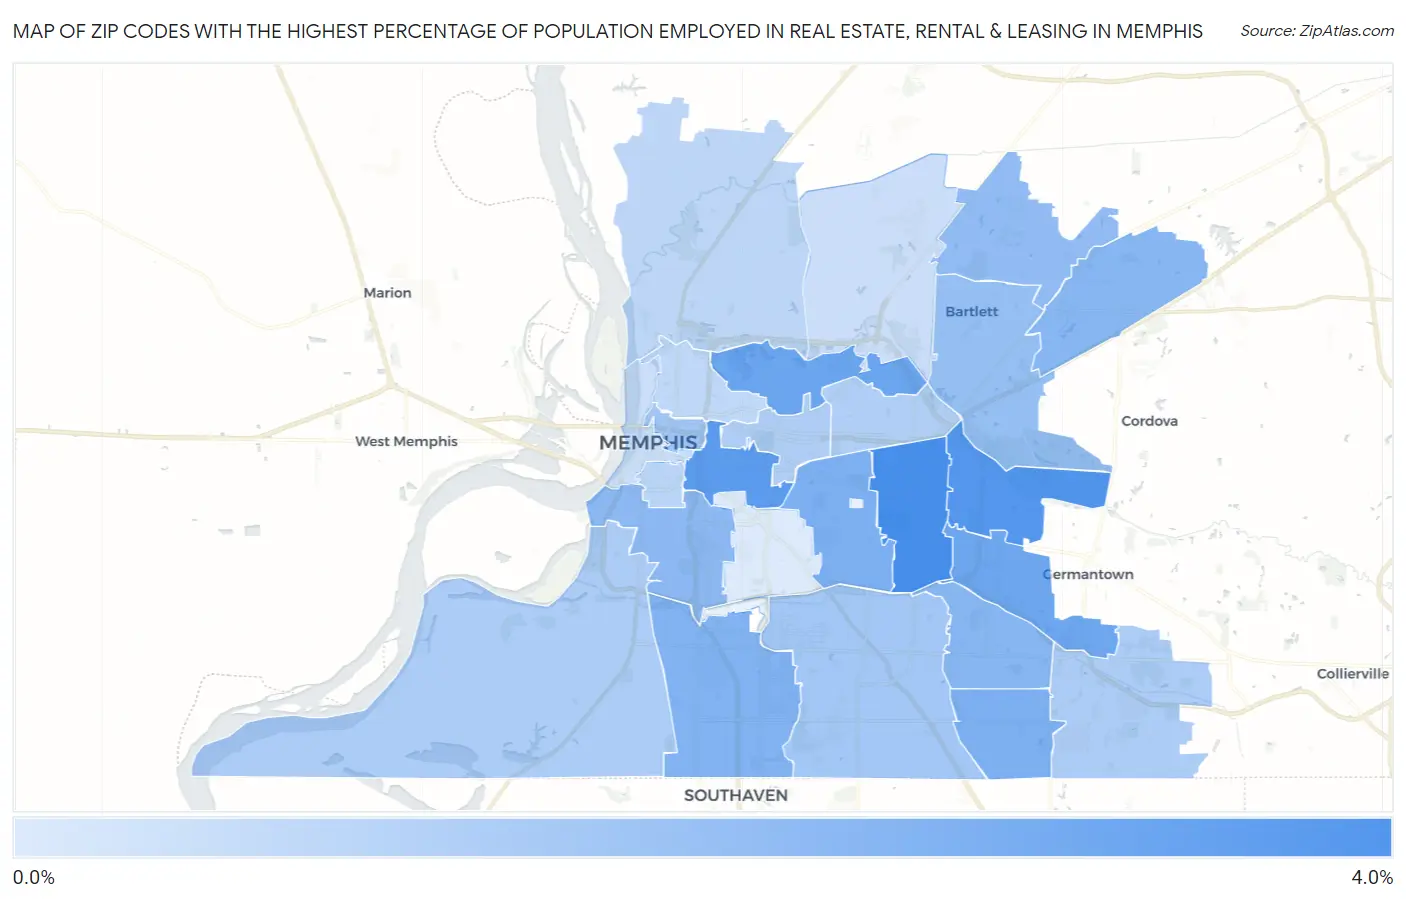
Zip Codes with the Highest Percentage of Population Employed in Real Estate, Rental & Leasing in Memphis, TN
RELATED REPORTS & OPTIONS
Real Estate, Rental & Leasing
Memphis
Compare Zip Codes
Map of Zip Codes with the Highest Percentage of Population Employed in Real Estate, Rental & Leasing in Memphis
0.33%
3.2%
Zip Codes with the Highest Percentage of Population Employed in Real Estate, Rental & Leasing in Memphis, TN
| Zip Code | % Employed | vs State | vs National | |
| 1. | 38117 | 3.2% | 1.7%(+1.42)#49 | 1.9%(+1.27)#3,501 |
| 2. | 38120 | 2.9% | 1.7%(+1.18)#61 | 1.9%(+1.02)#4,145 |
| 3. | 38104 | 2.8% | 1.7%(+1.06)#69 | 1.9%(+0.898)#4,458 |
| 4. | 38108 | 2.5% | 1.7%(+0.733)#98 | 1.9%(+0.576)#5,604 |
| 5. | 38119 | 2.4% | 1.7%(+0.685)#101 | 1.9%(+0.528)#5,811 |
| 6. | 38111 | 2.1% | 1.7%(+0.403)#138 | 1.9%(+0.246)#7,122 |
| 7. | 38141 | 2.1% | 1.7%(+0.399)#139 | 1.9%(+0.241)#7,145 |
| 8. | 38116 | 2.1% | 1.7%(+0.327)#148 | 1.9%(+0.170)#7,530 |
| 9. | 38115 | 2.0% | 1.7%(+0.216)#157 | 1.9%(+0.059)#8,118 |
| 10. | 38133 | 1.9% | 1.7%(+0.194)#158 | 1.9%(+0.036)#8,264 |
| 11. | 38106 | 1.8% | 1.7%(+0.114)#172 | 1.9%(-0.043)#8,805 |
| 12. | 38135 | 1.8% | 1.7%(+0.035)#179 | 1.9%(-0.123)#9,319 |
| 13. | 38134 | 1.7% | 1.7%(-0.069)#186 | 1.9%(-0.226)#9,998 |
| 14. | 38105 | 1.4% | 1.7%(-0.295)#216 | 1.9%(-0.453)#11,664 |
| 15. | 38118 | 1.4% | 1.7%(-0.334)#222 | 1.9%(-0.491)#11,970 |
| 16. | 38109 | 1.2% | 1.7%(-0.492)#247 | 1.9%(-0.649)#13,139 |
| 17. | 38125 | 1.2% | 1.7%(-0.518)#254 | 1.9%(-0.675)#13,363 |
| 18. | 38112 | 1.2% | 1.7%(-0.557)#263 | 1.9%(-0.714)#13,672 |
| 19. | 38122 | 1.1% | 1.7%(-0.594)#267 | 1.9%(-0.751)#13,947 |
| 20. | 38126 | 0.98% | 1.7%(-0.754)#290 | 1.9%(-0.911)#15,320 |
| 21. | 38127 | 0.94% | 1.7%(-0.793)#299 | 1.9%(-0.950)#15,621 |
| 22. | 38107 | 0.90% | 1.7%(-0.839)#308 | 1.9%(-0.996)#15,995 |
| 23. | 38103 | 0.68% | 1.7%(-1.06)#340 | 1.9%(-1.21)#17,656 |
| 24. | 38128 | 0.66% | 1.7%(-1.07)#344 | 1.9%(-1.23)#17,772 |
| 25. | 38114 | 0.33% | 1.7%(-1.40)#405 | 1.9%(-1.56)#20,253 |
1
Common Questions
What are the Top 10 Zip Codes with the Highest Percentage of Population Employed in Real Estate, Rental & Leasing in Memphis, TN?
Top 10 Zip Codes with the Highest Percentage of Population Employed in Real Estate, Rental & Leasing in Memphis, TN are:
What zip code has the Highest Percentage of Population Employed in Real Estate, Rental & Leasing in Memphis, TN?
38117 has the Highest Percentage of Population Employed in Real Estate, Rental & Leasing in Memphis, TN with 3.2%.
What is the Percentage of Population Employed in Real Estate, Rental & Leasing in Memphis, TN?
Percentage of Population Employed in Real Estate, Rental & Leasing in Memphis is 1.8%.
What is the Percentage of Population Employed in Real Estate, Rental & Leasing in Tennessee?
Percentage of Population Employed in Real Estate, Rental & Leasing in Tennessee is 1.7%.
What is the Percentage of Population Employed in Real Estate, Rental & Leasing in the United States?
Percentage of Population Employed in Real Estate, Rental & Leasing in the United States is 1.9%.