Zip Codes with the Highest Percentage of Population Employed in Real Estate, Rental & Leasing in Sevierville, TN
RELATED REPORTS & OPTIONS
Real Estate, Rental & Leasing
Sevierville
Compare Zip Codes
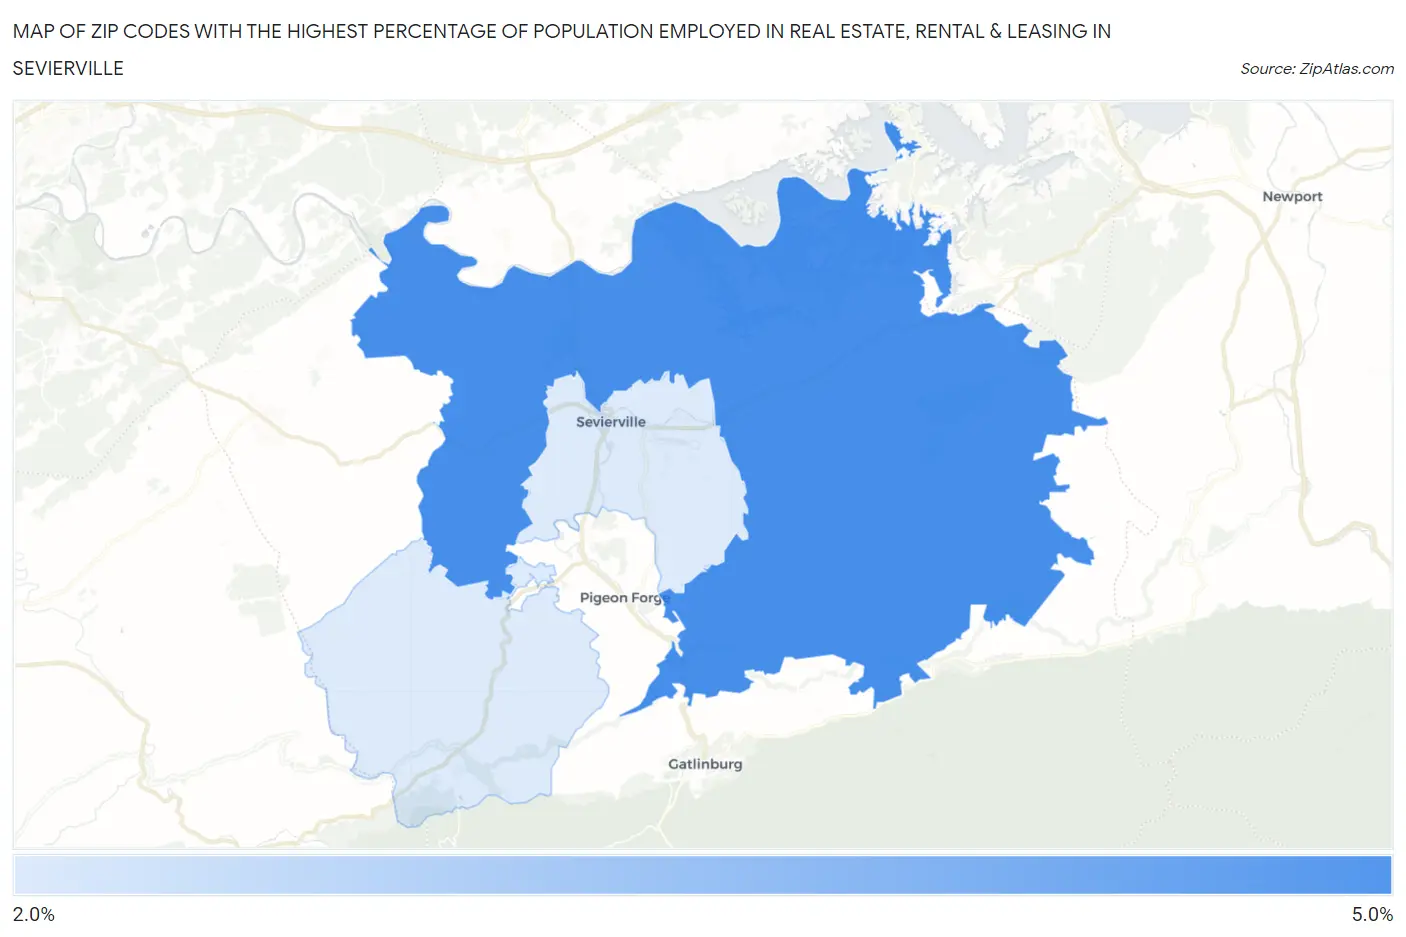
Map of Zip Codes with the Highest Percentage of Population Employed in Real Estate, Rental & Leasing in Sevierville
3.0%
5.0%
Zip Codes with the Highest Percentage of Population Employed in Real Estate, Rental & Leasing in Sevierville, TN
| Zip Code | % Employed | vs State | vs National | |
| 1. | 37876 | 5.0% | 1.7%(+3.22)#22 | 1.9%(+3.06)#1,424 |
| 2. | 37862 | 3.0% | 1.7%(+1.24)#59 | 1.9%(+1.08)#3,977 |
1
Common Questions
What are the Top Zip Codes with the Highest Percentage of Population Employed in Real Estate, Rental & Leasing in Sevierville, TN?
Top Zip Codes with the Highest Percentage of Population Employed in Real Estate, Rental & Leasing in Sevierville, TN are:
What zip code has the Highest Percentage of Population Employed in Real Estate, Rental & Leasing in Sevierville, TN?
37876 has the Highest Percentage of Population Employed in Real Estate, Rental & Leasing in Sevierville, TN with 5.0%.
What is the Percentage of Population Employed in Real Estate, Rental & Leasing in Sevierville, TN?
Percentage of Population Employed in Real Estate, Rental & Leasing in Sevierville is 1.9%.
What is the Percentage of Population Employed in Real Estate, Rental & Leasing in Tennessee?
Percentage of Population Employed in Real Estate, Rental & Leasing in Tennessee is 1.7%.
What is the Percentage of Population Employed in Real Estate, Rental & Leasing in the United States?
Percentage of Population Employed in Real Estate, Rental & Leasing in the United States is 1.9%.