Zip Codes with the Highest Percentage of Population with a Degree in Visual and Performing Arts in Summerville, SC
RELATED REPORTS & OPTIONS
Visual and Performing Arts
Summerville
Compare Zip Codes
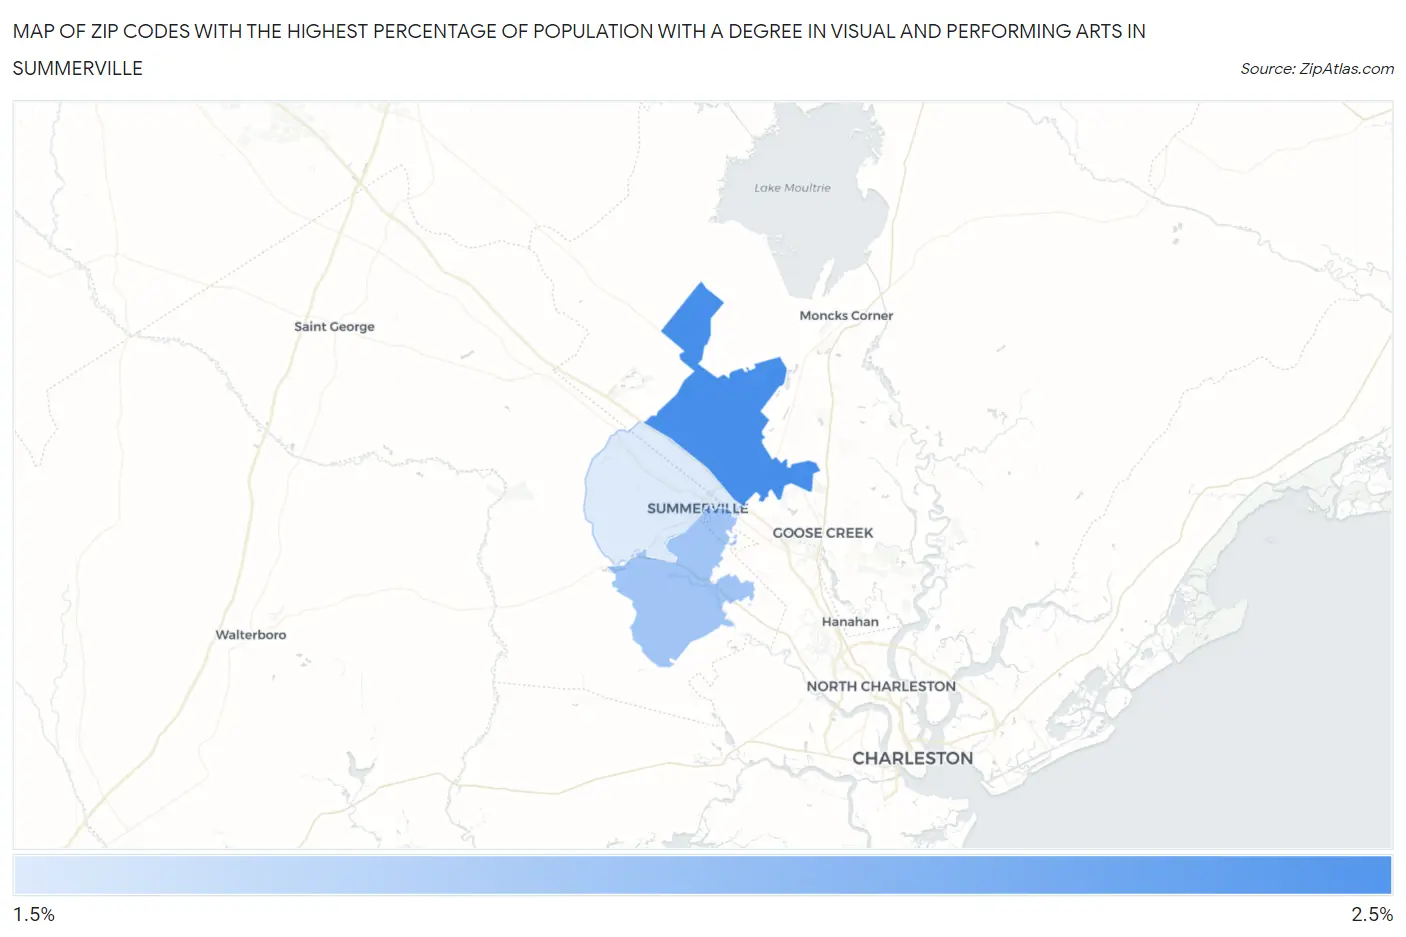
Map of Zip Codes with the Highest Percentage of Population with a Degree in Visual and Performing Arts in Summerville
1.9%
2.4%
Zip Codes with the Highest Percentage of Population with a Degree in Visual and Performing Arts in Summerville, SC
| Zip Code | % Graduates | vs State | vs National | |
| 1. | 29486 | 2.4% | 3.3%(-0.855)#175 | 4.3%(-1.84)#14,972 |
| 2. | 29485 | 2.1% | 3.3%(-1.18)#193 | 4.3%(-2.17)#16,137 |
| 3. | 29483 | 1.9% | 3.3%(-1.40)#208 | 4.3%(-2.39)#16,917 |
1
Common Questions
What are the Top Zip Codes with the Highest Percentage of Population with a Degree in Visual and Performing Arts in Summerville, SC?
Top Zip Codes with the Highest Percentage of Population with a Degree in Visual and Performing Arts in Summerville, SC are:
What zip code has the Highest Percentage of Population with a Degree in Visual and Performing Arts in Summerville, SC?
29486 has the Highest Percentage of Population with a Degree in Visual and Performing Arts in Summerville, SC with 2.4%.
What is the Percentage of Population with a Degree in Visual and Performing Arts in Summerville, SC?
Percentage of Population with a Degree in Visual and Performing Arts in Summerville is 2.5%.
What is the Percentage of Population with a Degree in Visual and Performing Arts in South Carolina?
Percentage of Population with a Degree in Visual and Performing Arts in South Carolina is 3.3%.
What is the Percentage of Population with a Degree in Visual and Performing Arts in the United States?
Percentage of Population with a Degree in Visual and Performing Arts in the United States is 4.3%.