McCormick, SC Map & Demographics
McCormick Map
McCormick Overview
$15,532
PER CAPITA INCOME
$51,875
AVG FAMILY INCOME
$37,568
AVG HOUSEHOLD INCOME
18.7%
WAGE / INCOME GAP [ % ]
81.3¢/ $1
WAGE / INCOME GAP [ $ ]
0.48
INEQUALITY / GINI INDEX
2,760
TOTAL POPULATION
1,650
MALE POPULATION
1,110
FEMALE POPULATION
148.65
MALES / 100 FEMALES
67.27
FEMALES / 100 MALES
42.8
MEDIAN AGE
3.5
AVG FAMILY SIZE
2.5
AVG HOUSEHOLD SIZE
618
LABOR FORCE [ PEOPLE ]
27.5%
PERCENT IN LABOR FORCE
3.6%
UNEMPLOYMENT RATE
Income in McCormick
Income Overview in McCormick
Per Capita Income in McCormick is $15,532, while median incomes of families and households are $51,875 and $37,568 respectively.
| Characteristic | Number | Measure |
| Per Capita Income | 2,760 | $15,532 |
| Median Family Income | 439 | $51,875 |
| Mean Family Income | 439 | $60,972 |
| Median Household Income | 772 | $37,568 |
| Mean Household Income | 772 | $45,296 |
| Income Deficit | 439 | $0 |
| Wage / Income Gap (%) | 2,760 | 18.75% |
| Wage / Income Gap ($) | 2,760 | 81.25¢ per $1 |
| Gini / Inequality Index | 2,760 | 0.48 |
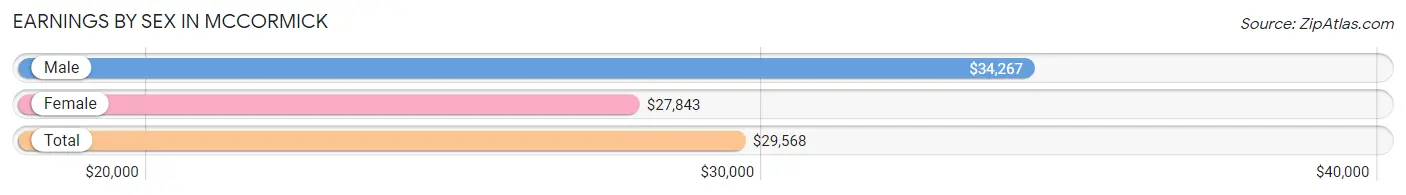
Earnings by Sex in McCormick
Average Earnings in McCormick are $29,568, $34,267 for men and $27,843 for women, a difference of 18.8%.
| Sex | Number | Average Earnings |
| Male | 491 (60.7%) | $34,267 |
| Female | 318 (39.3%) | $27,843 |
| Total | 809 (100.0%) | $29,568 |
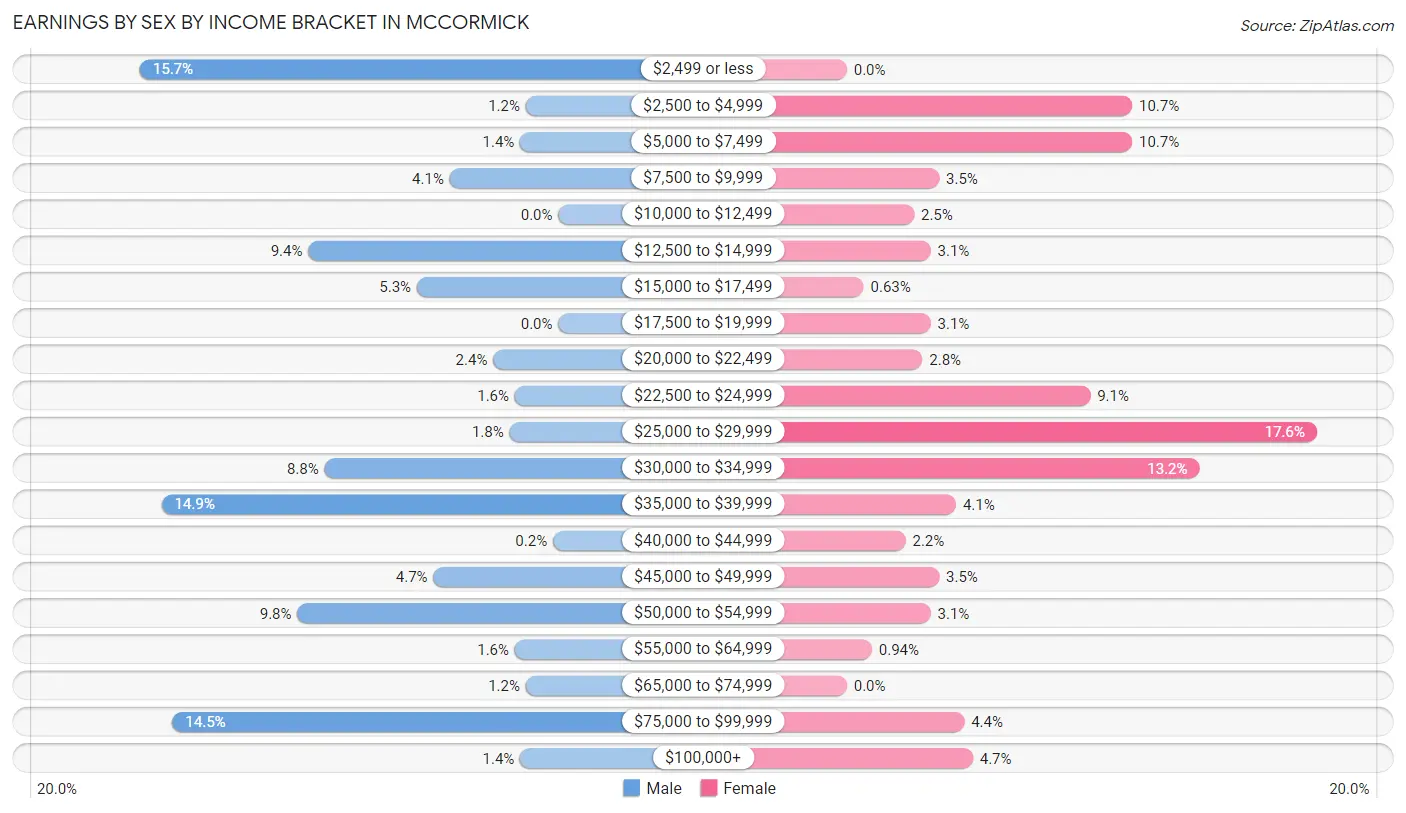
Earnings by Sex by Income Bracket in McCormick
The most common earnings brackets in McCormick are $2,499 or less for men (77 | 15.7%) and $25,000 to $29,999 for women (56 | 17.6%).
| Income | Male | Female |
| $2,499 or less | 77 (15.7%) | 0 (0.0%) |
| $2,500 to $4,999 | 6 (1.2%) | 34 (10.7%) |
| $5,000 to $7,499 | 7 (1.4%) | 34 (10.7%) |
| $7,500 to $9,999 | 20 (4.1%) | 11 (3.5%) |
| $10,000 to $12,499 | 0 (0.0%) | 8 (2.5%) |
| $12,500 to $14,999 | 46 (9.4%) | 10 (3.1%) |
| $15,000 to $17,499 | 26 (5.3%) | 2 (0.6%) |
| $17,500 to $19,999 | 0 (0.0%) | 10 (3.1%) |
| $20,000 to $22,499 | 12 (2.4%) | 9 (2.8%) |
| $22,500 to $24,999 | 8 (1.6%) | 29 (9.1%) |
| $25,000 to $29,999 | 9 (1.8%) | 56 (17.6%) |
| $30,000 to $34,999 | 43 (8.8%) | 42 (13.2%) |
| $35,000 to $39,999 | 73 (14.9%) | 13 (4.1%) |
| $40,000 to $44,999 | 1 (0.2%) | 7 (2.2%) |
| $45,000 to $49,999 | 23 (4.7%) | 11 (3.5%) |
| $50,000 to $54,999 | 48 (9.8%) | 10 (3.1%) |
| $55,000 to $64,999 | 8 (1.6%) | 3 (0.9%) |
| $65,000 to $74,999 | 6 (1.2%) | 0 (0.0%) |
| $75,000 to $99,999 | 71 (14.5%) | 14 (4.4%) |
| $100,000+ | 7 (1.4%) | 15 (4.7%) |
| Total | 491 (100.0%) | 318 (100.0%) |
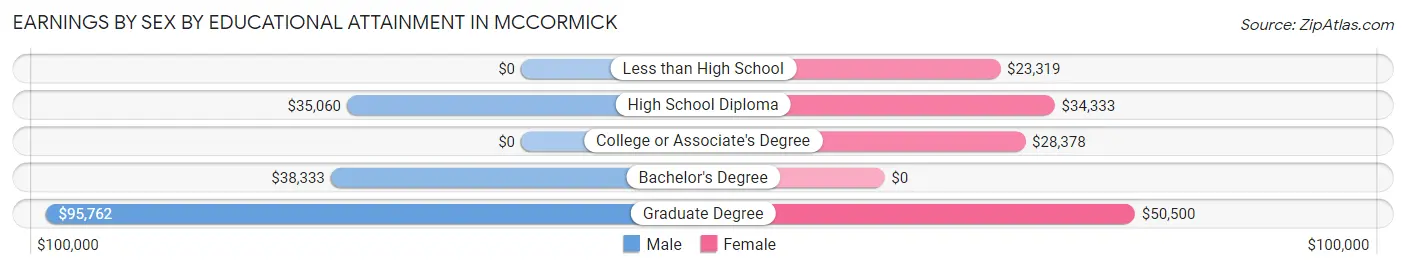
Earnings by Sex by Educational Attainment in McCormick
Average earnings in McCormick are $34,900 for men and $28,725 for women, a difference of 17.7%. Men with an educational attainment of graduate degree enjoy the highest average annual earnings of $95,762, while those with high school diploma education earn the least with $35,060. Women with an educational attainment of graduate degree earn the most with the average annual earnings of $50,500, while those with less than high school education have the smallest earnings of $23,319.
| Educational Attainment | Male Income | Female Income |
| Less than High School | - | - |
| High School Diploma | $35,060 | $34,333 |
| College or Associate's Degree | - | - |
| Bachelor's Degree | $38,333 | $0 |
| Graduate Degree | $95,762 | $50,500 |
| Total | $34,900 | $28,725 |
Family Income in McCormick
Family Income Brackets in McCormick
According to the McCormick family income data, there are 107 families falling into the $50,000 to $74,999 income range, which is the most common income bracket and makes up 24.4% of all families. Conversely, the $200,000+ income bracket is the least frequent group with only 3 families (0.7%) belonging to this category.
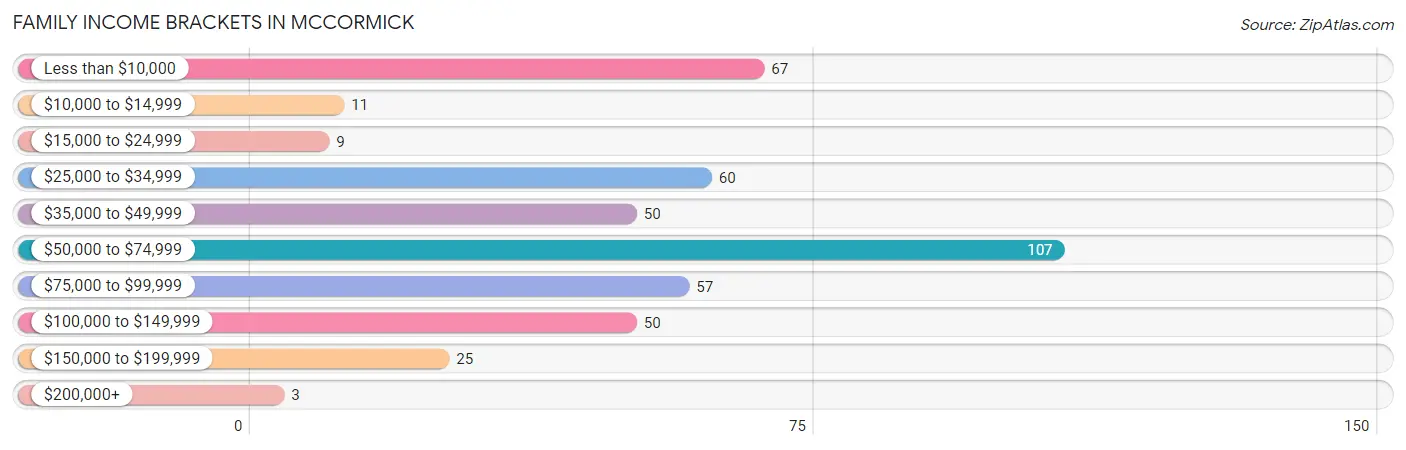
| Income Bracket | # Families | % Families |
| Less than $10,000 | 67 | 15.3% |
| $10,000 to $14,999 | 11 | 2.5% |
| $15,000 to $24,999 | 9 | 2.1% |
| $25,000 to $34,999 | 60 | 13.7% |
| $35,000 to $49,999 | 50 | 11.4% |
| $50,000 to $74,999 | 107 | 24.4% |
| $75,000 to $99,999 | 57 | 13.0% |
| $100,000 to $149,999 | 50 | 11.4% |
| $150,000 to $199,999 | 25 | 5.7% |
| $200,000+ | 3 | 0.7% |
Family Income by Famaliy Size in McCormick
2-person families (217 | 49.4%) account for the highest median family income in McCormick with $53,375 per family, while 2-person families (217 | 49.4%) have the highest median income of $26,688 per family member.
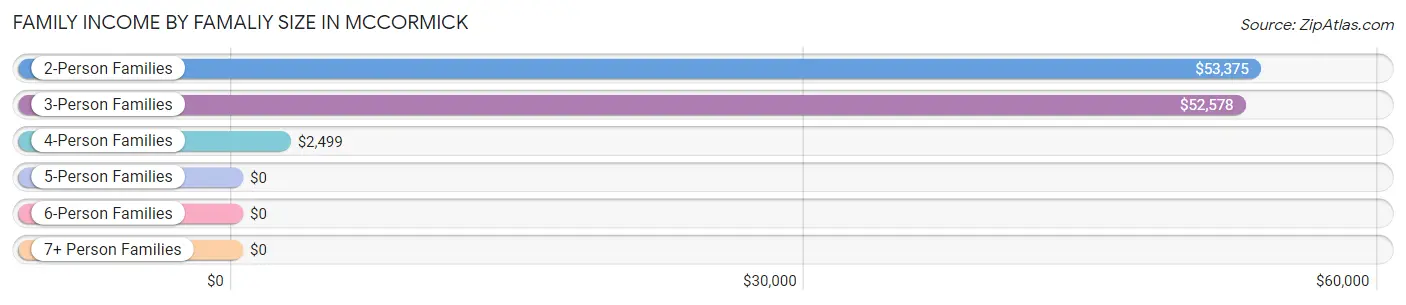
| Income Bracket | # Families | Median Income |
| 2-Person Families | 217 (49.4%) | $53,375 |
| 3-Person Families | 113 (25.7%) | $52,578 |
| 4-Person Families | 58 (13.2%) | $2,499 |
| 5-Person Families | 32 (7.3%) | $0 |
| 6-Person Families | 19 (4.3%) | $0 |
| 7+ Person Families | 0 (0.0%) | $0 |
| Total | 439 (100.0%) | $51,875 |
Family Income by Number of Earners in McCormick
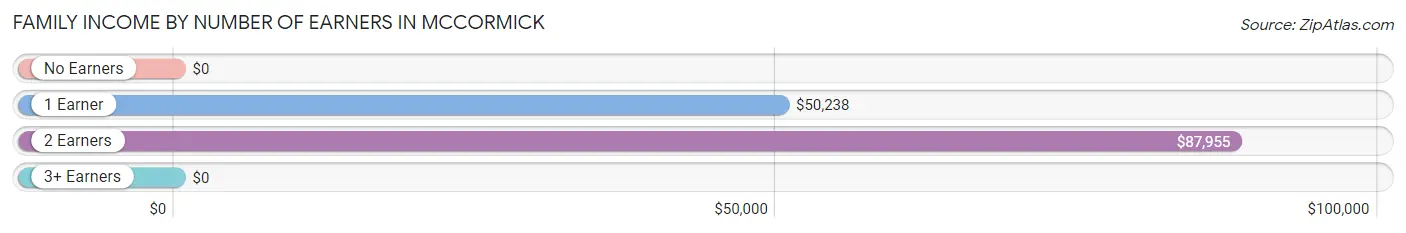
| Number of Earners | # Families | Median Income |
| No Earners | 132 (30.1%) | $0 |
| 1 Earner | 186 (42.4%) | $50,238 |
| 2 Earners | 104 (23.7%) | $87,955 |
| 3+ Earners | 17 (3.9%) | $0 |
| Total | 439 (100.0%) | $51,875 |
Household Income in McCormick
Household Income Brackets in McCormick
With 139 households falling in the category, the $35,000 to $49,999 income range is the most frequent in McCormick, accounting for 18.0% of all households. In contrast, only 3 households (0.4%) fall into the $200,000+ income bracket, making it the least populous group.
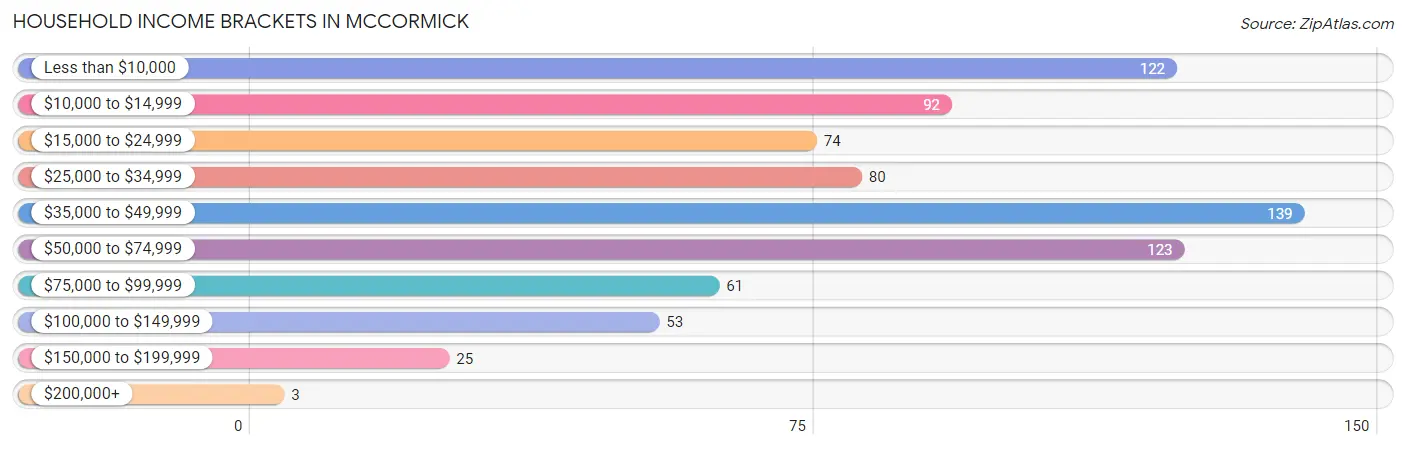
| Income Bracket | # Households | % Households |
| Less than $10,000 | 122 | 15.8% |
| $10,000 to $14,999 | 92 | 11.9% |
| $15,000 to $24,999 | 74 | 9.6% |
| $25,000 to $34,999 | 80 | 10.4% |
| $35,000 to $49,999 | 139 | 18.0% |
| $50,000 to $74,999 | 123 | 15.9% |
| $75,000 to $99,999 | 61 | 7.9% |
| $100,000 to $149,999 | 53 | 6.9% |
| $150,000 to $199,999 | 25 | 3.2% |
| $200,000+ | 3 | 0.4% |
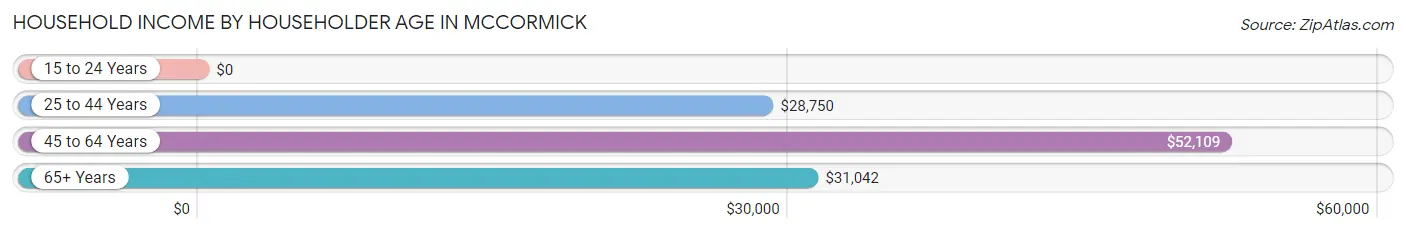
Household Income by Householder Age in McCormick
The median household income in McCormick is $37,568, with the highest median household income of $52,109 found in the 45 to 64 years age bracket for the primary householder. A total of 297 households (38.5%) fall into this category. Meanwhile, the 15 to 24 years age bracket for the primary householder has the lowest median household income of $0, with 13 households (1.7%) in this group.
| Income Bracket | # Households | Median Income |
| 15 to 24 Years | 13 (1.7%) | $0 |
| 25 to 44 Years | 237 (30.7%) | $28,750 |
| 45 to 64 Years | 297 (38.5%) | $52,109 |
| 65+ Years | 225 (29.1%) | $31,042 |
| Total | 772 (100.0%) | $37,568 |
Poverty in McCormick
Income Below Poverty by Sex and Age in McCormick
With 20.3% poverty level for males and 30.2% for females among the residents of McCormick, 5 year old males and 16 and 17 year old females are the most vulnerable to poverty, with 5 males (100.0%) and 13 females (100.0%) in their respective age groups living below the poverty level.
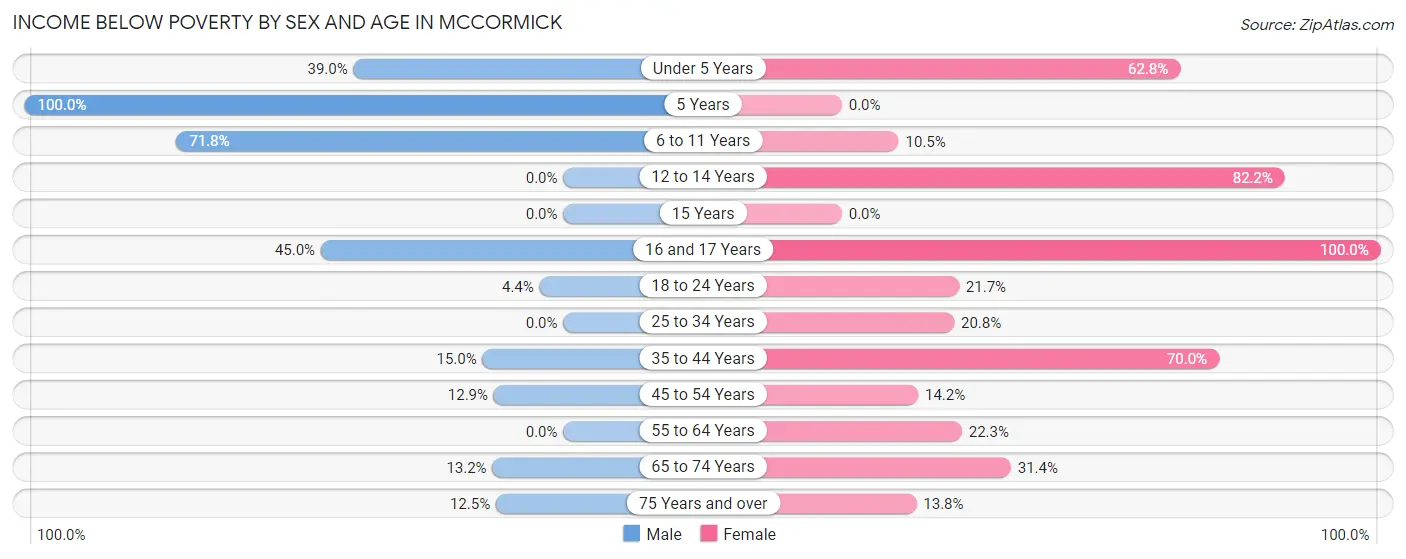
| Age Bracket | Male | Female |
| Under 5 Years | 37 (39.0%) | 27 (62.8%) |
| 5 Years | 5 (100.0%) | 0 (0.0%) |
| 6 to 11 Years | 51 (71.8%) | 18 (10.5%) |
| 12 to 14 Years | 0 (0.0%) | 74 (82.2%) |
| 15 Years | 0 (0.0%) | 0 (0.0%) |
| 16 and 17 Years | 18 (45.0%) | 13 (100.0%) |
| 18 to 24 Years | 3 (4.4%) | 10 (21.7%) |
| 25 to 34 Years | 0 (0.0%) | 15 (20.8%) |
| 35 to 44 Years | 18 (15.0%) | 77 (70.0%) |
| 45 to 54 Years | 12 (12.9%) | 16 (14.2%) |
| 55 to 64 Years | 0 (0.0%) | 47 (22.3%) |
| 65 to 74 Years | 10 (13.2%) | 16 (31.4%) |
| 75 Years and over | 6 (12.5%) | 22 (13.8%) |
| Total | 160 (20.3%) | 335 (30.2%) |
Income Above Poverty by Sex and Age in McCormick
According to the poverty statistics in McCormick, males aged 12 to 14 years and females aged 15 years are the age groups that are most secure financially, with 100.0% of males and 100.0% of females in these age groups living above the poverty line.
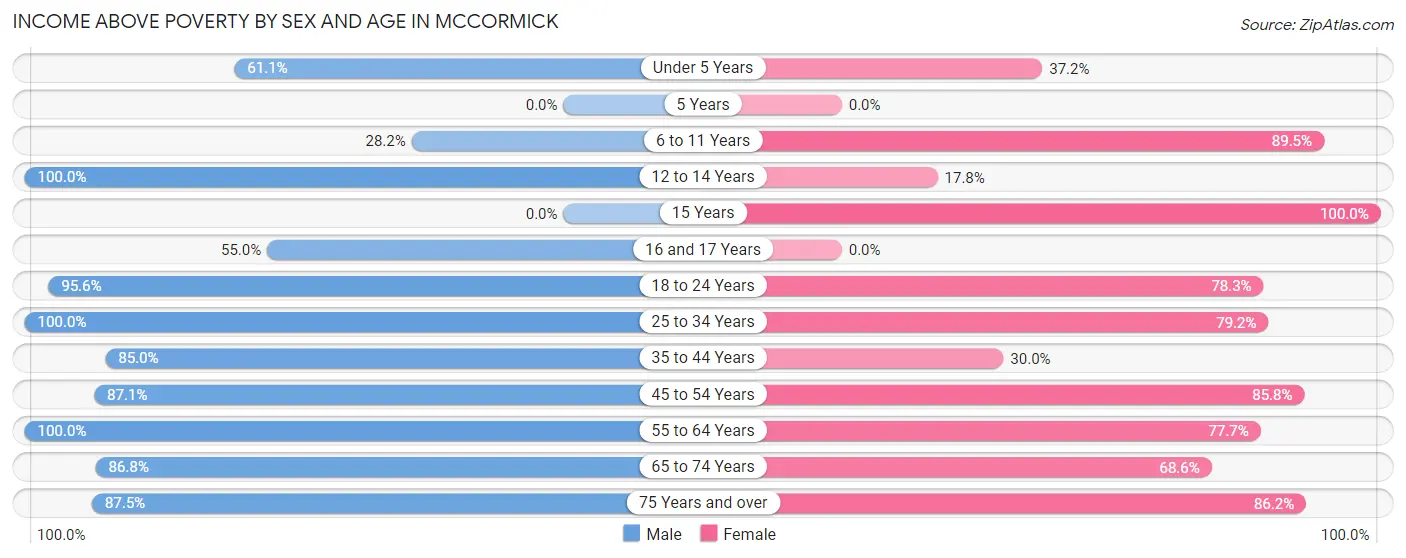
| Age Bracket | Male | Female |
| Under 5 Years | 58 (61.1%) | 16 (37.2%) |
| 5 Years | 0 (0.0%) | 0 (0.0%) |
| 6 to 11 Years | 20 (28.2%) | 153 (89.5%) |
| 12 to 14 Years | 5 (100.0%) | 16 (17.8%) |
| 15 Years | 0 (0.0%) | 31 (100.0%) |
| 16 and 17 Years | 22 (55.0%) | 0 (0.0%) |
| 18 to 24 Years | 65 (95.6%) | 36 (78.3%) |
| 25 to 34 Years | 37 (100.0%) | 57 (79.2%) |
| 35 to 44 Years | 102 (85.0%) | 33 (30.0%) |
| 45 to 54 Years | 81 (87.1%) | 97 (85.8%) |
| 55 to 64 Years | 132 (100.0%) | 164 (77.7%) |
| 65 to 74 Years | 66 (86.8%) | 35 (68.6%) |
| 75 Years and over | 42 (87.5%) | 137 (86.2%) |
| Total | 630 (79.7%) | 775 (69.8%) |
Income Below Poverty Among Married-Couple Families in McCormick
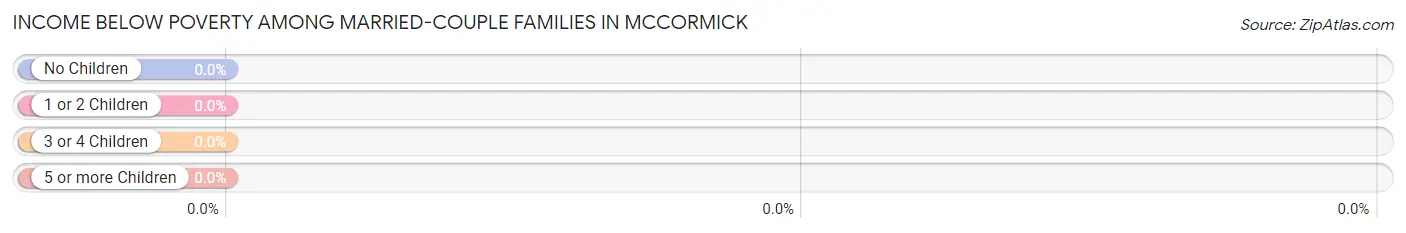
| Children | Above Poverty | Below Poverty |
| No Children | 166 (100.0%) | 0 (0.0%) |
| 1 or 2 Children | 23 (100.0%) | 0 (0.0%) |
| 3 or 4 Children | 11 (100.0%) | 0 (0.0%) |
| 5 or more Children | 0 (0.0%) | 0 (0.0%) |
| Total | 200 (100.0%) | 0 (0.0%) |
Income Below Poverty Among Single-Parent Households in McCormick
According to the poverty data in McCormick, 21.4% or 3 single-father households and 36.0% or 81 single-mother households are living below the poverty line. Among single-father households, those with no children have the highest poverty rate, with 3 households (50.0%) experiencing poverty. Likewise, among single-mother households, those with 3 or 4 children have the highest poverty rate, with 58 households (87.9%) falling below the poverty line.
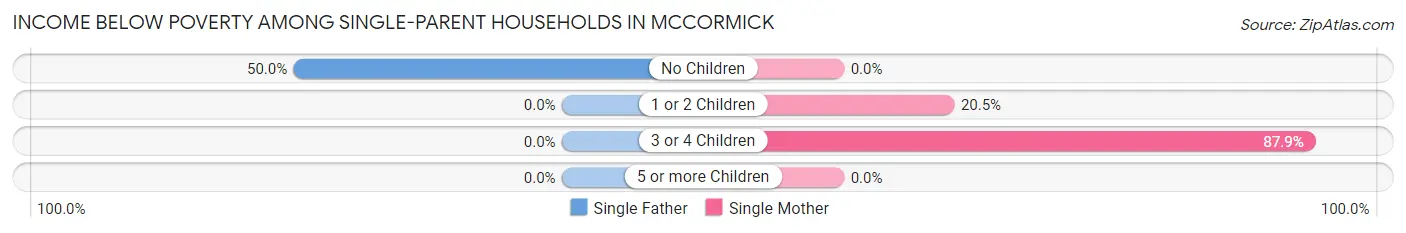
| Children | Single Father | Single Mother |
| No Children | 3 (50.0%) | 0 (0.0%) |
| 1 or 2 Children | 0 (0.0%) | 23 (20.5%) |
| 3 or 4 Children | 0 (0.0%) | 58 (87.9%) |
| 5 or more Children | 0 (0.0%) | 0 (0.0%) |
| Total | 3 (21.4%) | 81 (36.0%) |
Income Below Poverty Among Married-Couple vs Single-Parent Households in McCormick
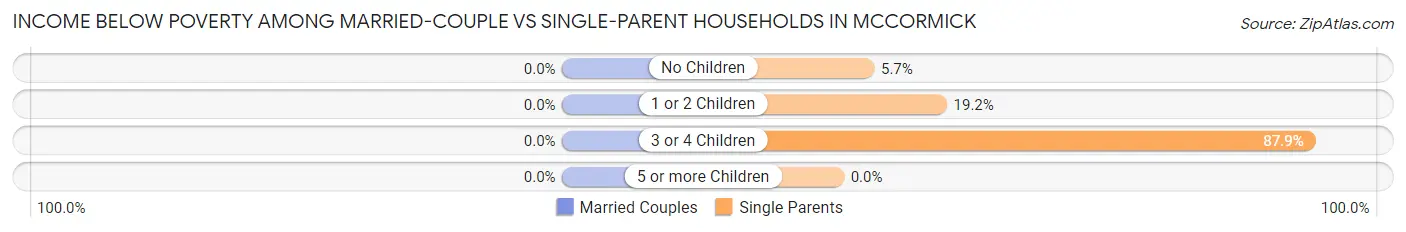
| Children | Married-Couple Families | Single-Parent Households |
| No Children | 0 (0.0%) | 3 (5.7%) |
| 1 or 2 Children | 0 (0.0%) | 23 (19.2%) |
| 3 or 4 Children | 0 (0.0%) | 58 (87.9%) |
| 5 or more Children | 0 (0.0%) | 0 (0.0%) |
| Total | 0 (0.0%) | 84 (35.1%) |
Race in McCormick
The most populous races in McCormick are Black / African American (1,799 | 65.2%), White / Caucasian (786 | 28.5%), and Two or more Races (152 | 5.5%).
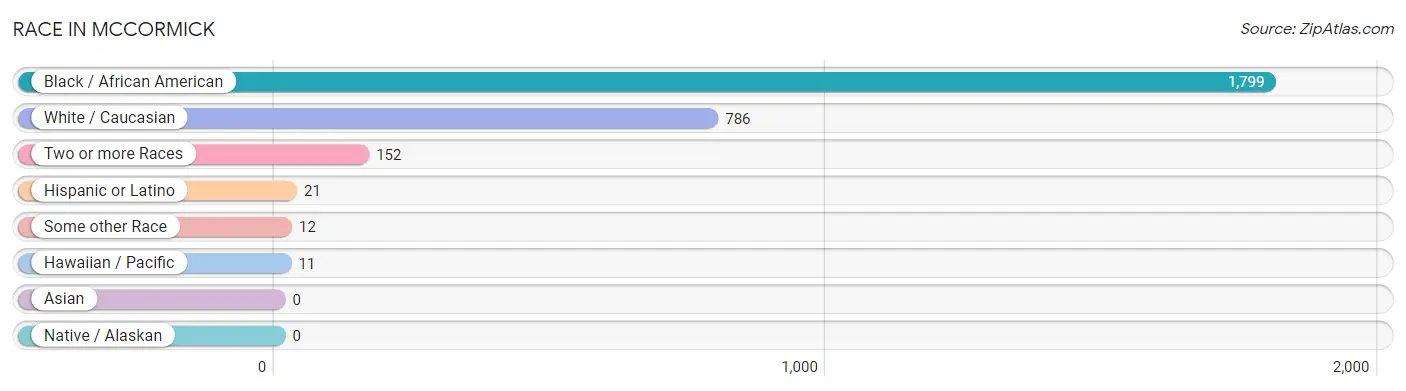
| Race | # Population | % Population |
| Asian | 0 | 0.0% |
| Black / African American | 1,799 | 65.2% |
| Hawaiian / Pacific | 11 | 0.4% |
| Hispanic or Latino | 21 | 0.8% |
| Native / Alaskan | 0 | 0.0% |
| White / Caucasian | 786 | 28.5% |
| Two or more Races | 152 | 5.5% |
| Some other Race | 12 | 0.4% |
| Total | 2,760 | 100.0% |
Ancestry in McCormick
The most populous ancestries reported in McCormick are Subsaharan African (177 | 6.4%), African (169 | 6.1%), English (81 | 2.9%), American (73 | 2.6%), and German (67 | 2.4%), together accounting for 20.5% of all McCormick residents.
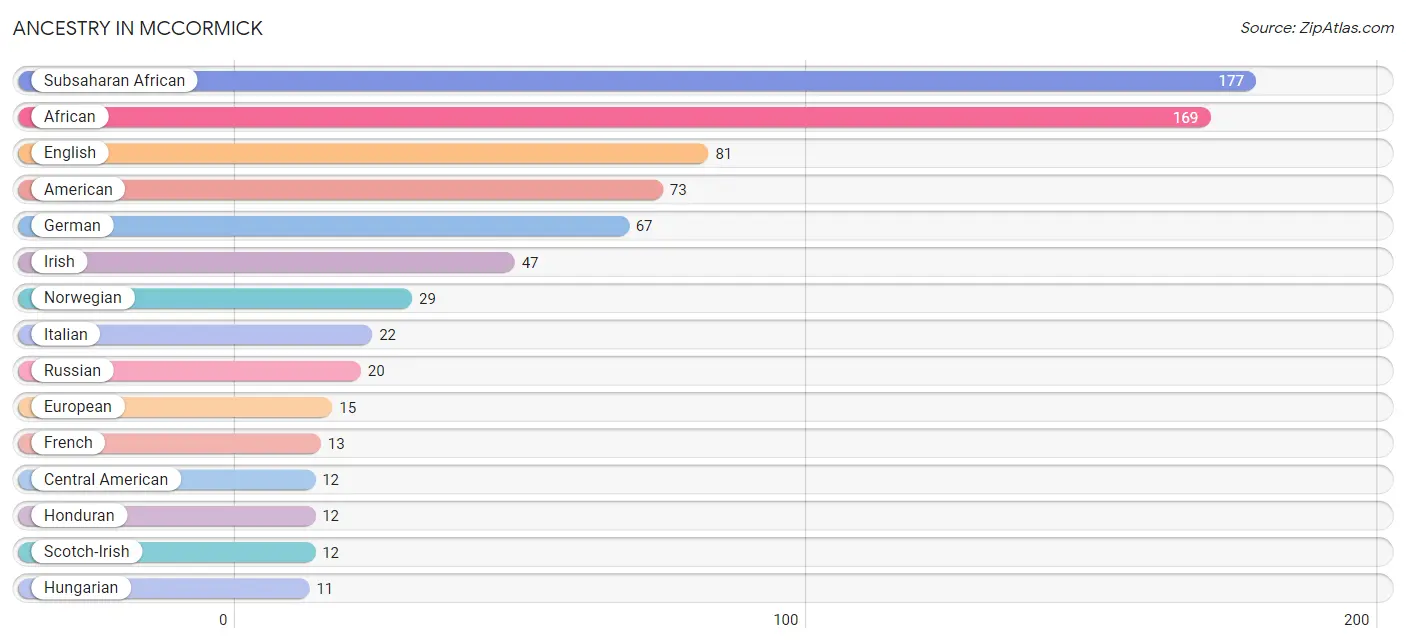
| Ancestry | # Population | % Population |
| African | 169 | 6.1% |
| American | 73 | 2.6% |
| Central American | 12 | 0.4% |
| Cherokee | 2 | 0.1% |
| English | 81 | 2.9% |
| European | 15 | 0.5% |
| French | 13 | 0.5% |
| German | 67 | 2.4% |
| Haitian | 5 | 0.2% |
| Honduran | 12 | 0.4% |
| Hungarian | 11 | 0.4% |
| Irish | 47 | 1.7% |
| Italian | 22 | 0.8% |
| Jamaican | 2 | 0.1% |
| Native Hawaiian | 11 | 0.4% |
| Norwegian | 29 | 1.1% |
| Polish | 3 | 0.1% |
| Puerto Rican | 9 | 0.3% |
| Russian | 20 | 0.7% |
| Scotch-Irish | 12 | 0.4% |
| Slovene | 3 | 0.1% |
| South African | 8 | 0.3% |
| Subsaharan African | 177 | 6.4% |
| Swedish | 8 | 0.3% |
| Welsh | 6 | 0.2% | View All 25 Rows |
Immigrants in McCormick
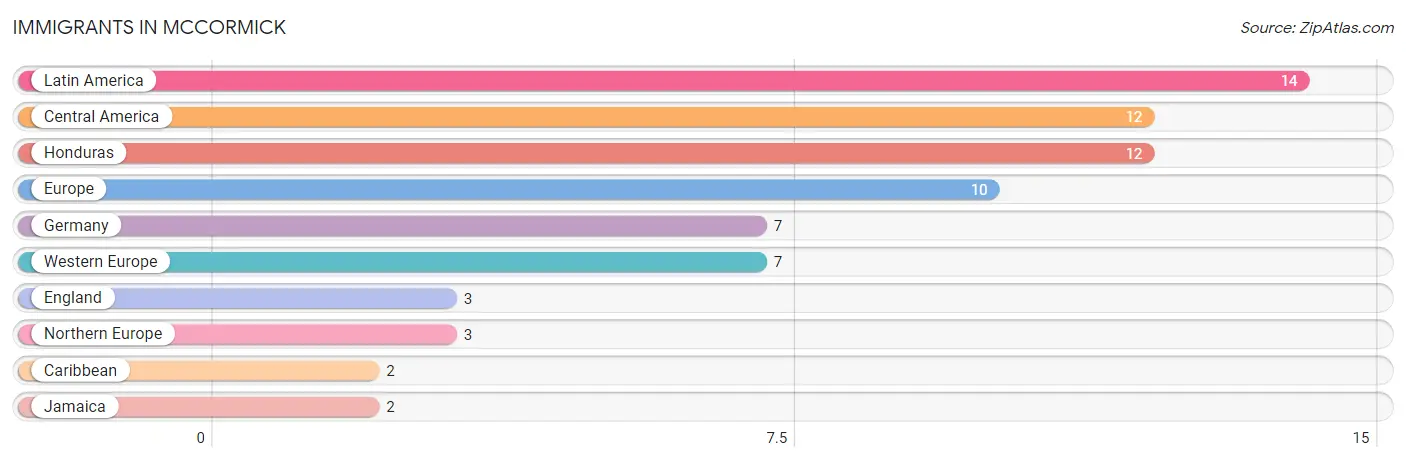
The most numerous immigrant groups reported in McCormick came from Latin America (14 | 0.5%), Central America (12 | 0.4%), Honduras (12 | 0.4%), Europe (10 | 0.4%), and Germany (7 | 0.3%), together accounting for 2.0% of all McCormick residents.
| Immigration Origin | # Population | % Population |
| Caribbean | 2 | 0.1% |
| Central America | 12 | 0.4% |
| England | 3 | 0.1% |
| Europe | 10 | 0.4% |
| Germany | 7 | 0.3% |
| Honduras | 12 | 0.4% |
| Jamaica | 2 | 0.1% |
| Latin America | 14 | 0.5% |
| Northern Europe | 3 | 0.1% |
| Western Europe | 7 | 0.3% | View All 10 Rows |
Sex and Age in McCormick
Sex and Age in McCormick
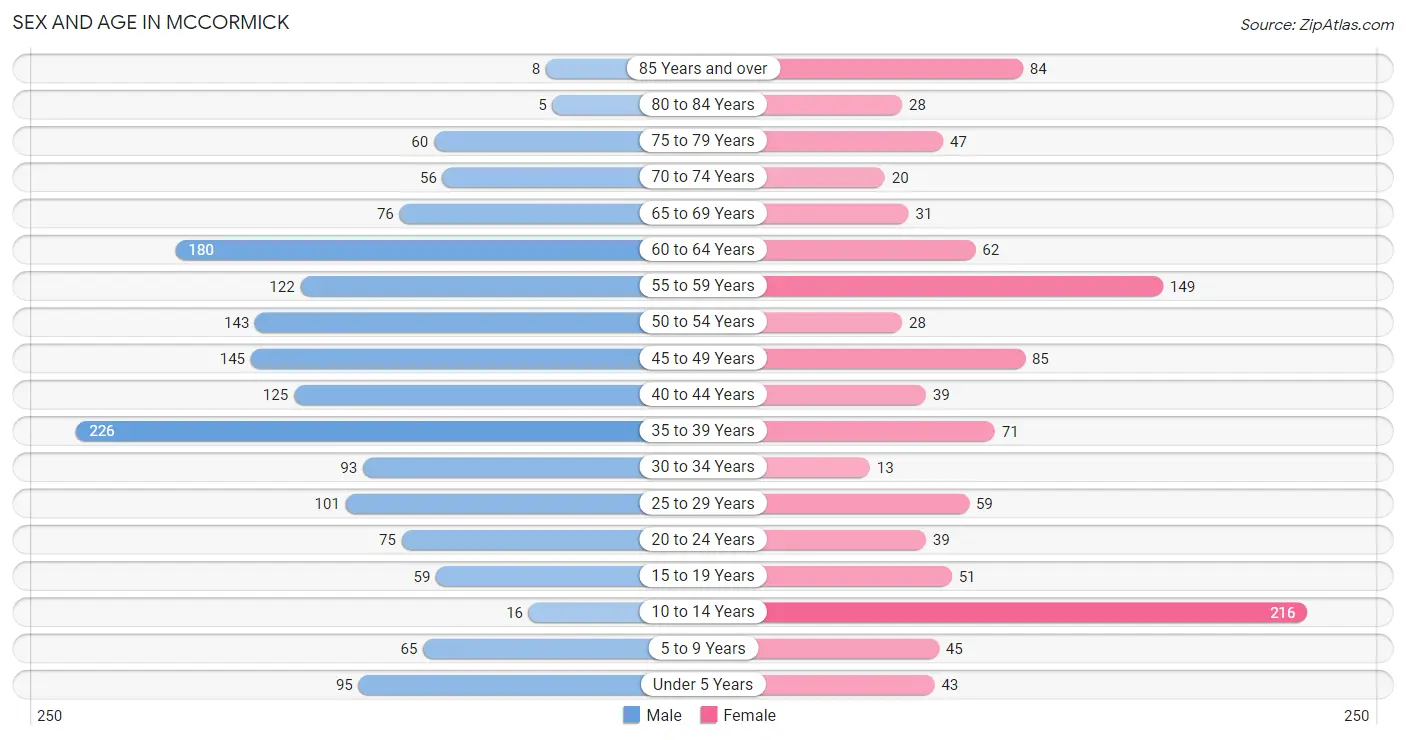
The most populous age groups in McCormick are 35 to 39 Years (226 | 13.7%) for men and 10 to 14 Years (216 | 19.5%) for women.
| Age Bracket | Male | Female |
| Under 5 Years | 95 (5.8%) | 43 (3.9%) |
| 5 to 9 Years | 65 (3.9%) | 45 (4.1%) |
| 10 to 14 Years | 16 (1.0%) | 216 (19.5%) |
| 15 to 19 Years | 59 (3.6%) | 51 (4.6%) |
| 20 to 24 Years | 75 (4.5%) | 39 (3.5%) |
| 25 to 29 Years | 101 (6.1%) | 59 (5.3%) |
| 30 to 34 Years | 93 (5.6%) | 13 (1.2%) |
| 35 to 39 Years | 226 (13.7%) | 71 (6.4%) |
| 40 to 44 Years | 125 (7.6%) | 39 (3.5%) |
| 45 to 49 Years | 145 (8.8%) | 85 (7.7%) |
| 50 to 54 Years | 143 (8.7%) | 28 (2.5%) |
| 55 to 59 Years | 122 (7.4%) | 149 (13.4%) |
| 60 to 64 Years | 180 (10.9%) | 62 (5.6%) |
| 65 to 69 Years | 76 (4.6%) | 31 (2.8%) |
| 70 to 74 Years | 56 (3.4%) | 20 (1.8%) |
| 75 to 79 Years | 60 (3.6%) | 47 (4.2%) |
| 80 to 84 Years | 5 (0.3%) | 28 (2.5%) |
| 85 Years and over | 8 (0.5%) | 84 (7.6%) |
| Total | 1,650 (100.0%) | 1,110 (100.0%) |
Families and Households in McCormick
Median Family Size in McCormick
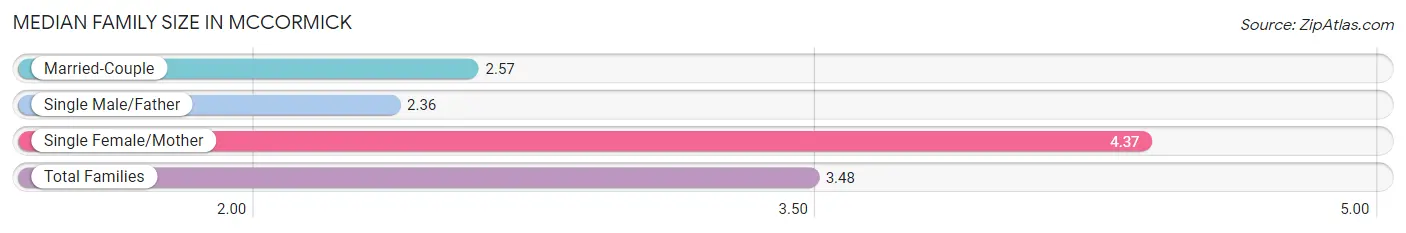
The median family size in McCormick is 3.48 persons per family, with single female/mother families (225 | 51.2%) accounting for the largest median family size of 4.37 persons per family. On the other hand, single male/father families (14 | 3.2%) represent the smallest median family size with 2.36 persons per family.
| Family Type | # Families | Family Size |
| Married-Couple | 200 (45.6%) | 2.57 |
| Single Male/Father | 14 (3.2%) | 2.36 |
| Single Female/Mother | 225 (51.2%) | 4.37 |
| Total Families | 439 (100.0%) | 3.48 |
Median Household Size in McCormick
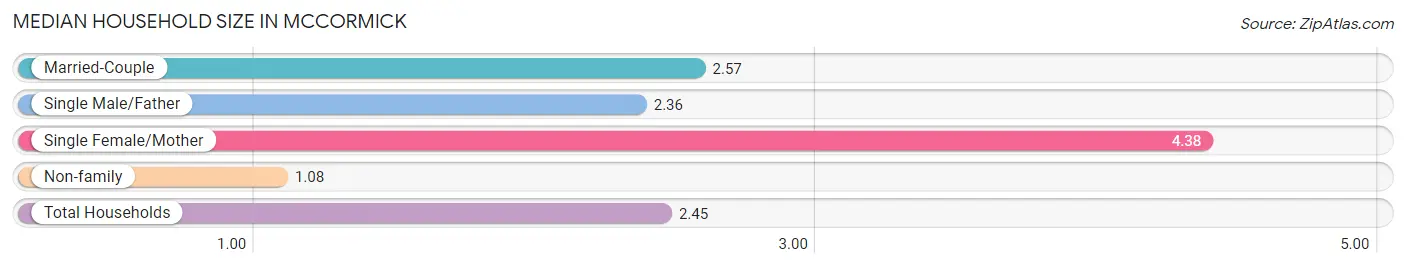
The median household size in McCormick is 2.45 persons per household, with single female/mother households (225 | 29.1%) accounting for the largest median household size of 4.38 persons per household. non-family households (333 | 43.1%) represent the smallest median household size with 1.08 persons per household.
| Household Type | # Households | Household Size |
| Married-Couple | 200 (25.9%) | 2.57 |
| Single Male/Father | 14 (1.8%) | 2.36 |
| Single Female/Mother | 225 (29.1%) | 4.38 |
| Non-family | 333 (43.1%) | 1.08 |
| Total Households | 772 (100.0%) | 2.45 |
Household Size by Marriage Status in McCormick
Out of a total of 772 households in McCormick, 439 (56.9%) are family households, while 333 (43.1%) are nonfamily households. The most numerous type of family households are 2-person households, comprising 214, and the most common type of nonfamily households are 1-person households, comprising 318.
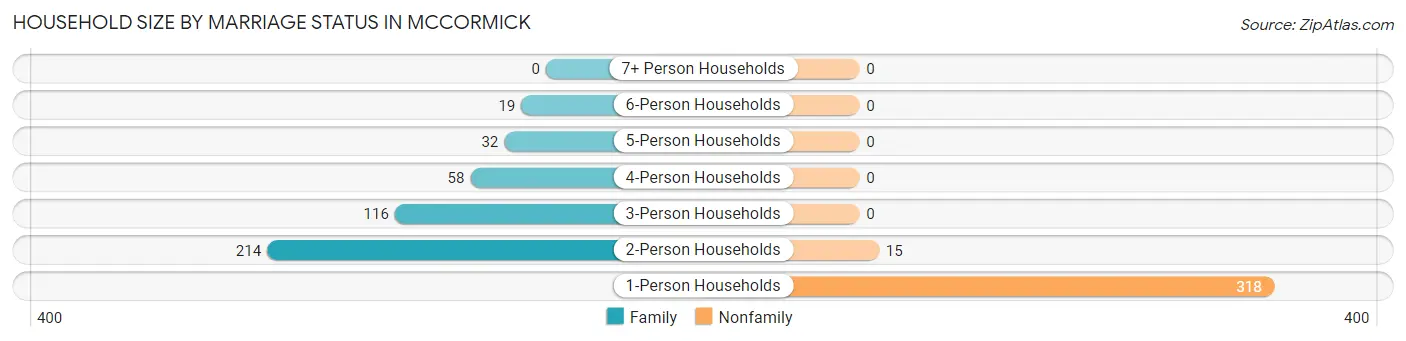
| Household Size | Family Households | Nonfamily Households |
| 1-Person Households | - | 318 (41.2%) |
| 2-Person Households | 214 (27.7%) | 15 (1.9%) |
| 3-Person Households | 116 (15.0%) | 0 (0.0%) |
| 4-Person Households | 58 (7.5%) | 0 (0.0%) |
| 5-Person Households | 32 (4.2%) | 0 (0.0%) |
| 6-Person Households | 19 (2.5%) | 0 (0.0%) |
| 7+ Person Households | 0 (0.0%) | 0 (0.0%) |
| Total | 439 (56.9%) | 333 (43.1%) |
Female Fertility in McCormick
Fertility by Age in McCormick
Average fertility rate in McCormick is 39.0 births per 1,000 women. Women in the age bracket of 20 to 34 years have the highest fertility rate with 126.0 births per 1,000 women. Women in the age bracket of 20 to 34 years acount for 100.0% of all women with births.
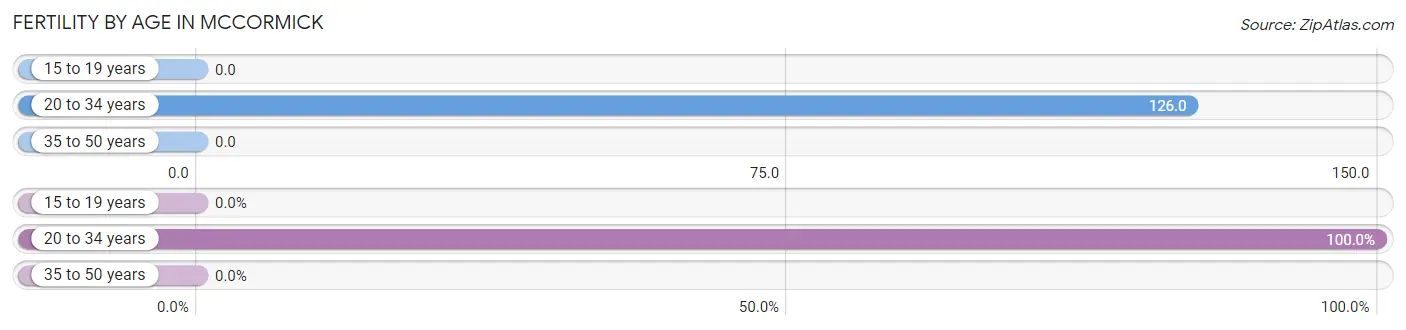
| Age Bracket | Women with Births | Births / 1,000 Women |
| 15 to 19 years | 0 (0.0%) | 0.0 |
| 20 to 34 years | 14 (100.0%) | 126.0 |
| 35 to 50 years | 0 (0.0%) | 0.0 |
| Total | 14 (100.0%) | 39.0 |
Fertility by Age by Marriage Status in McCormick
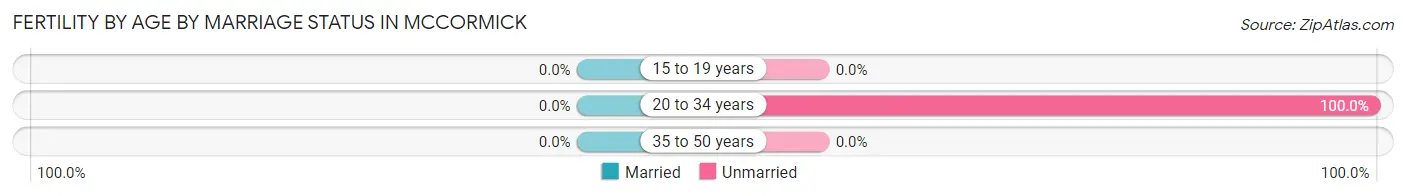
| Age Bracket | Married | Unmarried |
| 15 to 19 years | 0 (0.0%) | 0 (0.0%) |
| 20 to 34 years | 0 (0.0%) | 14 (100.0%) |
| 35 to 50 years | 0 (0.0%) | 0 (0.0%) |
| Total | 0 (0.0%) | 14 (100.0%) |
Fertility by Education in McCormick
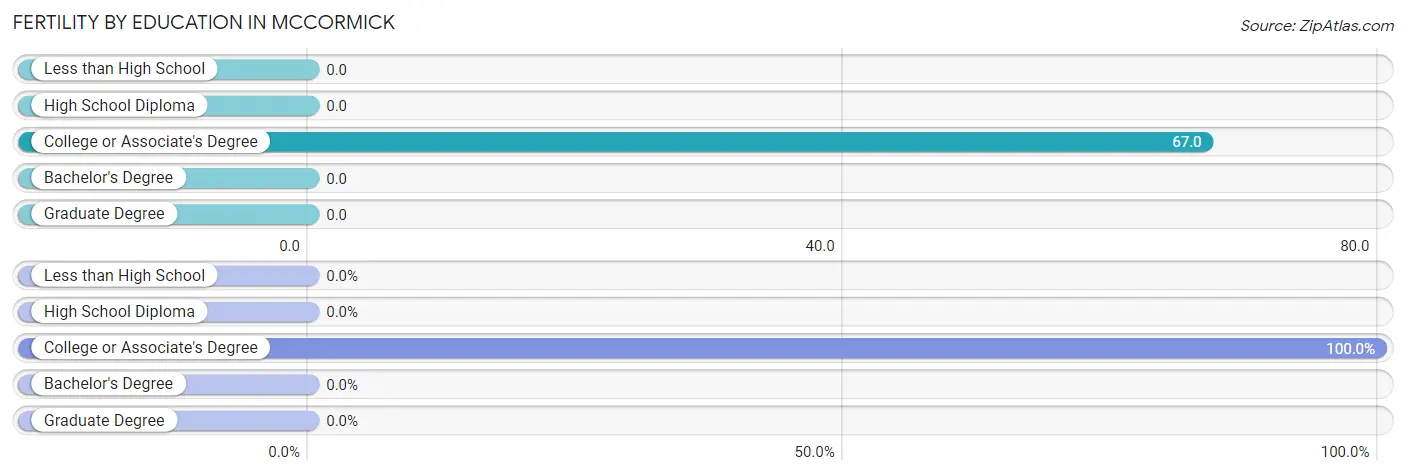
| Educational Attainment | Women with Births | Births / 1,000 Women |
| Less than High School | 0 (0.0%) | 0.0 |
| High School Diploma | 0 (0.0%) | 0.0 |
| College or Associate's Degree | 14 (100.0%) | 67.0 |
| Bachelor's Degree | 0 (0.0%) | 0.0 |
| Graduate Degree | 0 (0.0%) | 0.0 |
| Total | 14 (100.0%) | 39.0 |
Fertility by Education by Marriage Status in McCormick
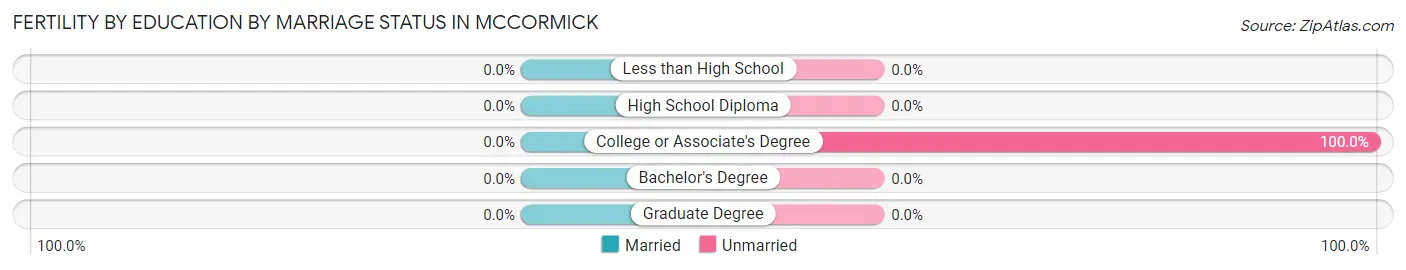
| Educational Attainment | Married | Unmarried |
| Less than High School | 0 (0.0%) | 0 (0.0%) |
| High School Diploma | 0 (0.0%) | 0 (0.0%) |
| College or Associate's Degree | 0 (0.0%) | 14 (100.0%) |
| Bachelor's Degree | 0 (0.0%) | 0 (0.0%) |
| Graduate Degree | 0 (0.0%) | 0 (0.0%) |
| Total | 0 (0.0%) | 14 (100.0%) |
Employment Characteristics in McCormick
Employment by Class of Employer in McCormick
Among the 596 employed individuals in McCormick, private company employees (338 | 56.7%), state government employees (106 | 17.8%), and local government employees (53 | 8.9%) make up the most common classes of employment.
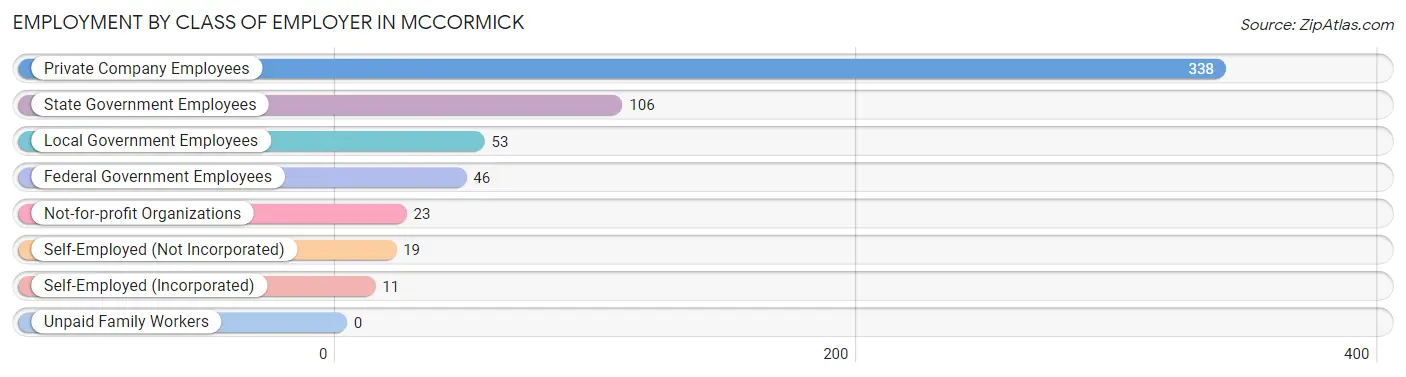
| Employer Class | # Employees | % Employees |
| Private Company Employees | 338 | 56.7% |
| Self-Employed (Incorporated) | 11 | 1.8% |
| Self-Employed (Not Incorporated) | 19 | 3.2% |
| Not-for-profit Organizations | 23 | 3.9% |
| Local Government Employees | 53 | 8.9% |
| State Government Employees | 106 | 17.8% |
| Federal Government Employees | 46 | 7.7% |
| Unpaid Family Workers | 0 | 0.0% |
| Total | 596 | 100.0% |
Employment Status by Age in McCormick
According to the labor force statistics for McCormick, out of the total population over 16 years of age (2,249), 27.5% or 618 individuals are in the labor force, with 3.6% or 22 of them unemployed. The age group with the highest labor force participation rate is 20 to 24 years, with 65.8% or 75 individuals in the labor force. Within the labor force, the 65 to 74 years age range has the highest percentage of unemployed individuals, with 32.3% or 10 of them being unemployed.
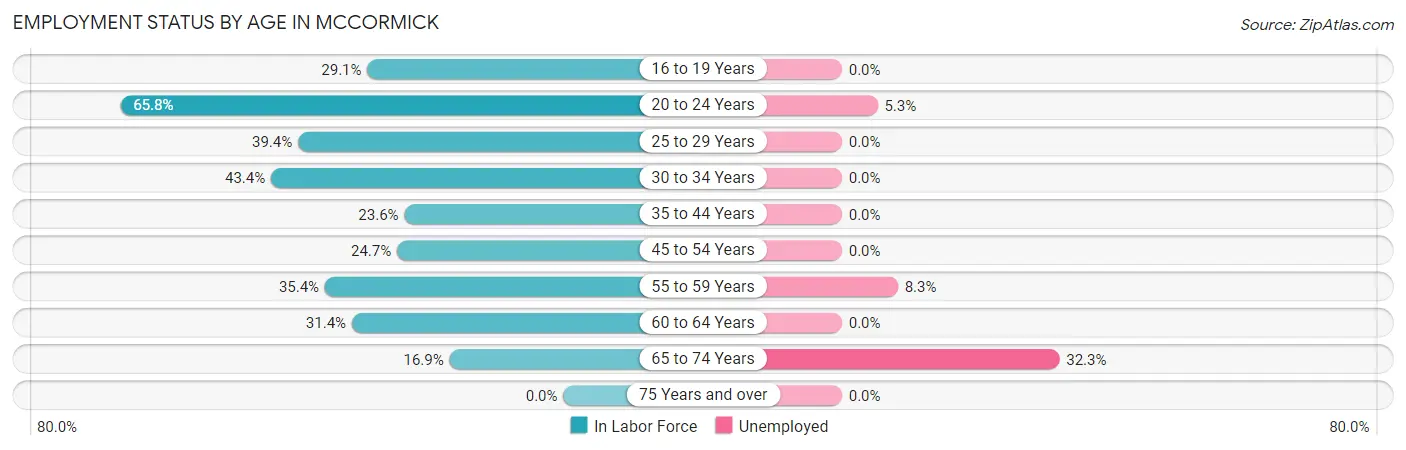
| Age Bracket | In Labor Force | Unemployed |
| 16 to 19 Years | 23 (29.1%) | 0 (0.0%) |
| 20 to 24 Years | 75 (65.8%) | 4 (5.3%) |
| 25 to 29 Years | 63 (39.4%) | 0 (0.0%) |
| 30 to 34 Years | 46 (43.4%) | 0 (0.0%) |
| 35 to 44 Years | 109 (23.6%) | 0 (0.0%) |
| 45 to 54 Years | 99 (24.7%) | 0 (0.0%) |
| 55 to 59 Years | 96 (35.4%) | 8 (8.3%) |
| 60 to 64 Years | 76 (31.4%) | 0 (0.0%) |
| 65 to 74 Years | 31 (16.9%) | 10 (32.3%) |
| 75 Years and over | 0 (0.0%) | 0 (0.0%) |
| Total | 618 (27.5%) | 22 (3.6%) |
Employment Status by Educational Attainment in McCormick
According to labor force statistics for McCormick, 29.8% of individuals (489) out of the total population between 25 and 64 years of age (1,641) are in the labor force, with 1.6% or 8 of them being unemployed. The group with the highest labor force participation rate are those with the educational attainment of bachelor's degree or higher, with 76.6% or 121 individuals in the labor force. Within the labor force, individuals with college / associate degree education have the highest percentage of unemployment, with 4.8% or 8 of them being unemployed.
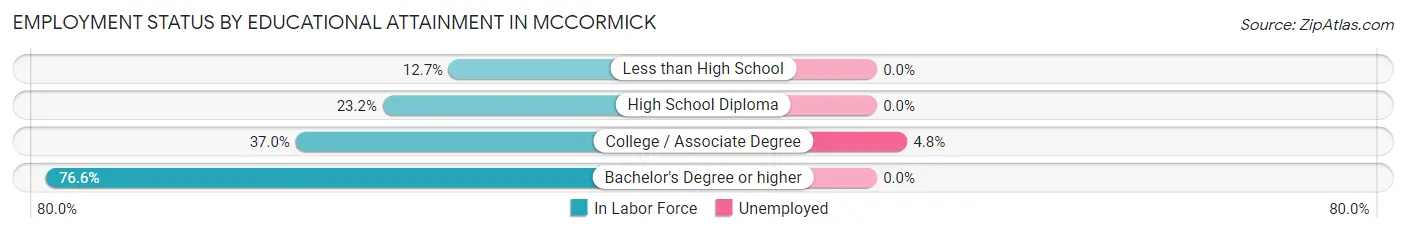
| Educational Attainment | In Labor Force | Unemployed |
| Less than High School | 46 (12.7%) | 0 (0.0%) |
| High School Diploma | 156 (23.2%) | 0 (0.0%) |
| College / Associate Degree | 166 (37.0%) | 22 (4.8%) |
| Bachelor's Degree or higher | 121 (76.6%) | 0 (0.0%) |
| Total | 489 (29.8%) | 26 (1.6%) |
Employment Occupations by Sex in McCormick
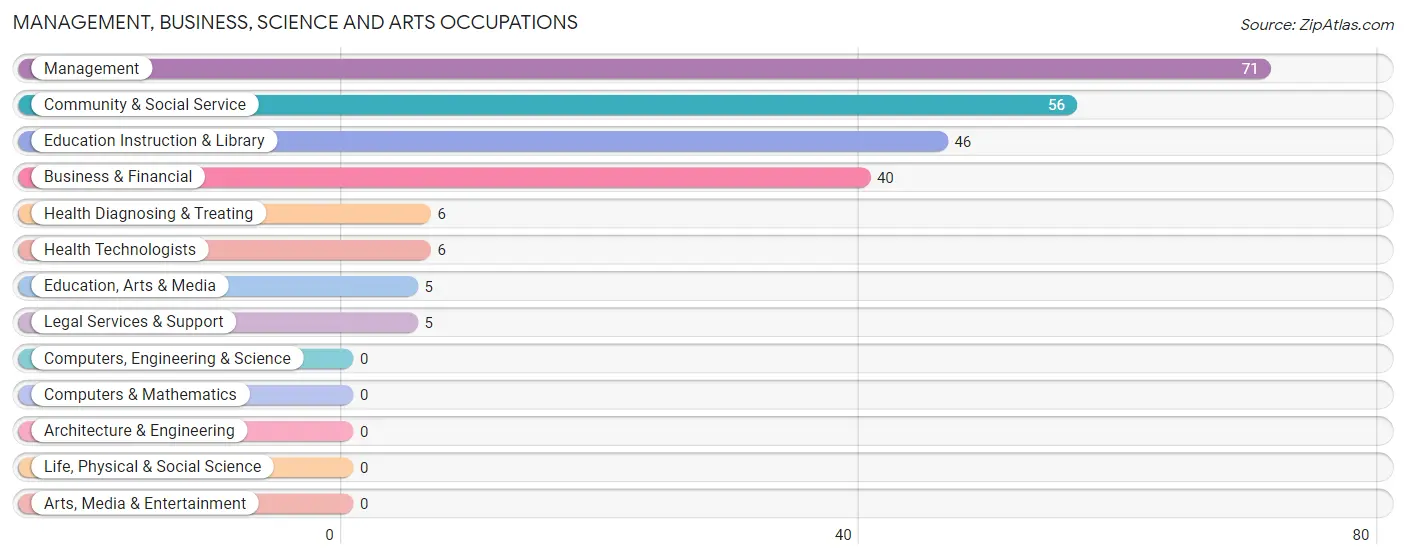
Management, Business, Science and Arts Occupations
The most common Management, Business, Science and Arts occupations in McCormick are Management (71 | 11.9%), Community & Social Service (56 | 9.4%), Education Instruction & Library (46 | 7.7%), Business & Financial (40 | 6.7%), and Health Diagnosing & Treating (6 | 1.0%).
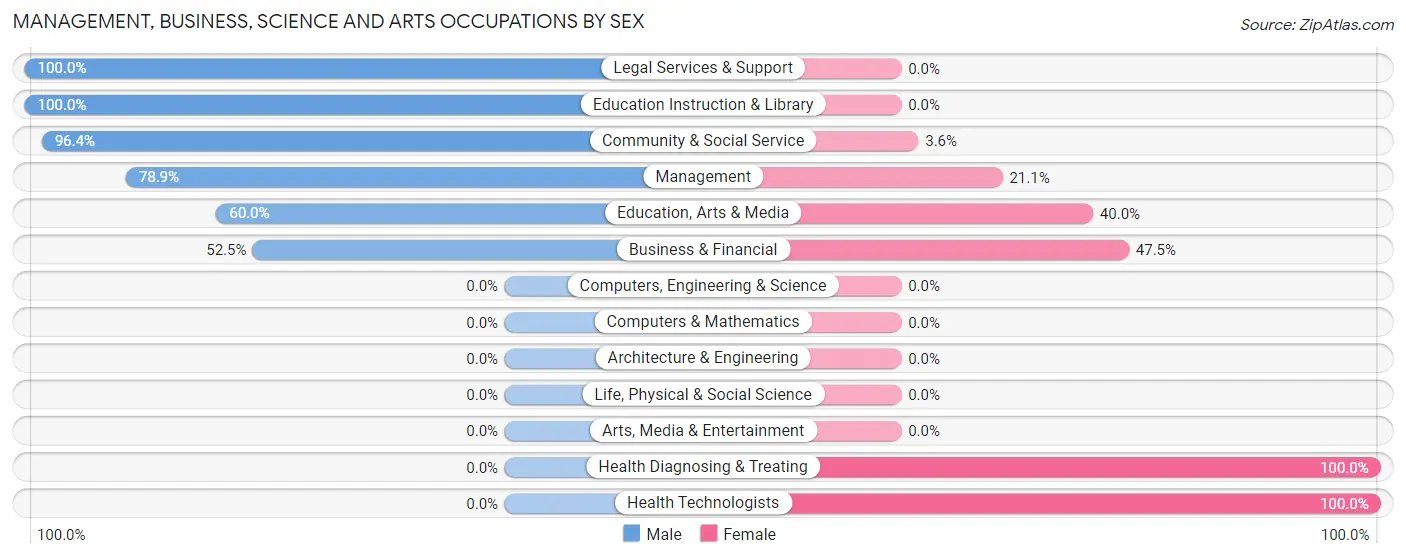
Management, Business, Science and Arts Occupations by Sex
Within the Management, Business, Science and Arts occupations in McCormick, the most male-oriented occupations are Legal Services & Support (100.0%), Education Instruction & Library (100.0%), and Community & Social Service (96.4%), while the most female-oriented occupations are Health Diagnosing & Treating (100.0%), Health Technologists (100.0%), and Business & Financial (47.5%).
| Occupation | Male | Female |
| Management | 56 (78.9%) | 15 (21.1%) |
| Business & Financial | 21 (52.5%) | 19 (47.5%) |
| Computers, Engineering & Science | 0 (0.0%) | 0 (0.0%) |
| Computers & Mathematics | 0 (0.0%) | 0 (0.0%) |
| Architecture & Engineering | 0 (0.0%) | 0 (0.0%) |
| Life, Physical & Social Science | 0 (0.0%) | 0 (0.0%) |
| Community & Social Service | 54 (96.4%) | 2 (3.6%) |
| Education, Arts & Media | 3 (60.0%) | 2 (40.0%) |
| Legal Services & Support | 5 (100.0%) | 0 (0.0%) |
| Education Instruction & Library | 46 (100.0%) | 0 (0.0%) |
| Arts, Media & Entertainment | 0 (0.0%) | 0 (0.0%) |
| Health Diagnosing & Treating | 0 (0.0%) | 6 (100.0%) |
| Health Technologists | 0 (0.0%) | 6 (100.0%) |
| Total (Category) | 131 (75.7%) | 42 (24.3%) |
| Total (Overall) | 298 (50.0%) | 298 (50.0%) |
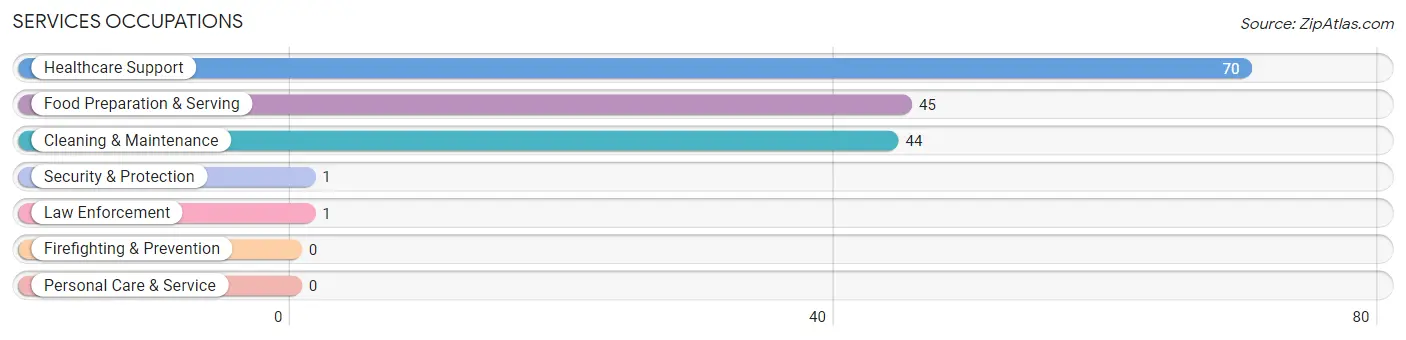
Services Occupations
The most common Services occupations in McCormick are Healthcare Support (70 | 11.7%), Food Preparation & Serving (45 | 7.5%), Cleaning & Maintenance (44 | 7.4%), Security & Protection (1 | 0.2%), and Law Enforcement (1 | 0.2%).
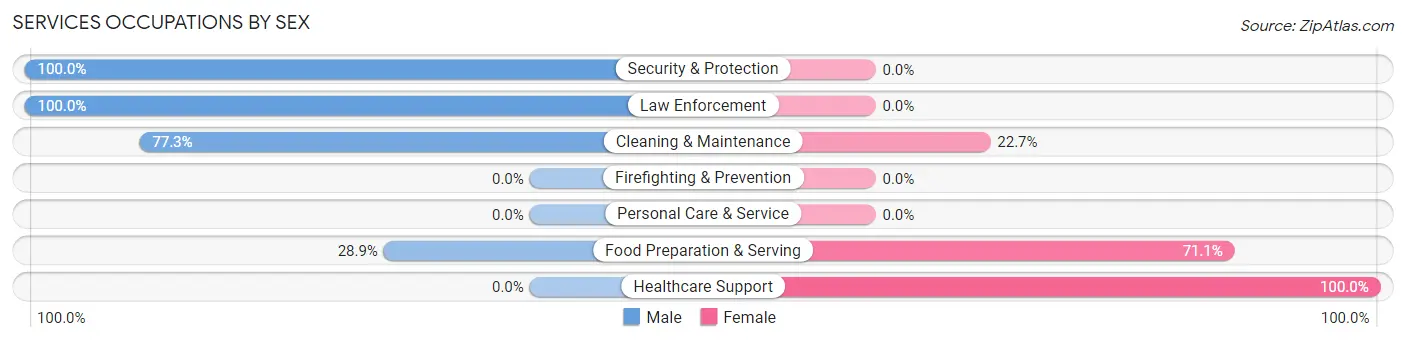
Services Occupations by Sex
Within the Services occupations in McCormick, the most male-oriented occupations are Security & Protection (100.0%), Law Enforcement (100.0%), and Cleaning & Maintenance (77.3%), while the most female-oriented occupations are Healthcare Support (100.0%), Food Preparation & Serving (71.1%), and Cleaning & Maintenance (22.7%).
| Occupation | Male | Female |
| Healthcare Support | 0 (0.0%) | 70 (100.0%) |
| Security & Protection | 1 (100.0%) | 0 (0.0%) |
| Firefighting & Prevention | 0 (0.0%) | 0 (0.0%) |
| Law Enforcement | 1 (100.0%) | 0 (0.0%) |
| Food Preparation & Serving | 13 (28.9%) | 32 (71.1%) |
| Cleaning & Maintenance | 34 (77.3%) | 10 (22.7%) |
| Personal Care & Service | 0 (0.0%) | 0 (0.0%) |
| Total (Category) | 48 (30.0%) | 112 (70.0%) |
| Total (Overall) | 298 (50.0%) | 298 (50.0%) |
Sales and Office Occupations
The most common Sales and Office occupations in McCormick are Office & Administration (58 | 9.7%), and Sales & Related (41 | 6.9%).
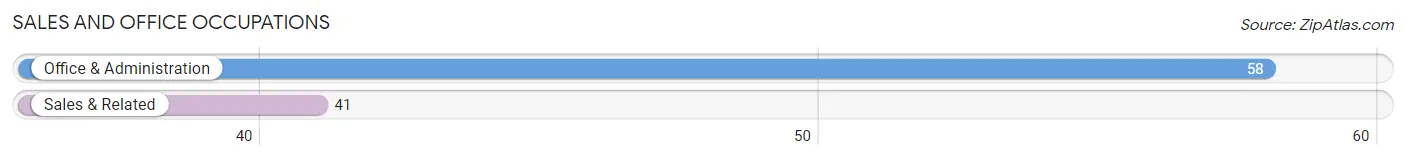
Sales and Office Occupations by Sex
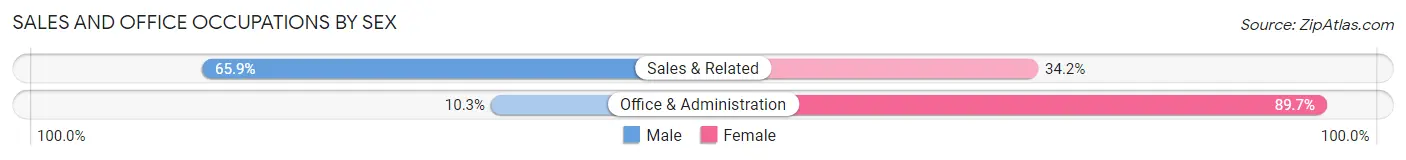
| Occupation | Male | Female |
| Sales & Related | 27 (65.8%) | 14 (34.2%) |
| Office & Administration | 6 (10.3%) | 52 (89.7%) |
| Total (Category) | 33 (33.3%) | 66 (66.7%) |
| Total (Overall) | 298 (50.0%) | 298 (50.0%) |
Natural Resources, Construction and Maintenance Occupations
The most common Natural Resources, Construction and Maintenance occupations in McCormick are Construction & Extraction (32 | 5.4%), and Farming, Fishing & Forestry (29 | 4.9%).
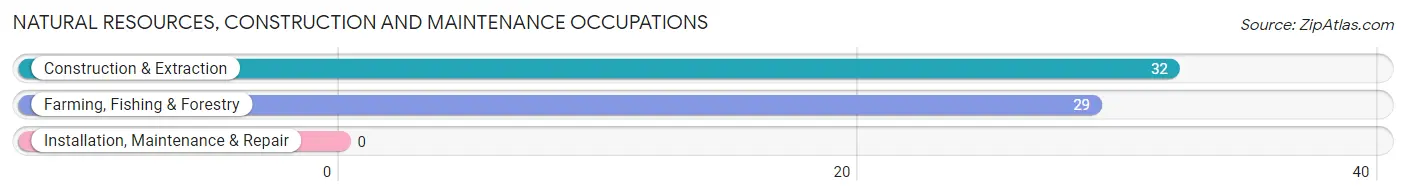
Natural Resources, Construction and Maintenance Occupations by Sex
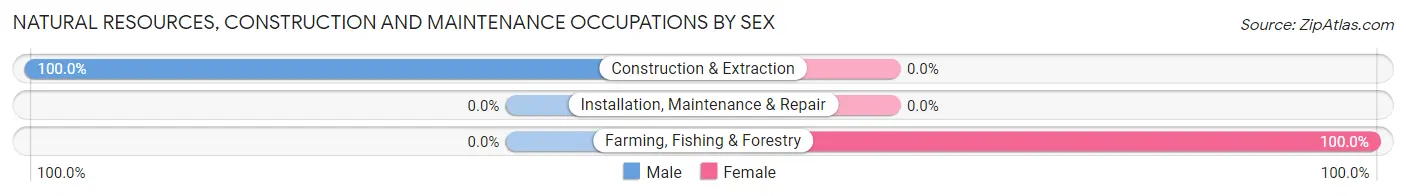
| Occupation | Male | Female |
| Farming, Fishing & Forestry | 0 (0.0%) | 29 (100.0%) |
| Construction & Extraction | 32 (100.0%) | 0 (0.0%) |
| Installation, Maintenance & Repair | 0 (0.0%) | 0 (0.0%) |
| Total (Category) | 32 (52.5%) | 29 (47.5%) |
| Total (Overall) | 298 (50.0%) | 298 (50.0%) |
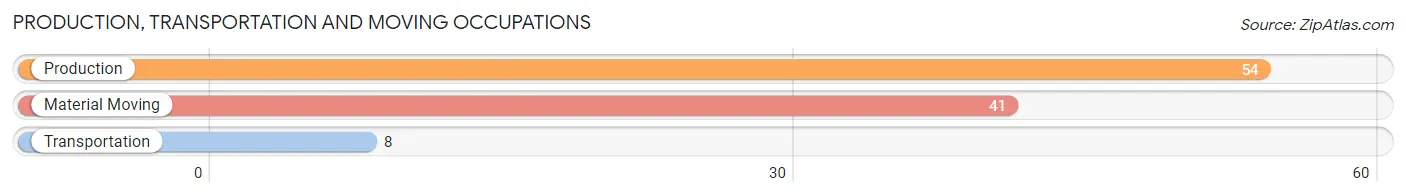
Production, Transportation and Moving Occupations
The most common Production, Transportation and Moving occupations in McCormick are Production (54 | 9.1%), Material Moving (41 | 6.9%), and Transportation (8 | 1.3%).
Production, Transportation and Moving Occupations by Sex
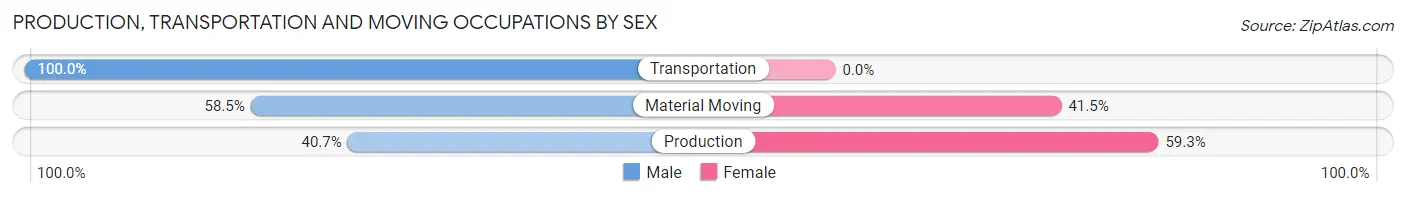
| Occupation | Male | Female |
| Production | 22 (40.7%) | 32 (59.3%) |
| Transportation | 8 (100.0%) | 0 (0.0%) |
| Material Moving | 24 (58.5%) | 17 (41.5%) |
| Total (Category) | 54 (52.4%) | 49 (47.6%) |
| Total (Overall) | 298 (50.0%) | 298 (50.0%) |
Employment Industries by Sex in McCormick
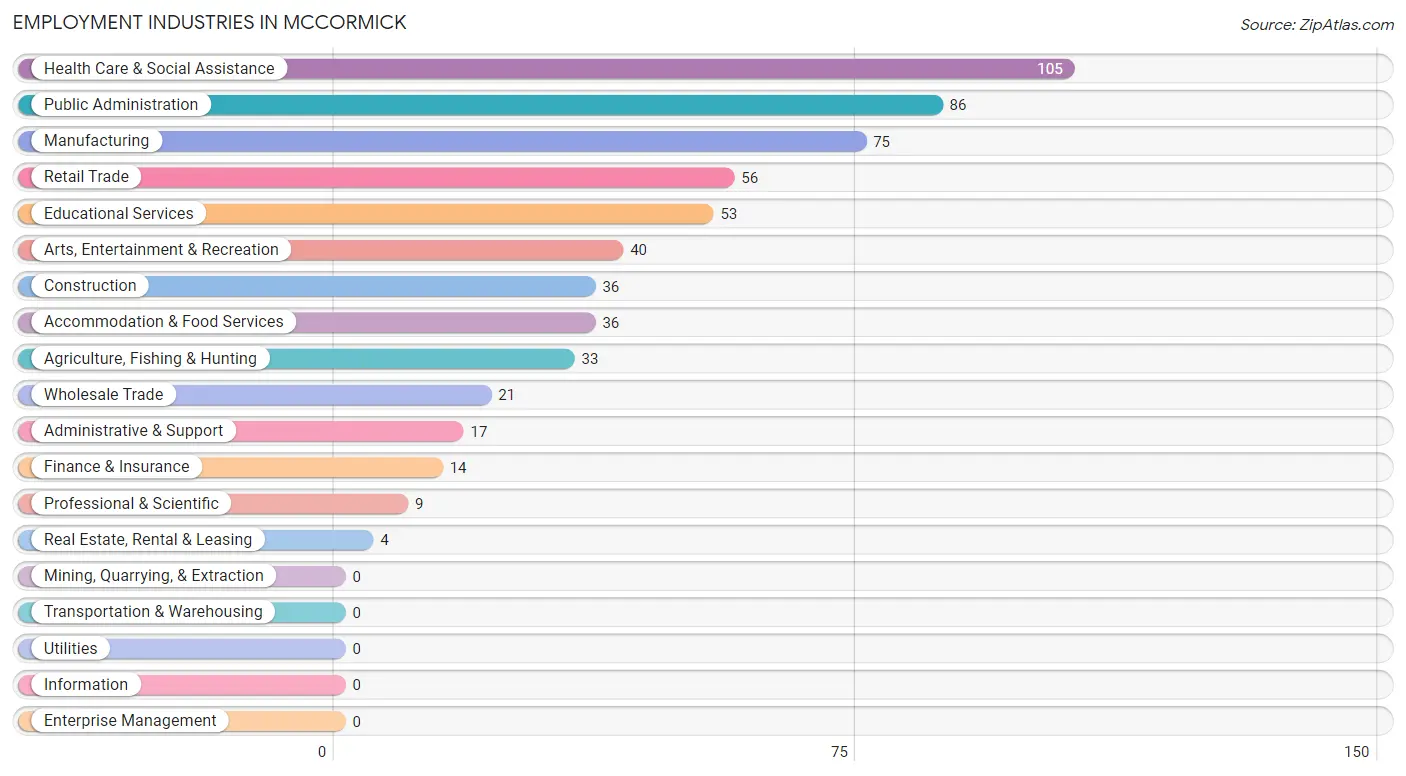
Employment Industries in McCormick
The major employment industries in McCormick include Health Care & Social Assistance (105 | 17.6%), Public Administration (86 | 14.4%), Manufacturing (75 | 12.6%), Retail Trade (56 | 9.4%), and Educational Services (53 | 8.9%).
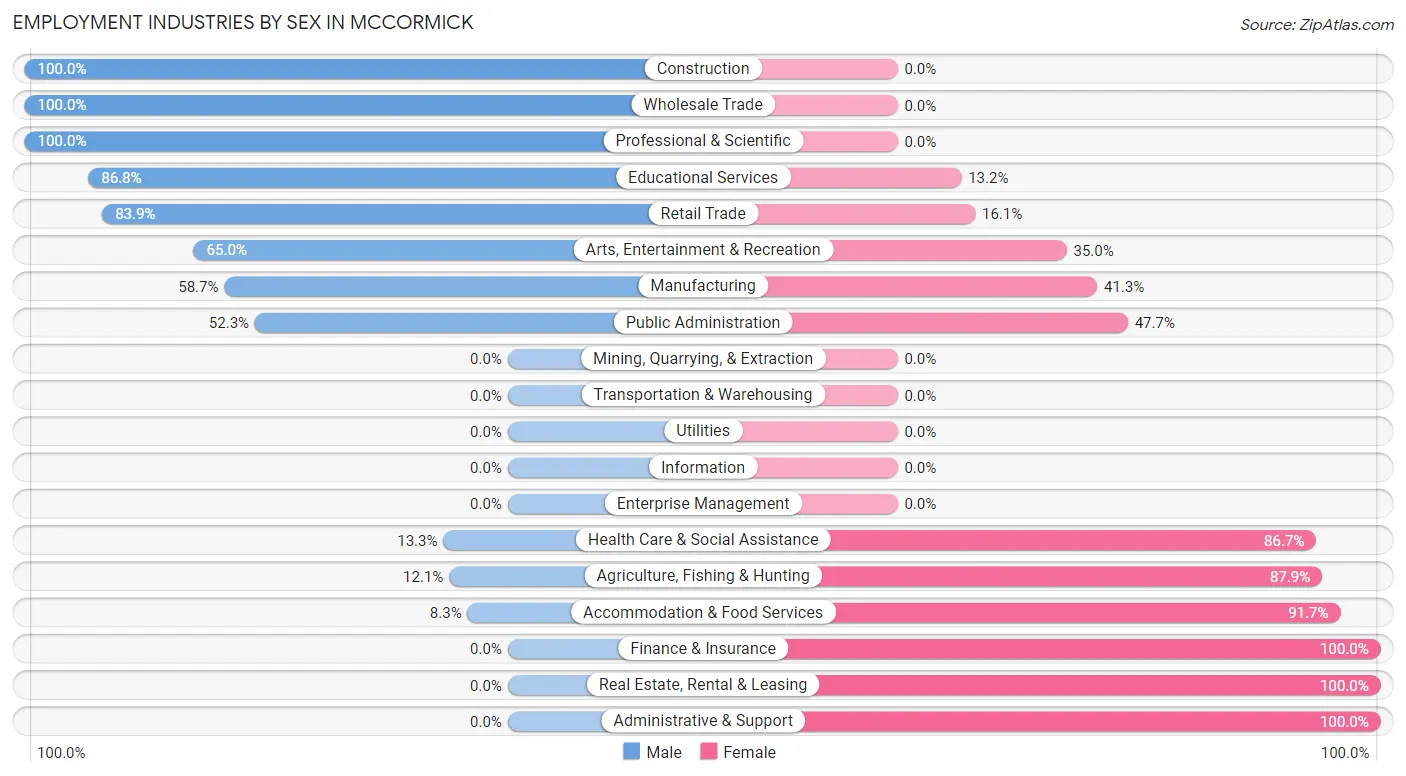
Employment Industries by Sex in McCormick
The McCormick industries that see more men than women are Construction (100.0%), Wholesale Trade (100.0%), and Professional & Scientific (100.0%), whereas the industries that tend to have a higher number of women are Finance & Insurance (100.0%), Real Estate, Rental & Leasing (100.0%), and Administrative & Support (100.0%).
| Industry | Male | Female |
| Agriculture, Fishing & Hunting | 4 (12.1%) | 29 (87.9%) |
| Mining, Quarrying, & Extraction | 0 (0.0%) | 0 (0.0%) |
| Construction | 36 (100.0%) | 0 (0.0%) |
| Manufacturing | 44 (58.7%) | 31 (41.3%) |
| Wholesale Trade | 21 (100.0%) | 0 (0.0%) |
| Retail Trade | 47 (83.9%) | 9 (16.1%) |
| Transportation & Warehousing | 0 (0.0%) | 0 (0.0%) |
| Utilities | 0 (0.0%) | 0 (0.0%) |
| Information | 0 (0.0%) | 0 (0.0%) |
| Finance & Insurance | 0 (0.0%) | 14 (100.0%) |
| Real Estate, Rental & Leasing | 0 (0.0%) | 4 (100.0%) |
| Professional & Scientific | 9 (100.0%) | 0 (0.0%) |
| Enterprise Management | 0 (0.0%) | 0 (0.0%) |
| Administrative & Support | 0 (0.0%) | 17 (100.0%) |
| Educational Services | 46 (86.8%) | 7 (13.2%) |
| Health Care & Social Assistance | 14 (13.3%) | 91 (86.7%) |
| Arts, Entertainment & Recreation | 26 (65.0%) | 14 (35.0%) |
| Accommodation & Food Services | 3 (8.3%) | 33 (91.7%) |
| Public Administration | 45 (52.3%) | 41 (47.7%) |
| Total | 298 (50.0%) | 298 (50.0%) |
Education in McCormick
School Enrollment in McCormick
The most common levels of schooling among the 492 students in McCormick are high school (150 | 30.5%), college / undergraduate (121 | 24.6%), and elementary school (110 | 22.4%).
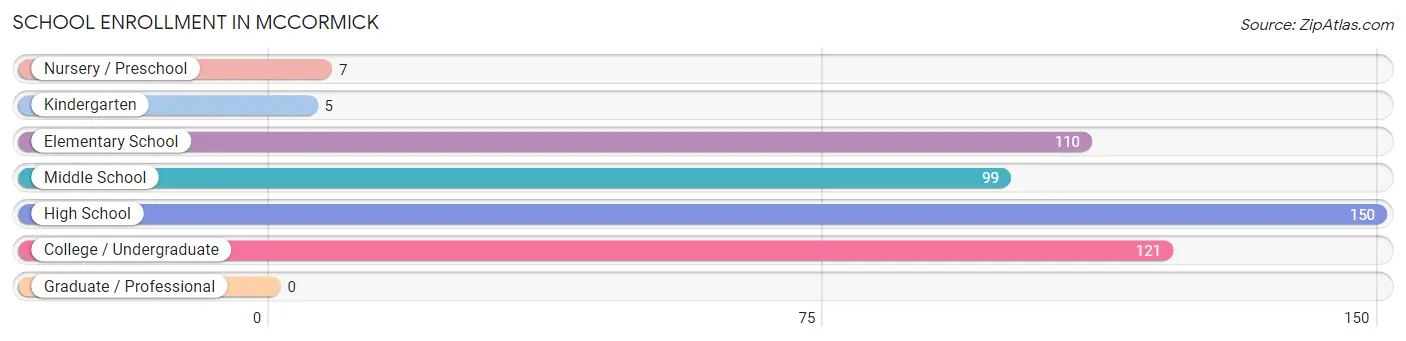
| School Level | # Students | % Students |
| Nursery / Preschool | 7 | 1.4% |
| Kindergarten | 5 | 1.0% |
| Elementary School | 110 | 22.4% |
| Middle School | 99 | 20.1% |
| High School | 150 | 30.5% |
| College / Undergraduate | 121 | 24.6% |
| Graduate / Professional | 0 | 0.0% |
| Total | 492 | 100.0% |
School Enrollment by Age by Funding Source in McCormick
Out of a total of 492 students who are enrolled in schools in McCormick, 97 (19.7%) attend a private institution, while the remaining 395 (80.3%) are enrolled in public schools. The age group of 25 to 34 year olds has the highest likelihood of being enrolled in private schools, with 5 (100.0% in the age bracket) enrolled. Conversely, the age group of 3 to 4 year olds has the lowest likelihood of being enrolled in a private school, with 7 (100.0% in the age bracket) attending a public institution.
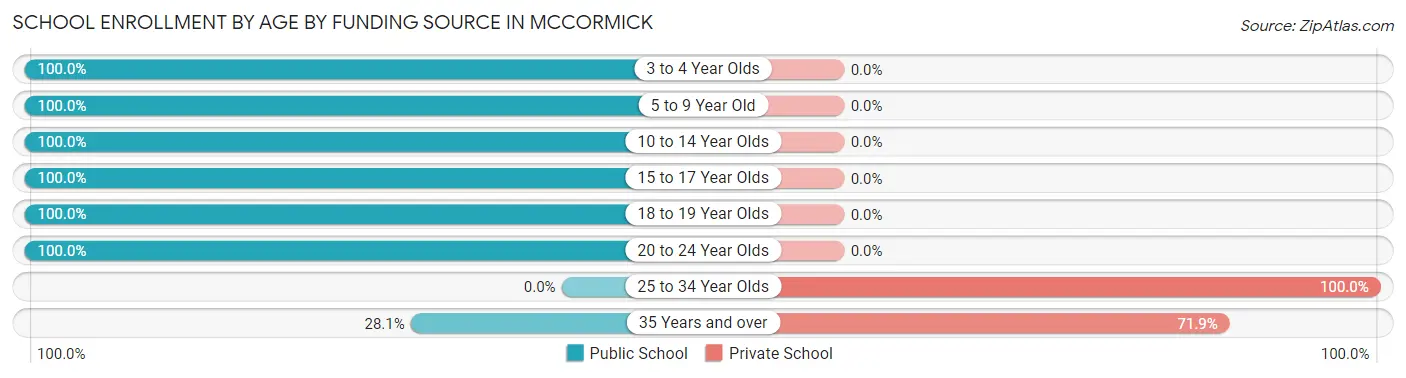
| Age Bracket | Public School | Private School |
| 3 to 4 Year Olds | 7 (100.0%) | 0 (0.0%) |
| 5 to 9 Year Old | 110 (100.0%) | 0 (0.0%) |
| 10 to 14 Year Olds | 120 (100.0%) | 0 (0.0%) |
| 15 to 17 Year Olds | 81 (100.0%) | 0 (0.0%) |
| 18 to 19 Year Olds | 24 (100.0%) | 0 (0.0%) |
| 20 to 24 Year Olds | 17 (100.0%) | 0 (0.0%) |
| 25 to 34 Year Olds | 0 (0.0%) | 5 (100.0%) |
| 35 Years and over | 36 (28.1%) | 92 (71.9%) |
| Total | 395 (80.3%) | 97 (19.7%) |
Educational Attainment by Field of Study in McCormick
Visual & performing arts (42 | 17.9%), bio, nature & agricultural (41 | 17.4%), physical & health sciences (41 | 17.4%), computers & mathematics (27 | 11.5%), and education (19 | 8.1%) are the most common fields of study among 235 individuals in McCormick who have obtained a bachelor's degree or higher.
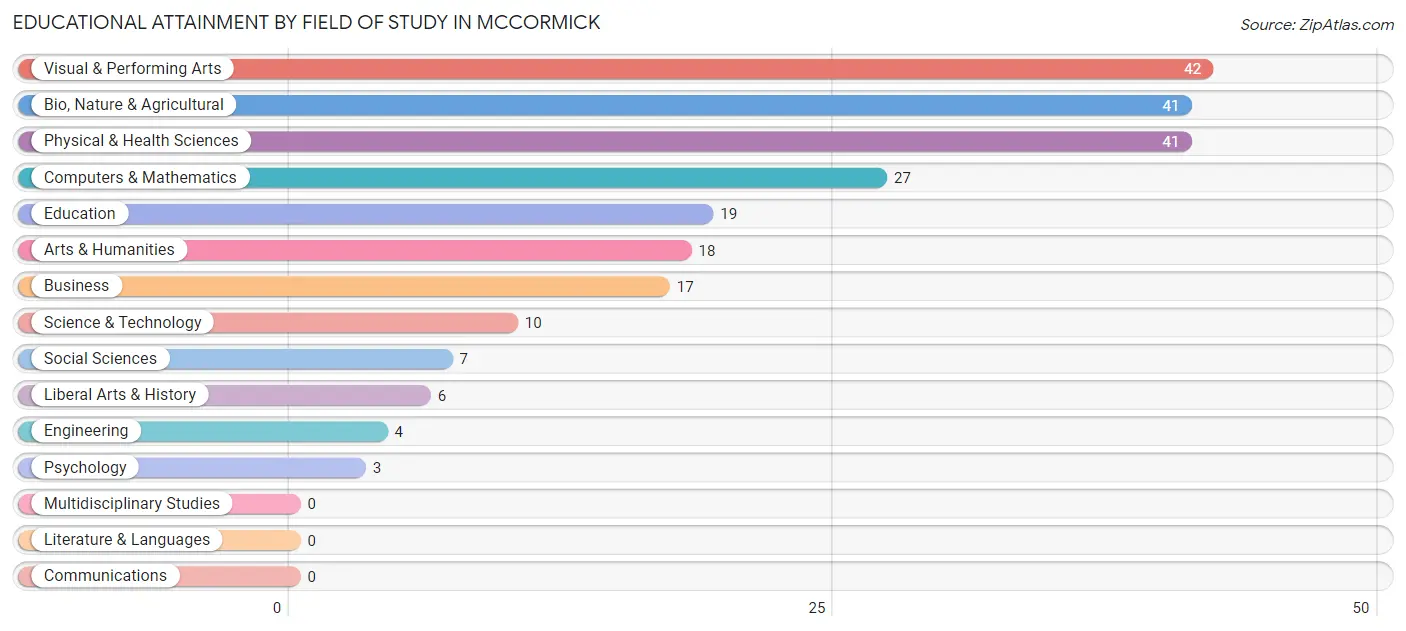
| Field of Study | # Graduates | % Graduates |
| Computers & Mathematics | 27 | 11.5% |
| Bio, Nature & Agricultural | 41 | 17.4% |
| Physical & Health Sciences | 41 | 17.4% |
| Psychology | 3 | 1.3% |
| Social Sciences | 7 | 3.0% |
| Engineering | 4 | 1.7% |
| Multidisciplinary Studies | 0 | 0.0% |
| Science & Technology | 10 | 4.3% |
| Business | 17 | 7.2% |
| Education | 19 | 8.1% |
| Literature & Languages | 0 | 0.0% |
| Liberal Arts & History | 6 | 2.5% |
| Visual & Performing Arts | 42 | 17.9% |
| Communications | 0 | 0.0% |
| Arts & Humanities | 18 | 7.7% |
| Total | 235 | 100.0% |
Transportation & Commute in McCormick
Vehicle Availability by Sex in McCormick
The most prevalent vehicle ownership categories in McCormick are males with 1 vehicle (117, accounting for 39.3%) and females with 1 vehicle (137, making up 39.3%).
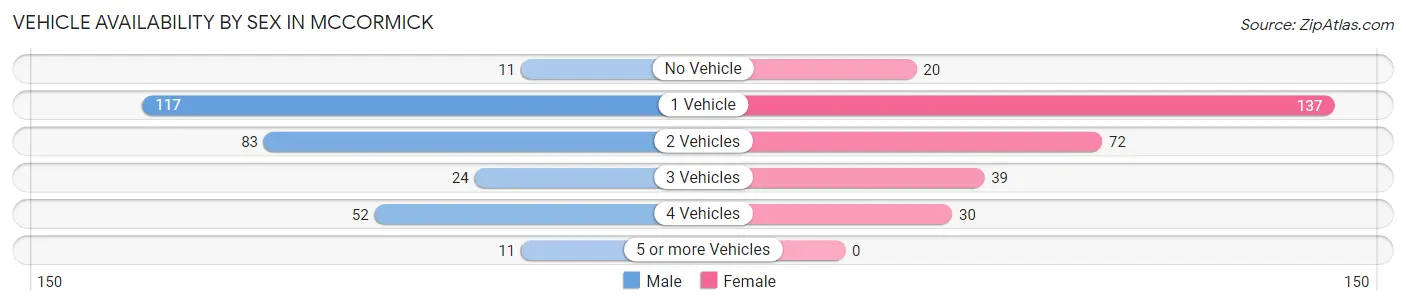
| Vehicles Available | Male | Female |
| No Vehicle | 11 (3.7%) | 20 (6.7%) |
| 1 Vehicle | 117 (39.3%) | 137 (46.0%) |
| 2 Vehicles | 83 (27.9%) | 72 (24.2%) |
| 3 Vehicles | 24 (8.1%) | 39 (13.1%) |
| 4 Vehicles | 52 (17.4%) | 30 (10.1%) |
| 5 or more Vehicles | 11 (3.7%) | 0 (0.0%) |
| Total | 298 (100.0%) | 298 (100.0%) |
Commute Time in McCormick
The most frequently occuring commute durations in McCormick are 5 to 9 minutes (136 commuters, 23.3%), 10 to 14 minutes (59 commuters, 10.1%), and 30 to 34 minutes (56 commuters, 9.6%).
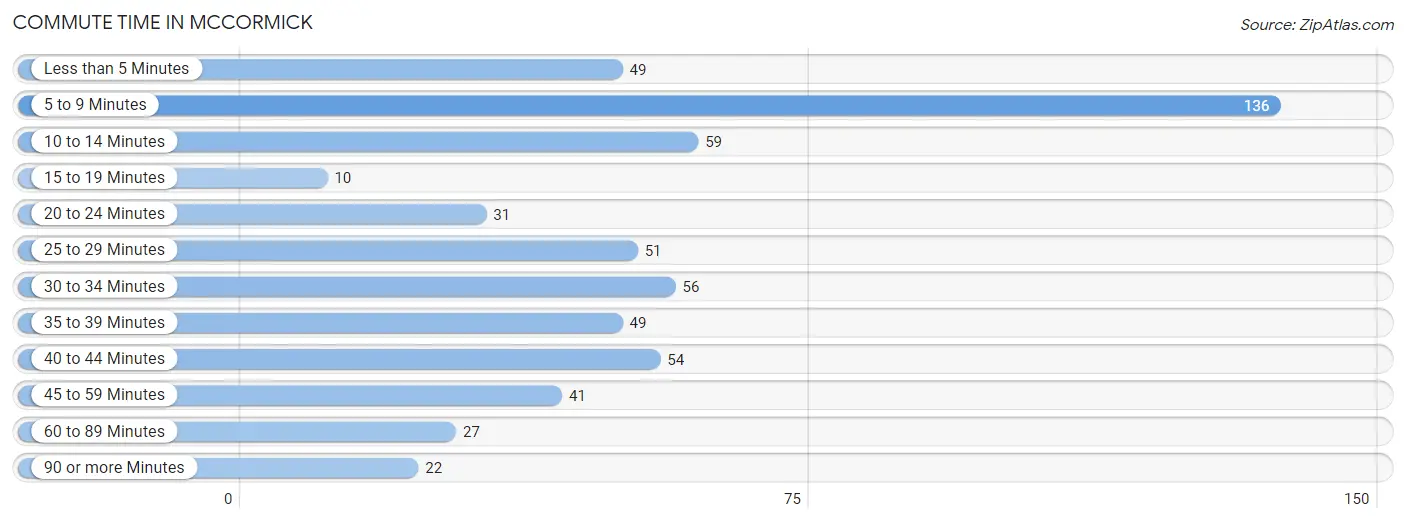
| Commute Time | # Commuters | % Commuters |
| Less than 5 Minutes | 49 | 8.4% |
| 5 to 9 Minutes | 136 | 23.3% |
| 10 to 14 Minutes | 59 | 10.1% |
| 15 to 19 Minutes | 10 | 1.7% |
| 20 to 24 Minutes | 31 | 5.3% |
| 25 to 29 Minutes | 51 | 8.7% |
| 30 to 34 Minutes | 56 | 9.6% |
| 35 to 39 Minutes | 49 | 8.4% |
| 40 to 44 Minutes | 54 | 9.2% |
| 45 to 59 Minutes | 41 | 7.0% |
| 60 to 89 Minutes | 27 | 4.6% |
| 90 or more Minutes | 22 | 3.8% |
Commute Time by Sex in McCormick
The most common commute times in McCormick are 5 to 9 minutes (50 commuters, 17.1%) for males and 5 to 9 minutes (86 commuters, 29.4%) for females.
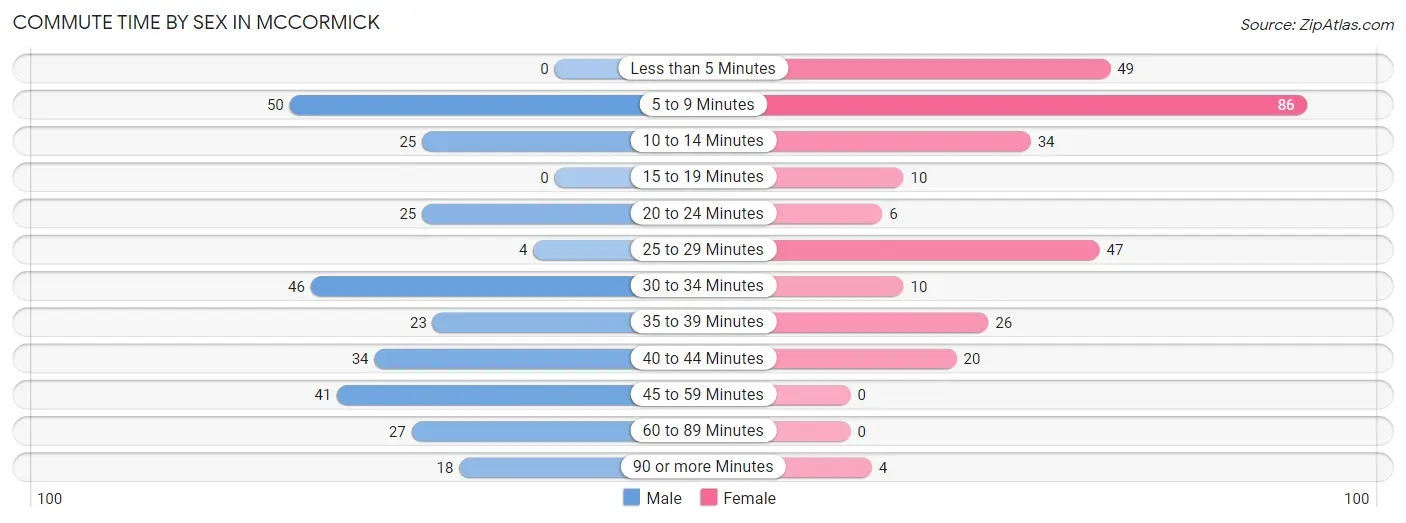
| Commute Time | Male | Female |
| Less than 5 Minutes | 0 (0.0%) | 49 (16.8%) |
| 5 to 9 Minutes | 50 (17.1%) | 86 (29.4%) |
| 10 to 14 Minutes | 25 (8.5%) | 34 (11.6%) |
| 15 to 19 Minutes | 0 (0.0%) | 10 (3.4%) |
| 20 to 24 Minutes | 25 (8.5%) | 6 (2.1%) |
| 25 to 29 Minutes | 4 (1.4%) | 47 (16.1%) |
| 30 to 34 Minutes | 46 (15.7%) | 10 (3.4%) |
| 35 to 39 Minutes | 23 (7.9%) | 26 (8.9%) |
| 40 to 44 Minutes | 34 (11.6%) | 20 (6.9%) |
| 45 to 59 Minutes | 41 (14.0%) | 0 (0.0%) |
| 60 to 89 Minutes | 27 (9.2%) | 0 (0.0%) |
| 90 or more Minutes | 18 (6.1%) | 4 (1.4%) |
Time of Departure to Work by Sex in McCormick
The most frequent times of departure to work in McCormick are 7:00 AM to 7:29 AM (85, 29.0%) for males and 7:30 AM to 7:59 AM (94, 32.2%) for females.
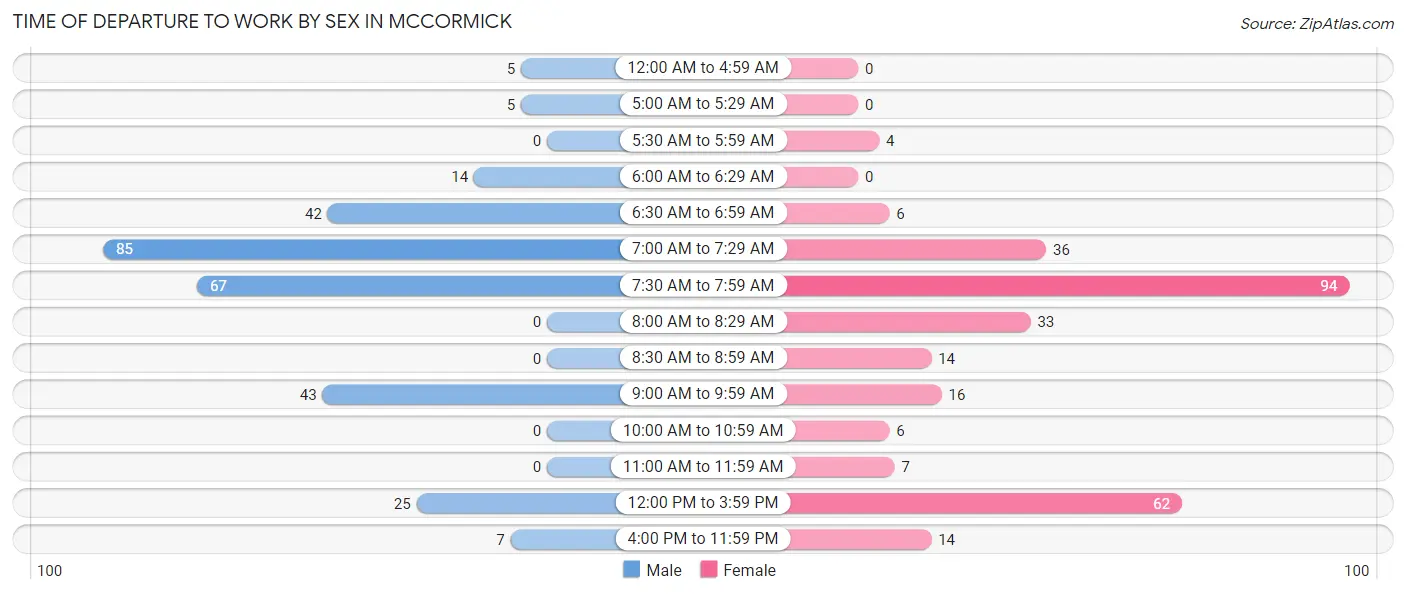
| Time of Departure | Male | Female |
| 12:00 AM to 4:59 AM | 5 (1.7%) | 0 (0.0%) |
| 5:00 AM to 5:29 AM | 5 (1.7%) | 0 (0.0%) |
| 5:30 AM to 5:59 AM | 0 (0.0%) | 4 (1.4%) |
| 6:00 AM to 6:29 AM | 14 (4.8%) | 0 (0.0%) |
| 6:30 AM to 6:59 AM | 42 (14.3%) | 6 (2.1%) |
| 7:00 AM to 7:29 AM | 85 (29.0%) | 36 (12.3%) |
| 7:30 AM to 7:59 AM | 67 (22.9%) | 94 (32.2%) |
| 8:00 AM to 8:29 AM | 0 (0.0%) | 33 (11.3%) |
| 8:30 AM to 8:59 AM | 0 (0.0%) | 14 (4.8%) |
| 9:00 AM to 9:59 AM | 43 (14.7%) | 16 (5.5%) |
| 10:00 AM to 10:59 AM | 0 (0.0%) | 6 (2.1%) |
| 11:00 AM to 11:59 AM | 0 (0.0%) | 7 (2.4%) |
| 12:00 PM to 3:59 PM | 25 (8.5%) | 62 (21.2%) |
| 4:00 PM to 11:59 PM | 7 (2.4%) | 14 (4.8%) |
| Total | 293 (100.0%) | 292 (100.0%) |
Housing Occupancy in McCormick
Occupancy by Ownership in McCormick
Of the total 772 dwellings in McCormick, owner-occupied units account for 392 (50.8%), while renter-occupied units make up 380 (49.2%).
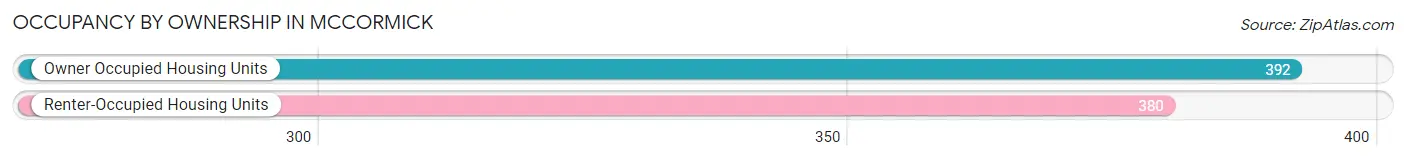
| Occupancy | # Housing Units | % Housing Units |
| Owner Occupied Housing Units | 392 | 50.8% |
| Renter-Occupied Housing Units | 380 | 49.2% |
| Total Occupied Housing Units | 772 | 100.0% |
Occupancy by Household Size in McCormick
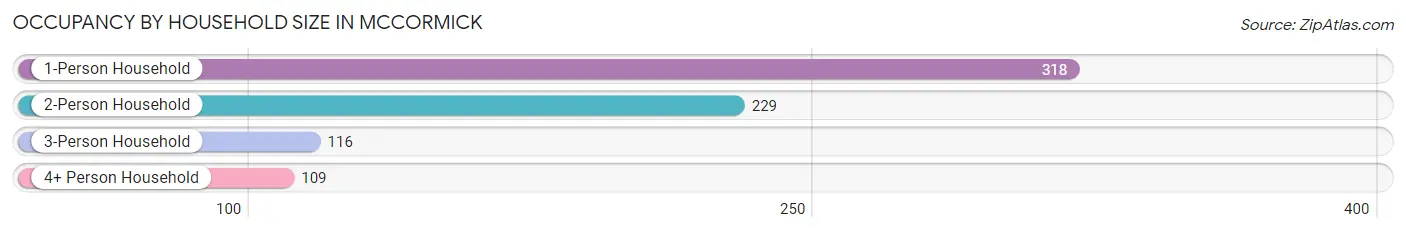
| Household Size | # Housing Units | % Housing Units |
| 1-Person Household | 318 | 41.2% |
| 2-Person Household | 229 | 29.7% |
| 3-Person Household | 116 | 15.0% |
| 4+ Person Household | 109 | 14.1% |
| Total Housing Units | 772 | 100.0% |
Occupancy by Ownership by Household Size in McCormick
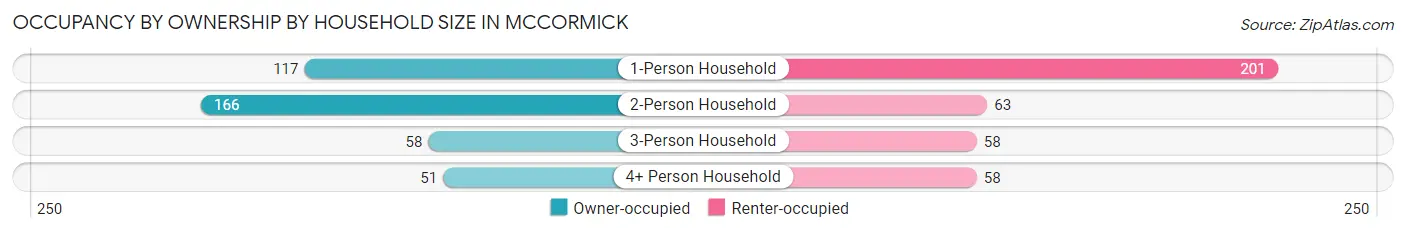
| Household Size | Owner-occupied | Renter-occupied |
| 1-Person Household | 117 (36.8%) | 201 (63.2%) |
| 2-Person Household | 166 (72.5%) | 63 (27.5%) |
| 3-Person Household | 58 (50.0%) | 58 (50.0%) |
| 4+ Person Household | 51 (46.8%) | 58 (53.2%) |
| Total Housing Units | 392 (50.8%) | 380 (49.2%) |
Occupancy by Educational Attainment in McCormick
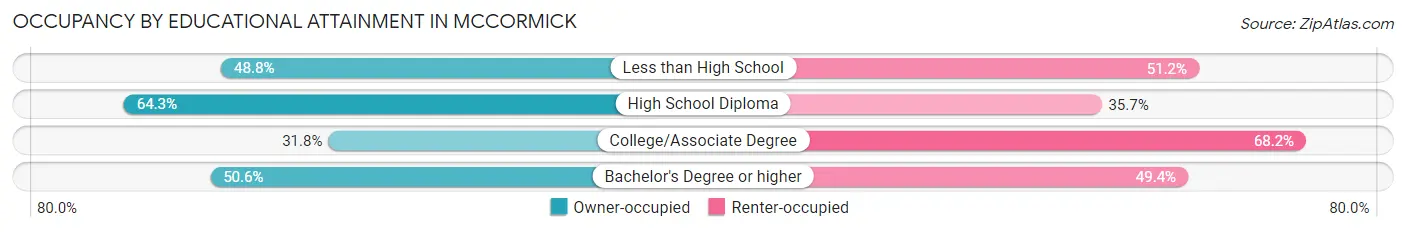
| Household Size | Owner-occupied | Renter-occupied |
| Less than High School | 62 (48.8%) | 65 (51.2%) |
| High School Diploma | 214 (64.3%) | 119 (35.7%) |
| College/Associate Degree | 71 (31.8%) | 152 (68.2%) |
| Bachelor's Degree or higher | 45 (50.6%) | 44 (49.4%) |
Occupancy by Age of Householder in McCormick
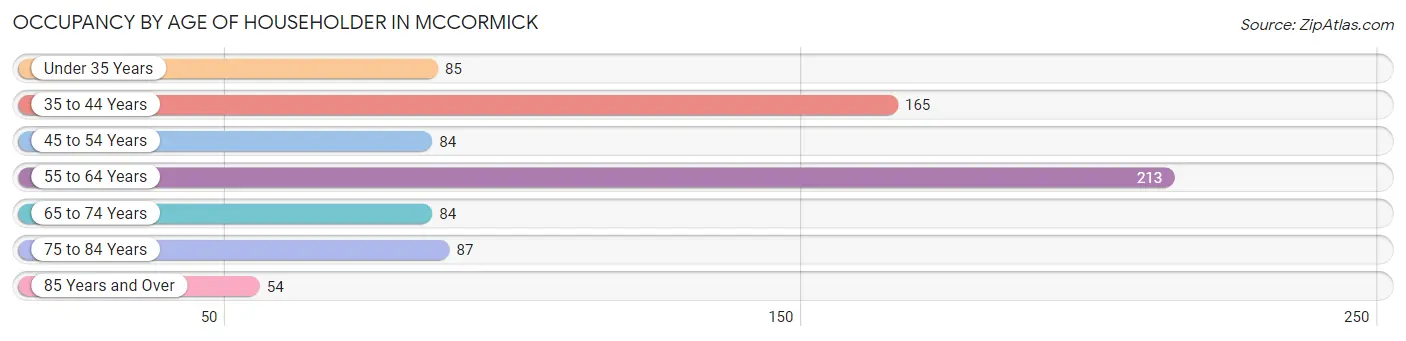
| Age Bracket | # Households | % Households |
| Under 35 Years | 85 | 11.0% |
| 35 to 44 Years | 165 | 21.4% |
| 45 to 54 Years | 84 | 10.9% |
| 55 to 64 Years | 213 | 27.6% |
| 65 to 74 Years | 84 | 10.9% |
| 75 to 84 Years | 87 | 11.3% |
| 85 Years and Over | 54 | 7.0% |
| Total | 772 | 100.0% |
Housing Finances in McCormick
Median Income by Occupancy in McCormick
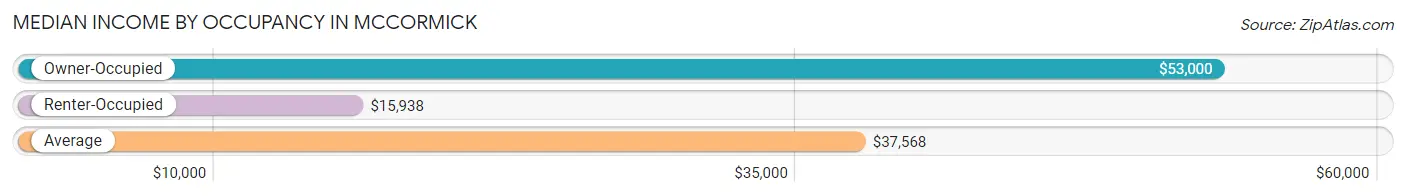
| Occupancy Type | # Households | Median Income |
| Owner-Occupied | 392 (50.8%) | $53,000 |
| Renter-Occupied | 380 (49.2%) | $15,938 |
| Average | 772 (100.0%) | $37,568 |
Occupancy by Householder Income Bracket in McCormick
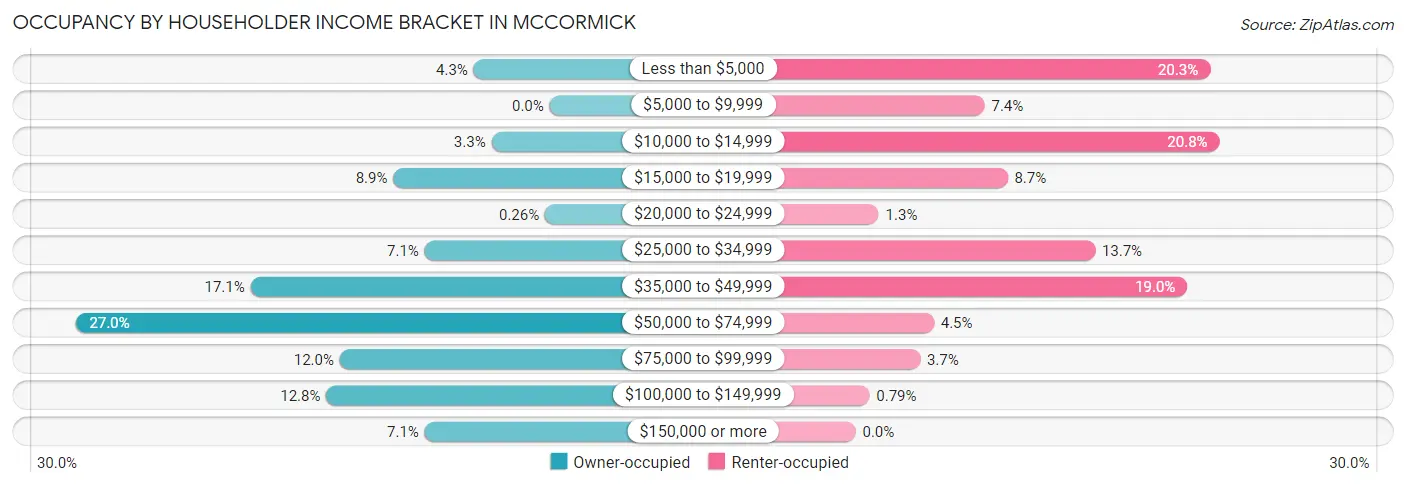
| Income Bracket | Owner-occupied | Renter-occupied |
| Less than $5,000 | 17 (4.3%) | 77 (20.3%) |
| $5,000 to $9,999 | 0 (0.0%) | 28 (7.4%) |
| $10,000 to $14,999 | 13 (3.3%) | 79 (20.8%) |
| $15,000 to $19,999 | 35 (8.9%) | 33 (8.7%) |
| $20,000 to $24,999 | 1 (0.3%) | 5 (1.3%) |
| $25,000 to $34,999 | 28 (7.1%) | 52 (13.7%) |
| $35,000 to $49,999 | 67 (17.1%) | 72 (19.0%) |
| $50,000 to $74,999 | 106 (27.0%) | 17 (4.5%) |
| $75,000 to $99,999 | 47 (12.0%) | 14 (3.7%) |
| $100,000 to $149,999 | 50 (12.8%) | 3 (0.8%) |
| $150,000 or more | 28 (7.1%) | 0 (0.0%) |
| Total | 392 (100.0%) | 380 (100.0%) |
Monthly Housing Cost Tiers in McCormick
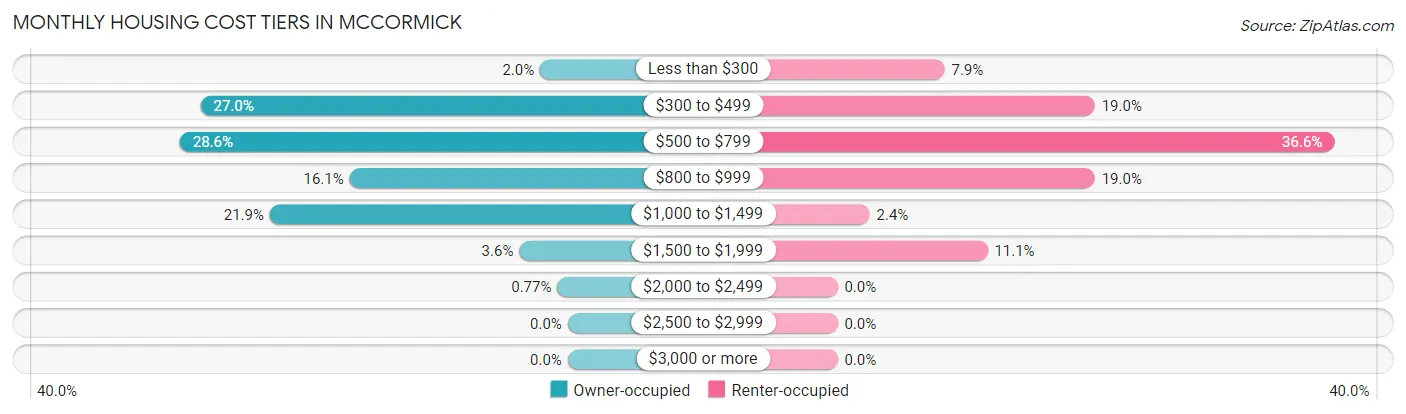
| Monthly Cost | Owner-occupied | Renter-occupied |
| Less than $300 | 8 (2.0%) | 30 (7.9%) |
| $300 to $499 | 106 (27.0%) | 72 (19.0%) |
| $500 to $799 | 112 (28.6%) | 139 (36.6%) |
| $800 to $999 | 63 (16.1%) | 72 (19.0%) |
| $1,000 to $1,499 | 86 (21.9%) | 9 (2.4%) |
| $1,500 to $1,999 | 14 (3.6%) | 42 (11.1%) |
| $2,000 to $2,499 | 3 (0.8%) | 0 (0.0%) |
| $2,500 to $2,999 | 0 (0.0%) | 0 (0.0%) |
| $3,000 or more | 0 (0.0%) | 0 (0.0%) |
| Total | 392 (100.0%) | 380 (100.0%) |
Physical Housing Characteristics in McCormick
Housing Structures in McCormick
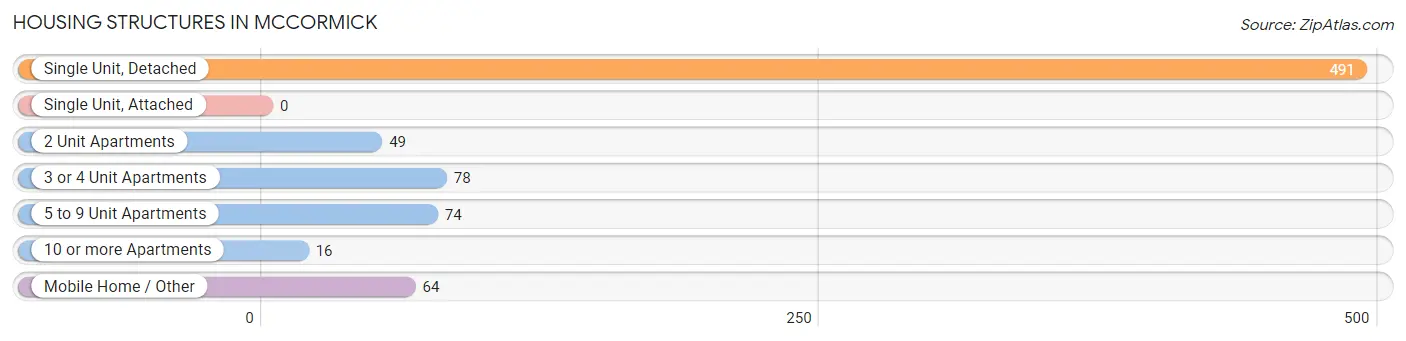
| Structure Type | # Housing Units | % Housing Units |
| Single Unit, Detached | 491 | 63.6% |
| Single Unit, Attached | 0 | 0.0% |
| 2 Unit Apartments | 49 | 6.4% |
| 3 or 4 Unit Apartments | 78 | 10.1% |
| 5 to 9 Unit Apartments | 74 | 9.6% |
| 10 or more Apartments | 16 | 2.1% |
| Mobile Home / Other | 64 | 8.3% |
| Total | 772 | 100.0% |
Housing Structures by Occupancy in McCormick
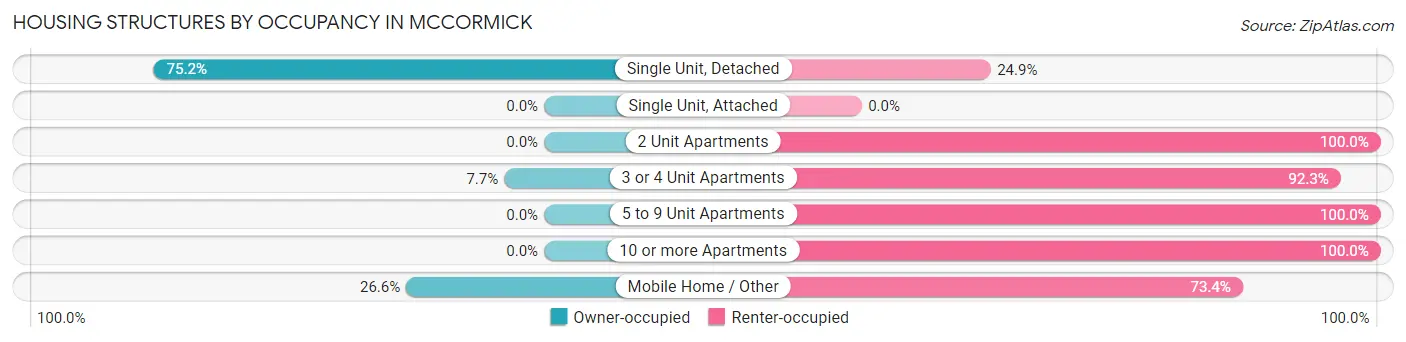
| Structure Type | Owner-occupied | Renter-occupied |
| Single Unit, Detached | 369 (75.1%) | 122 (24.8%) |
| Single Unit, Attached | 0 (0.0%) | 0 (0.0%) |
| 2 Unit Apartments | 0 (0.0%) | 49 (100.0%) |
| 3 or 4 Unit Apartments | 6 (7.7%) | 72 (92.3%) |
| 5 to 9 Unit Apartments | 0 (0.0%) | 74 (100.0%) |
| 10 or more Apartments | 0 (0.0%) | 16 (100.0%) |
| Mobile Home / Other | 17 (26.6%) | 47 (73.4%) |
| Total | 392 (50.8%) | 380 (49.2%) |
Housing Structures by Number of Rooms in McCormick
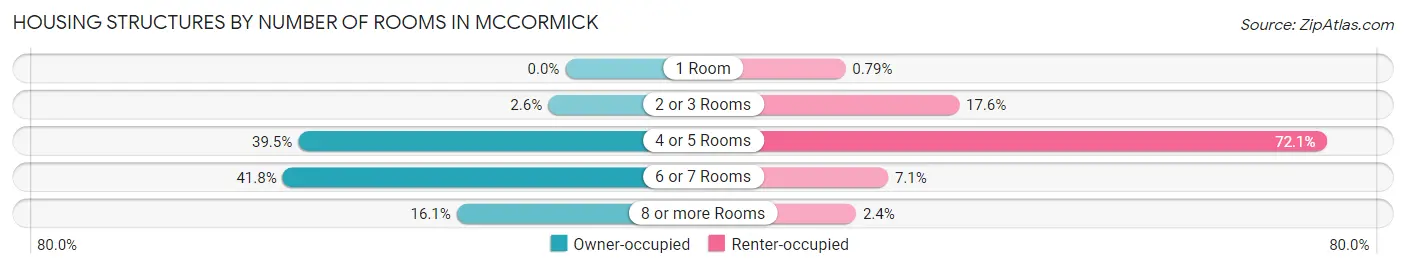
| Number of Rooms | Owner-occupied | Renter-occupied |
| 1 Room | 0 (0.0%) | 3 (0.8%) |
| 2 or 3 Rooms | 10 (2.5%) | 67 (17.6%) |
| 4 or 5 Rooms | 155 (39.5%) | 274 (72.1%) |
| 6 or 7 Rooms | 164 (41.8%) | 27 (7.1%) |
| 8 or more Rooms | 63 (16.1%) | 9 (2.4%) |
| Total | 392 (100.0%) | 380 (100.0%) |
Housing Structure by Heating Type in McCormick
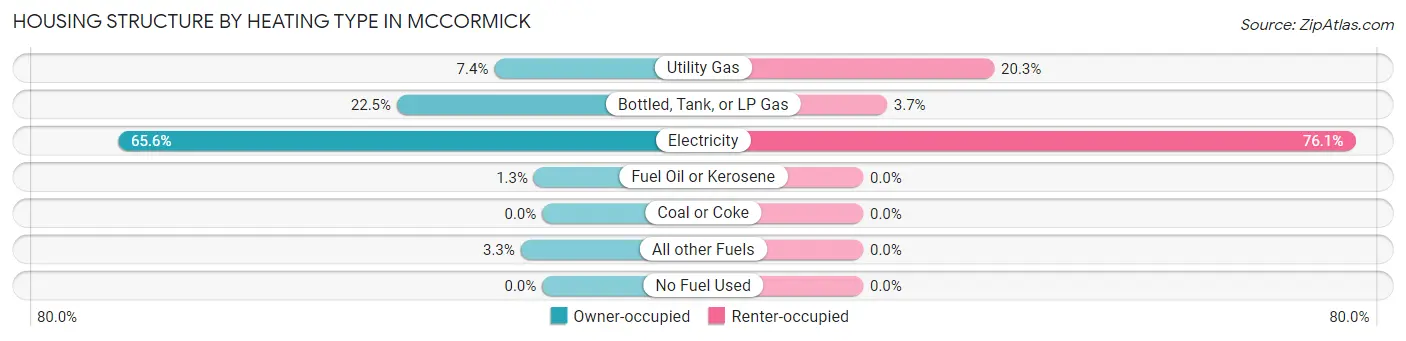
| Heating Type | Owner-occupied | Renter-occupied |
| Utility Gas | 29 (7.4%) | 77 (20.3%) |
| Bottled, Tank, or LP Gas | 88 (22.5%) | 14 (3.7%) |
| Electricity | 257 (65.6%) | 289 (76.0%) |
| Fuel Oil or Kerosene | 5 (1.3%) | 0 (0.0%) |
| Coal or Coke | 0 (0.0%) | 0 (0.0%) |
| All other Fuels | 13 (3.3%) | 0 (0.0%) |
| No Fuel Used | 0 (0.0%) | 0 (0.0%) |
| Total | 392 (100.0%) | 380 (100.0%) |
Household Vehicle Usage in McCormick
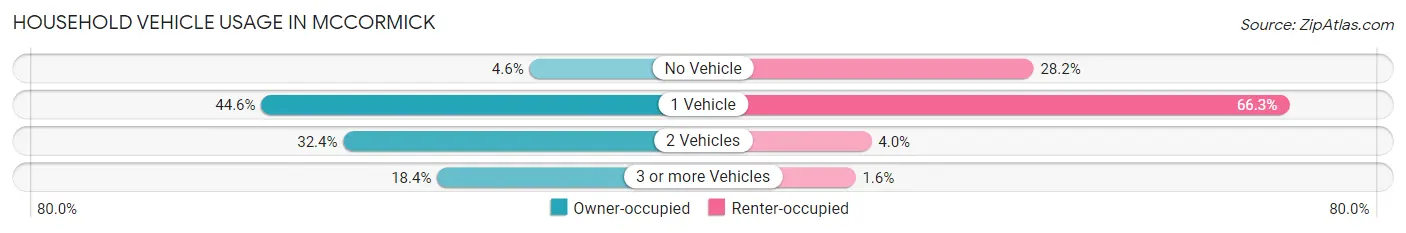
| Vehicles per Household | Owner-occupied | Renter-occupied |
| No Vehicle | 18 (4.6%) | 107 (28.2%) |
| 1 Vehicle | 175 (44.6%) | 252 (66.3%) |
| 2 Vehicles | 127 (32.4%) | 15 (4.0%) |
| 3 or more Vehicles | 72 (18.4%) | 6 (1.6%) |
| Total | 392 (100.0%) | 380 (100.0%) |
Real Estate & Mortgages in McCormick
Real Estate and Mortgage Overview in McCormick
| Characteristic | Without Mortgage | With Mortgage |
| Housing Units | 196 | 196 |
| Median Property Value | $91,300 | $82,600 |
| Median Household Income | $48,667 | $11 |
| Monthly Housing Costs | $461 | $0 |
| Real Estate Taxes | $498 | $1 |
Property Value by Mortgage Status in McCormick
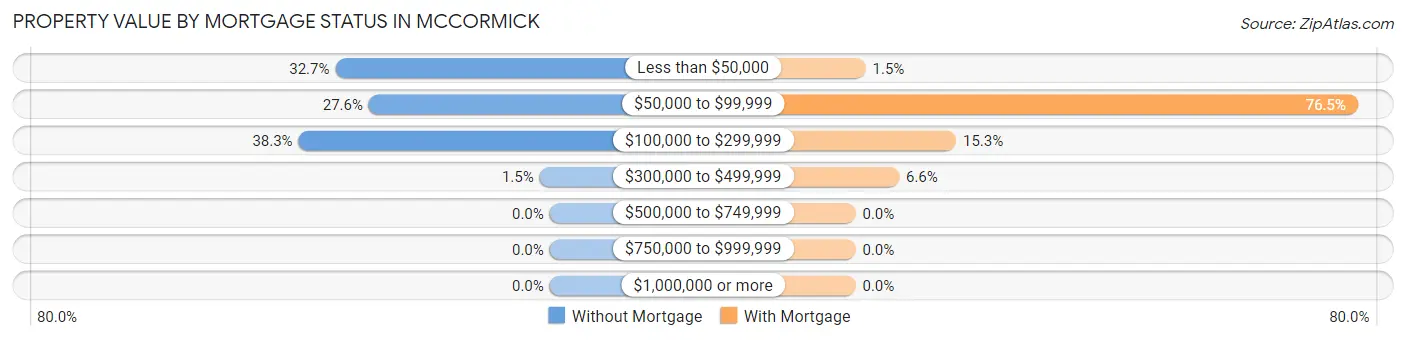
| Property Value | Without Mortgage | With Mortgage |
| Less than $50,000 | 64 (32.7%) | 3 (1.5%) |
| $50,000 to $99,999 | 54 (27.6%) | 150 (76.5%) |
| $100,000 to $299,999 | 75 (38.3%) | 30 (15.3%) |
| $300,000 to $499,999 | 3 (1.5%) | 13 (6.6%) |
| $500,000 to $749,999 | 0 (0.0%) | 0 (0.0%) |
| $750,000 to $999,999 | 0 (0.0%) | 0 (0.0%) |
| $1,000,000 or more | 0 (0.0%) | 0 (0.0%) |
| Total | 196 (100.0%) | 196 (100.0%) |
Household Income by Mortgage Status in McCormick
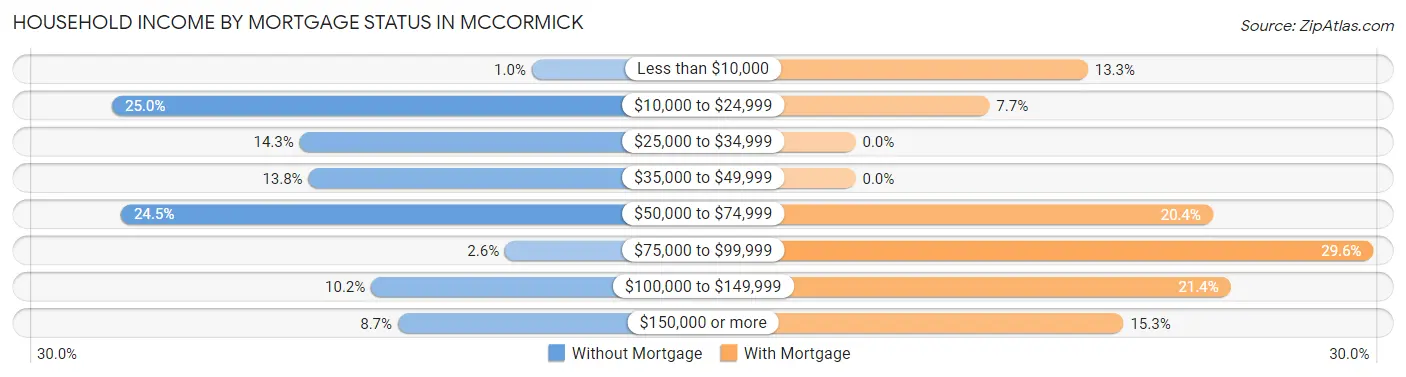
| Household Income | Without Mortgage | With Mortgage |
| Less than $10,000 | 2 (1.0%) | 26 (13.3%) |
| $10,000 to $24,999 | 49 (25.0%) | 15 (7.6%) |
| $25,000 to $34,999 | 28 (14.3%) | 0 (0.0%) |
| $35,000 to $49,999 | 27 (13.8%) | 0 (0.0%) |
| $50,000 to $74,999 | 48 (24.5%) | 40 (20.4%) |
| $75,000 to $99,999 | 5 (2.5%) | 58 (29.6%) |
| $100,000 to $149,999 | 20 (10.2%) | 42 (21.4%) |
| $150,000 or more | 17 (8.7%) | 30 (15.3%) |
| Total | 196 (100.0%) | 196 (100.0%) |
Property Value to Household Income Ratio in McCormick
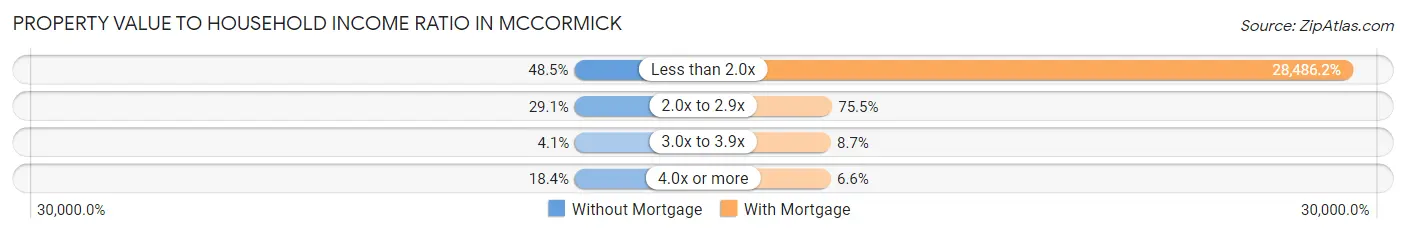
| Value-to-Income Ratio | Without Mortgage | With Mortgage |
| Less than 2.0x | 95 (48.5%) | 55,833 (28,486.2%) |
| 2.0x to 2.9x | 57 (29.1%) | 148 (75.5%) |
| 3.0x to 3.9x | 8 (4.1%) | 17 (8.7%) |
| 4.0x or more | 36 (18.4%) | 13 (6.6%) |
| Total | 196 (100.0%) | 196 (100.0%) |
Real Estate Taxes by Mortgage Status in McCormick
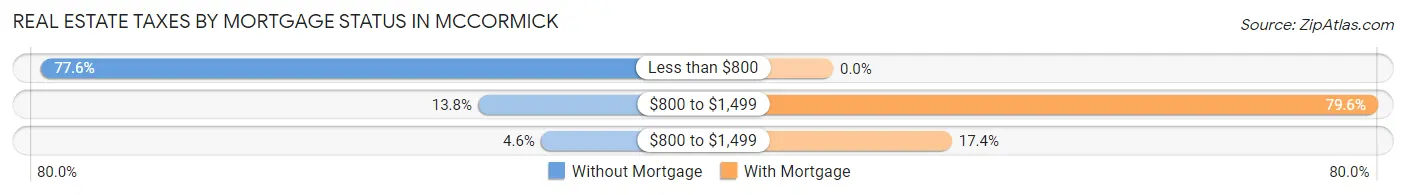
| Property Taxes | Without Mortgage | With Mortgage |
| Less than $800 | 152 (77.5%) | 0 (0.0%) |
| $800 to $1,499 | 27 (13.8%) | 156 (79.6%) |
| $800 to $1,499 | 9 (4.6%) | 34 (17.3%) |
| Total | 196 (100.0%) | 196 (100.0%) |
Health & Disability in McCormick
Health Insurance Coverage by Age in McCormick
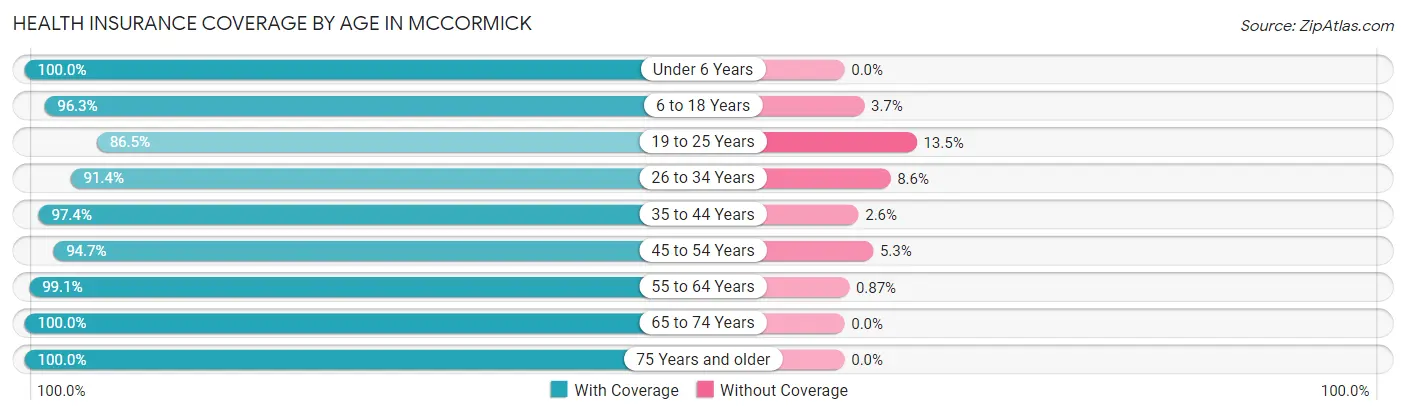
| Age Bracket | With Coverage | Without Coverage |
| Under 6 Years | 143 (100.0%) | 0 (0.0%) |
| 6 to 18 Years | 419 (96.3%) | 16 (3.7%) |
| 19 to 25 Years | 90 (86.5%) | 14 (13.5%) |
| 26 to 34 Years | 96 (91.4%) | 9 (8.6%) |
| 35 to 44 Years | 224 (97.4%) | 6 (2.6%) |
| 45 to 54 Years | 195 (94.7%) | 11 (5.3%) |
| 55 to 64 Years | 340 (99.1%) | 3 (0.9%) |
| 65 to 74 Years | 127 (100.0%) | 0 (0.0%) |
| 75 Years and older | 207 (100.0%) | 0 (0.0%) |
| Total | 1,841 (96.9%) | 59 (3.1%) |
Health Insurance Coverage by Citizenship Status in McCormick
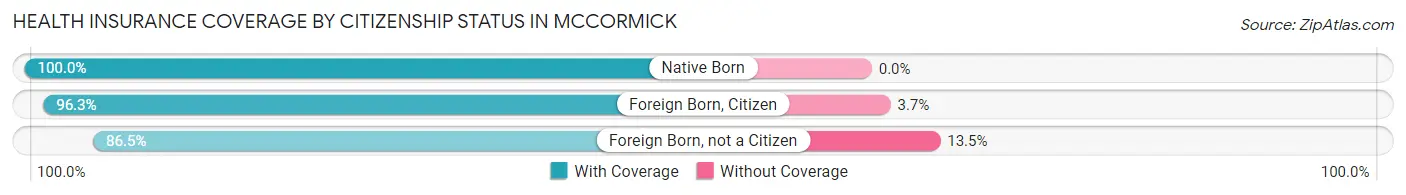
| Citizenship Status | With Coverage | Without Coverage |
| Native Born | 143 (100.0%) | 0 (0.0%) |
| Foreign Born, Citizen | 419 (96.3%) | 16 (3.7%) |
| Foreign Born, not a Citizen | 90 (86.5%) | 14 (13.5%) |
Health Insurance Coverage by Household Income in McCormick
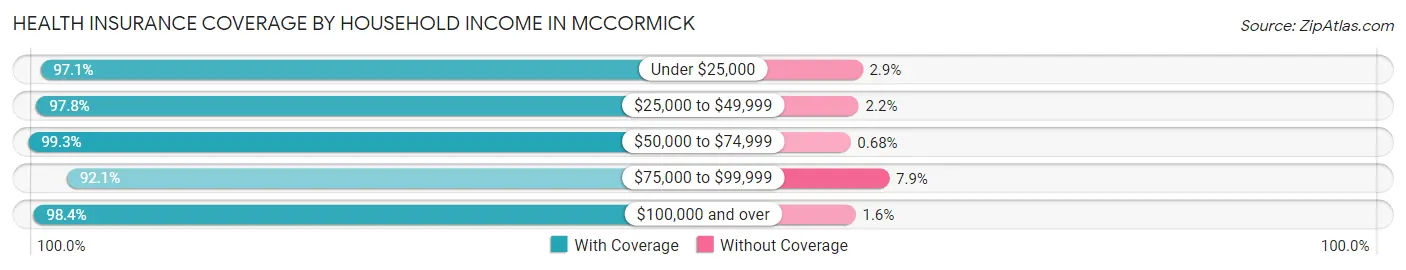
| Household Income | With Coverage | Without Coverage |
| Under $25,000 | 530 (97.1%) | 16 (2.9%) |
| $25,000 to $49,999 | 397 (97.8%) | 9 (2.2%) |
| $50,000 to $74,999 | 291 (99.3%) | 2 (0.7%) |
| $75,000 to $99,999 | 314 (92.1%) | 27 (7.9%) |
| $100,000 and over | 299 (98.4%) | 5 (1.6%) |
Public vs Private Health Insurance Coverage by Age in McCormick
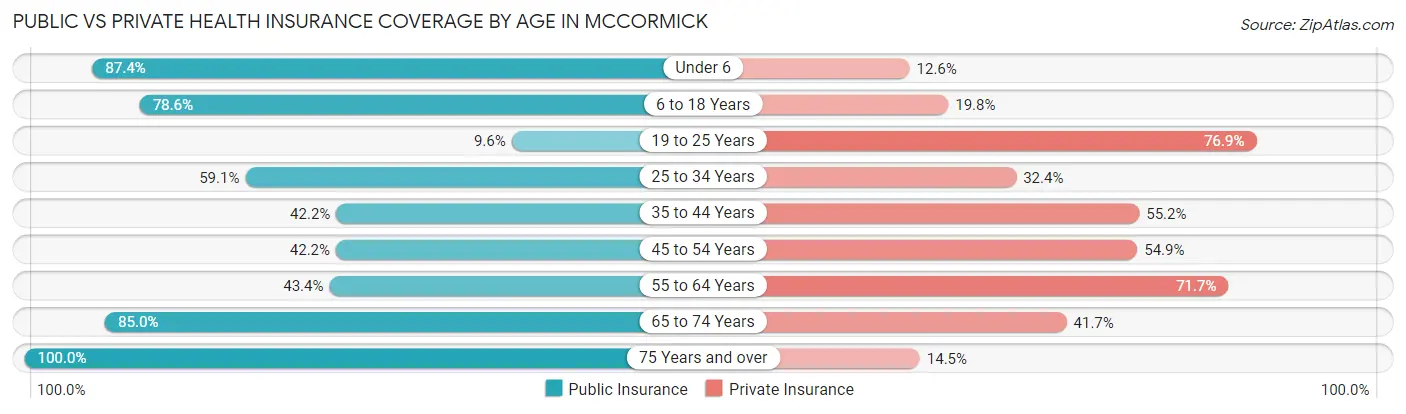
| Age Bracket | Public Insurance | Private Insurance |
| Under 6 | 125 (87.4%) | 18 (12.6%) |
| 6 to 18 Years | 342 (78.6%) | 86 (19.8%) |
| 19 to 25 Years | 10 (9.6%) | 80 (76.9%) |
| 25 to 34 Years | 62 (59.1%) | 34 (32.4%) |
| 35 to 44 Years | 97 (42.2%) | 127 (55.2%) |
| 45 to 54 Years | 87 (42.2%) | 113 (54.8%) |
| 55 to 64 Years | 149 (43.4%) | 246 (71.7%) |
| 65 to 74 Years | 108 (85.0%) | 53 (41.7%) |
| 75 Years and over | 207 (100.0%) | 30 (14.5%) |
| Total | 1,187 (62.5%) | 787 (41.4%) |
Disability Status by Sex by Age in McCormick
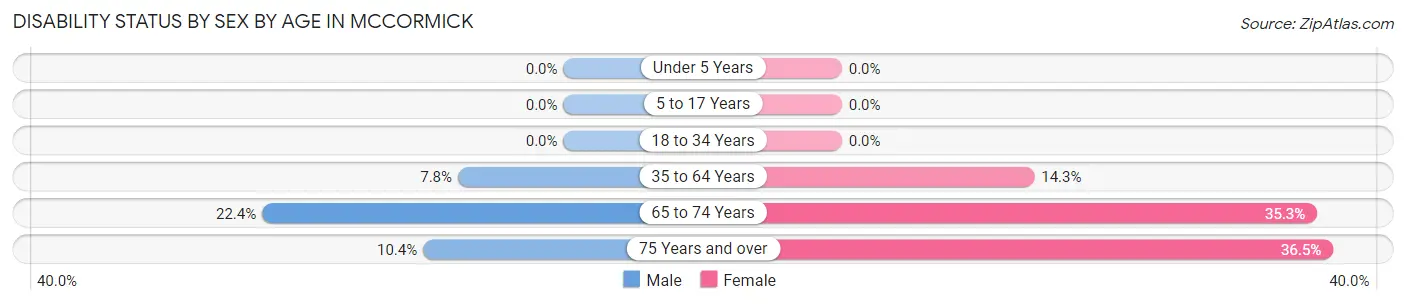
| Age Bracket | Male | Female |
| Under 5 Years | 0 (0.0%) | 0 (0.0%) |
| 5 to 17 Years | 0 (0.0%) | 0 (0.0%) |
| 18 to 34 Years | 0 (0.0%) | 0 (0.0%) |
| 35 to 64 Years | 27 (7.8%) | 62 (14.3%) |
| 65 to 74 Years | 17 (22.4%) | 18 (35.3%) |
| 75 Years and over | 5 (10.4%) | 58 (36.5%) |
Disability Class by Sex by Age in McCormick
Disability Class: Hearing Difficulty
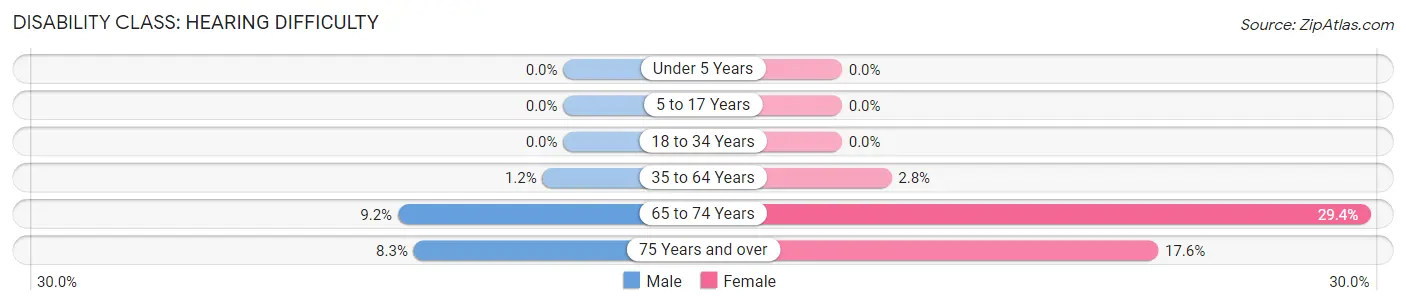
| Age Bracket | Male | Female |
| Under 5 Years | 0 (0.0%) | 0 (0.0%) |
| 5 to 17 Years | 0 (0.0%) | 0 (0.0%) |
| 18 to 34 Years | 0 (0.0%) | 0 (0.0%) |
| 35 to 64 Years | 4 (1.2%) | 12 (2.8%) |
| 65 to 74 Years | 7 (9.2%) | 15 (29.4%) |
| 75 Years and over | 4 (8.3%) | 28 (17.6%) |
Disability Class: Vision Difficulty
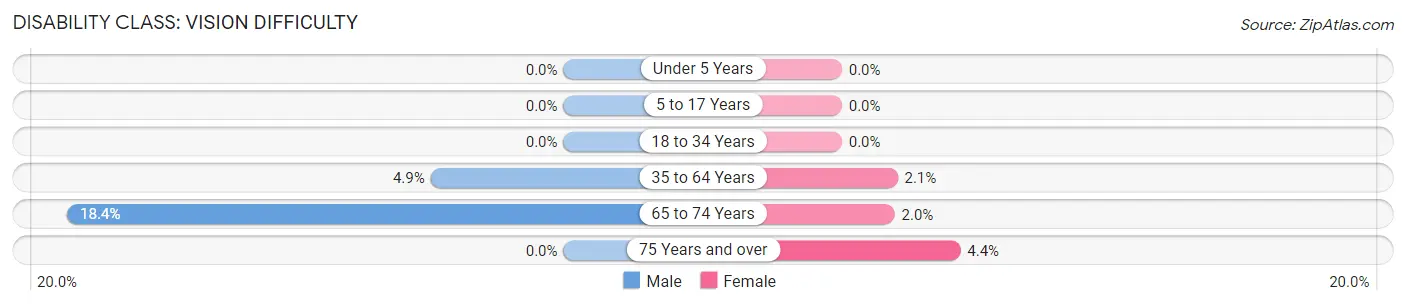
| Age Bracket | Male | Female |
| Under 5 Years | 0 (0.0%) | 0 (0.0%) |
| 5 to 17 Years | 0 (0.0%) | 0 (0.0%) |
| 18 to 34 Years | 0 (0.0%) | 0 (0.0%) |
| 35 to 64 Years | 17 (4.9%) | 9 (2.1%) |
| 65 to 74 Years | 14 (18.4%) | 1 (2.0%) |
| 75 Years and over | 0 (0.0%) | 7 (4.4%) |
Disability Class: Cognitive Difficulty
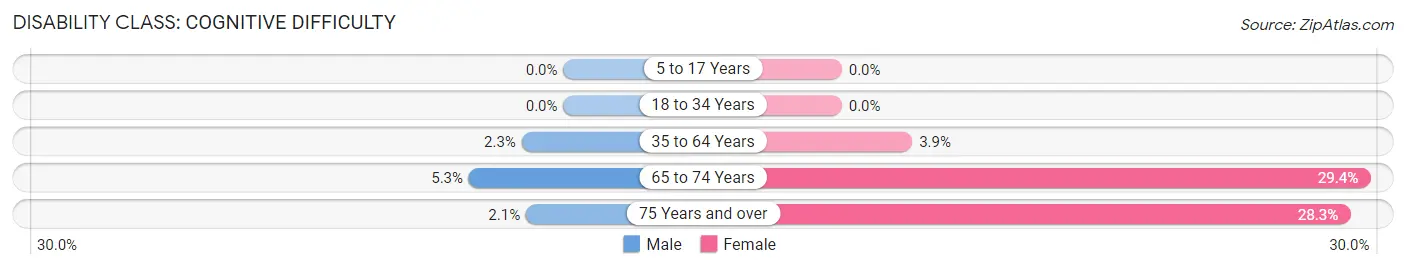
| Age Bracket | Male | Female |
| 5 to 17 Years | 0 (0.0%) | 0 (0.0%) |
| 18 to 34 Years | 0 (0.0%) | 0 (0.0%) |
| 35 to 64 Years | 8 (2.3%) | 17 (3.9%) |
| 65 to 74 Years | 4 (5.3%) | 15 (29.4%) |
| 75 Years and over | 1 (2.1%) | 45 (28.3%) |
Disability Class: Ambulatory Difficulty
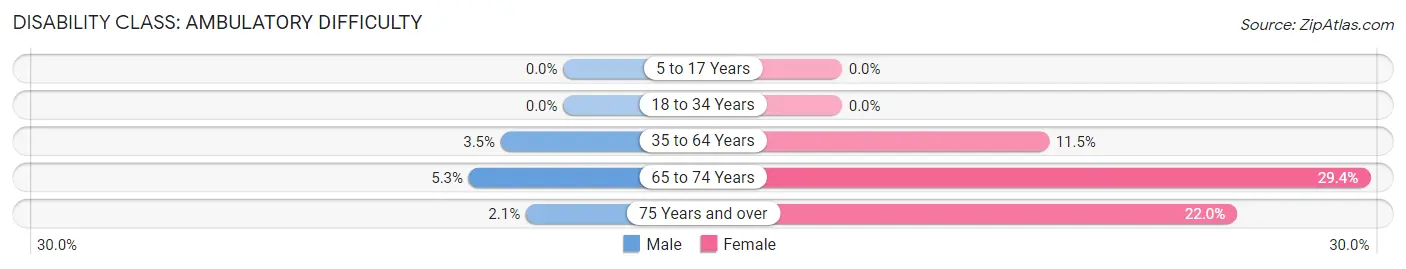
| Age Bracket | Male | Female |
| 5 to 17 Years | 0 (0.0%) | 0 (0.0%) |
| 18 to 34 Years | 0 (0.0%) | 0 (0.0%) |
| 35 to 64 Years | 12 (3.5%) | 50 (11.5%) |
| 65 to 74 Years | 4 (5.3%) | 15 (29.4%) |
| 75 Years and over | 1 (2.1%) | 35 (22.0%) |
Disability Class: Self-Care Difficulty
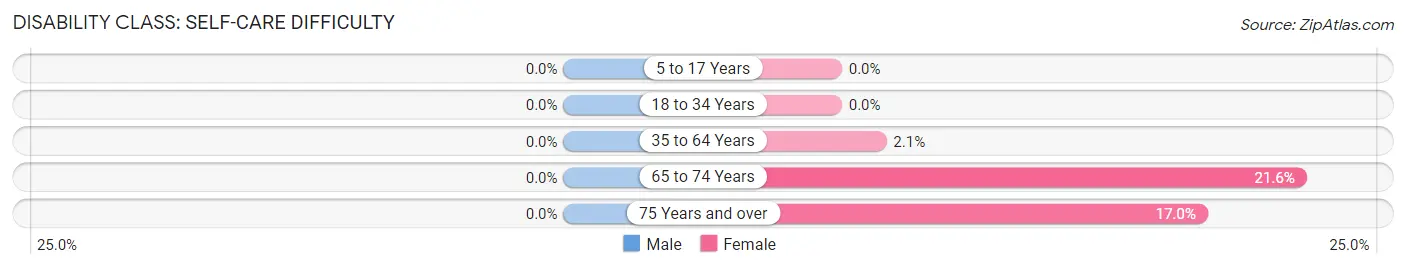
| Age Bracket | Male | Female |
| 5 to 17 Years | 0 (0.0%) | 0 (0.0%) |
| 18 to 34 Years | 0 (0.0%) | 0 (0.0%) |
| 35 to 64 Years | 0 (0.0%) | 9 (2.1%) |
| 65 to 74 Years | 0 (0.0%) | 11 (21.6%) |
| 75 Years and over | 0 (0.0%) | 27 (17.0%) |
Technology Access in McCormick
Computing Device Access in McCormick
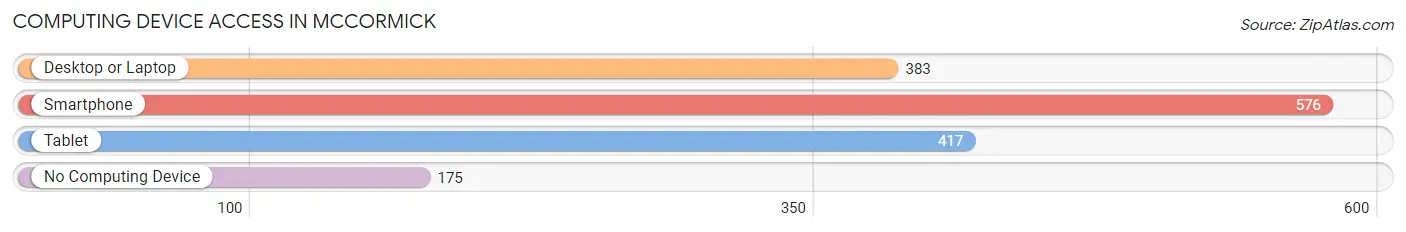
| Device Type | # Households | % Households |
| Desktop or Laptop | 383 | 49.6% |
| Smartphone | 576 | 74.6% |
| Tablet | 417 | 54.0% |
| No Computing Device | 175 | 22.7% |
| Total | 772 | 100.0% |
Internet Access in McCormick
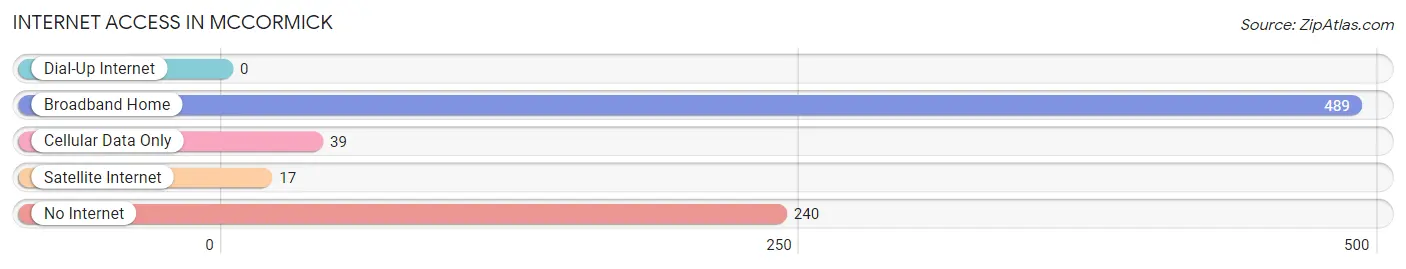
| Internet Type | # Households | % Households |
| Dial-Up Internet | 0 | 0.0% |
| Broadband Home | 489 | 63.3% |
| Cellular Data Only | 39 | 5.1% |
| Satellite Internet | 17 | 2.2% |
| No Internet | 240 | 31.1% |
| Total | 772 | 100.0% |
McCormick Summary
Mccormick is a small town located in McCormick County, South Carolina. It is situated in the foothills of the Blue Ridge Mountains, and is part of the Augusta, Georgia metropolitan area. The town has a population of approximately 2,000 people, and is the county seat of McCormick County.
History
The town of McCormick was founded in 1882 by the McCormick family, who had moved to the area from Virginia. The town was named after the family, and was originally known as “McCormickville”. The town was incorporated in 1883, and the first post office was established in 1884.
The town was originally a farming community, and the main crops grown were cotton, corn, and tobacco. The town also had a sawmill, gristmill, and a cotton gin. In the early 1900s, the town began to grow and develop, and the first bank was established in 1910.
In the 1920s, the town began to experience a period of growth and prosperity. The town was home to several businesses, including a hotel, a movie theater, and a variety of stores. The town also had a hospital, a library, and a school.
In the 1950s, the town began to decline, and many of the businesses closed. The town was also affected by the Great Depression, and many of the residents moved away. In the 1970s, the town began to experience a period of revitalization, and many of the businesses reopened.
Geography
McCormick is located in the foothills of the Blue Ridge Mountains, and is part of the Augusta, Georgia metropolitan area. The town is situated on the banks of the Savannah River, and is surrounded by forests and rolling hills. The town is located approximately 30 miles from Augusta, Georgia, and is approximately 90 miles from Columbia, South Carolina.
The town has a humid subtropical climate, with hot, humid summers and mild winters. The average annual temperature is around 70 degrees Fahrenheit, and the average annual precipitation is around 45 inches.
Economy
The economy of McCormick is largely based on agriculture and tourism. The town is home to several farms, and the main crops grown are cotton, corn, and tobacco. The town also has a number of small businesses, including restaurants, shops, and a variety of services.
The town is also home to several tourist attractions, including the McCormick County Historical Museum, the McCormick County Courthouse, and the McCormick County Library. The town also hosts several festivals and events throughout the year, including the McCormick County Fair and the McCormick County Music Festival.
Demographics
As of the 2010 census, the population of McCormick was 2,068. The racial makeup of the town was 79.3% White, 17.2% African American, 0.3% Native American, 0.7% Asian, 0.1% Pacific Islander, and 2.4% from other races. The median household income was $30,938, and the median family income was $37,813.
The town is home to a variety of religious denominations, including Baptist, Methodist, Presbyterian, and Catholic. The town also has a variety of educational institutions, including McCormick Elementary School, McCormick Middle School, and McCormick High School.
Common Questions
What is Per Capita Income in McCormick?
Per Capita income in McCormick is $15,532.
What is the Median Family Income in McCormick?
Median Family Income in McCormick is $51,875.
What is the Median Household income in McCormick?
Median Household Income in McCormick is $37,568.
What is Income or Wage Gap in McCormick?
Income or Wage Gap in McCormick is 18.7%.
Women in McCormick earn 81.3 cents for every dollar earned by a man.
What is Inequality or Gini Index in McCormick?
Inequality or Gini Index in McCormick is 0.48.
What is the Total Population of McCormick?
Total Population of McCormick is 2,760.
What is the Total Male Population of McCormick?
Total Male Population of McCormick is 1,650.
What is the Total Female Population of McCormick?
Total Female Population of McCormick is 1,110.
What is the Ratio of Males per 100 Females in McCormick?
There are 148.65 Males per 100 Females in McCormick.
What is the Ratio of Females per 100 Males in McCormick?
There are 67.27 Females per 100 Males in McCormick.
What is the Median Population Age in McCormick?
Median Population Age in McCormick is 42.8 Years.
What is the Average Family Size in McCormick
Average Family Size in McCormick is 3.5 People.
What is the Average Household Size in McCormick
Average Household Size in McCormick is 2.5 People.
How Large is the Labor Force in McCormick?
There are 618 People in the Labor Forcein in McCormick.
What is the Percentage of People in the Labor Force in McCormick?
27.5% of People are in the Labor Force in McCormick.
What is the Unemployment Rate in McCormick?
Unemployment Rate in McCormick is 3.6%.