Zip Codes with the Highest Percentage of Population with a Degree in Visual and Performing Arts in West Columbia, SC
RELATED REPORTS & OPTIONS
Visual and Performing Arts
West Columbia
Compare Zip Codes
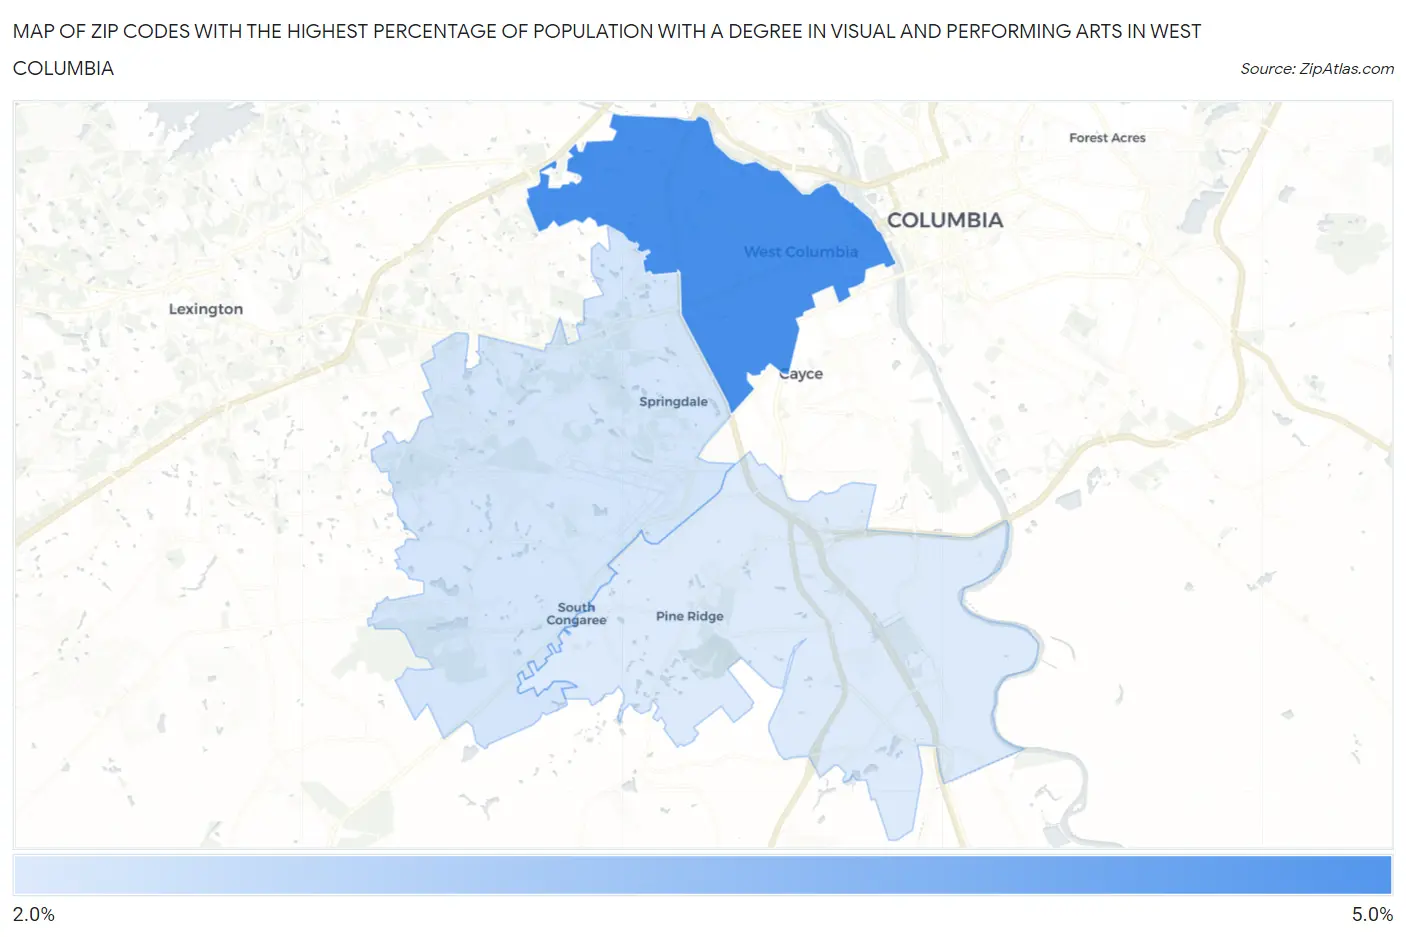
Map of Zip Codes with the Highest Percentage of Population with a Degree in Visual and Performing Arts in West Columbia
2.7%
4.0%
Zip Codes with the Highest Percentage of Population with a Degree in Visual and Performing Arts in West Columbia, SC
| Zip Code | % Graduates | vs State | vs National | |
| 1. | 29169 | 4.0% | 3.3%(+0.783)#78 | 4.3%(-0.206)#9,096 |
| 2. | 29170 | 2.8% | 3.3%(-0.448)#148 | 4.3%(-1.44)#13,433 |
| 3. | 29172 | 2.7% | 3.3%(-0.531)#158 | 4.3%(-1.52)#13,770 |
1
Common Questions
What are the Top Zip Codes with the Highest Percentage of Population with a Degree in Visual and Performing Arts in West Columbia, SC?
Top Zip Codes with the Highest Percentage of Population with a Degree in Visual and Performing Arts in West Columbia, SC are:
What zip code has the Highest Percentage of Population with a Degree in Visual and Performing Arts in West Columbia, SC?
29169 has the Highest Percentage of Population with a Degree in Visual and Performing Arts in West Columbia, SC with 4.0%.
What is the Percentage of Population with a Degree in Visual and Performing Arts in West Columbia, SC?
Percentage of Population with a Degree in Visual and Performing Arts in West Columbia is 4.5%.
What is the Percentage of Population with a Degree in Visual and Performing Arts in South Carolina?
Percentage of Population with a Degree in Visual and Performing Arts in South Carolina is 3.3%.
What is the Percentage of Population with a Degree in Visual and Performing Arts in the United States?
Percentage of Population with a Degree in Visual and Performing Arts in the United States is 4.3%.