Zip Codes with the Highest Percentage of Population with a Degree in Visual and Performing Arts in North Charleston, SC
RELATED REPORTS & OPTIONS
Visual and Performing Arts
North Charleston
Compare Zip Codes
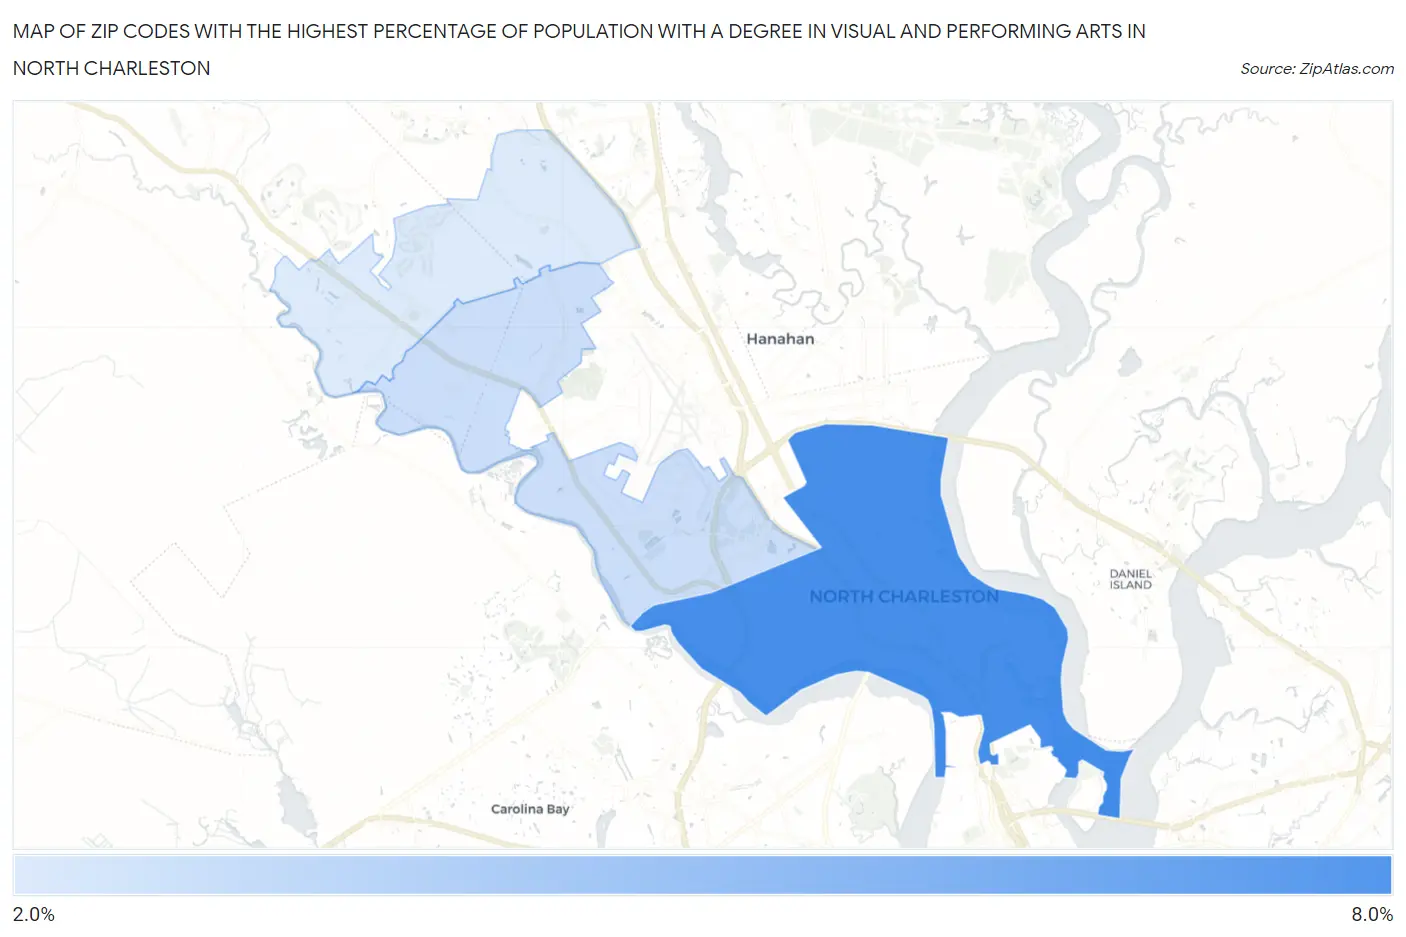
Map of Zip Codes with the Highest Percentage of Population with a Degree in Visual and Performing Arts in North Charleston
2.1%
6.1%
Zip Codes with the Highest Percentage of Population with a Degree in Visual and Performing Arts in North Charleston, SC
| Zip Code | % Graduates | vs State | vs National | |
| 1. | 29405 | 6.1% | 3.3%(+2.86)#36 | 4.3%(+1.87)#4,710 |
| 2. | 29418 | 2.6% | 3.3%(-0.650)#163 | 4.3%(-1.64)#14,215 |
| 3. | 29420 | 2.1% | 3.3%(-1.15)#190 | 4.3%(-2.13)#16,006 |
1
Common Questions
What are the Top Zip Codes with the Highest Percentage of Population with a Degree in Visual and Performing Arts in North Charleston, SC?
Top Zip Codes with the Highest Percentage of Population with a Degree in Visual and Performing Arts in North Charleston, SC are:
What zip code has the Highest Percentage of Population with a Degree in Visual and Performing Arts in North Charleston, SC?
29405 has the Highest Percentage of Population with a Degree in Visual and Performing Arts in North Charleston, SC with 6.1%.
What is the Percentage of Population with a Degree in Visual and Performing Arts in North Charleston, SC?
Percentage of Population with a Degree in Visual and Performing Arts in North Charleston is 3.6%.
What is the Percentage of Population with a Degree in Visual and Performing Arts in South Carolina?
Percentage of Population with a Degree in Visual and Performing Arts in South Carolina is 3.3%.
What is the Percentage of Population with a Degree in Visual and Performing Arts in the United States?
Percentage of Population with a Degree in Visual and Performing Arts in the United States is 4.3%.