Zip Codes with the Highest Percentage of Population with a Degree in Visual and Performing Arts in Seneca, SC
RELATED REPORTS & OPTIONS
Visual and Performing Arts
Seneca
Compare Zip Codes
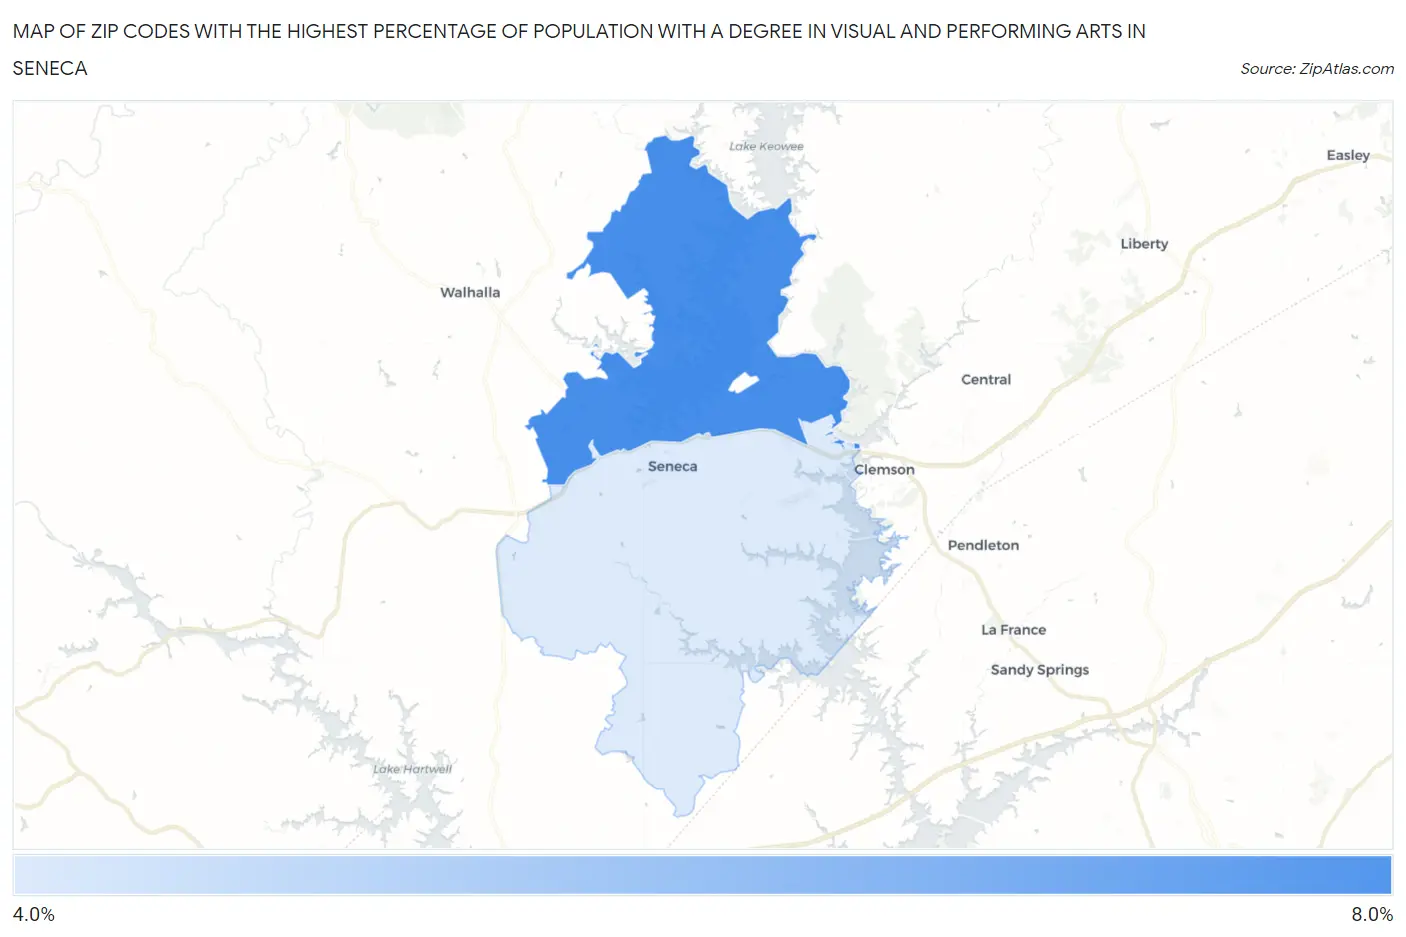
Map of Zip Codes with the Highest Percentage of Population with a Degree in Visual and Performing Arts in Seneca
4.8%
6.3%
Zip Codes with the Highest Percentage of Population with a Degree in Visual and Performing Arts in Seneca, SC
| Zip Code | % Graduates | vs State | vs National | |
| 1. | 29672 | 6.3% | 3.3%(+3.07)#32 | 4.3%(+2.08)#4,431 |
| 2. | 29678 | 4.8% | 3.3%(+1.49)#63 | 4.3%(+0.503)#7,182 |
1
Common Questions
What are the Top Zip Codes with the Highest Percentage of Population with a Degree in Visual and Performing Arts in Seneca, SC?
Top Zip Codes with the Highest Percentage of Population with a Degree in Visual and Performing Arts in Seneca, SC are:
What zip code has the Highest Percentage of Population with a Degree in Visual and Performing Arts in Seneca, SC?
29672 has the Highest Percentage of Population with a Degree in Visual and Performing Arts in Seneca, SC with 6.3%.
What is the Percentage of Population with a Degree in Visual and Performing Arts in Seneca, SC?
Percentage of Population with a Degree in Visual and Performing Arts in Seneca is 0.052%.
What is the Percentage of Population with a Degree in Visual and Performing Arts in South Carolina?
Percentage of Population with a Degree in Visual and Performing Arts in South Carolina is 3.3%.
What is the Percentage of Population with a Degree in Visual and Performing Arts in the United States?
Percentage of Population with a Degree in Visual and Performing Arts in the United States is 4.3%.