Zip Codes with the Highest Percentage of Population with a Degree in Visual and Performing Arts in North Augusta, SC
RELATED REPORTS & OPTIONS
Visual and Performing Arts
North Augusta
Compare Zip Codes
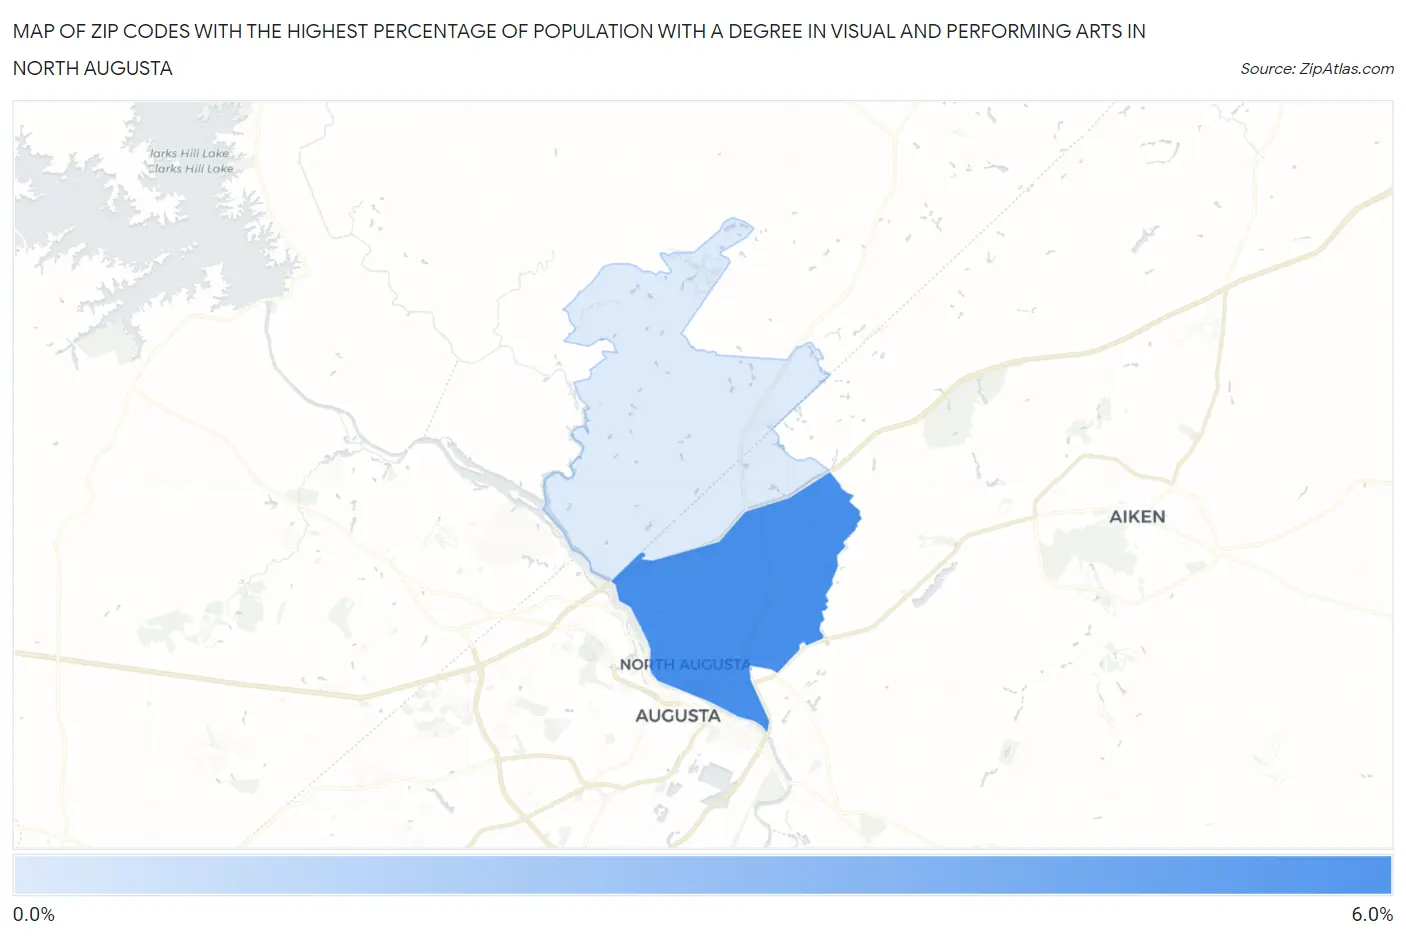
Map of Zip Codes with the Highest Percentage of Population with a Degree in Visual and Performing Arts in North Augusta
0.43%
5.6%
Zip Codes with the Highest Percentage of Population with a Degree in Visual and Performing Arts in North Augusta, SC
| Zip Code | % Graduates | vs State | vs National | |
| 1. | 29841 | 5.6% | 3.3%(+2.32)#44 | 4.3%(+1.33)#5,529 |
| 2. | 29860 | 0.43% | 3.3%(-2.83)#269 | 4.3%(-3.82)#20,904 |
1
Common Questions
What are the Top Zip Codes with the Highest Percentage of Population with a Degree in Visual and Performing Arts in North Augusta, SC?
Top Zip Codes with the Highest Percentage of Population with a Degree in Visual and Performing Arts in North Augusta, SC are:
What zip code has the Highest Percentage of Population with a Degree in Visual and Performing Arts in North Augusta, SC?
29841 has the Highest Percentage of Population with a Degree in Visual and Performing Arts in North Augusta, SC with 5.6%.
What is the Percentage of Population with a Degree in Visual and Performing Arts in North Augusta, SC?
Percentage of Population with a Degree in Visual and Performing Arts in North Augusta is 2.9%.
What is the Percentage of Population with a Degree in Visual and Performing Arts in South Carolina?
Percentage of Population with a Degree in Visual and Performing Arts in South Carolina is 3.3%.
What is the Percentage of Population with a Degree in Visual and Performing Arts in the United States?
Percentage of Population with a Degree in Visual and Performing Arts in the United States is 4.3%.