Parker, SC Map & Demographics
Parker Map
Parker Overview
$21,798
PER CAPITA INCOME
$40,714
AVG FAMILY INCOME
$37,431
AVG HOUSEHOLD INCOME
32.0%
WAGE / INCOME GAP [ % ]
68.0¢/ $1
WAGE / INCOME GAP [ $ ]
$11,860
FAMILY INCOME DEFICIT
0.45
INEQUALITY / GINI INDEX
12,466
TOTAL POPULATION
6,137
MALE POPULATION
6,329
FEMALE POPULATION
96.97
MALES / 100 FEMALES
103.13
FEMALES / 100 MALES
31.8
MEDIAN AGE
3.3
AVG FAMILY SIZE
2.5
AVG HOUSEHOLD SIZE
6,090
LABOR FORCE [ PEOPLE ]
63.1%
PERCENT IN LABOR FORCE
4.8%
UNEMPLOYMENT RATE
Income in Parker
Income Overview in Parker
Per Capita Income in Parker is $21,798, while median incomes of families and households are $40,714 and $37,431 respectively.
| Characteristic | Number | Measure |
| Per Capita Income | 12,466 | $21,798 |
| Median Family Income | 2,592 | $40,714 |
| Mean Family Income | 2,592 | $59,316 |
| Median Household Income | 4,880 | $37,431 |
| Mean Household Income | 4,880 | $54,503 |
| Income Deficit | 2,592 | $11,860 |
| Wage / Income Gap (%) | 12,466 | 32.00% |
| Wage / Income Gap ($) | 12,466 | 68.00¢ per $1 |
| Gini / Inequality Index | 12,466 | 0.45 |
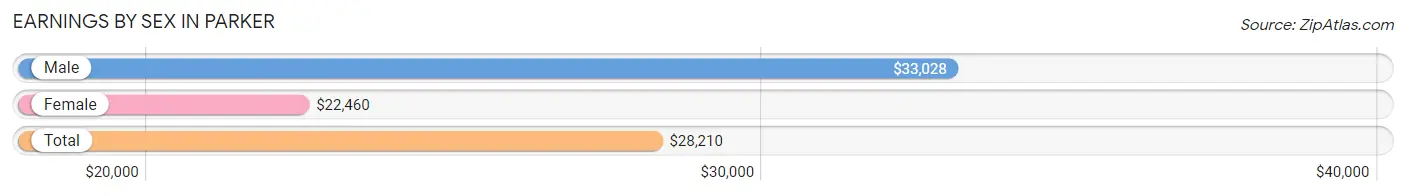
Earnings by Sex in Parker
Average Earnings in Parker are $28,210, $33,028 for men and $22,460 for women, a difference of 32.0%.
| Sex | Number | Average Earnings |
| Male | 3,334 (52.8%) | $33,028 |
| Female | 2,981 (47.2%) | $22,460 |
| Total | 6,315 (100.0%) | $28,210 |
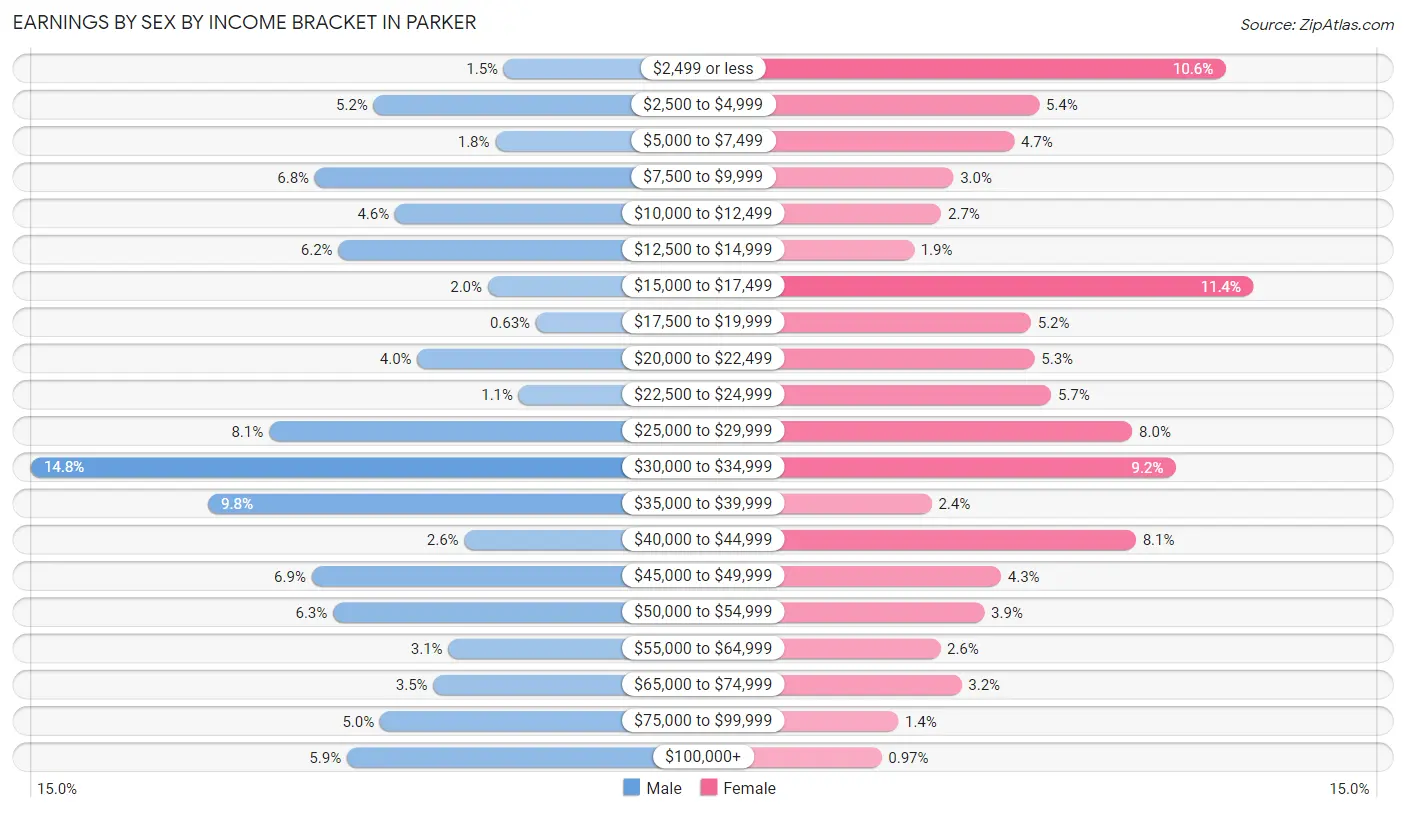
Earnings by Sex by Income Bracket in Parker
The most common earnings brackets in Parker are $30,000 to $34,999 for men (494 | 14.8%) and $15,000 to $17,499 for women (340 | 11.4%).
| Income | Male | Female |
| $2,499 or less | 51 (1.5%) | 317 (10.6%) |
| $2,500 to $4,999 | 173 (5.2%) | 161 (5.4%) |
| $5,000 to $7,499 | 59 (1.8%) | 140 (4.7%) |
| $7,500 to $9,999 | 228 (6.8%) | 89 (3.0%) |
| $10,000 to $12,499 | 153 (4.6%) | 79 (2.6%) |
| $12,500 to $14,999 | 206 (6.2%) | 56 (1.9%) |
| $15,000 to $17,499 | 66 (2.0%) | 340 (11.4%) |
| $17,500 to $19,999 | 21 (0.6%) | 154 (5.2%) |
| $20,000 to $22,499 | 132 (4.0%) | 157 (5.3%) |
| $22,500 to $24,999 | 37 (1.1%) | 171 (5.7%) |
| $25,000 to $29,999 | 271 (8.1%) | 239 (8.0%) |
| $30,000 to $34,999 | 494 (14.8%) | 275 (9.2%) |
| $35,000 to $39,999 | 328 (9.8%) | 71 (2.4%) |
| $40,000 to $44,999 | 88 (2.6%) | 242 (8.1%) |
| $45,000 to $49,999 | 231 (6.9%) | 129 (4.3%) |
| $50,000 to $54,999 | 211 (6.3%) | 115 (3.9%) |
| $55,000 to $64,999 | 103 (3.1%) | 78 (2.6%) |
| $65,000 to $74,999 | 117 (3.5%) | 96 (3.2%) |
| $75,000 to $99,999 | 167 (5.0%) | 43 (1.4%) |
| $100,000+ | 198 (5.9%) | 29 (1.0%) |
| Total | 3,334 (100.0%) | 2,981 (100.0%) |
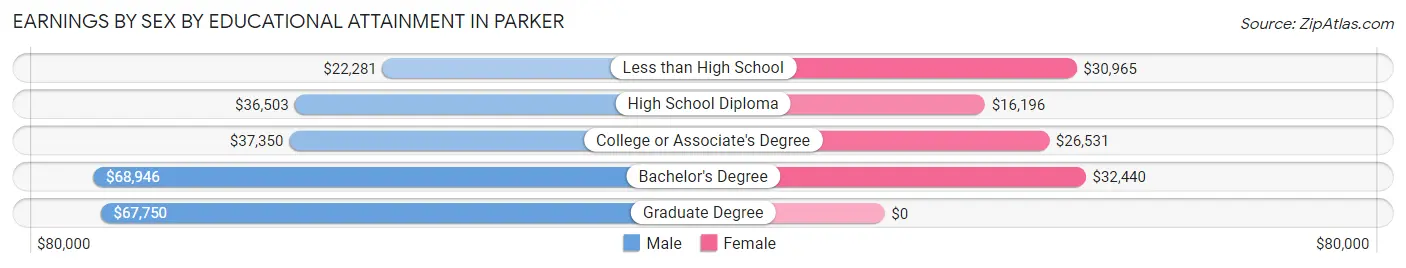
Earnings by Sex by Educational Attainment in Parker
Average earnings in Parker are $35,990 for men and $22,609 for women, a difference of 37.2%. Men with an educational attainment of bachelor's degree enjoy the highest average annual earnings of $68,946, while those with less than high school education earn the least with $22,281. Women with an educational attainment of bachelor's degree earn the most with the average annual earnings of $32,440, while those with high school diploma education have the smallest earnings of $16,196.
| Educational Attainment | Male Income | Female Income |
| Less than High School | $22,281 | $30,965 |
| High School Diploma | $36,503 | $16,196 |
| College or Associate's Degree | $37,350 | $26,531 |
| Bachelor's Degree | $68,946 | $32,440 |
| Graduate Degree | $67,750 | $0 |
| Total | $35,990 | $22,609 |
Family Income in Parker
Family Income Brackets in Parker
According to the Parker family income data, there are 503 families falling into the $15,000 to $24,999 income range, which is the most common income bracket and makes up 19.4% of all families. Conversely, the $200,000+ income bracket is the least frequent group with only 65 families (2.5%) belonging to this category.
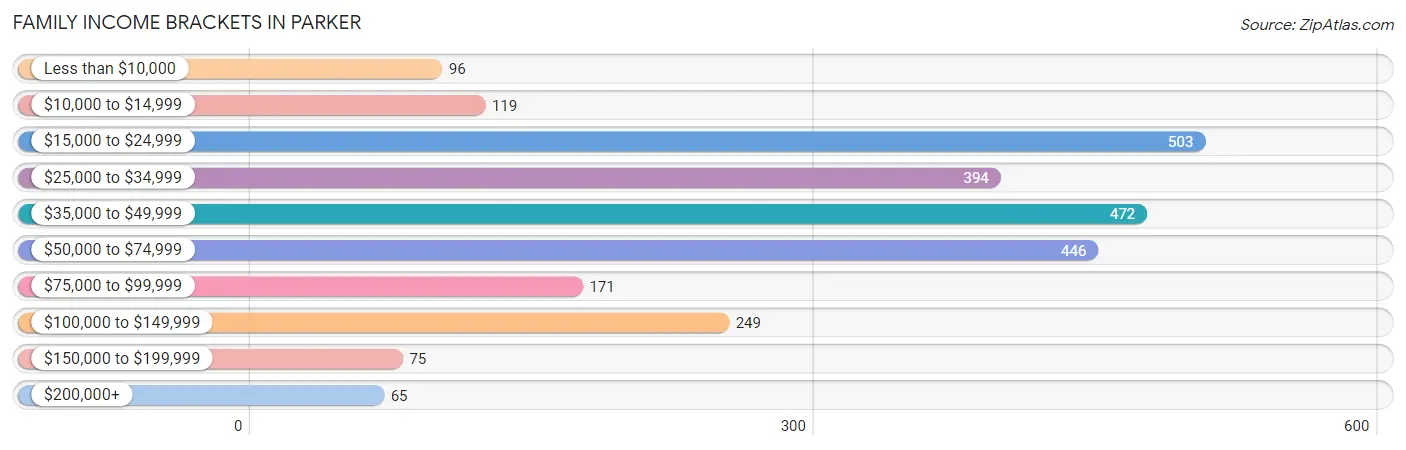
| Income Bracket | # Families | % Families |
| Less than $10,000 | 96 | 3.7% |
| $10,000 to $14,999 | 119 | 4.6% |
| $15,000 to $24,999 | 503 | 19.4% |
| $25,000 to $34,999 | 394 | 15.2% |
| $35,000 to $49,999 | 472 | 18.2% |
| $50,000 to $74,999 | 446 | 17.2% |
| $75,000 to $99,999 | 171 | 6.6% |
| $100,000 to $149,999 | 249 | 9.6% |
| $150,000 to $199,999 | 75 | 2.9% |
| $200,000+ | 65 | 2.5% |
Family Income by Famaliy Size in Parker
4-person families (260 | 10.0%) account for the highest median family income in Parker with $62,817 per family, while 2-person families (936 | 36.1%) have the highest median income of $17,310 per family member.
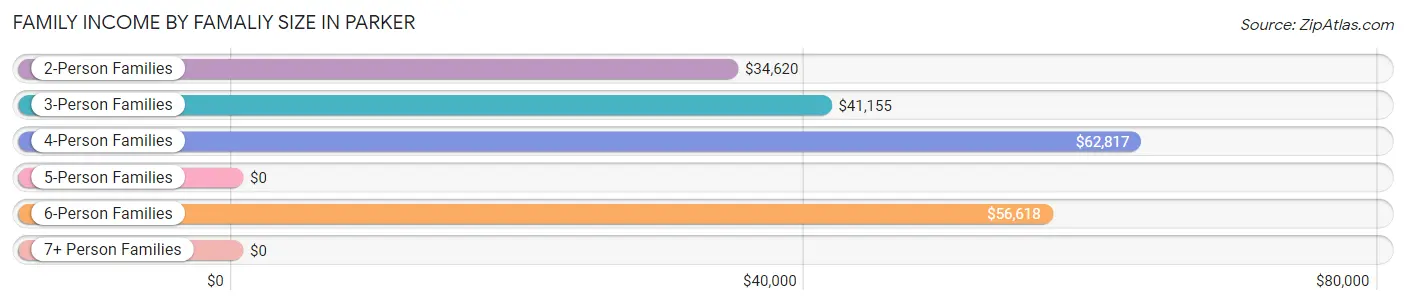
| Income Bracket | # Families | Median Income |
| 2-Person Families | 936 (36.1%) | $34,620 |
| 3-Person Families | 655 (25.3%) | $41,155 |
| 4-Person Families | 260 (10.0%) | $62,817 |
| 5-Person Families | 619 (23.9%) | $0 |
| 6-Person Families | 100 (3.9%) | $56,618 |
| 7+ Person Families | 22 (0.9%) | $0 |
| Total | 2,592 (100.0%) | $40,714 |
Family Income by Number of Earners in Parker
The median family income in Parker is $40,714, with families comprising 3+ earners (208) having the highest median family income of $100,429, while families with no earners (270) have the lowest median family income of $22,554, accounting for 8.0% and 10.4% of families, respectively.
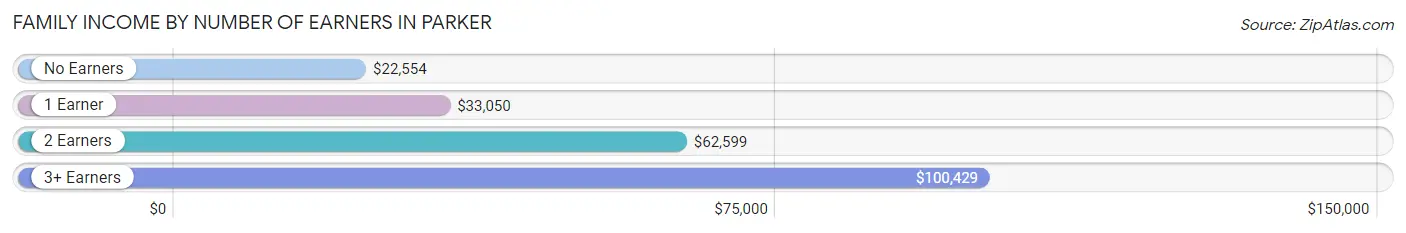
| Number of Earners | # Families | Median Income |
| No Earners | 270 (10.4%) | $22,554 |
| 1 Earner | 1,245 (48.0%) | $33,050 |
| 2 Earners | 869 (33.5%) | $62,599 |
| 3+ Earners | 208 (8.0%) | $100,429 |
| Total | 2,592 (100.0%) | $40,714 |
Household Income in Parker
Household Income Brackets in Parker
With 1,025 households falling in the category, the $25,000 to $34,999 income range is the most frequent in Parker, accounting for 21.0% of all households. In contrast, only 83 households (1.7%) fall into the $200,000+ income bracket, making it the least populous group.
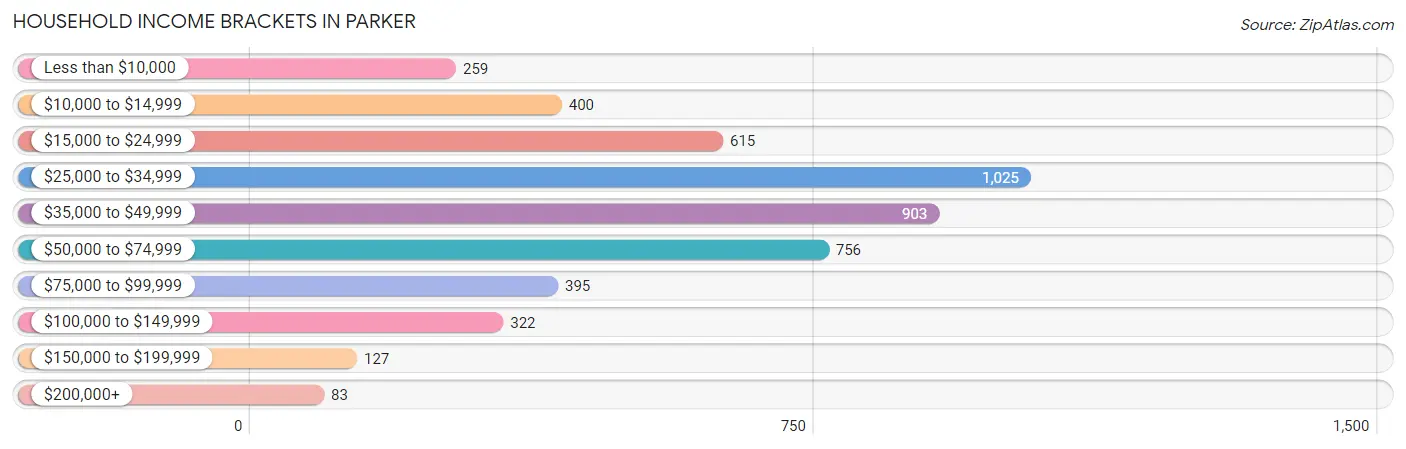
| Income Bracket | # Households | % Households |
| Less than $10,000 | 259 | 5.3% |
| $10,000 to $14,999 | 400 | 8.2% |
| $15,000 to $24,999 | 615 | 12.6% |
| $25,000 to $34,999 | 1,025 | 21.0% |
| $35,000 to $49,999 | 903 | 18.5% |
| $50,000 to $74,999 | 756 | 15.5% |
| $75,000 to $99,999 | 395 | 8.1% |
| $100,000 to $149,999 | 322 | 6.6% |
| $150,000 to $199,999 | 127 | 2.6% |
| $200,000+ | 83 | 1.7% |
Household Income by Householder Age in Parker
The median household income in Parker is $37,431, with the highest median household income of $43,835 found in the 45 to 64 years age bracket for the primary householder. A total of 1,940 households (39.8%) fall into this category. Meanwhile, the 65+ years age bracket for the primary householder has the lowest median household income of $27,326, with 683 households (14.0%) in this group.
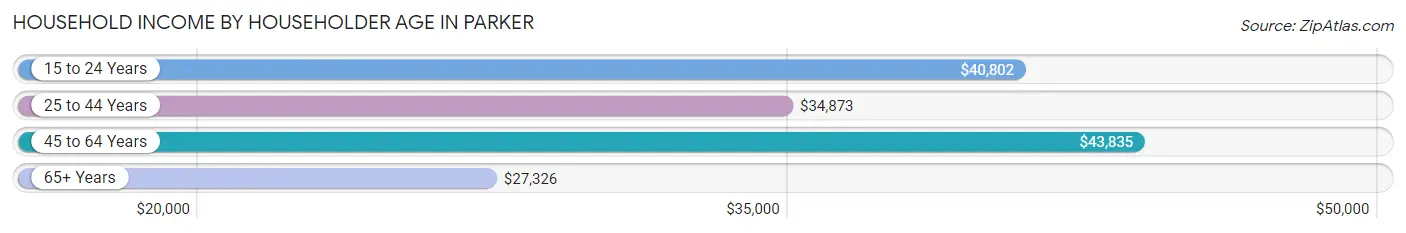
| Income Bracket | # Households | Median Income |
| 15 to 24 Years | 334 (6.8%) | $40,802 |
| 25 to 44 Years | 1,923 (39.4%) | $34,873 |
| 45 to 64 Years | 1,940 (39.8%) | $43,835 |
| 65+ Years | 683 (14.0%) | $27,326 |
| Total | 4,880 (100.0%) | $37,431 |
Poverty in Parker
Income Below Poverty by Sex and Age in Parker
With 27.8% poverty level for males and 30.6% for females among the residents of Parker, under 5 year old males and 6 to 11 year old females are the most vulnerable to poverty, with 584 males (76.2%) and 215 females (55.3%) in their respective age groups living below the poverty level.
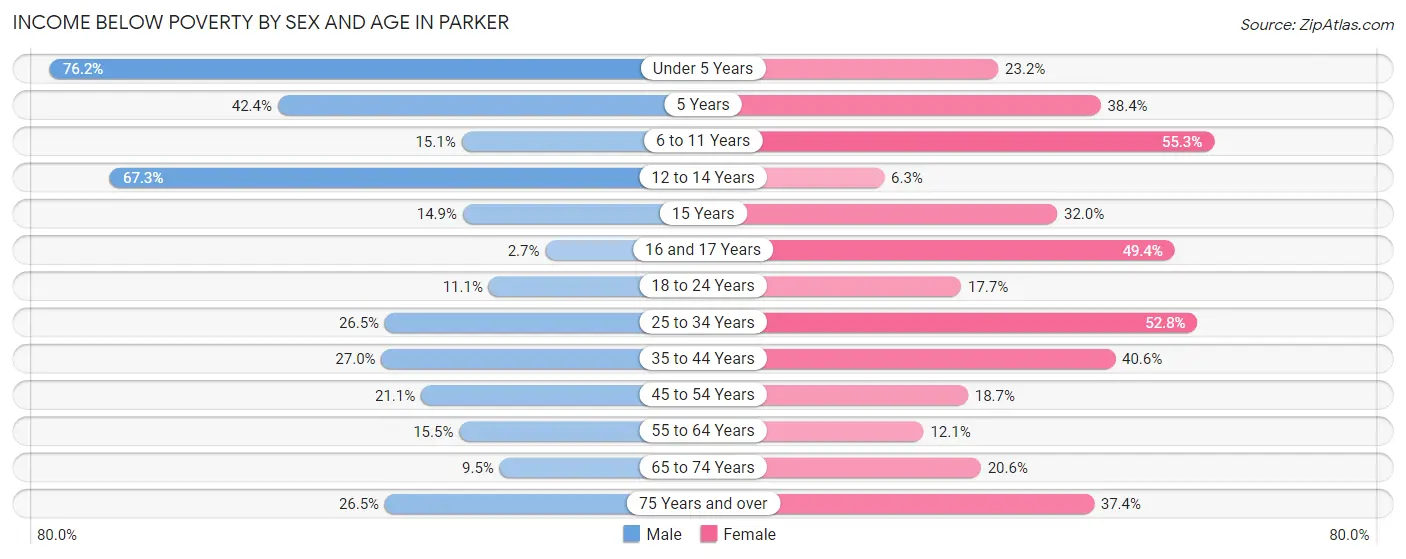
| Age Bracket | Male | Female |
| Under 5 Years | 584 (76.2%) | 88 (23.2%) |
| 5 Years | 53 (42.4%) | 53 (38.4%) |
| 6 to 11 Years | 69 (15.1%) | 215 (55.3%) |
| 12 to 14 Years | 107 (67.3%) | 15 (6.3%) |
| 15 Years | 10 (14.9%) | 31 (32.0%) |
| 16 and 17 Years | 7 (2.7%) | 43 (49.4%) |
| 18 to 24 Years | 88 (11.1%) | 102 (17.7%) |
| 25 to 34 Years | 311 (26.5%) | 556 (52.8%) |
| 35 to 44 Years | 134 (27.0%) | 344 (40.6%) |
| 45 to 54 Years | 172 (21.1%) | 166 (18.7%) |
| 55 to 64 Years | 92 (15.5%) | 106 (12.1%) |
| 65 to 74 Years | 21 (9.5%) | 78 (20.6%) |
| 75 Years and over | 40 (26.5%) | 113 (37.4%) |
| Total | 1,688 (27.8%) | 1,910 (30.6%) |
Income Above Poverty by Sex and Age in Parker
According to the poverty statistics in Parker, males aged 16 and 17 years and females aged 12 to 14 years are the age groups that are most secure financially, with 97.3% of males and 93.7% of females in these age groups living above the poverty line.
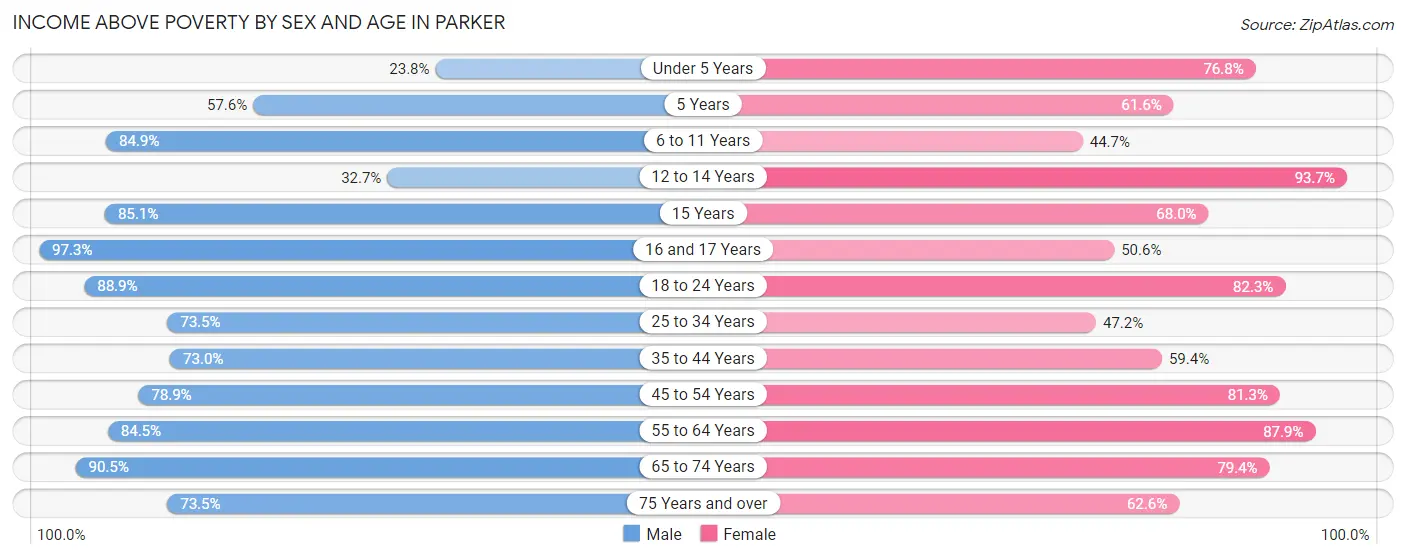
| Age Bracket | Male | Female |
| Under 5 Years | 182 (23.8%) | 291 (76.8%) |
| 5 Years | 72 (57.6%) | 85 (61.6%) |
| 6 to 11 Years | 387 (84.9%) | 174 (44.7%) |
| 12 to 14 Years | 52 (32.7%) | 224 (93.7%) |
| 15 Years | 57 (85.1%) | 66 (68.0%) |
| 16 and 17 Years | 254 (97.3%) | 44 (50.6%) |
| 18 to 24 Years | 706 (88.9%) | 474 (82.3%) |
| 25 to 34 Years | 863 (73.5%) | 497 (47.2%) |
| 35 to 44 Years | 362 (73.0%) | 504 (59.4%) |
| 45 to 54 Years | 642 (78.9%) | 721 (81.3%) |
| 55 to 64 Years | 503 (84.5%) | 768 (87.9%) |
| 65 to 74 Years | 201 (90.5%) | 300 (79.4%) |
| 75 Years and over | 111 (73.5%) | 189 (62.6%) |
| Total | 4,392 (72.2%) | 4,337 (69.4%) |
Income Below Poverty Among Married-Couple Families in Parker
The poverty statistics for married-couple families in Parker show that 9.9% or 121 of the total 1,224 families live below the poverty line. Families with 3 or 4 children have the highest poverty rate of 47.1%, comprising of 97 families. On the other hand, families with 1 or 2 children have the lowest poverty rate of 1.9%, which includes 7 families.
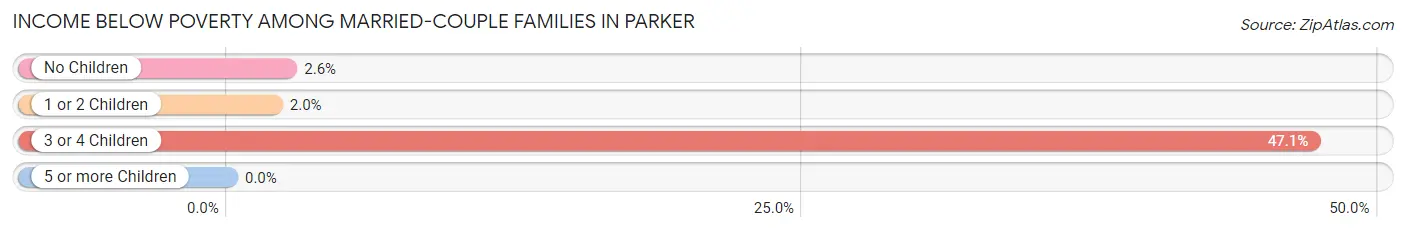
| Children | Above Poverty | Below Poverty |
| No Children | 642 (97.4%) | 17 (2.6%) |
| 1 or 2 Children | 352 (98.1%) | 7 (1.9%) |
| 3 or 4 Children | 109 (52.9%) | 97 (47.1%) |
| 5 or more Children | 0 (0.0%) | 0 (0.0%) |
| Total | 1,103 (90.1%) | 121 (9.9%) |
Income Below Poverty Among Single-Parent Households in Parker
According to the poverty data in Parker, 15.2% or 52 single-father households and 49.2% or 504 single-mother households are living below the poverty line. Among single-father households, those with 3 or 4 children have the highest poverty rate, with 14 households (42.4%) experiencing poverty. Likewise, among single-mother households, those with 3 or 4 children have the highest poverty rate, with 284 households (79.5%) falling below the poverty line.
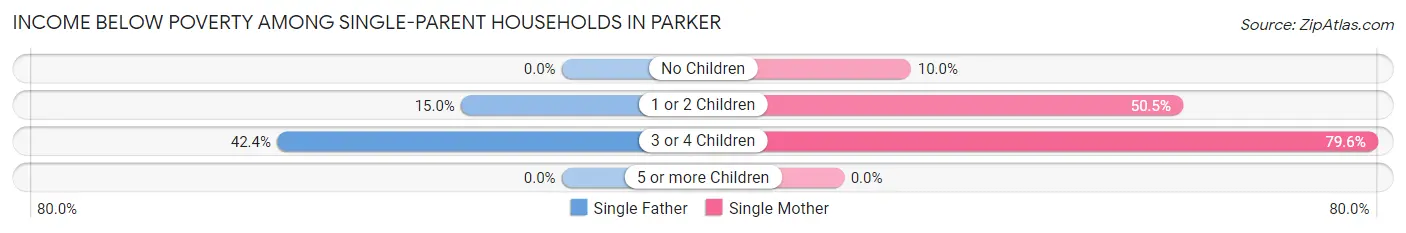
| Children | Single Father | Single Mother |
| No Children | 0 (0.0%) | 29 (10.0%) |
| 1 or 2 Children | 38 (15.0%) | 191 (50.5%) |
| 3 or 4 Children | 14 (42.4%) | 284 (79.5%) |
| 5 or more Children | 0 (0.0%) | 0 (0.0%) |
| Total | 52 (15.2%) | 504 (49.2%) |
Income Below Poverty Among Married-Couple vs Single-Parent Households in Parker
The poverty data for Parker shows that 121 of the married-couple family households (9.9%) and 556 of the single-parent households (40.6%) are living below the poverty level. Within the married-couple family households, those with 3 or 4 children have the highest poverty rate, with 97 households (47.1%) falling below the poverty line. Among the single-parent households, those with 3 or 4 children have the highest poverty rate, with 298 household (76.4%) living below poverty.
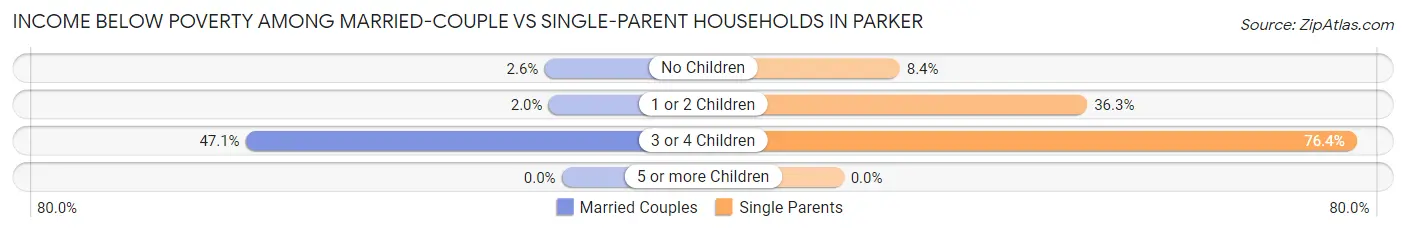
| Children | Married-Couple Families | Single-Parent Households |
| No Children | 17 (2.6%) | 29 (8.4%) |
| 1 or 2 Children | 7 (1.9%) | 229 (36.3%) |
| 3 or 4 Children | 97 (47.1%) | 298 (76.4%) |
| 5 or more Children | 0 (0.0%) | 0 (0.0%) |
| Total | 121 (9.9%) | 556 (40.6%) |
Race in Parker
The most populous races in Parker are White / Caucasian (5,806 | 46.6%), Hispanic or Latino (3,190 | 25.6%), and Black / African American (2,800 | 22.5%).
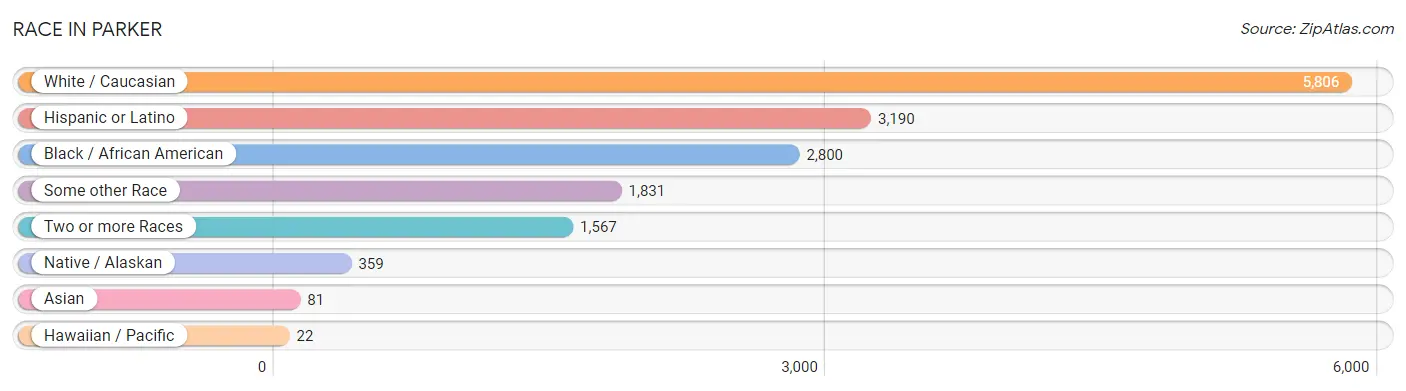
| Race | # Population | % Population |
| Asian | 81 | 0.6% |
| Black / African American | 2,800 | 22.5% |
| Hawaiian / Pacific | 22 | 0.2% |
| Hispanic or Latino | 3,190 | 25.6% |
| Native / Alaskan | 359 | 2.9% |
| White / Caucasian | 5,806 | 46.6% |
| Two or more Races | 1,567 | 12.6% |
| Some other Race | 1,831 | 14.7% |
| Total | 12,466 | 100.0% |
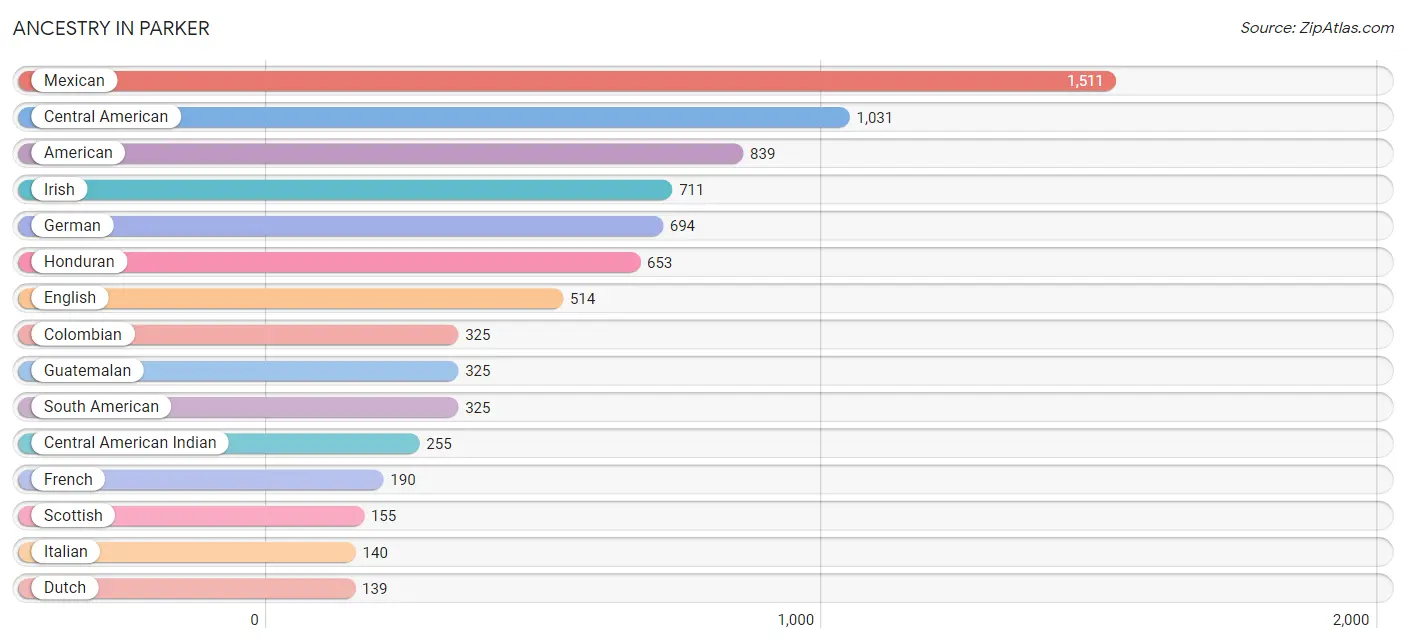
Ancestry in Parker
The most populous ancestries reported in Parker are Mexican (1,511 | 12.1%), Central American (1,031 | 8.3%), American (839 | 6.7%), Irish (711 | 5.7%), and German (694 | 5.6%), together accounting for 38.4% of all Parker residents.
| Ancestry | # Population | % Population |
| African | 13 | 0.1% |
| American | 839 | 6.7% |
| Arab | 10 | 0.1% |
| British | 55 | 0.4% |
| Burmese | 18 | 0.1% |
| Central American | 1,031 | 8.3% |
| Central American Indian | 255 | 2.1% |
| Cherokee | 17 | 0.1% |
| Colombian | 325 | 2.6% |
| Costa Rican | 21 | 0.2% |
| Cuban | 27 | 0.2% |
| Dutch | 139 | 1.1% |
| English | 514 | 4.1% |
| European | 126 | 1.0% |
| French | 190 | 1.5% |
| French Canadian | 15 | 0.1% |
| German | 694 | 5.6% |
| Greek | 100 | 0.8% |
| Guatemalan | 325 | 2.6% |
| Honduran | 653 | 5.2% |
| Hungarian | 7 | 0.1% |
| Indian (Asian) | 41 | 0.3% |
| Irish | 711 | 5.7% |
| Israeli | 18 | 0.1% |
| Italian | 140 | 1.1% |
| Korean | 16 | 0.1% |
| Mexican | 1,511 | 12.1% |
| Mexican American Indian | 97 | 0.8% |
| Nicaraguan | 23 | 0.2% |
| Norwegian | 34 | 0.3% |
| Pennsylvania German | 4 | 0.0% |
| Polish | 39 | 0.3% |
| Portuguese | 21 | 0.2% |
| Puerto Rican | 103 | 0.8% |
| Salvadoran | 9 | 0.1% |
| Scandinavian | 16 | 0.1% |
| Scotch-Irish | 88 | 0.7% |
| Scottish | 155 | 1.2% |
| Slovene | 16 | 0.1% |
| South American | 325 | 2.6% |
| Spanish | 5 | 0.0% |
| Sri Lankan | 24 | 0.2% |
| Subsaharan African | 34 | 0.3% |
| Swedish | 21 | 0.2% |
| Swiss | 15 | 0.1% |
| Welsh | 92 | 0.7% | View All 46 Rows |
Immigrants in Parker
The most numerous immigrant groups reported in Parker came from Latin America (1,734 | 13.9%), Central America (1,595 | 12.8%), Mexico (759 | 6.1%), Honduras (654 | 5.2%), and Guatemala (165 | 1.3%), together accounting for 39.4% of all Parker residents.
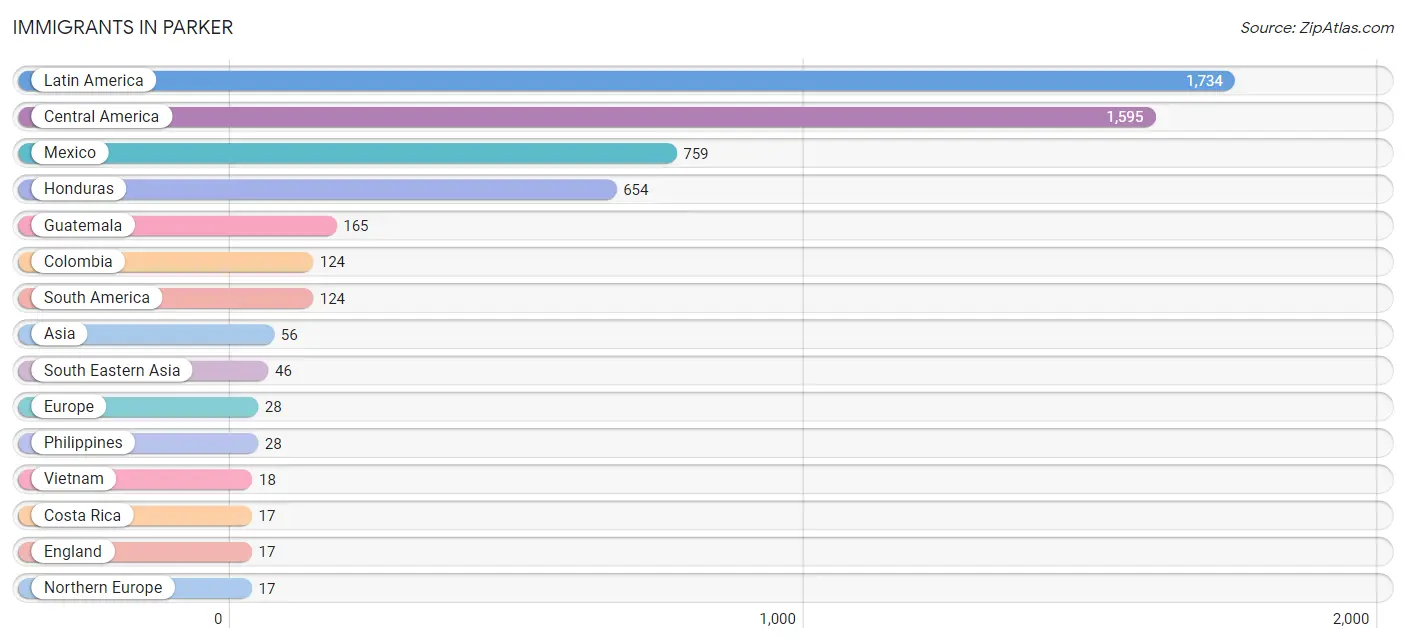
| Immigration Origin | # Population | % Population |
| Asia | 56 | 0.4% |
| Caribbean | 15 | 0.1% |
| Central America | 1,595 | 12.8% |
| Colombia | 124 | 1.0% |
| Costa Rica | 17 | 0.1% |
| Cuba | 14 | 0.1% |
| Dominican Republic | 1 | 0.0% |
| Eastern Europe | 11 | 0.1% |
| England | 17 | 0.1% |
| Europe | 28 | 0.2% |
| Guatemala | 165 | 1.3% |
| Honduras | 654 | 5.2% |
| Jordan | 10 | 0.1% |
| Latin America | 1,734 | 13.9% |
| Mexico | 759 | 6.1% |
| Northern Europe | 17 | 0.1% |
| Philippines | 28 | 0.2% |
| South America | 124 | 1.0% |
| South Eastern Asia | 46 | 0.4% |
| Ukraine | 11 | 0.1% |
| Vietnam | 18 | 0.1% |
| Western Asia | 10 | 0.1% | View All 22 Rows |
Sex and Age in Parker
Sex and Age in Parker
The most populous age groups in Parker are 20 to 24 Years (777 | 12.7%) for men and 30 to 34 Years (555 | 8.8%) for women.
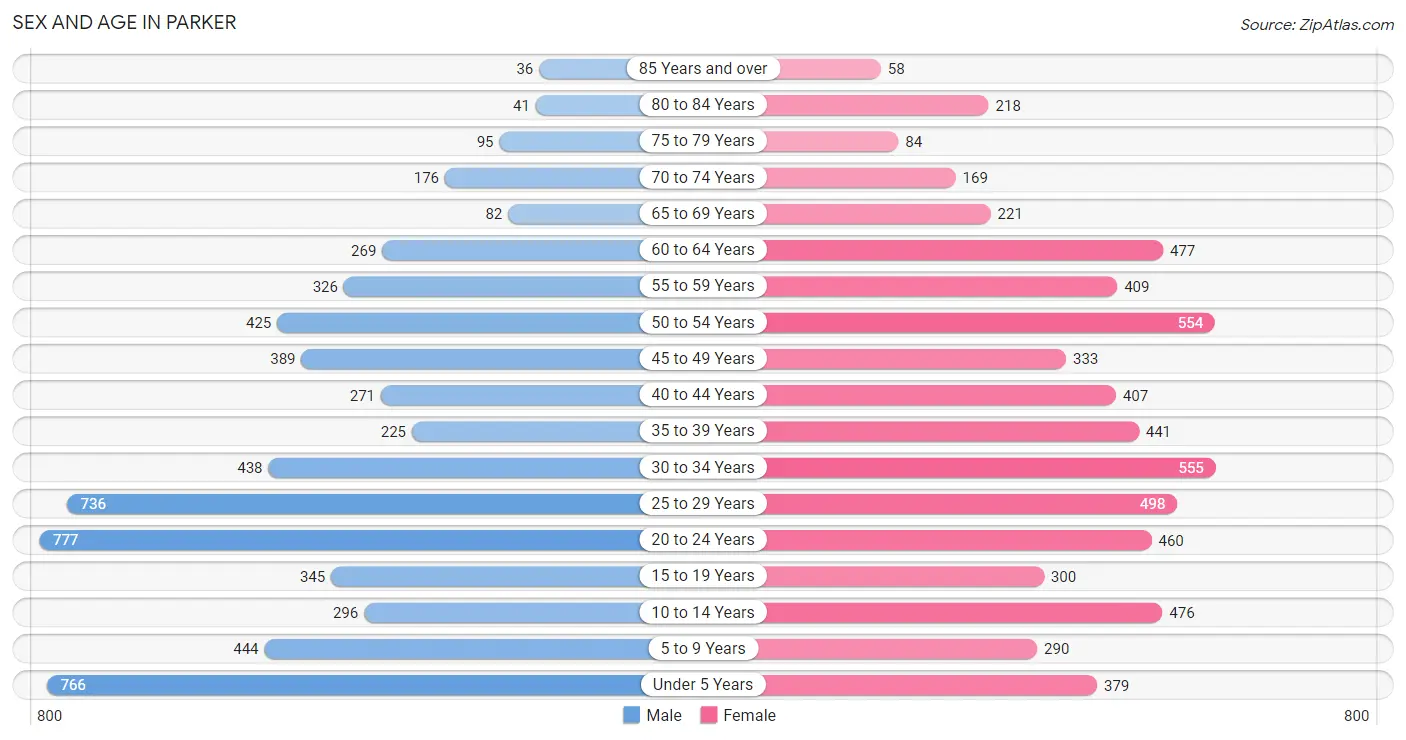
| Age Bracket | Male | Female |
| Under 5 Years | 766 (12.5%) | 379 (6.0%) |
| 5 to 9 Years | 444 (7.2%) | 290 (4.6%) |
| 10 to 14 Years | 296 (4.8%) | 476 (7.5%) |
| 15 to 19 Years | 345 (5.6%) | 300 (4.7%) |
| 20 to 24 Years | 777 (12.7%) | 460 (7.3%) |
| 25 to 29 Years | 736 (12.0%) | 498 (7.9%) |
| 30 to 34 Years | 438 (7.1%) | 555 (8.8%) |
| 35 to 39 Years | 225 (3.7%) | 441 (7.0%) |
| 40 to 44 Years | 271 (4.4%) | 407 (6.4%) |
| 45 to 49 Years | 389 (6.3%) | 333 (5.3%) |
| 50 to 54 Years | 425 (6.9%) | 554 (8.7%) |
| 55 to 59 Years | 326 (5.3%) | 409 (6.5%) |
| 60 to 64 Years | 269 (4.4%) | 477 (7.5%) |
| 65 to 69 Years | 82 (1.3%) | 221 (3.5%) |
| 70 to 74 Years | 176 (2.9%) | 169 (2.7%) |
| 75 to 79 Years | 95 (1.5%) | 84 (1.3%) |
| 80 to 84 Years | 41 (0.7%) | 218 (3.4%) |
| 85 Years and over | 36 (0.6%) | 58 (0.9%) |
| Total | 6,137 (100.0%) | 6,329 (100.0%) |
Families and Households in Parker
Median Family Size in Parker
The median family size in Parker is 3.34 persons per family, with married-couple families (1,224 | 47.2%) accounting for the largest median family size of 3.47 persons per family. On the other hand, single male/father families (343 | 13.2%) represent the smallest median family size with 3.05 persons per family.
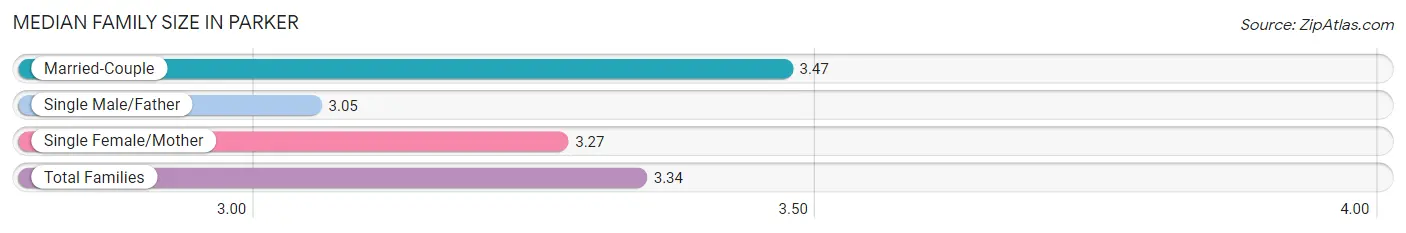
| Family Type | # Families | Family Size |
| Married-Couple | 1,224 (47.2%) | 3.47 |
| Single Male/Father | 343 (13.2%) | 3.05 |
| Single Female/Mother | 1,025 (39.5%) | 3.27 |
| Total Families | 2,592 (100.0%) | 3.34 |
Median Household Size in Parker
The median household size in Parker is 2.52 persons per household, with single male/father households (343 | 7.0%) accounting for the largest median household size of 3.77 persons per household. non-family households (2,288 | 46.9%) represent the smallest median household size with 1.38 persons per household.
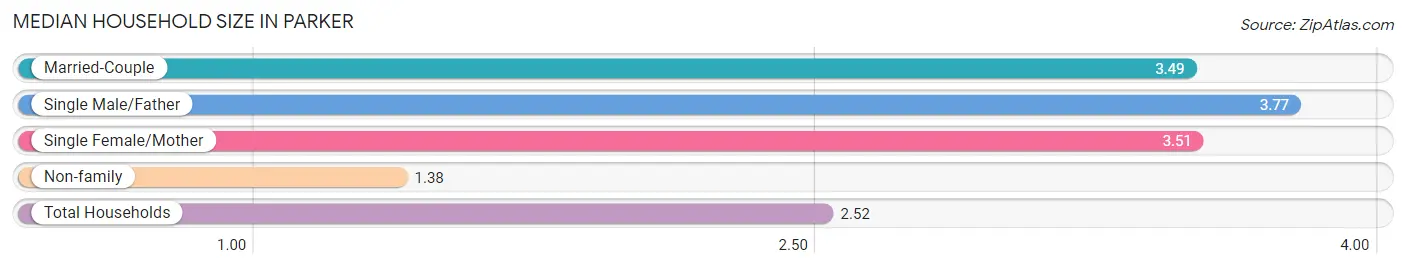
| Household Type | # Households | Household Size |
| Married-Couple | 1,224 (25.1%) | 3.49 |
| Single Male/Father | 343 (7.0%) | 3.77 |
| Single Female/Mother | 1,025 (21.0%) | 3.51 |
| Non-family | 2,288 (46.9%) | 1.38 |
| Total Households | 4,880 (100.0%) | 2.52 |
Household Size by Marriage Status in Parker
Out of a total of 4,880 households in Parker, 2,592 (53.1%) are family households, while 2,288 (46.9%) are nonfamily households. The most numerous type of family households are 2-person households, comprising 838, and the most common type of nonfamily households are 1-person households, comprising 1,581.
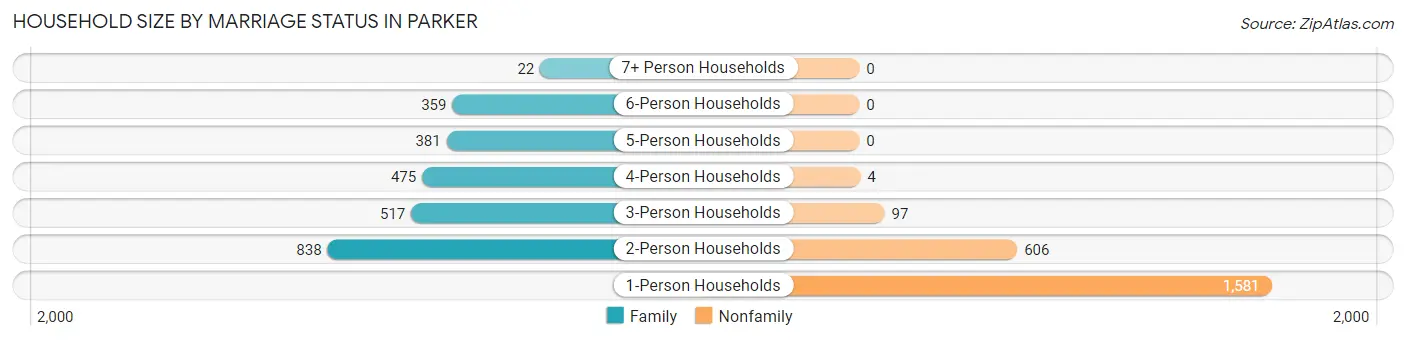
| Household Size | Family Households | Nonfamily Households |
| 1-Person Households | - | 1,581 (32.4%) |
| 2-Person Households | 838 (17.2%) | 606 (12.4%) |
| 3-Person Households | 517 (10.6%) | 97 (2.0%) |
| 4-Person Households | 475 (9.7%) | 4 (0.1%) |
| 5-Person Households | 381 (7.8%) | 0 (0.0%) |
| 6-Person Households | 359 (7.4%) | 0 (0.0%) |
| 7+ Person Households | 22 (0.4%) | 0 (0.0%) |
| Total | 2,592 (53.1%) | 2,288 (46.9%) |
Female Fertility in Parker
Fertility by Age in Parker
Average fertility rate in Parker is 60.0 births per 1,000 women. Women in the age bracket of 35 to 50 years have the highest fertility rate with 73.0 births per 1,000 women. Women in the age bracket of 35 to 50 years acount for 51.1% of all women with births.
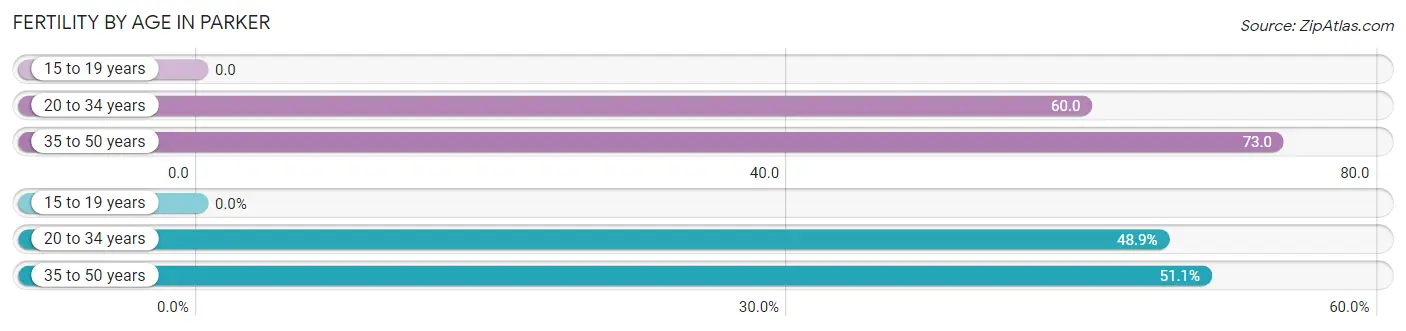
| Age Bracket | Women with Births | Births / 1,000 Women |
| 15 to 19 years | 0 (0.0%) | 0.0 |
| 20 to 34 years | 91 (48.9%) | 60.0 |
| 35 to 50 years | 95 (51.1%) | 73.0 |
| Total | 186 (100.0%) | 60.0 |
Fertility by Age by Marriage Status in Parker
36.6% of women with births (186) in Parker are married. The highest percentage of unmarried women with births falls into 35 to 50 years age bracket with 89.5% of them unmarried at the time of birth, while the lowest percentage of unmarried women with births belong to 20 to 34 years age bracket with 36.3% of them unmarried.
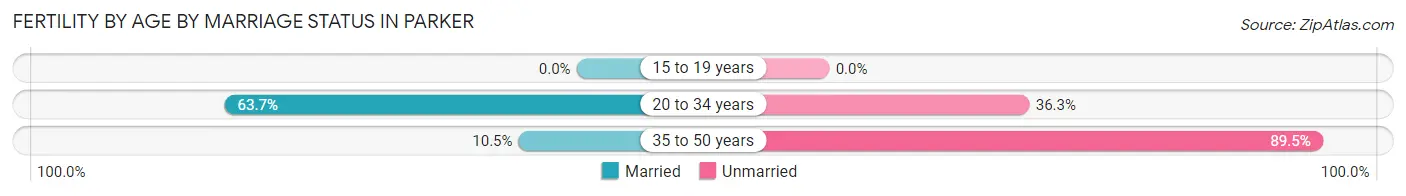
| Age Bracket | Married | Unmarried |
| 15 to 19 years | 0 (0.0%) | 0 (0.0%) |
| 20 to 34 years | 58 (63.7%) | 33 (36.3%) |
| 35 to 50 years | 10 (10.5%) | 85 (89.5%) |
| Total | 68 (36.6%) | 118 (63.4%) |
Fertility by Education in Parker
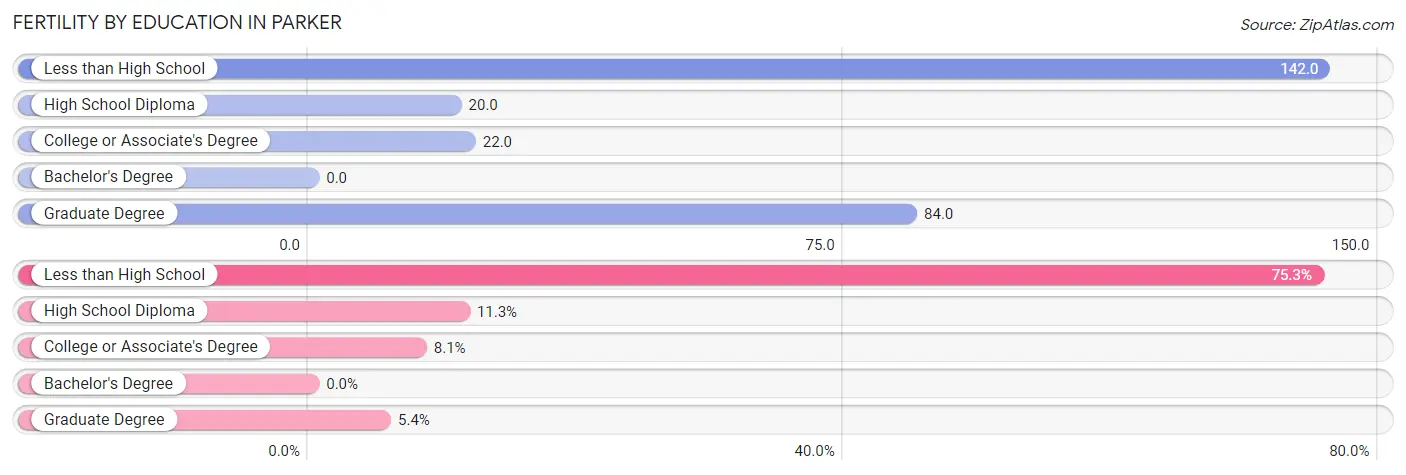
| Educational Attainment | Women with Births | Births / 1,000 Women |
| Less than High School | 140 (75.3%) | 142.0 |
| High School Diploma | 21 (11.3%) | 20.0 |
| College or Associate's Degree | 15 (8.1%) | 22.0 |
| Bachelor's Degree | 0 (0.0%) | 0.0 |
| Graduate Degree | 10 (5.4%) | 84.0 |
| Total | 186 (100.0%) | 60.0 |
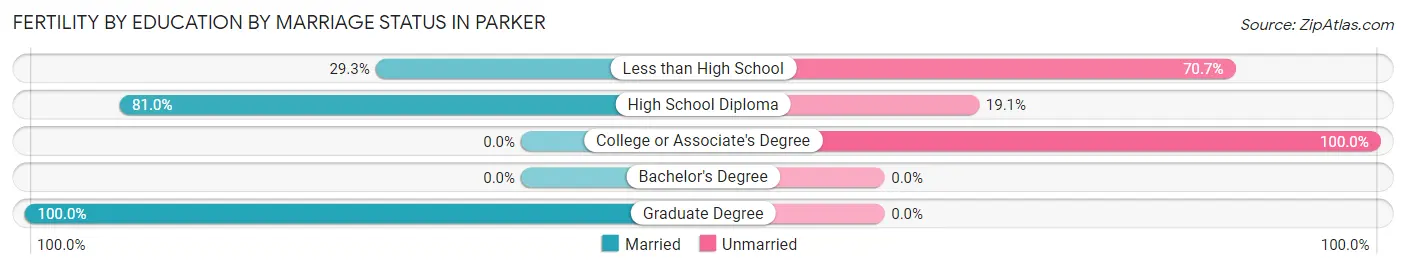
Fertility by Education by Marriage Status in Parker
63.4% of women with births in Parker are unmarried. Women with the educational attainment of graduate degree are most likely to be married with 100.0% of them married at childbirth, while women with the educational attainment of college or associate's degree are least likely to be married with 100.0% of them unmarried at childbirth.
| Educational Attainment | Married | Unmarried |
| Less than High School | 41 (29.3%) | 99 (70.7%) |
| High School Diploma | 17 (80.9%) | 4 (19.1%) |
| College or Associate's Degree | 0 (0.0%) | 15 (100.0%) |
| Bachelor's Degree | 0 (0.0%) | 0 (0.0%) |
| Graduate Degree | 10 (100.0%) | 0 (0.0%) |
| Total | 68 (36.6%) | 118 (63.4%) |
Employment Characteristics in Parker
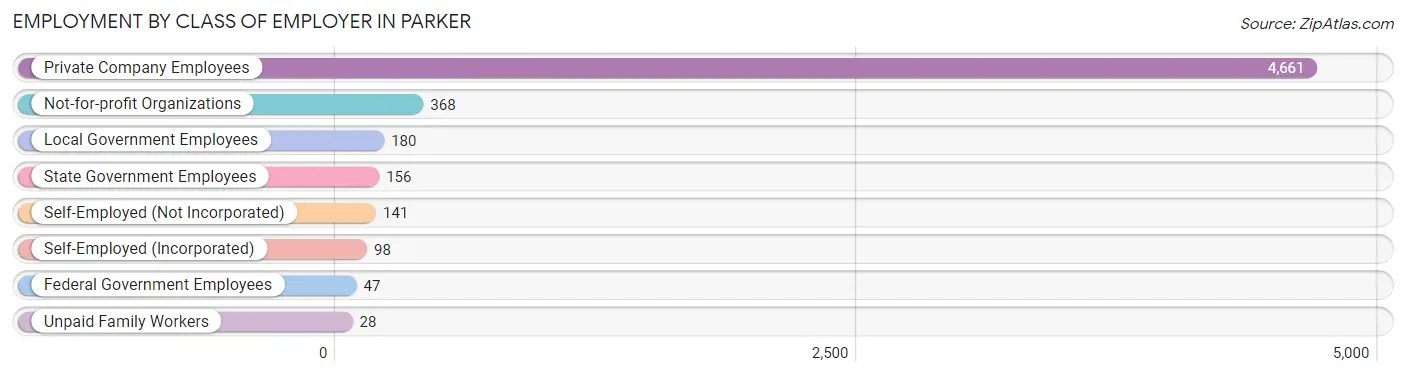
Employment by Class of Employer in Parker
Among the 5,679 employed individuals in Parker, private company employees (4,661 | 82.1%), not-for-profit organizations (368 | 6.5%), and local government employees (180 | 3.2%) make up the most common classes of employment.
| Employer Class | # Employees | % Employees |
| Private Company Employees | 4,661 | 82.1% |
| Self-Employed (Incorporated) | 98 | 1.7% |
| Self-Employed (Not Incorporated) | 141 | 2.5% |
| Not-for-profit Organizations | 368 | 6.5% |
| Local Government Employees | 180 | 3.2% |
| State Government Employees | 156 | 2.8% |
| Federal Government Employees | 47 | 0.8% |
| Unpaid Family Workers | 28 | 0.5% |
| Total | 5,679 | 100.0% |
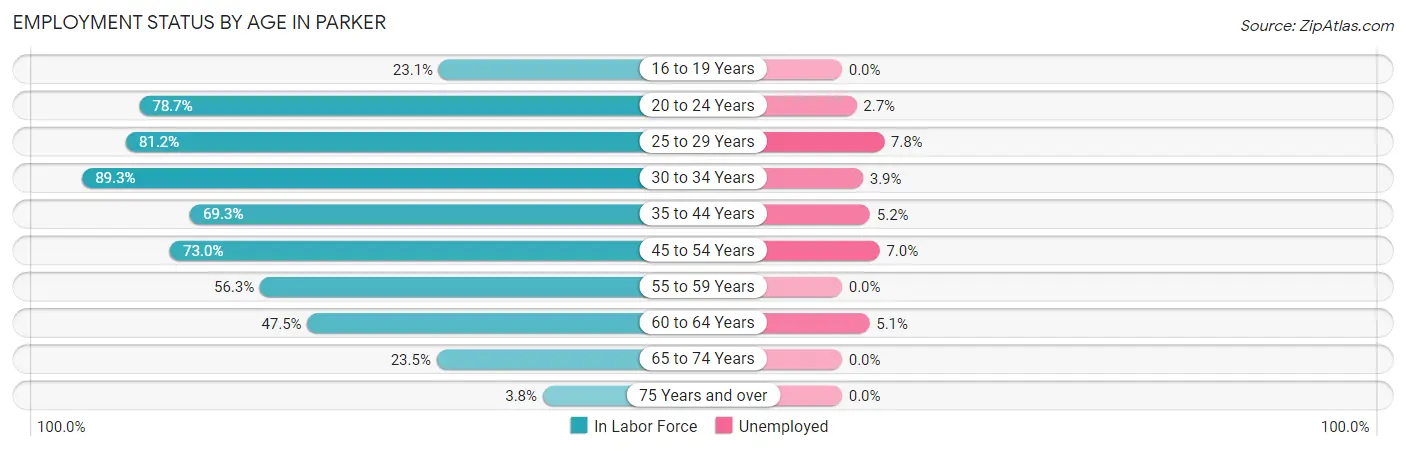
Employment Status by Age in Parker
According to the labor force statistics for Parker, out of the total population over 16 years of age (9,651), 63.1% or 6,090 individuals are in the labor force, with 4.8% or 292 of them unemployed. The age group with the highest labor force participation rate is 30 to 34 years, with 89.3% or 887 individuals in the labor force. Within the labor force, the 25 to 29 years age range has the highest percentage of unemployed individuals, with 7.8% or 78 of them being unemployed.
| Age Bracket | In Labor Force | Unemployed |
| 16 to 19 Years | 111 (23.1%) | 0 (0.0%) |
| 20 to 24 Years | 974 (78.7%) | 26 (2.7%) |
| 25 to 29 Years | 1,002 (81.2%) | 78 (7.8%) |
| 30 to 34 Years | 887 (89.3%) | 35 (3.9%) |
| 35 to 44 Years | 931 (69.3%) | 48 (5.2%) |
| 45 to 54 Years | 1,242 (73.0%) | 87 (7.0%) |
| 55 to 59 Years | 414 (56.3%) | 0 (0.0%) |
| 60 to 64 Years | 354 (47.5%) | 18 (5.1%) |
| 65 to 74 Years | 152 (23.5%) | 0 (0.0%) |
| 75 Years and over | 20 (3.8%) | 0 (0.0%) |
| Total | 6,090 (63.1%) | 292 (4.8%) |
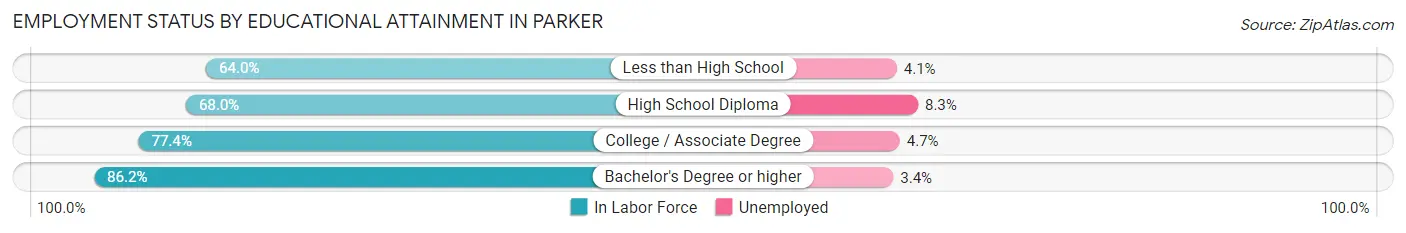
Employment Status by Educational Attainment in Parker
According to labor force statistics for Parker, 71.5% of individuals (4,828) out of the total population between 25 and 64 years of age (6,753) are in the labor force, with 5.5% or 266 of them being unemployed. The group with the highest labor force participation rate are those with the educational attainment of bachelor's degree or higher, with 86.2% or 916 individuals in the labor force. Within the labor force, individuals with high school diploma education have the highest percentage of unemployment, with 8.3% or 132 of them being unemployed.
| Educational Attainment | In Labor Force | Unemployed |
| Less than High School | 1,284 (64.0%) | 82 (4.1%) |
| High School Diploma | 1,586 (68.0%) | 194 (8.3%) |
| College / Associate Degree | 1,046 (77.4%) | 63 (4.7%) |
| Bachelor's Degree or higher | 916 (86.2%) | 36 (3.4%) |
| Total | 4,828 (71.5%) | 371 (5.5%) |
Employment Occupations by Sex in Parker
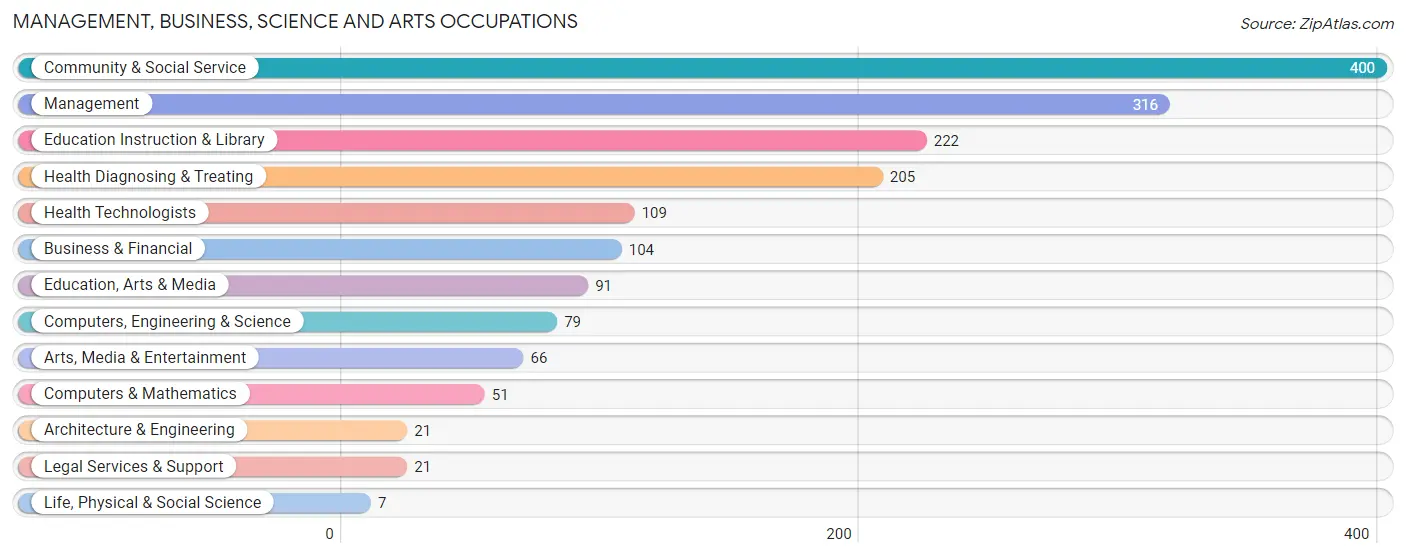
Management, Business, Science and Arts Occupations
The most common Management, Business, Science and Arts occupations in Parker are Community & Social Service (400 | 6.9%), Management (316 | 5.5%), Education Instruction & Library (222 | 3.8%), Health Diagnosing & Treating (205 | 3.5%), and Health Technologists (109 | 1.9%).
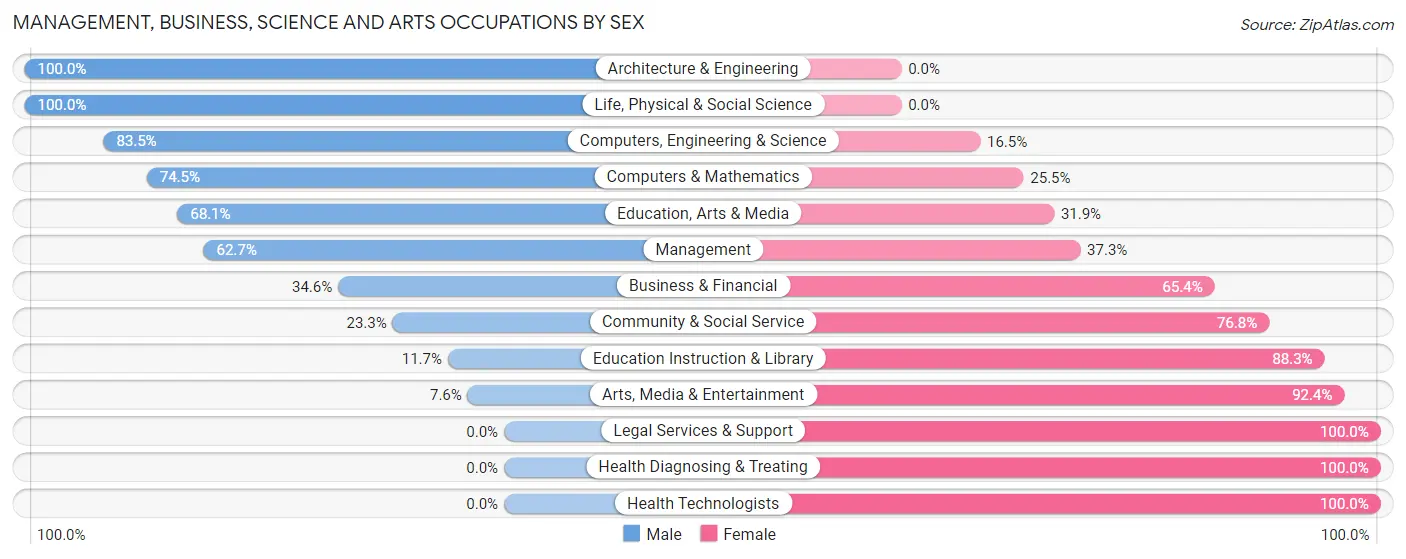
Management, Business, Science and Arts Occupations by Sex
Within the Management, Business, Science and Arts occupations in Parker, the most male-oriented occupations are Architecture & Engineering (100.0%), Life, Physical & Social Science (100.0%), and Computers, Engineering & Science (83.5%), while the most female-oriented occupations are Legal Services & Support (100.0%), Health Diagnosing & Treating (100.0%), and Health Technologists (100.0%).
| Occupation | Male | Female |
| Management | 198 (62.7%) | 118 (37.3%) |
| Business & Financial | 36 (34.6%) | 68 (65.4%) |
| Computers, Engineering & Science | 66 (83.5%) | 13 (16.5%) |
| Computers & Mathematics | 38 (74.5%) | 13 (25.5%) |
| Architecture & Engineering | 21 (100.0%) | 0 (0.0%) |
| Life, Physical & Social Science | 7 (100.0%) | 0 (0.0%) |
| Community & Social Service | 93 (23.3%) | 307 (76.7%) |
| Education, Arts & Media | 62 (68.1%) | 29 (31.9%) |
| Legal Services & Support | 0 (0.0%) | 21 (100.0%) |
| Education Instruction & Library | 26 (11.7%) | 196 (88.3%) |
| Arts, Media & Entertainment | 5 (7.6%) | 61 (92.4%) |
| Health Diagnosing & Treating | 0 (0.0%) | 205 (100.0%) |
| Health Technologists | 0 (0.0%) | 109 (100.0%) |
| Total (Category) | 393 (35.6%) | 711 (64.4%) |
| Total (Overall) | 3,155 (54.5%) | 2,631 (45.5%) |
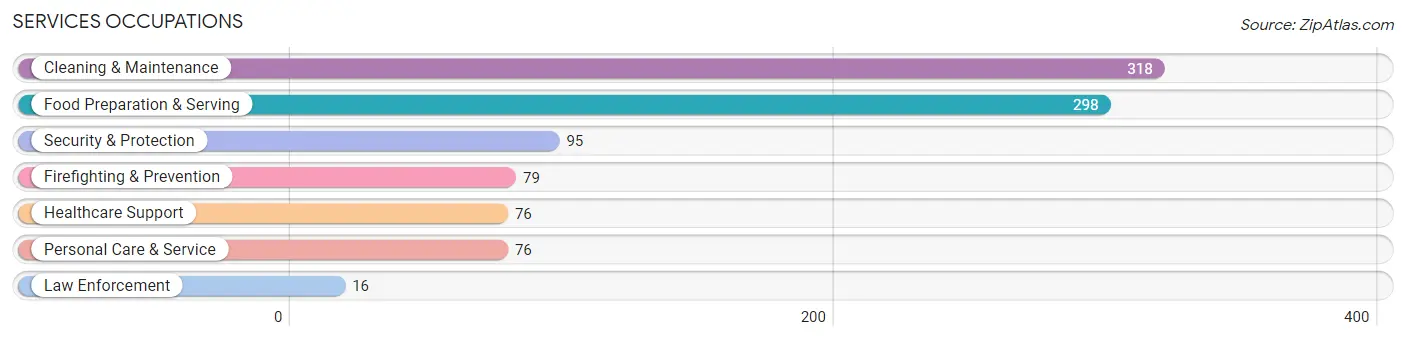
Services Occupations
The most common Services occupations in Parker are Cleaning & Maintenance (318 | 5.5%), Food Preparation & Serving (298 | 5.1%), Security & Protection (95 | 1.6%), Firefighting & Prevention (79 | 1.4%), and Healthcare Support (76 | 1.3%).
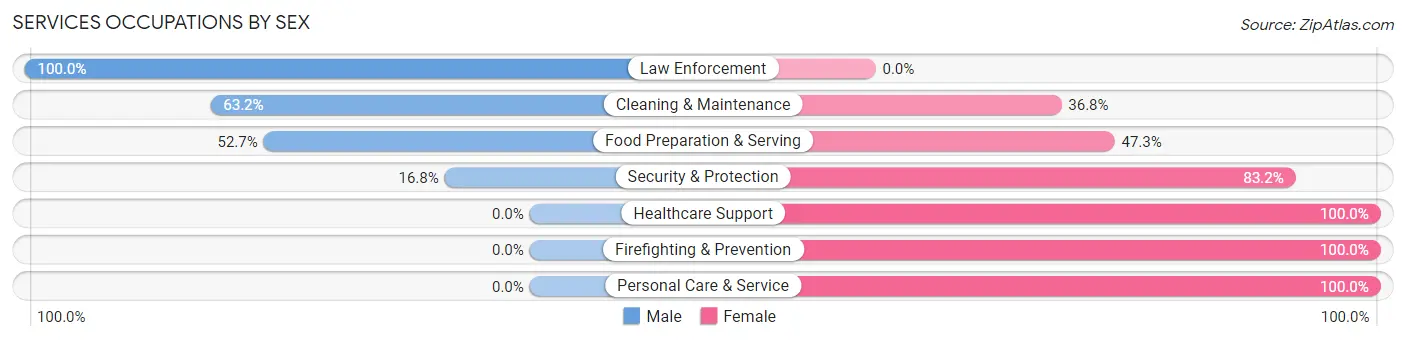
Services Occupations by Sex
Within the Services occupations in Parker, the most male-oriented occupations are Law Enforcement (100.0%), Cleaning & Maintenance (63.2%), and Food Preparation & Serving (52.7%), while the most female-oriented occupations are Healthcare Support (100.0%), Firefighting & Prevention (100.0%), and Personal Care & Service (100.0%).
| Occupation | Male | Female |
| Healthcare Support | 0 (0.0%) | 76 (100.0%) |
| Security & Protection | 16 (16.8%) | 79 (83.2%) |
| Firefighting & Prevention | 0 (0.0%) | 79 (100.0%) |
| Law Enforcement | 16 (100.0%) | 0 (0.0%) |
| Food Preparation & Serving | 157 (52.7%) | 141 (47.3%) |
| Cleaning & Maintenance | 201 (63.2%) | 117 (36.8%) |
| Personal Care & Service | 0 (0.0%) | 76 (100.0%) |
| Total (Category) | 374 (43.3%) | 489 (56.7%) |
| Total (Overall) | 3,155 (54.5%) | 2,631 (45.5%) |
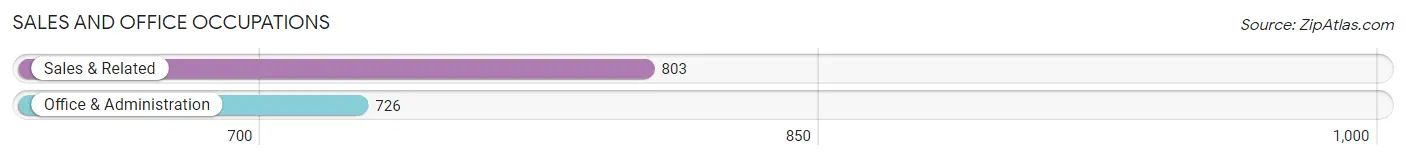
Sales and Office Occupations
The most common Sales and Office occupations in Parker are Sales & Related (803 | 13.9%), and Office & Administration (726 | 12.6%).
Sales and Office Occupations by Sex
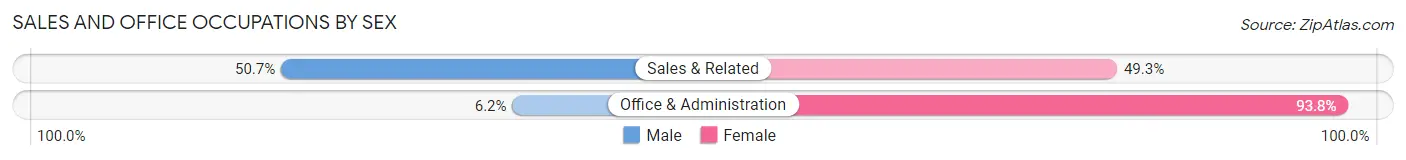
| Occupation | Male | Female |
| Sales & Related | 407 (50.7%) | 396 (49.3%) |
| Office & Administration | 45 (6.2%) | 681 (93.8%) |
| Total (Category) | 452 (29.6%) | 1,077 (70.4%) |
| Total (Overall) | 3,155 (54.5%) | 2,631 (45.5%) |
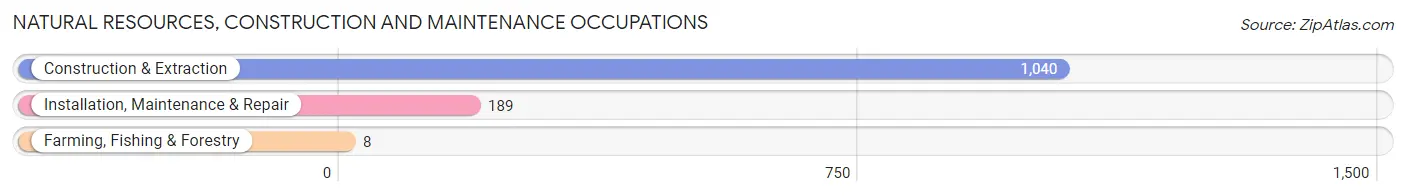
Natural Resources, Construction and Maintenance Occupations
The most common Natural Resources, Construction and Maintenance occupations in Parker are Construction & Extraction (1,040 | 18.0%), Installation, Maintenance & Repair (189 | 3.3%), and Farming, Fishing & Forestry (8 | 0.1%).
Natural Resources, Construction and Maintenance Occupations by Sex
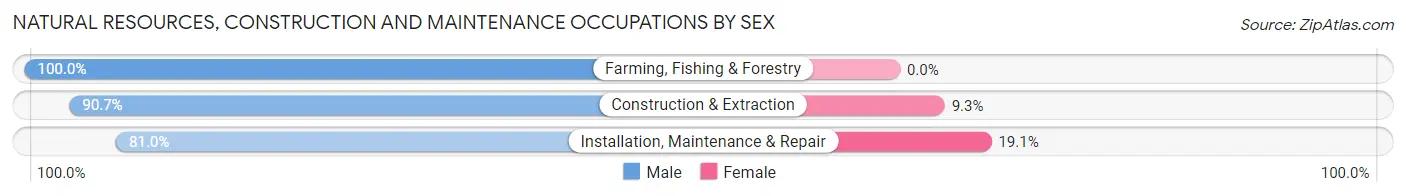
| Occupation | Male | Female |
| Farming, Fishing & Forestry | 8 (100.0%) | 0 (0.0%) |
| Construction & Extraction | 943 (90.7%) | 97 (9.3%) |
| Installation, Maintenance & Repair | 153 (80.9%) | 36 (19.1%) |
| Total (Category) | 1,104 (89.2%) | 133 (10.7%) |
| Total (Overall) | 3,155 (54.5%) | 2,631 (45.5%) |
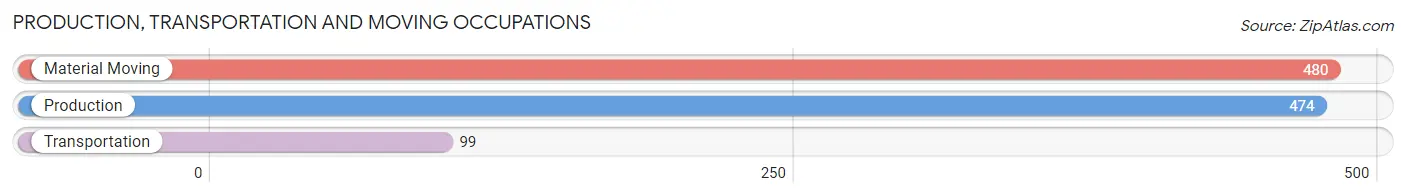
Production, Transportation and Moving Occupations
The most common Production, Transportation and Moving occupations in Parker are Material Moving (480 | 8.3%), Production (474 | 8.2%), and Transportation (99 | 1.7%).
Production, Transportation and Moving Occupations by Sex
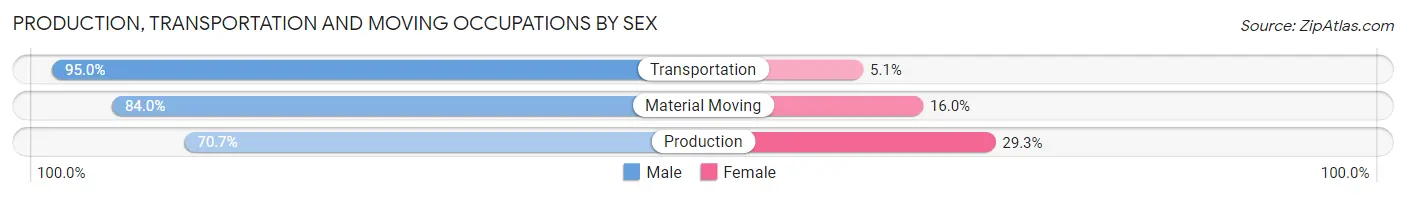
| Occupation | Male | Female |
| Production | 335 (70.7%) | 139 (29.3%) |
| Transportation | 94 (95.0%) | 5 (5.1%) |
| Material Moving | 403 (84.0%) | 77 (16.0%) |
| Total (Category) | 832 (79.0%) | 221 (21.0%) |
| Total (Overall) | 3,155 (54.5%) | 2,631 (45.5%) |
Employment Industries by Sex in Parker
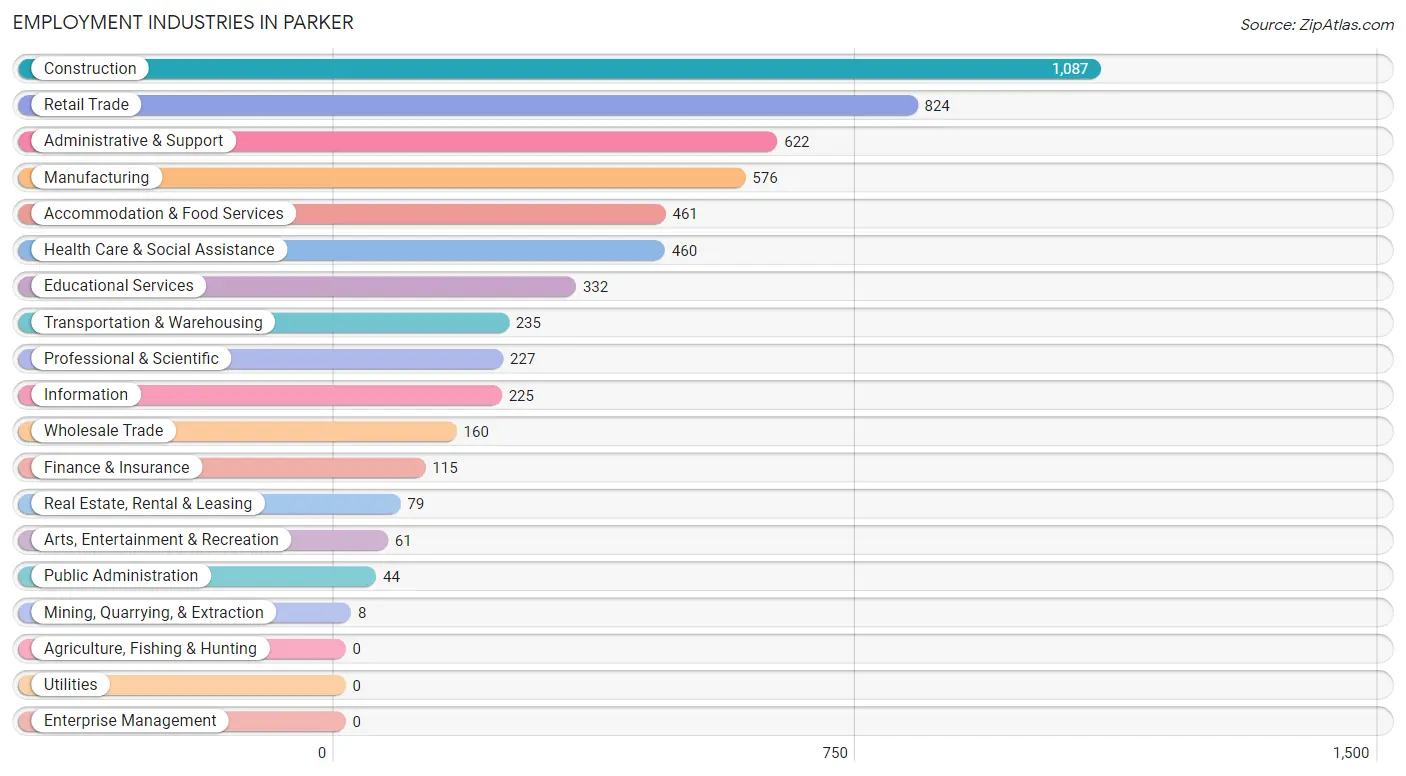
Employment Industries in Parker
The major employment industries in Parker include Construction (1,087 | 18.8%), Retail Trade (824 | 14.2%), Administrative & Support (622 | 10.7%), Manufacturing (576 | 10.0%), and Accommodation & Food Services (461 | 8.0%).
Employment Industries by Sex in Parker
The Parker industries that see more men than women are Mining, Quarrying, & Extraction (100.0%), Information (95.6%), and Construction (90.0%), whereas the industries that tend to have a higher number of women are Finance & Insurance (100.0%), Health Care & Social Assistance (100.0%), and Arts, Entertainment & Recreation (73.8%).
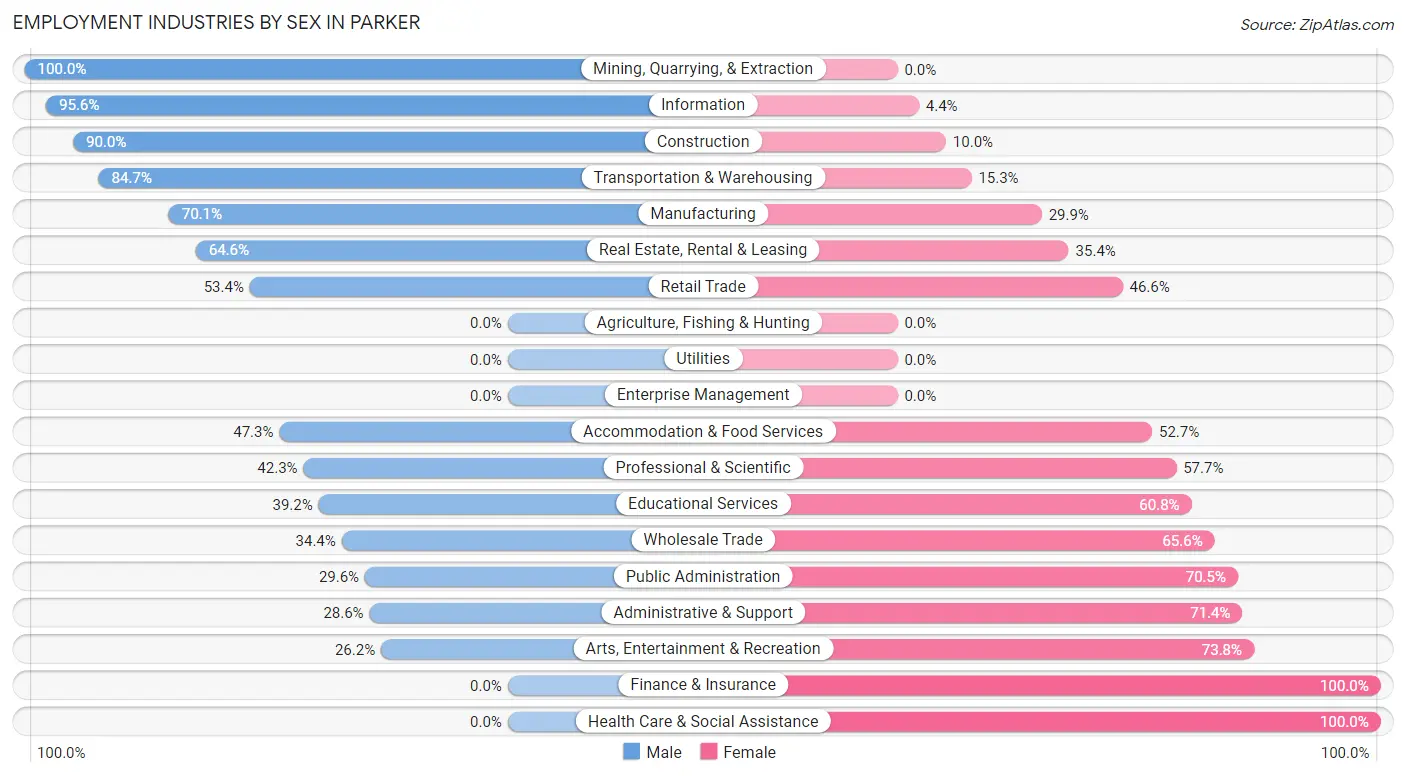
| Industry | Male | Female |
| Agriculture, Fishing & Hunting | 0 (0.0%) | 0 (0.0%) |
| Mining, Quarrying, & Extraction | 8 (100.0%) | 0 (0.0%) |
| Construction | 978 (90.0%) | 109 (10.0%) |
| Manufacturing | 404 (70.1%) | 172 (29.9%) |
| Wholesale Trade | 55 (34.4%) | 105 (65.6%) |
| Retail Trade | 440 (53.4%) | 384 (46.6%) |
| Transportation & Warehousing | 199 (84.7%) | 36 (15.3%) |
| Utilities | 0 (0.0%) | 0 (0.0%) |
| Information | 215 (95.6%) | 10 (4.4%) |
| Finance & Insurance | 0 (0.0%) | 115 (100.0%) |
| Real Estate, Rental & Leasing | 51 (64.6%) | 28 (35.4%) |
| Professional & Scientific | 96 (42.3%) | 131 (57.7%) |
| Enterprise Management | 0 (0.0%) | 0 (0.0%) |
| Administrative & Support | 178 (28.6%) | 444 (71.4%) |
| Educational Services | 130 (39.2%) | 202 (60.8%) |
| Health Care & Social Assistance | 0 (0.0%) | 460 (100.0%) |
| Arts, Entertainment & Recreation | 16 (26.2%) | 45 (73.8%) |
| Accommodation & Food Services | 218 (47.3%) | 243 (52.7%) |
| Public Administration | 13 (29.5%) | 31 (70.5%) |
| Total | 3,155 (54.5%) | 2,631 (45.5%) |
Education in Parker
School Enrollment in Parker
The most common levels of schooling among the 2,841 students in Parker are high school (828 | 29.1%), middle school (576 | 20.3%), and college / undergraduate (488 | 17.2%).
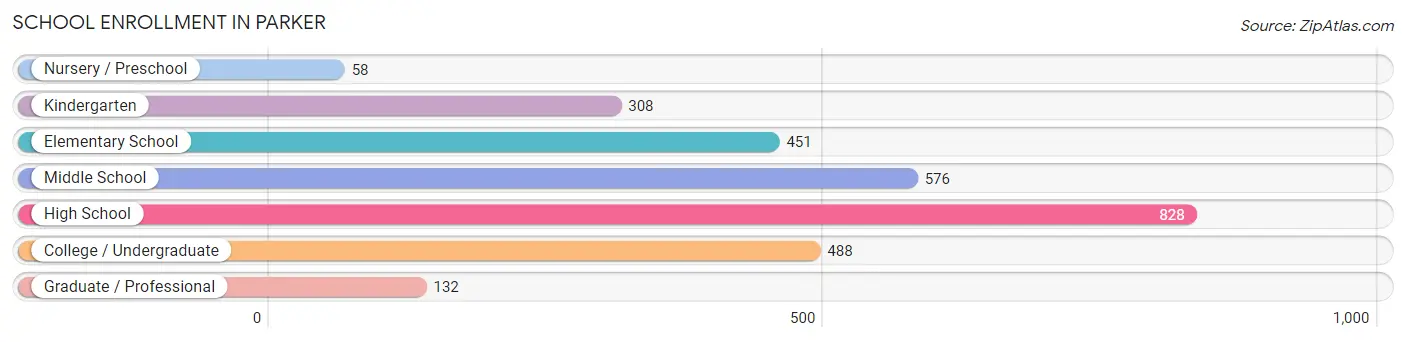
| School Level | # Students | % Students |
| Nursery / Preschool | 58 | 2.0% |
| Kindergarten | 308 | 10.8% |
| Elementary School | 451 | 15.9% |
| Middle School | 576 | 20.3% |
| High School | 828 | 29.1% |
| College / Undergraduate | 488 | 17.2% |
| Graduate / Professional | 132 | 4.6% |
| Total | 2,841 | 100.0% |
School Enrollment by Age by Funding Source in Parker
Out of a total of 2,841 students who are enrolled in schools in Parker, 412 (14.5%) attend a private institution, while the remaining 2,429 (85.5%) are enrolled in public schools. The age group of 3 to 4 year olds has the highest likelihood of being enrolled in private schools, with 22 (55.0% in the age bracket) enrolled. Conversely, the age group of 25 to 34 year olds has the lowest likelihood of being enrolled in a private school, with 79 (100.0% in the age bracket) attending a public institution.
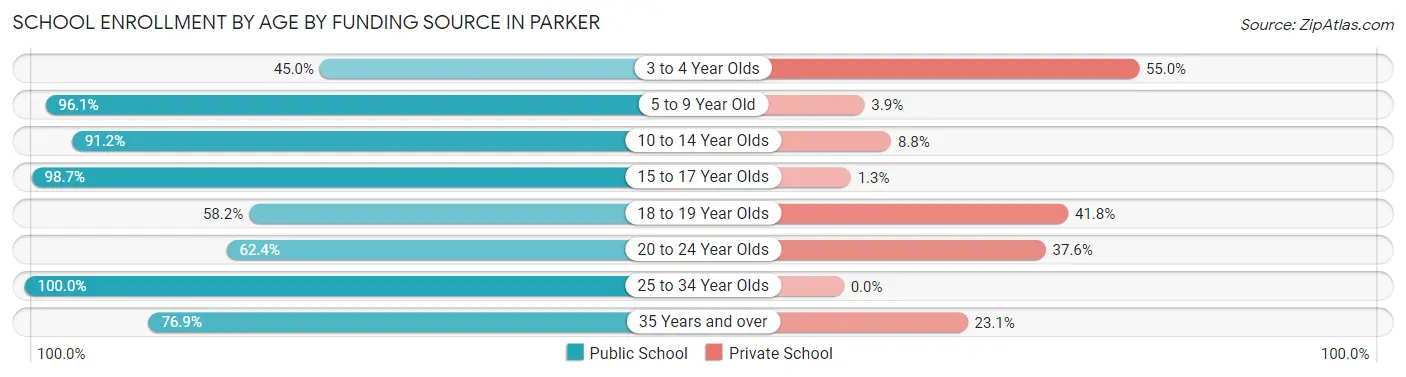
| Age Bracket | Public School | Private School |
| 3 to 4 Year Olds | 18 (45.0%) | 22 (55.0%) |
| 5 to 9 Year Old | 672 (96.1%) | 27 (3.9%) |
| 10 to 14 Year Olds | 704 (91.2%) | 68 (8.8%) |
| 15 to 17 Year Olds | 450 (98.7%) | 6 (1.3%) |
| 18 to 19 Year Olds | 71 (58.2%) | 51 (41.8%) |
| 20 to 24 Year Olds | 355 (62.4%) | 214 (37.6%) |
| 25 to 34 Year Olds | 79 (100.0%) | 0 (0.0%) |
| 35 Years and over | 80 (76.9%) | 24 (23.1%) |
| Total | 2,429 (85.5%) | 412 (14.5%) |
Educational Attainment by Field of Study in Parker
Business (305 | 22.3%), arts & humanities (252 | 18.4%), science & technology (127 | 9.3%), social sciences (98 | 7.2%), and education (95 | 6.9%) are the most common fields of study among 1,369 individuals in Parker who have obtained a bachelor's degree or higher.
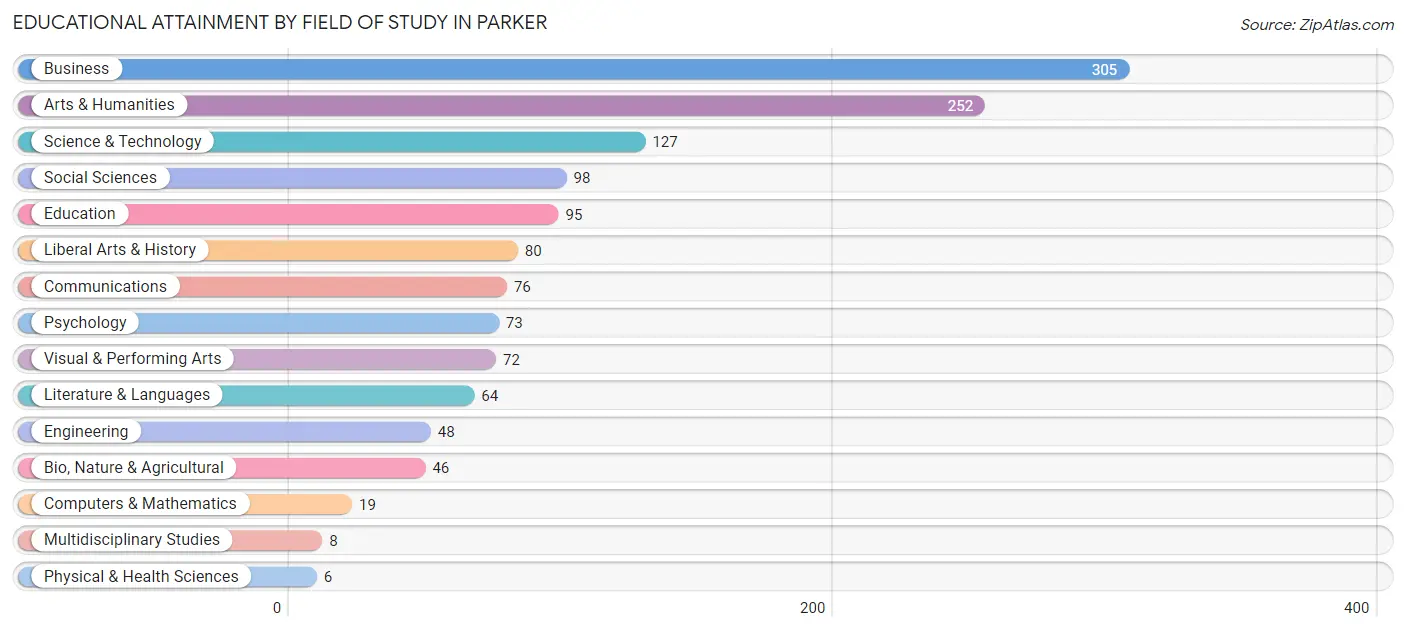
| Field of Study | # Graduates | % Graduates |
| Computers & Mathematics | 19 | 1.4% |
| Bio, Nature & Agricultural | 46 | 3.4% |
| Physical & Health Sciences | 6 | 0.4% |
| Psychology | 73 | 5.3% |
| Social Sciences | 98 | 7.2% |
| Engineering | 48 | 3.5% |
| Multidisciplinary Studies | 8 | 0.6% |
| Science & Technology | 127 | 9.3% |
| Business | 305 | 22.3% |
| Education | 95 | 6.9% |
| Literature & Languages | 64 | 4.7% |
| Liberal Arts & History | 80 | 5.8% |
| Visual & Performing Arts | 72 | 5.3% |
| Communications | 76 | 5.6% |
| Arts & Humanities | 252 | 18.4% |
| Total | 1,369 | 100.0% |
Transportation & Commute in Parker
Vehicle Availability by Sex in Parker
The most prevalent vehicle ownership categories in Parker are males with 2 vehicles (1,793, accounting for 57.1%) and females with 2 vehicles (976, making up 70.7%).
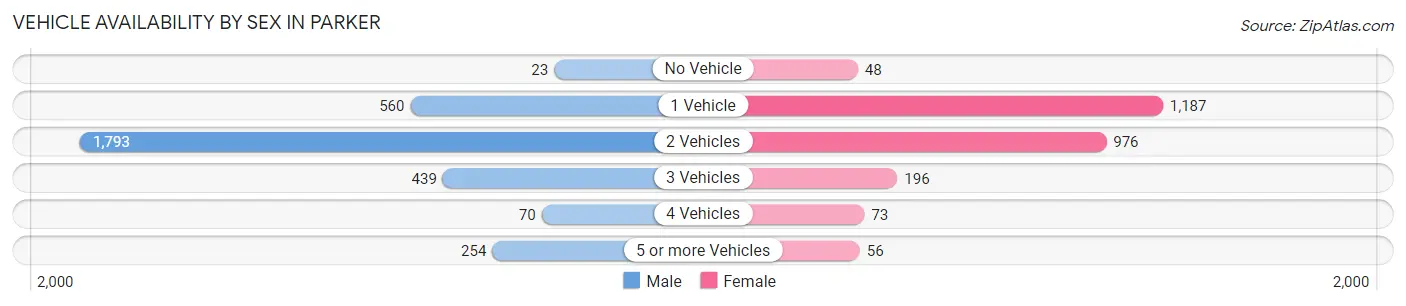
| Vehicles Available | Male | Female |
| No Vehicle | 23 (0.7%) | 48 (1.9%) |
| 1 Vehicle | 560 (17.8%) | 1,187 (46.8%) |
| 2 Vehicles | 1,793 (57.1%) | 976 (38.5%) |
| 3 Vehicles | 439 (14.0%) | 196 (7.7%) |
| 4 Vehicles | 70 (2.2%) | 73 (2.9%) |
| 5 or more Vehicles | 254 (8.1%) | 56 (2.2%) |
| Total | 3,139 (100.0%) | 2,536 (100.0%) |
Commute Time in Parker
The most frequently occuring commute durations in Parker are 15 to 19 minutes (878 commuters, 18.3%), 10 to 14 minutes (829 commuters, 17.3%), and 30 to 34 minutes (794 commuters, 16.5%).
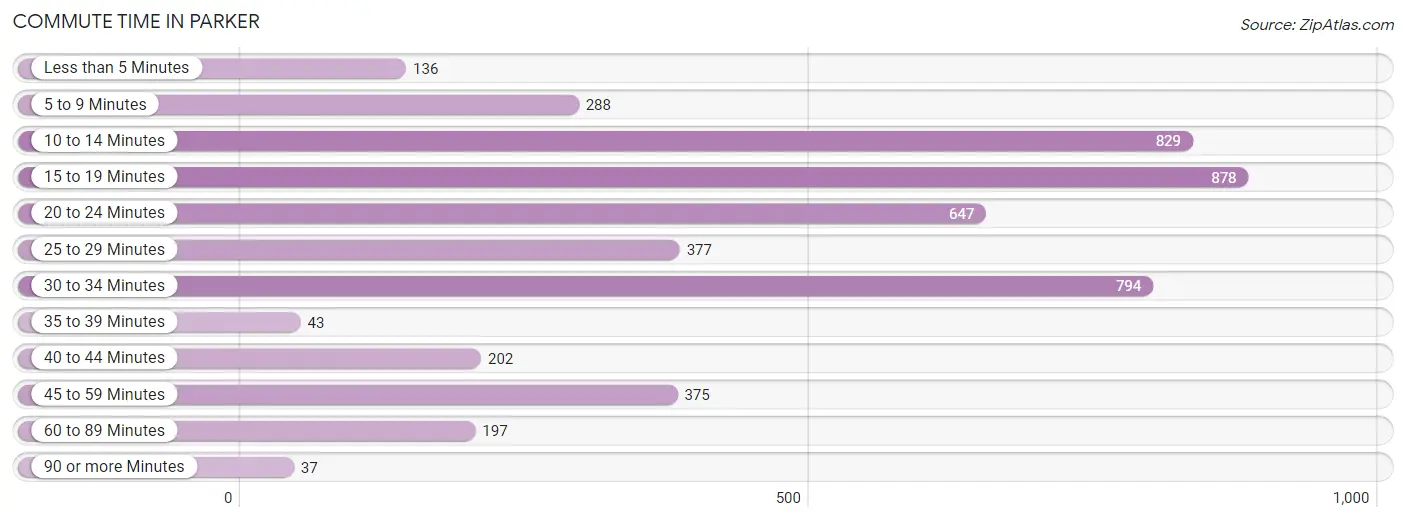
| Commute Time | # Commuters | % Commuters |
| Less than 5 Minutes | 136 | 2.8% |
| 5 to 9 Minutes | 288 | 6.0% |
| 10 to 14 Minutes | 829 | 17.3% |
| 15 to 19 Minutes | 878 | 18.3% |
| 20 to 24 Minutes | 647 | 13.5% |
| 25 to 29 Minutes | 377 | 7.9% |
| 30 to 34 Minutes | 794 | 16.5% |
| 35 to 39 Minutes | 43 | 0.9% |
| 40 to 44 Minutes | 202 | 4.2% |
| 45 to 59 Minutes | 375 | 7.8% |
| 60 to 89 Minutes | 197 | 4.1% |
| 90 or more Minutes | 37 | 0.8% |
Commute Time by Sex in Parker
The most common commute times in Parker are 30 to 34 minutes (580 commuters, 21.1%) for males and 10 to 14 minutes (444 commuters, 21.6%) for females.
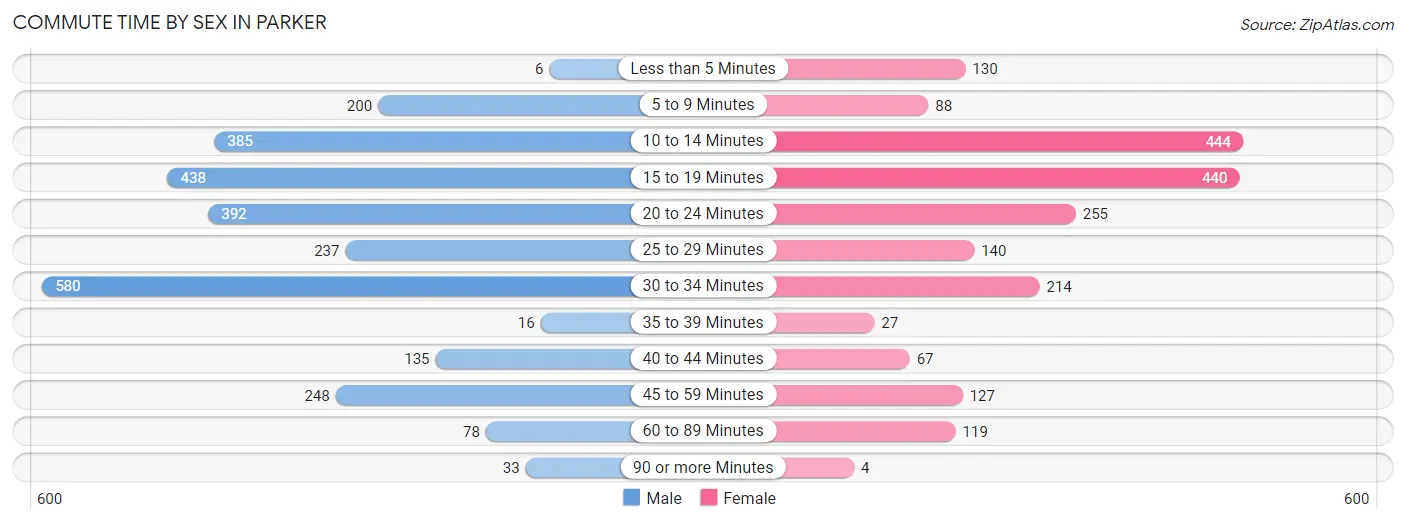
| Commute Time | Male | Female |
| Less than 5 Minutes | 6 (0.2%) | 130 (6.3%) |
| 5 to 9 Minutes | 200 (7.3%) | 88 (4.3%) |
| 10 to 14 Minutes | 385 (14.0%) | 444 (21.6%) |
| 15 to 19 Minutes | 438 (15.9%) | 440 (21.4%) |
| 20 to 24 Minutes | 392 (14.3%) | 255 (12.4%) |
| 25 to 29 Minutes | 237 (8.6%) | 140 (6.8%) |
| 30 to 34 Minutes | 580 (21.1%) | 214 (10.4%) |
| 35 to 39 Minutes | 16 (0.6%) | 27 (1.3%) |
| 40 to 44 Minutes | 135 (4.9%) | 67 (3.3%) |
| 45 to 59 Minutes | 248 (9.0%) | 127 (6.2%) |
| 60 to 89 Minutes | 78 (2.8%) | 119 (5.8%) |
| 90 or more Minutes | 33 (1.2%) | 4 (0.2%) |
Time of Departure to Work by Sex in Parker
The most frequent times of departure to work in Parker are 6:00 AM to 6:29 AM (427, 15.5%) for males and 8:00 AM to 8:29 AM (335, 16.3%) for females.
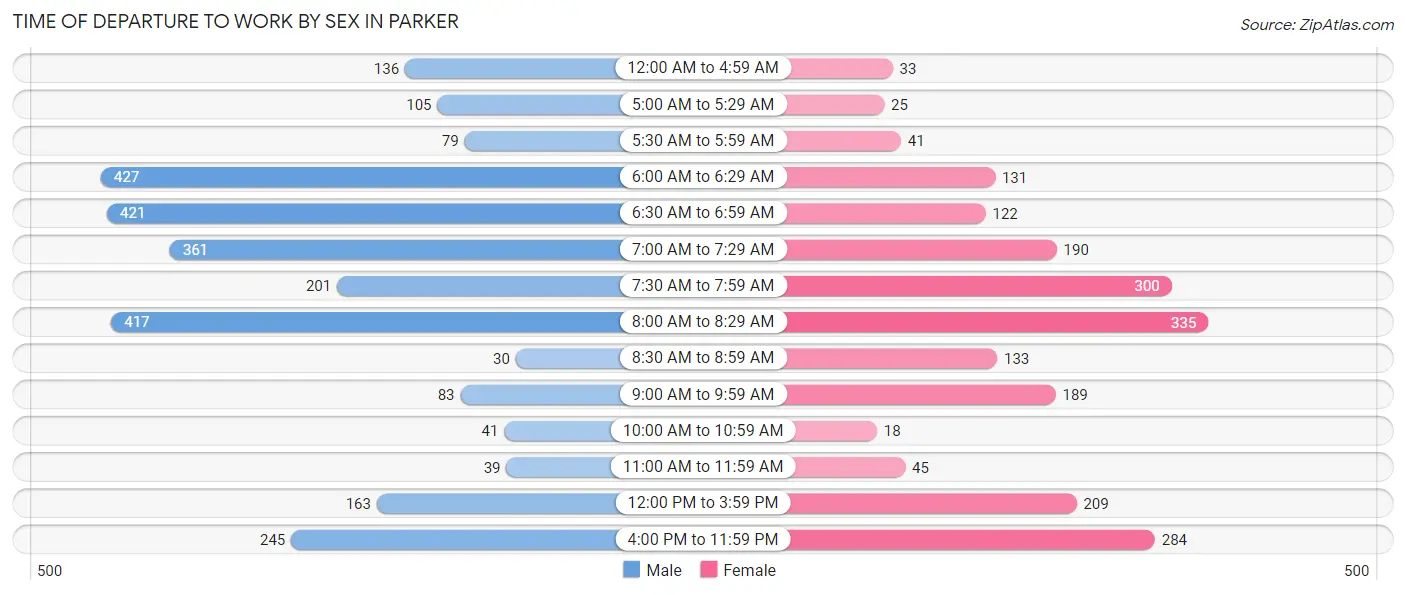
| Time of Departure | Male | Female |
| 12:00 AM to 4:59 AM | 136 (5.0%) | 33 (1.6%) |
| 5:00 AM to 5:29 AM | 105 (3.8%) | 25 (1.2%) |
| 5:30 AM to 5:59 AM | 79 (2.9%) | 41 (2.0%) |
| 6:00 AM to 6:29 AM | 427 (15.5%) | 131 (6.4%) |
| 6:30 AM to 6:59 AM | 421 (15.3%) | 122 (5.9%) |
| 7:00 AM to 7:29 AM | 361 (13.1%) | 190 (9.2%) |
| 7:30 AM to 7:59 AM | 201 (7.3%) | 300 (14.6%) |
| 8:00 AM to 8:29 AM | 417 (15.2%) | 335 (16.3%) |
| 8:30 AM to 8:59 AM | 30 (1.1%) | 133 (6.5%) |
| 9:00 AM to 9:59 AM | 83 (3.0%) | 189 (9.2%) |
| 10:00 AM to 10:59 AM | 41 (1.5%) | 18 (0.9%) |
| 11:00 AM to 11:59 AM | 39 (1.4%) | 45 (2.2%) |
| 12:00 PM to 3:59 PM | 163 (5.9%) | 209 (10.2%) |
| 4:00 PM to 11:59 PM | 245 (8.9%) | 284 (13.8%) |
| Total | 2,748 (100.0%) | 2,055 (100.0%) |
Housing Occupancy in Parker
Occupancy by Ownership in Parker
Of the total 4,880 dwellings in Parker, owner-occupied units account for 2,071 (42.4%), while renter-occupied units make up 2,809 (57.6%).
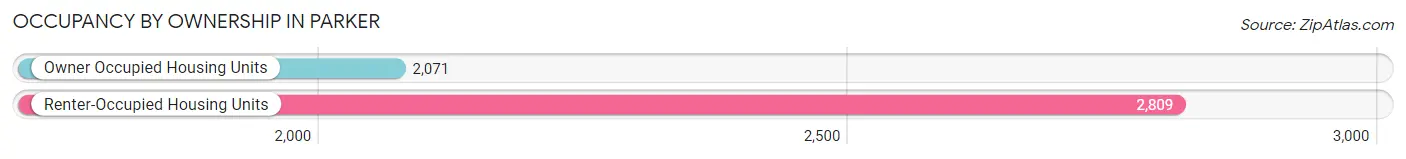
| Occupancy | # Housing Units | % Housing Units |
| Owner Occupied Housing Units | 2,071 | 42.4% |
| Renter-Occupied Housing Units | 2,809 | 57.6% |
| Total Occupied Housing Units | 4,880 | 100.0% |
Occupancy by Household Size in Parker
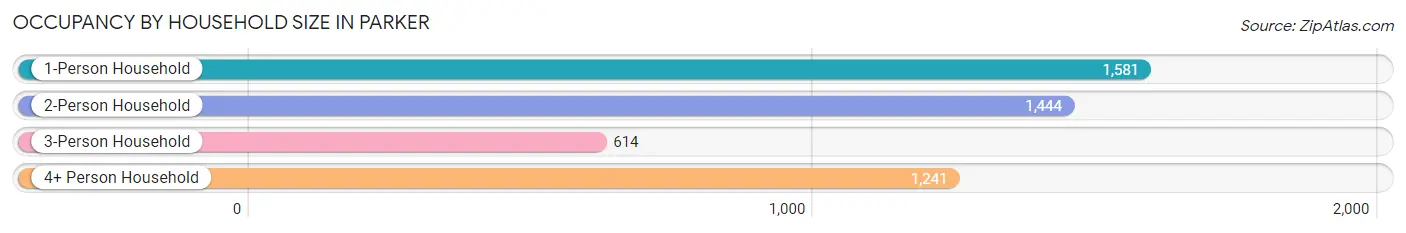
| Household Size | # Housing Units | % Housing Units |
| 1-Person Household | 1,581 | 32.4% |
| 2-Person Household | 1,444 | 29.6% |
| 3-Person Household | 614 | 12.6% |
| 4+ Person Household | 1,241 | 25.4% |
| Total Housing Units | 4,880 | 100.0% |
Occupancy by Ownership by Household Size in Parker
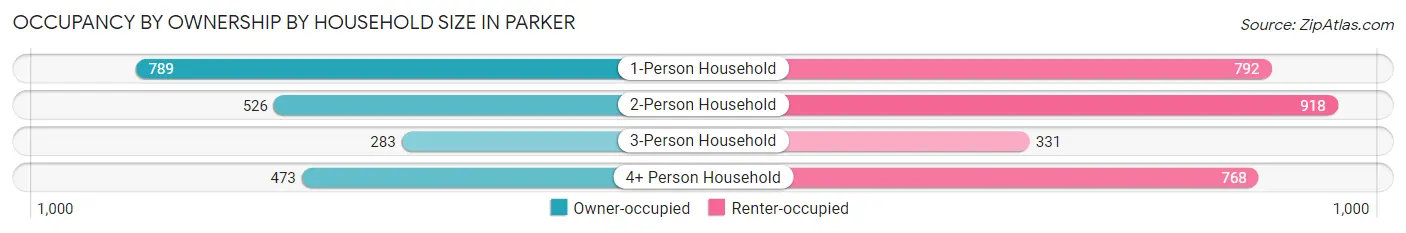
| Household Size | Owner-occupied | Renter-occupied |
| 1-Person Household | 789 (49.9%) | 792 (50.1%) |
| 2-Person Household | 526 (36.4%) | 918 (63.6%) |
| 3-Person Household | 283 (46.1%) | 331 (53.9%) |
| 4+ Person Household | 473 (38.1%) | 768 (61.9%) |
| Total Housing Units | 2,071 (42.4%) | 2,809 (57.6%) |
Occupancy by Educational Attainment in Parker
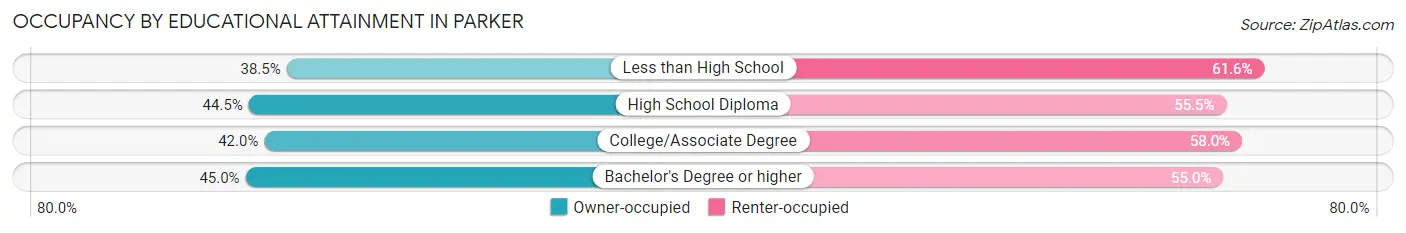
| Household Size | Owner-occupied | Renter-occupied |
| Less than High School | 501 (38.5%) | 802 (61.6%) |
| High School Diploma | 723 (44.5%) | 903 (55.5%) |
| College/Associate Degree | 427 (42.0%) | 590 (58.0%) |
| Bachelor's Degree or higher | 420 (45.0%) | 514 (55.0%) |
Occupancy by Age of Householder in Parker
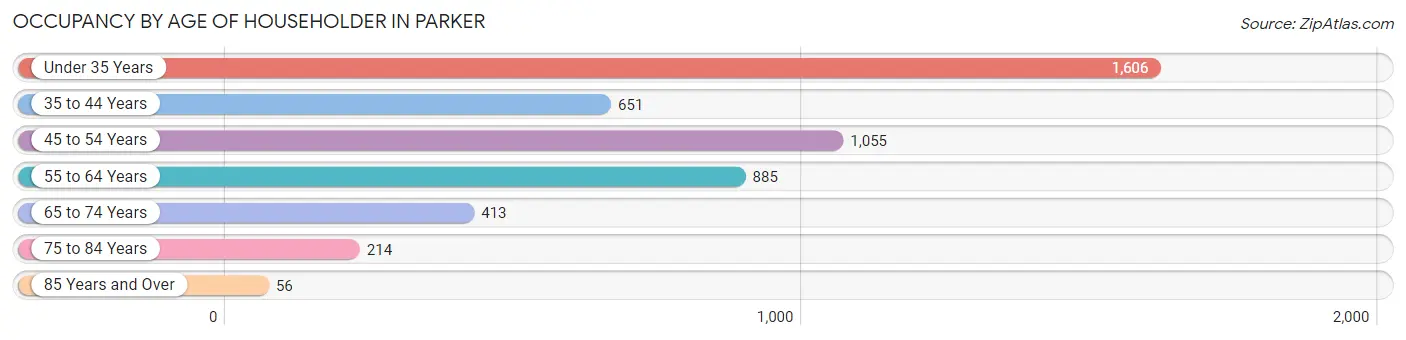
| Age Bracket | # Households | % Households |
| Under 35 Years | 1,606 | 32.9% |
| 35 to 44 Years | 651 | 13.3% |
| 45 to 54 Years | 1,055 | 21.6% |
| 55 to 64 Years | 885 | 18.1% |
| 65 to 74 Years | 413 | 8.5% |
| 75 to 84 Years | 214 | 4.4% |
| 85 Years and Over | 56 | 1.1% |
| Total | 4,880 | 100.0% |
Housing Finances in Parker
Median Income by Occupancy in Parker
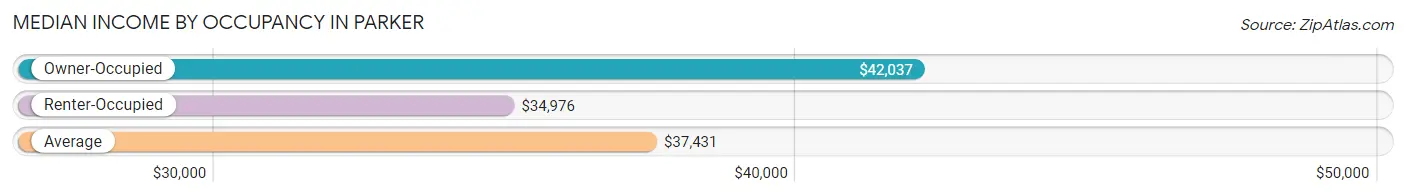
| Occupancy Type | # Households | Median Income |
| Owner-Occupied | 2,071 (42.4%) | $42,037 |
| Renter-Occupied | 2,809 (57.6%) | $34,976 |
| Average | 4,880 (100.0%) | $37,431 |
Occupancy by Householder Income Bracket in Parker
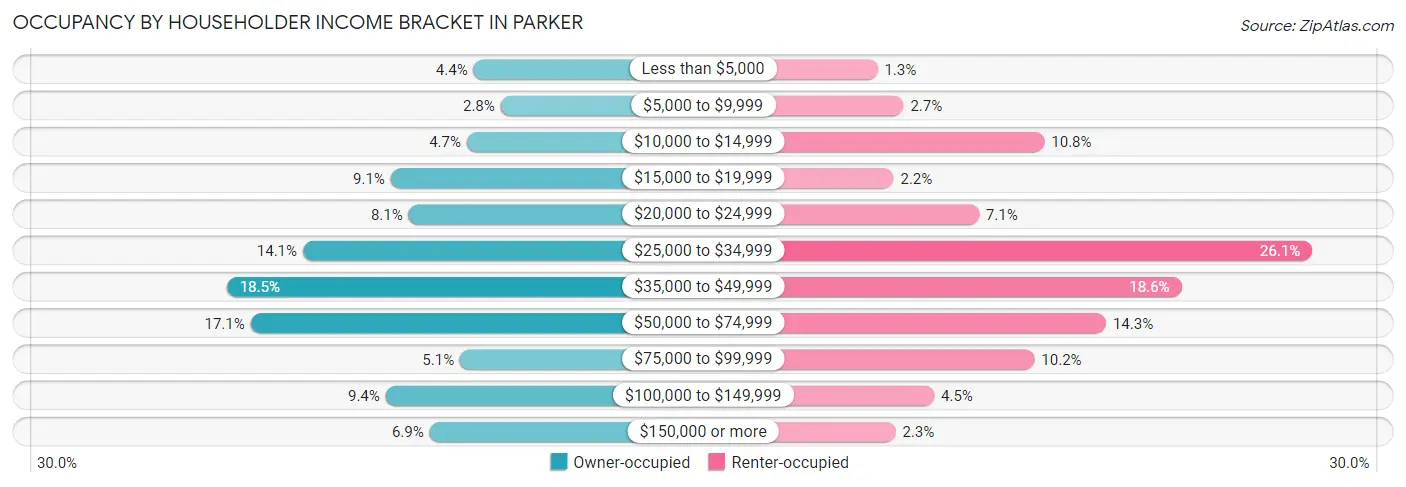
| Income Bracket | Owner-occupied | Renter-occupied |
| Less than $5,000 | 90 (4.3%) | 35 (1.3%) |
| $5,000 to $9,999 | 58 (2.8%) | 77 (2.7%) |
| $10,000 to $14,999 | 98 (4.7%) | 303 (10.8%) |
| $15,000 to $19,999 | 188 (9.1%) | 61 (2.2%) |
| $20,000 to $24,999 | 167 (8.1%) | 198 (7.0%) |
| $25,000 to $34,999 | 292 (14.1%) | 733 (26.1%) |
| $35,000 to $49,999 | 382 (18.4%) | 523 (18.6%) |
| $50,000 to $74,999 | 354 (17.1%) | 402 (14.3%) |
| $75,000 to $99,999 | 106 (5.1%) | 287 (10.2%) |
| $100,000 to $149,999 | 194 (9.4%) | 126 (4.5%) |
| $150,000 or more | 142 (6.9%) | 64 (2.3%) |
| Total | 2,071 (100.0%) | 2,809 (100.0%) |
Monthly Housing Cost Tiers in Parker
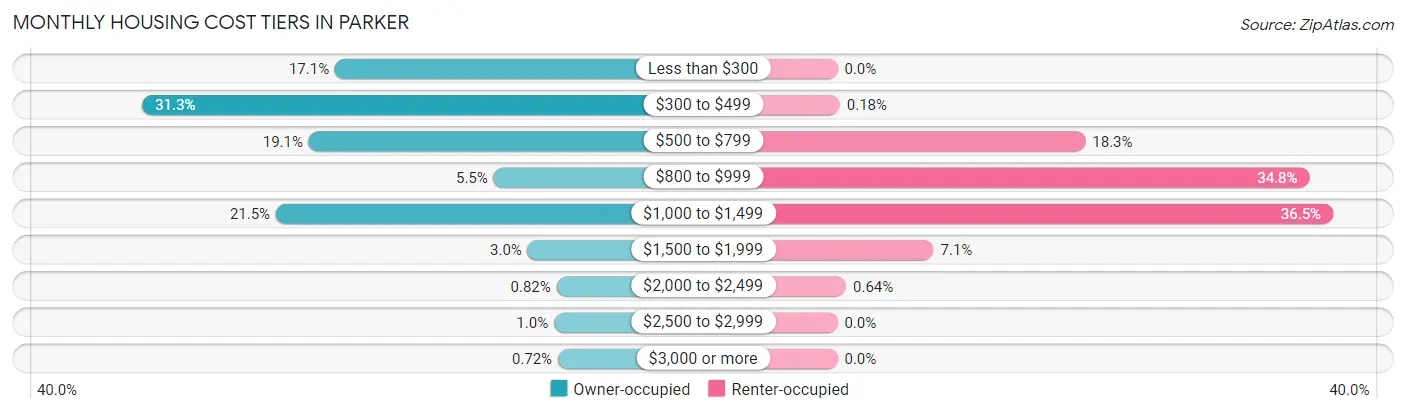
| Monthly Cost | Owner-occupied | Renter-occupied |
| Less than $300 | 355 (17.1%) | 0 (0.0%) |
| $300 to $499 | 649 (31.3%) | 5 (0.2%) |
| $500 to $799 | 395 (19.1%) | 513 (18.3%) |
| $800 to $999 | 113 (5.5%) | 976 (34.7%) |
| $1,000 to $1,499 | 445 (21.5%) | 1,025 (36.5%) |
| $1,500 to $1,999 | 61 (2.9%) | 199 (7.1%) |
| $2,000 to $2,499 | 17 (0.8%) | 18 (0.6%) |
| $2,500 to $2,999 | 21 (1.0%) | 0 (0.0%) |
| $3,000 or more | 15 (0.7%) | 0 (0.0%) |
| Total | 2,071 (100.0%) | 2,809 (100.0%) |
Physical Housing Characteristics in Parker
Housing Structures in Parker
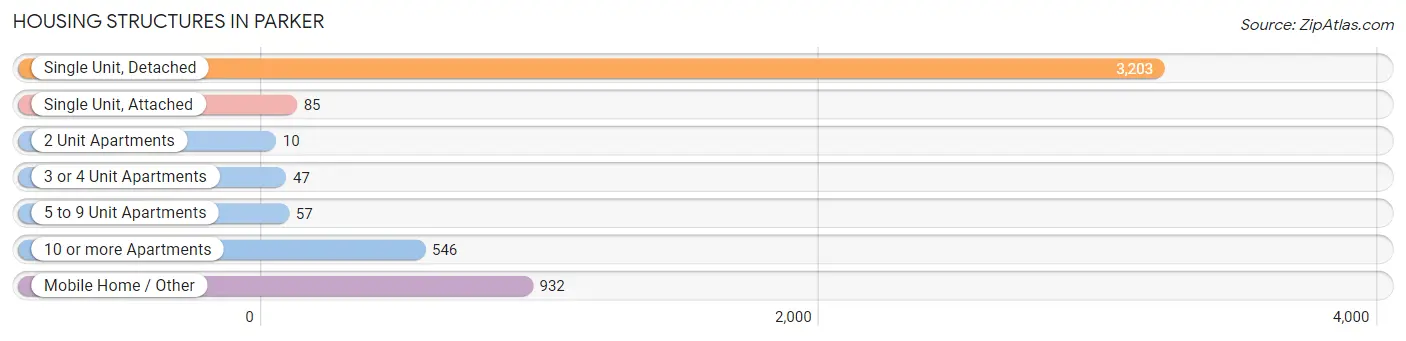
| Structure Type | # Housing Units | % Housing Units |
| Single Unit, Detached | 3,203 | 65.6% |
| Single Unit, Attached | 85 | 1.7% |
| 2 Unit Apartments | 10 | 0.2% |
| 3 or 4 Unit Apartments | 47 | 1.0% |
| 5 to 9 Unit Apartments | 57 | 1.2% |
| 10 or more Apartments | 546 | 11.2% |
| Mobile Home / Other | 932 | 19.1% |
| Total | 4,880 | 100.0% |
Housing Structures by Occupancy in Parker
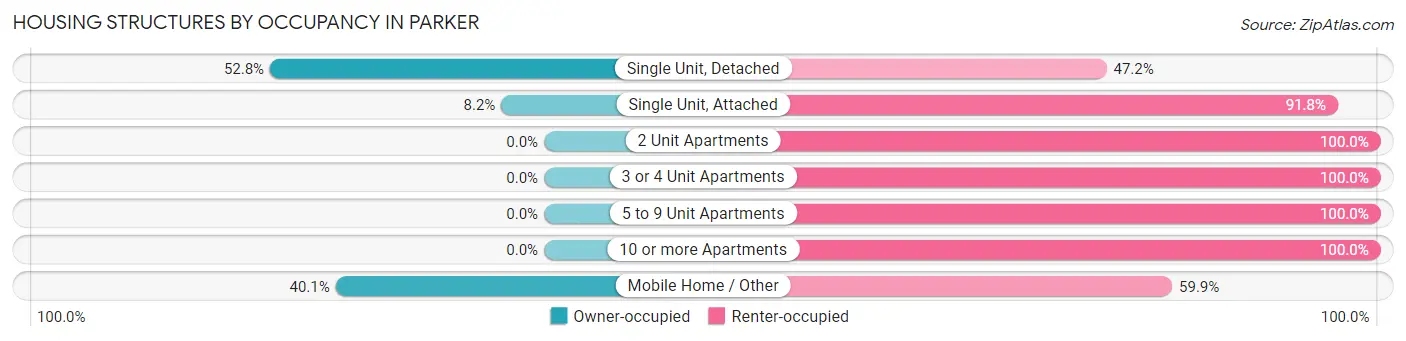
| Structure Type | Owner-occupied | Renter-occupied |
| Single Unit, Detached | 1,690 (52.8%) | 1,513 (47.2%) |
| Single Unit, Attached | 7 (8.2%) | 78 (91.8%) |
| 2 Unit Apartments | 0 (0.0%) | 10 (100.0%) |
| 3 or 4 Unit Apartments | 0 (0.0%) | 47 (100.0%) |
| 5 to 9 Unit Apartments | 0 (0.0%) | 57 (100.0%) |
| 10 or more Apartments | 0 (0.0%) | 546 (100.0%) |
| Mobile Home / Other | 374 (40.1%) | 558 (59.9%) |
| Total | 2,071 (42.4%) | 2,809 (57.6%) |
Housing Structures by Number of Rooms in Parker
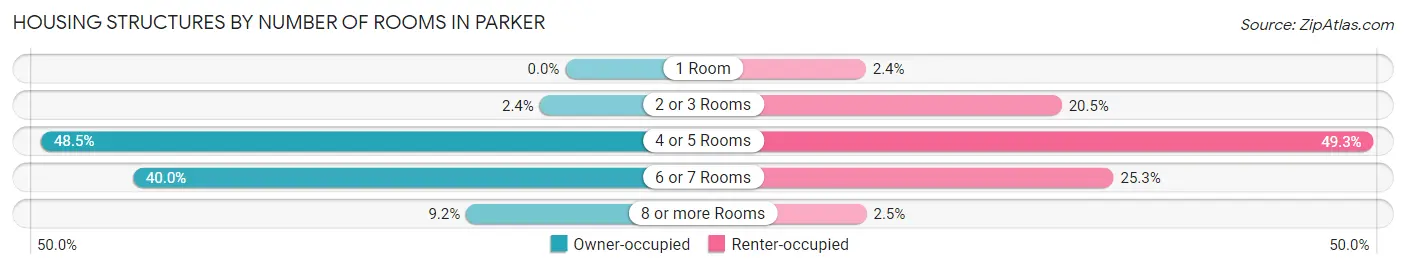
| Number of Rooms | Owner-occupied | Renter-occupied |
| 1 Room | 0 (0.0%) | 67 (2.4%) |
| 2 or 3 Rooms | 49 (2.4%) | 576 (20.5%) |
| 4 or 5 Rooms | 1,004 (48.5%) | 1,386 (49.3%) |
| 6 or 7 Rooms | 828 (40.0%) | 711 (25.3%) |
| 8 or more Rooms | 190 (9.2%) | 69 (2.5%) |
| Total | 2,071 (100.0%) | 2,809 (100.0%) |
Housing Structure by Heating Type in Parker
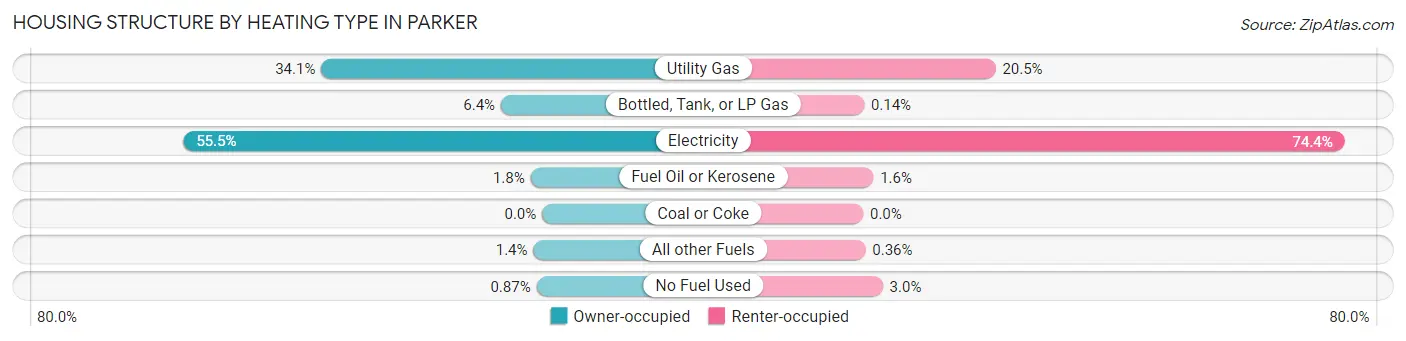
| Heating Type | Owner-occupied | Renter-occupied |
| Utility Gas | 707 (34.1%) | 575 (20.5%) |
| Bottled, Tank, or LP Gas | 132 (6.4%) | 4 (0.1%) |
| Electricity | 1,149 (55.5%) | 2,091 (74.4%) |
| Fuel Oil or Kerosene | 37 (1.8%) | 44 (1.6%) |
| Coal or Coke | 0 (0.0%) | 0 (0.0%) |
| All other Fuels | 28 (1.3%) | 10 (0.4%) |
| No Fuel Used | 18 (0.9%) | 85 (3.0%) |
| Total | 2,071 (100.0%) | 2,809 (100.0%) |
Household Vehicle Usage in Parker
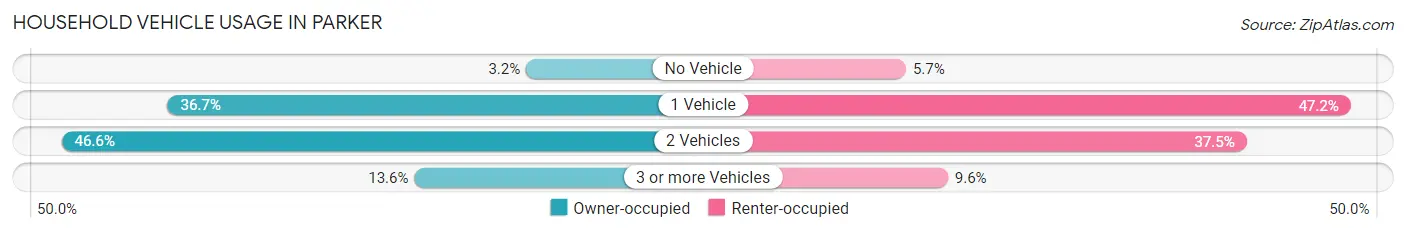
| Vehicles per Household | Owner-occupied | Renter-occupied |
| No Vehicle | 66 (3.2%) | 160 (5.7%) |
| 1 Vehicle | 759 (36.6%) | 1,326 (47.2%) |
| 2 Vehicles | 964 (46.6%) | 1,053 (37.5%) |
| 3 or more Vehicles | 282 (13.6%) | 270 (9.6%) |
| Total | 2,071 (100.0%) | 2,809 (100.0%) |
Real Estate & Mortgages in Parker
Real Estate and Mortgage Overview in Parker
| Characteristic | Without Mortgage | With Mortgage |
| Housing Units | 1,140 | 931 |
| Median Property Value | $91,900 | $117,600 |
| Median Household Income | $31,957 | $119 |
| Monthly Housing Costs | $363 | $15 |
| Real Estate Taxes | $619 | $12 |
Property Value by Mortgage Status in Parker
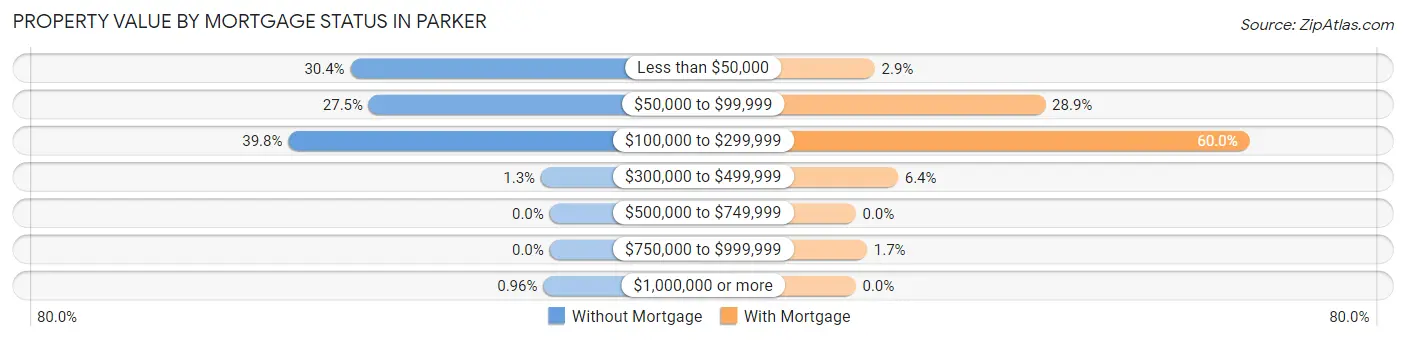
| Property Value | Without Mortgage | With Mortgage |
| Less than $50,000 | 346 (30.3%) | 27 (2.9%) |
| $50,000 to $99,999 | 314 (27.5%) | 269 (28.9%) |
| $100,000 to $299,999 | 454 (39.8%) | 559 (60.0%) |
| $300,000 to $499,999 | 15 (1.3%) | 60 (6.4%) |
| $500,000 to $749,999 | 0 (0.0%) | 0 (0.0%) |
| $750,000 to $999,999 | 0 (0.0%) | 16 (1.7%) |
| $1,000,000 or more | 11 (1.0%) | 0 (0.0%) |
| Total | 1,140 (100.0%) | 931 (100.0%) |
Household Income by Mortgage Status in Parker
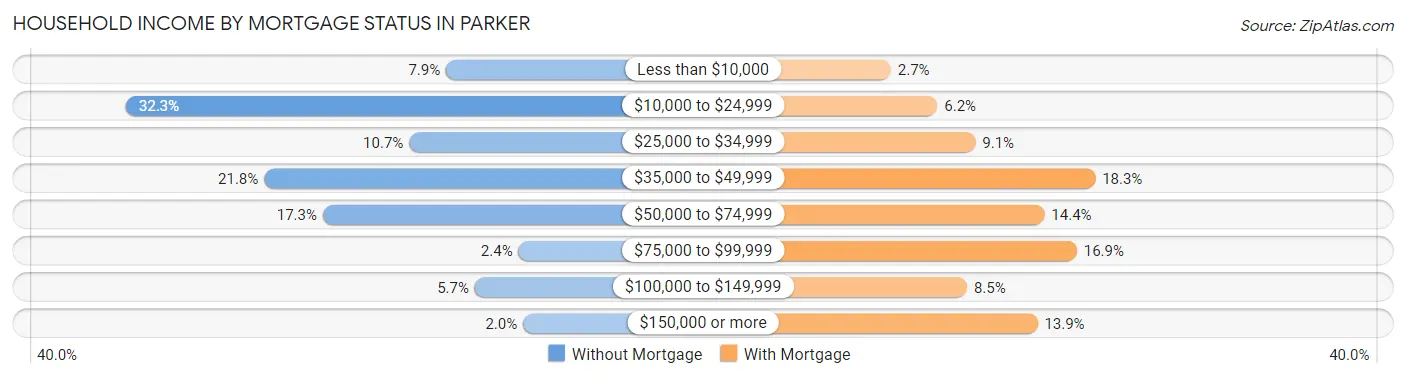
| Household Income | Without Mortgage | With Mortgage |
| Less than $10,000 | 90 (7.9%) | 25 (2.7%) |
| $10,000 to $24,999 | 368 (32.3%) | 58 (6.2%) |
| $25,000 to $34,999 | 122 (10.7%) | 85 (9.1%) |
| $35,000 to $49,999 | 248 (21.7%) | 170 (18.3%) |
| $50,000 to $74,999 | 197 (17.3%) | 134 (14.4%) |
| $75,000 to $99,999 | 27 (2.4%) | 157 (16.9%) |
| $100,000 to $149,999 | 65 (5.7%) | 79 (8.5%) |
| $150,000 or more | 23 (2.0%) | 129 (13.9%) |
| Total | 1,140 (100.0%) | 931 (100.0%) |
Property Value to Household Income Ratio in Parker
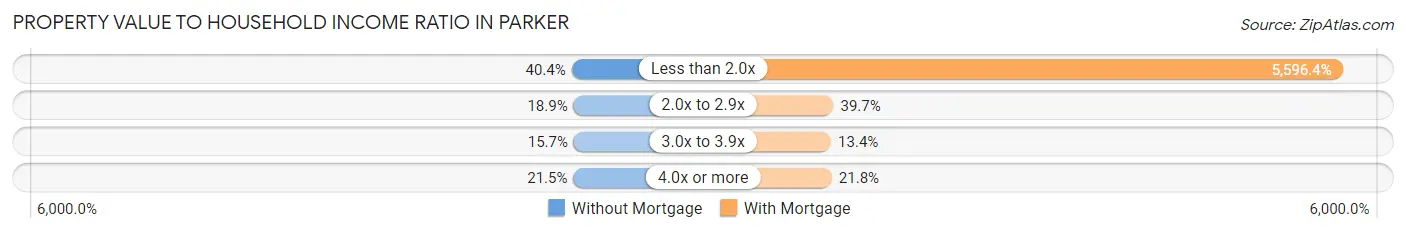
| Value-to-Income Ratio | Without Mortgage | With Mortgage |
| Less than 2.0x | 460 (40.4%) | 52,102 (5,596.4%) |
| 2.0x to 2.9x | 215 (18.9%) | 370 (39.7%) |
| 3.0x to 3.9x | 179 (15.7%) | 125 (13.4%) |
| 4.0x or more | 245 (21.5%) | 203 (21.8%) |
| Total | 1,140 (100.0%) | 931 (100.0%) |
Real Estate Taxes by Mortgage Status in Parker
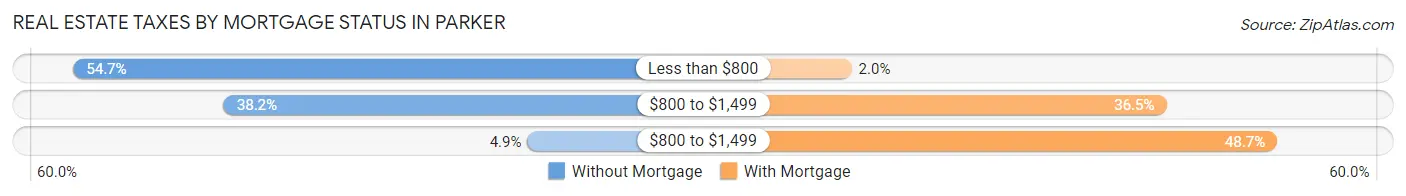
| Property Taxes | Without Mortgage | With Mortgage |
| Less than $800 | 623 (54.6%) | 19 (2.0%) |
| $800 to $1,499 | 435 (38.2%) | 340 (36.5%) |
| $800 to $1,499 | 56 (4.9%) | 453 (48.7%) |
| Total | 1,140 (100.0%) | 931 (100.0%) |
Health & Disability in Parker
Health Insurance Coverage by Age in Parker
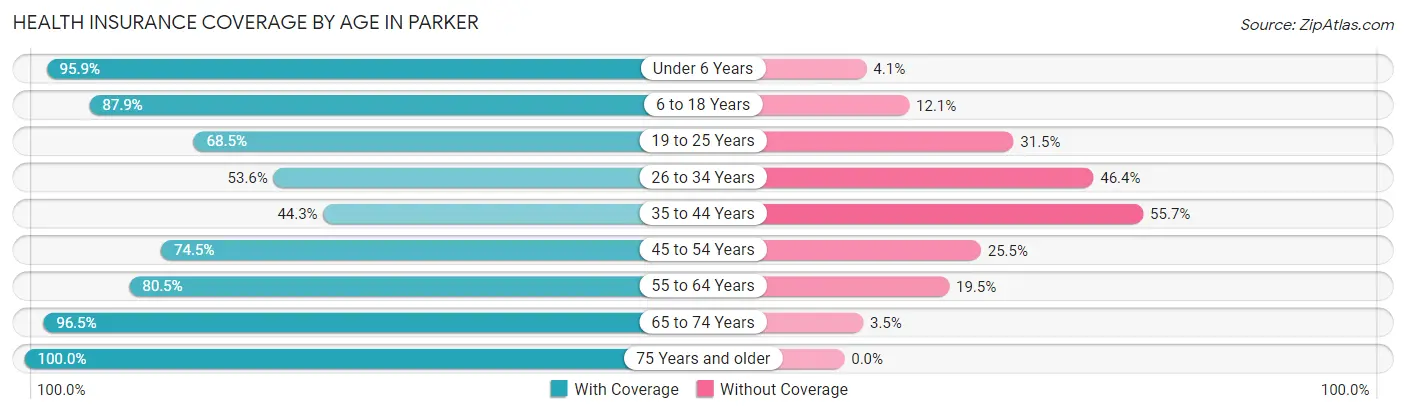
| Age Bracket | With Coverage | Without Coverage |
| Under 6 Years | 1,350 (95.9%) | 58 (4.1%) |
| 6 to 18 Years | 1,621 (87.9%) | 223 (12.1%) |
| 19 to 25 Years | 1,166 (68.5%) | 537 (31.5%) |
| 26 to 34 Years | 962 (53.6%) | 834 (46.4%) |
| 35 to 44 Years | 595 (44.3%) | 749 (55.7%) |
| 45 to 54 Years | 1,268 (74.5%) | 433 (25.5%) |
| 55 to 64 Years | 1,182 (80.5%) | 287 (19.5%) |
| 65 to 74 Years | 579 (96.5%) | 21 (3.5%) |
| 75 Years and older | 453 (100.0%) | 0 (0.0%) |
| Total | 9,176 (74.5%) | 3,142 (25.5%) |
Health Insurance Coverage by Citizenship Status in Parker
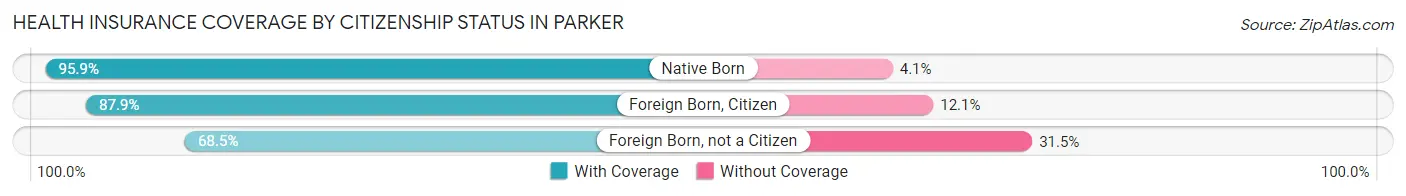
| Citizenship Status | With Coverage | Without Coverage |
| Native Born | 1,350 (95.9%) | 58 (4.1%) |
| Foreign Born, Citizen | 1,621 (87.9%) | 223 (12.1%) |
| Foreign Born, not a Citizen | 1,166 (68.5%) | 537 (31.5%) |
Health Insurance Coverage by Household Income in Parker
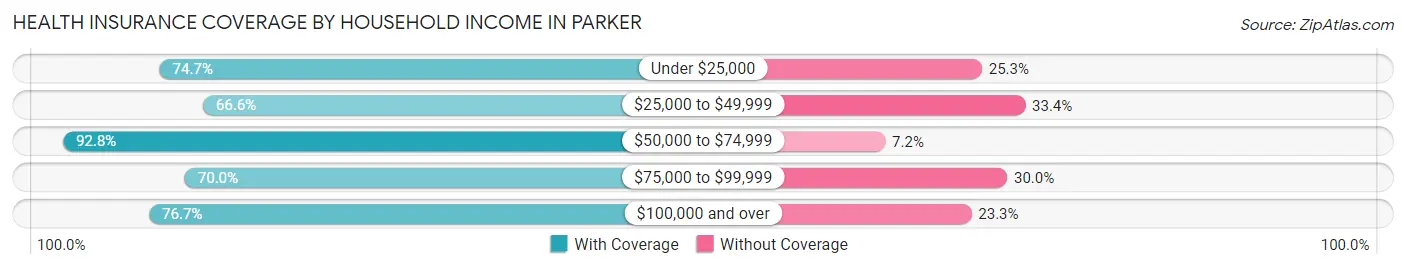
| Household Income | With Coverage | Without Coverage |
| Under $25,000 | 1,671 (74.7%) | 566 (25.3%) |
| $25,000 to $49,999 | 3,366 (66.6%) | 1,689 (33.4%) |
| $50,000 to $74,999 | 2,092 (92.8%) | 162 (7.2%) |
| $75,000 to $99,999 | 834 (70.0%) | 358 (30.0%) |
| $100,000 and over | 1,202 (76.7%) | 366 (23.3%) |
Public vs Private Health Insurance Coverage by Age in Parker
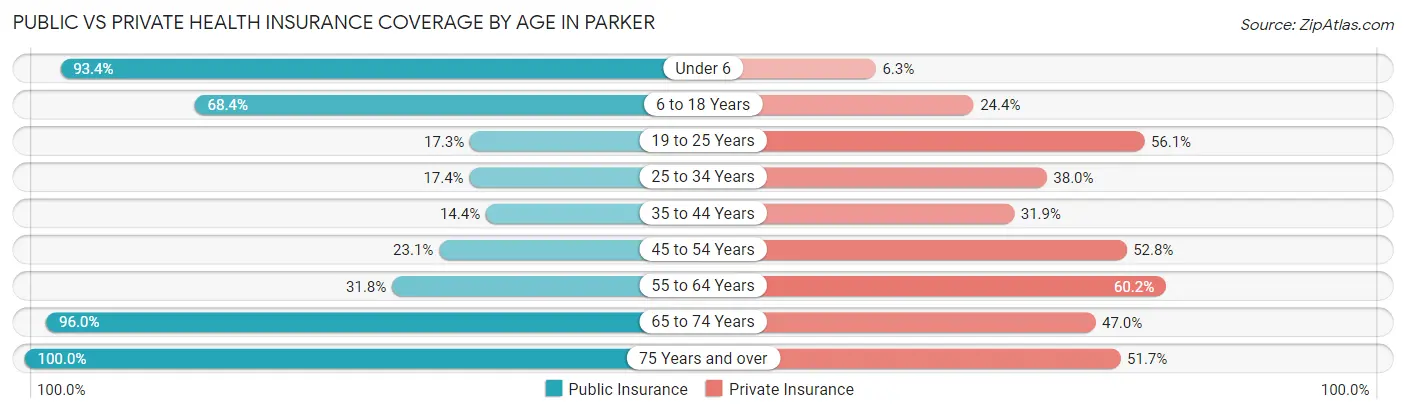
| Age Bracket | Public Insurance | Private Insurance |
| Under 6 | 1,315 (93.4%) | 88 (6.2%) |
| 6 to 18 Years | 1,262 (68.4%) | 450 (24.4%) |
| 19 to 25 Years | 295 (17.3%) | 955 (56.1%) |
| 25 to 34 Years | 313 (17.4%) | 682 (38.0%) |
| 35 to 44 Years | 193 (14.4%) | 429 (31.9%) |
| 45 to 54 Years | 392 (23.1%) | 898 (52.8%) |
| 55 to 64 Years | 467 (31.8%) | 884 (60.2%) |
| 65 to 74 Years | 576 (96.0%) | 282 (47.0%) |
| 75 Years and over | 453 (100.0%) | 234 (51.7%) |
| Total | 5,266 (42.7%) | 4,902 (39.8%) |
Disability Status by Sex by Age in Parker
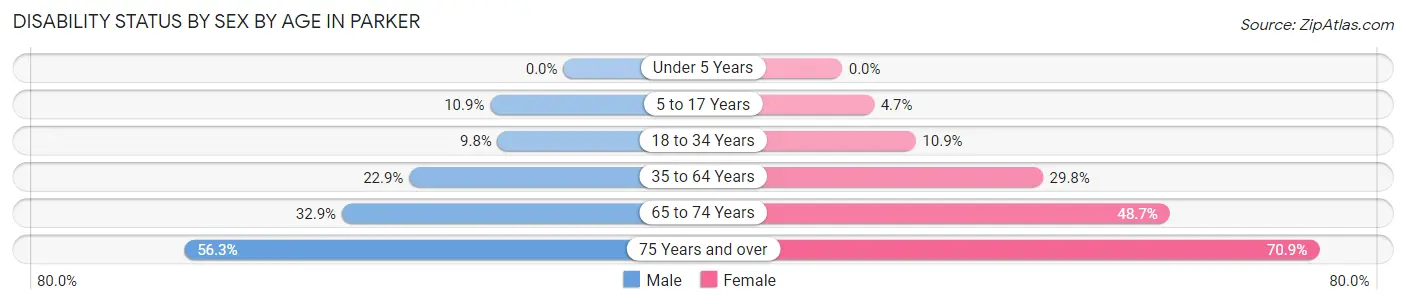
| Age Bracket | Male | Female |
| Under 5 Years | 0 (0.0%) | 0 (0.0%) |
| 5 to 17 Years | 116 (10.9%) | 45 (4.7%) |
| 18 to 34 Years | 191 (9.8%) | 178 (10.9%) |
| 35 to 64 Years | 436 (22.9%) | 778 (29.8%) |
| 65 to 74 Years | 73 (32.9%) | 184 (48.7%) |
| 75 Years and over | 85 (56.3%) | 214 (70.9%) |
Disability Class by Sex by Age in Parker
Disability Class: Hearing Difficulty
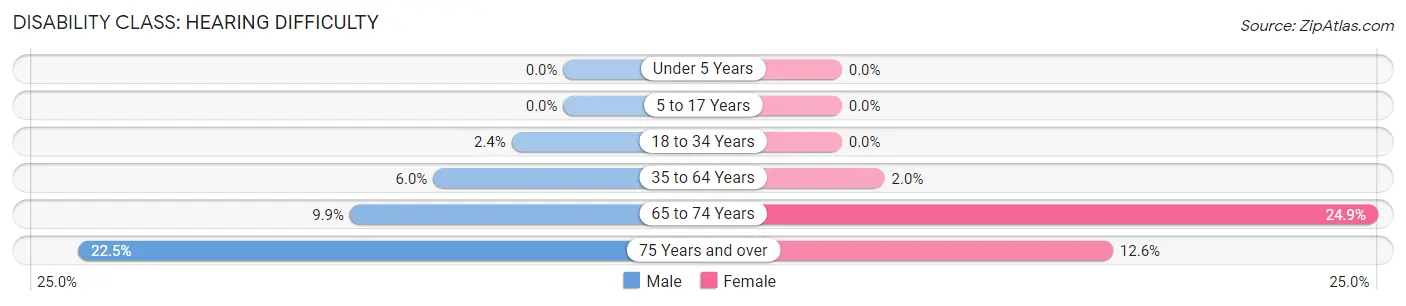
| Age Bracket | Male | Female |
| Under 5 Years | 0 (0.0%) | 0 (0.0%) |
| 5 to 17 Years | 0 (0.0%) | 0 (0.0%) |
| 18 to 34 Years | 47 (2.4%) | 0 (0.0%) |
| 35 to 64 Years | 115 (6.0%) | 52 (2.0%) |
| 65 to 74 Years | 22 (9.9%) | 94 (24.9%) |
| 75 Years and over | 34 (22.5%) | 38 (12.6%) |
Disability Class: Vision Difficulty
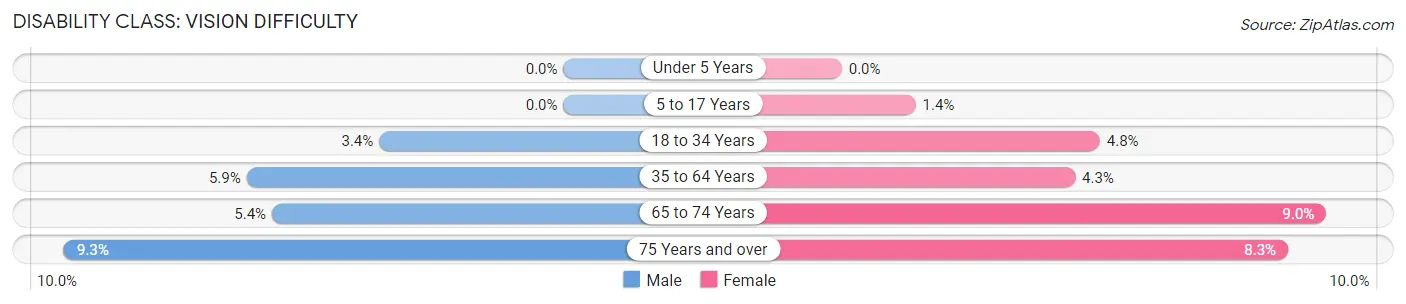
| Age Bracket | Male | Female |
| Under 5 Years | 0 (0.0%) | 0 (0.0%) |
| 5 to 17 Years | 0 (0.0%) | 13 (1.4%) |
| 18 to 34 Years | 67 (3.4%) | 78 (4.8%) |
| 35 to 64 Years | 112 (5.9%) | 113 (4.3%) |
| 65 to 74 Years | 12 (5.4%) | 34 (9.0%) |
| 75 Years and over | 14 (9.3%) | 25 (8.3%) |
Disability Class: Cognitive Difficulty
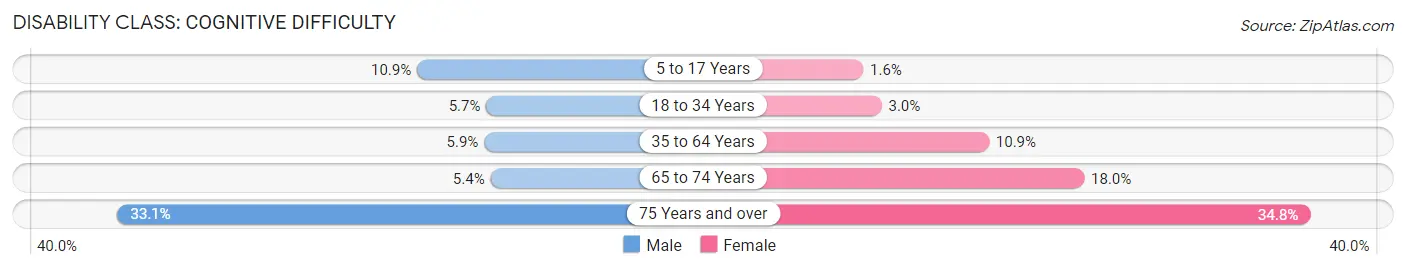
| Age Bracket | Male | Female |
| 5 to 17 Years | 116 (10.9%) | 15 (1.6%) |
| 18 to 34 Years | 112 (5.7%) | 48 (2.9%) |
| 35 to 64 Years | 112 (5.9%) | 285 (10.9%) |
| 65 to 74 Years | 12 (5.4%) | 68 (18.0%) |
| 75 Years and over | 50 (33.1%) | 105 (34.8%) |
Disability Class: Ambulatory Difficulty
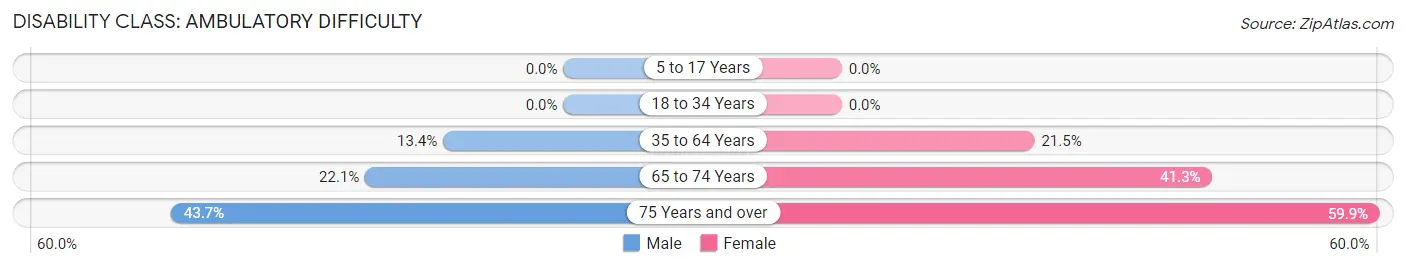
| Age Bracket | Male | Female |
| 5 to 17 Years | 0 (0.0%) | 0 (0.0%) |
| 18 to 34 Years | 0 (0.0%) | 0 (0.0%) |
| 35 to 64 Years | 255 (13.4%) | 560 (21.5%) |
| 65 to 74 Years | 49 (22.1%) | 156 (41.3%) |
| 75 Years and over | 66 (43.7%) | 181 (59.9%) |
Disability Class: Self-Care Difficulty
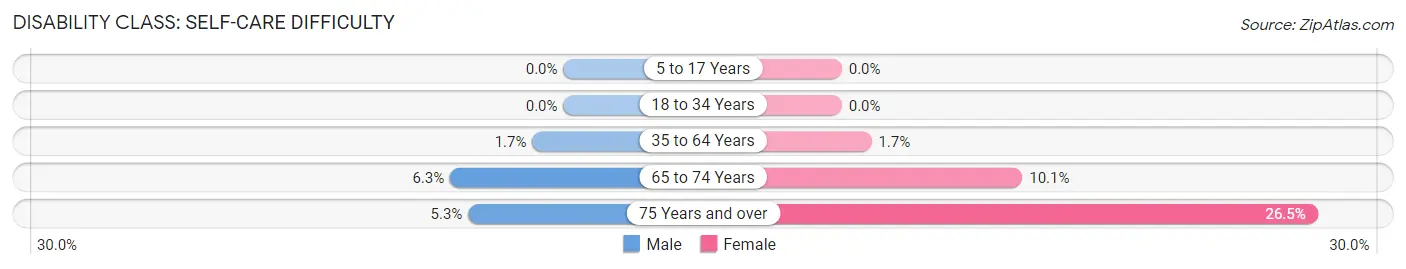
| Age Bracket | Male | Female |
| 5 to 17 Years | 0 (0.0%) | 0 (0.0%) |
| 18 to 34 Years | 0 (0.0%) | 0 (0.0%) |
| 35 to 64 Years | 33 (1.7%) | 43 (1.7%) |
| 65 to 74 Years | 14 (6.3%) | 38 (10.1%) |
| 75 Years and over | 8 (5.3%) | 80 (26.5%) |
Technology Access in Parker
Computing Device Access in Parker
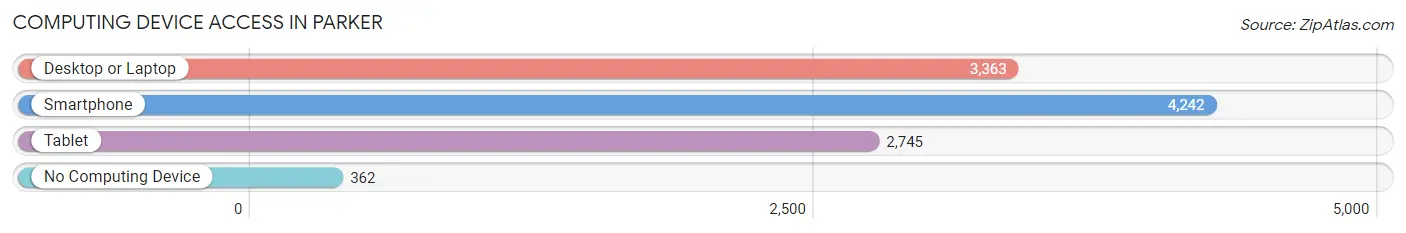
| Device Type | # Households | % Households |
| Desktop or Laptop | 3,363 | 68.9% |
| Smartphone | 4,242 | 86.9% |
| Tablet | 2,745 | 56.2% |
| No Computing Device | 362 | 7.4% |
| Total | 4,880 | 100.0% |
Internet Access in Parker
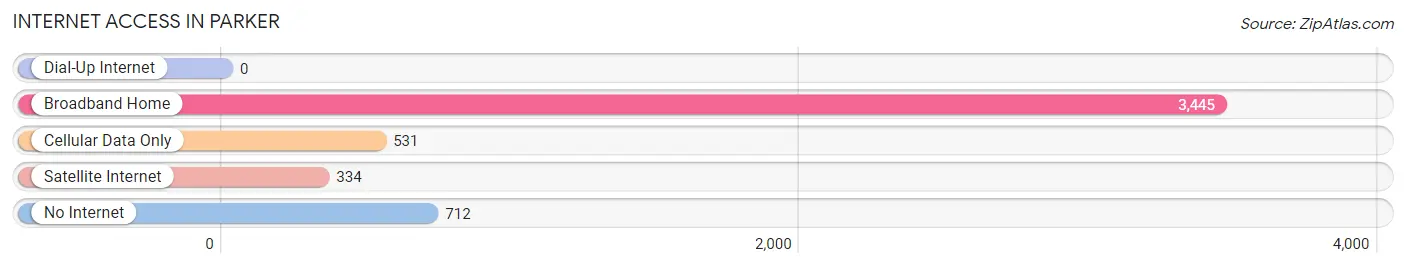
| Internet Type | # Households | % Households |
| Dial-Up Internet | 0 | 0.0% |
| Broadband Home | 3,445 | 70.6% |
| Cellular Data Only | 531 | 10.9% |
| Satellite Internet | 334 | 6.8% |
| No Internet | 712 | 14.6% |
| Total | 4,880 | 100.0% |
Parker Summary
Parker, South Carolina is a small town located in the Lowcountry region of the state. It is situated in Berkeley County, approximately 20 miles northwest of Charleston. The town was founded in 1872 and named after the Parker family, who were among the first settlers in the area. The population of Parker was estimated to be 1,845 in 2020.
Geography
Parker is located in the Lowcountry region of South Carolina, which is characterized by its flat terrain and coastal plains. The town is situated on the banks of the Cooper River, which is a major tributary of the Santee River. The town is surrounded by several small towns and villages, including Bonneau, Cross, and St. Stephen. The town is also located near the Francis Marion National Forest, which is a popular destination for outdoor recreation.
The climate in Parker is humid subtropical, with hot, humid summers and mild winters. The average annual temperature is around 70 degrees Fahrenheit, with temperatures reaching as high as 95 degrees in the summer and as low as 40 degrees in the winter. The town receives an average of 48 inches of precipitation per year, with most of it falling in the summer months.
Economy
The economy of Parker is largely based on agriculture and tourism. The town is home to several farms, which produce a variety of crops, including corn, soybeans, and cotton. The town is also home to several seafood processing plants, which process and package seafood for local restaurants and markets.
Tourism is also an important part of the local economy. The town is home to several historic sites, including the Parker House, which was built in 1872 and is listed on the National Register of Historic Places. The town is also home to several parks and recreational areas, including the Francis Marion National Forest and the Cooper River.
Demographics
The population of Parker was estimated to be 1,845 in 2020. The town is predominantly white, with a population that is approximately 75% white and 25% African American. The median household income in Parker is $45,000, and the median home value is $150,000.
The town is served by the Berkeley County School District, which includes two elementary schools, one middle school, and one high school. The town is also home to several churches, including the First Baptist Church of Parker and the Parker United Methodist Church.
Conclusion
Parker, South Carolina is a small town located in the Lowcountry region of the state. It is situated in Berkeley County, approximately 20 miles northwest of Charleston. The town was founded in 1872 and named after the Parker family, who were among the first settlers in the area. The economy of Parker is largely based on agriculture and tourism, and the town is home to several historic sites and recreational areas. The population of Parker was estimated to be 1,845 in 2020, and the town is predominantly white.
Common Questions
What is Per Capita Income in Parker?
Per Capita income in Parker is $21,798.
What is the Median Family Income in Parker?
Median Family Income in Parker is $40,714.
What is the Median Household income in Parker?
Median Household Income in Parker is $37,431.
What is Income or Wage Gap in Parker?
Income or Wage Gap in Parker is 32.0%.
Women in Parker earn 68.0 cents for every dollar earned by a man.
What is Family Income Deficit in Parker?
Family Income Deficit in Parker is $11,860.
Families that are below poverty line in Parker earn $11,860 less on average than the poverty threshold level.
What is Inequality or Gini Index in Parker?
Inequality or Gini Index in Parker is 0.45.
What is the Total Population of Parker?
Total Population of Parker is 12,466.
What is the Total Male Population of Parker?
Total Male Population of Parker is 6,137.
What is the Total Female Population of Parker?
Total Female Population of Parker is 6,329.
What is the Ratio of Males per 100 Females in Parker?
There are 96.97 Males per 100 Females in Parker.
What is the Ratio of Females per 100 Males in Parker?
There are 103.13 Females per 100 Males in Parker.
What is the Median Population Age in Parker?
Median Population Age in Parker is 31.8 Years.
What is the Average Family Size in Parker
Average Family Size in Parker is 3.3 People.
What is the Average Household Size in Parker
Average Household Size in Parker is 2.5 People.
How Large is the Labor Force in Parker?
There are 6,090 People in the Labor Forcein in Parker.
What is the Percentage of People in the Labor Force in Parker?
63.1% of People are in the Labor Force in Parker.
What is the Unemployment Rate in Parker?
Unemployment Rate in Parker is 4.8%.