Gantt, SC Map & Demographics
Gantt Map
Gantt Overview
$31,011
PER CAPITA INCOME
$50,805
AVG FAMILY INCOME
$43,796
AVG HOUSEHOLD INCOME
35.7%
WAGE / INCOME GAP [ % ]
64.3¢/ $1
WAGE / INCOME GAP [ $ ]
$15,018
FAMILY INCOME DEFICIT
0.58
INEQUALITY / GINI INDEX
14,276
TOTAL POPULATION
6,382
MALE POPULATION
7,894
FEMALE POPULATION
80.85
MALES / 100 FEMALES
123.69
FEMALES / 100 MALES
34.5
MEDIAN AGE
3.1
AVG FAMILY SIZE
2.6
AVG HOUSEHOLD SIZE
6,803
LABOR FORCE [ PEOPLE ]
64.7%
PERCENT IN LABOR FORCE
8.6%
UNEMPLOYMENT RATE
Income in Gantt
Income Overview in Gantt
Per Capita Income in Gantt is $31,011, while median incomes of families and households are $50,805 and $43,796 respectively.
| Characteristic | Number | Measure |
| Per Capita Income | 14,276 | $31,011 |
| Median Family Income | 3,665 | $50,805 |
| Mean Family Income | 3,665 | $95,772 |
| Median Household Income | 5,475 | $43,796 |
| Mean Household Income | 5,475 | $78,463 |
| Income Deficit | 3,665 | $15,018 |
| Wage / Income Gap (%) | 14,276 | 35.66% |
| Wage / Income Gap ($) | 14,276 | 64.34¢ per $1 |
| Gini / Inequality Index | 14,276 | 0.58 |
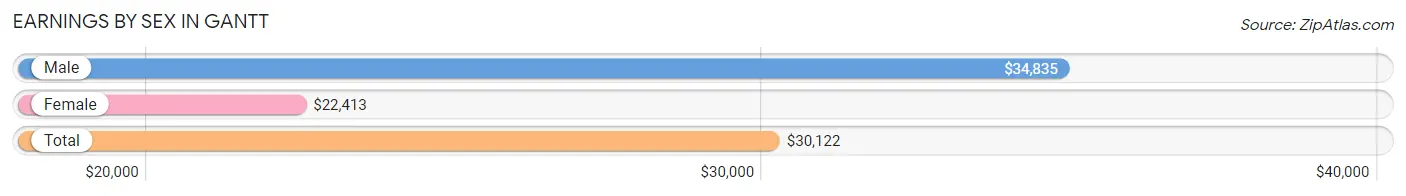
Earnings by Sex in Gantt
Average Earnings in Gantt are $30,122, $34,835 for men and $22,413 for women, a difference of 35.7%.
| Sex | Number | Average Earnings |
| Male | 3,426 (48.3%) | $34,835 |
| Female | 3,662 (51.7%) | $22,413 |
| Total | 7,088 (100.0%) | $30,122 |
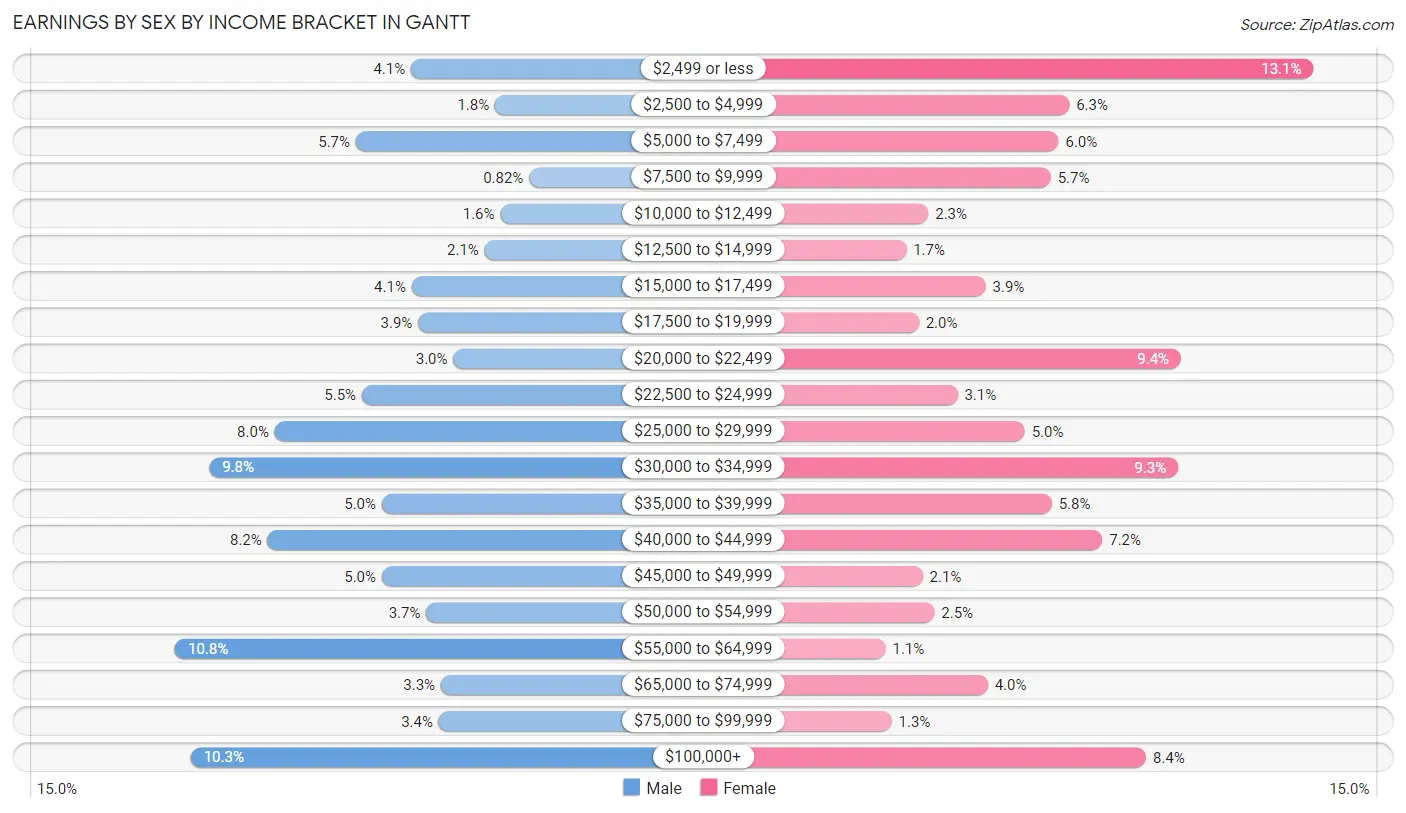
Earnings by Sex by Income Bracket in Gantt
The most common earnings brackets in Gantt are $55,000 to $64,999 for men (369 | 10.8%) and $2,499 or less for women (480 | 13.1%).
| Income | Male | Female |
| $2,499 or less | 142 (4.1%) | 480 (13.1%) |
| $2,500 to $4,999 | 61 (1.8%) | 229 (6.2%) |
| $5,000 to $7,499 | 195 (5.7%) | 218 (5.9%) |
| $7,500 to $9,999 | 28 (0.8%) | 210 (5.7%) |
| $10,000 to $12,499 | 56 (1.6%) | 84 (2.3%) |
| $12,500 to $14,999 | 71 (2.1%) | 61 (1.7%) |
| $15,000 to $17,499 | 141 (4.1%) | 143 (3.9%) |
| $17,500 to $19,999 | 135 (3.9%) | 74 (2.0%) |
| $20,000 to $22,499 | 101 (2.9%) | 344 (9.4%) |
| $22,500 to $24,999 | 189 (5.5%) | 114 (3.1%) |
| $25,000 to $29,999 | 273 (8.0%) | 183 (5.0%) |
| $30,000 to $34,999 | 336 (9.8%) | 341 (9.3%) |
| $35,000 to $39,999 | 170 (5.0%) | 211 (5.8%) |
| $40,000 to $44,999 | 280 (8.2%) | 263 (7.2%) |
| $45,000 to $49,999 | 170 (5.0%) | 78 (2.1%) |
| $50,000 to $54,999 | 127 (3.7%) | 90 (2.5%) |
| $55,000 to $64,999 | 369 (10.8%) | 40 (1.1%) |
| $65,000 to $74,999 | 113 (3.3%) | 145 (4.0%) |
| $75,000 to $99,999 | 115 (3.4%) | 46 (1.3%) |
| $100,000+ | 354 (10.3%) | 308 (8.4%) |
| Total | 3,426 (100.0%) | 3,662 (100.0%) |
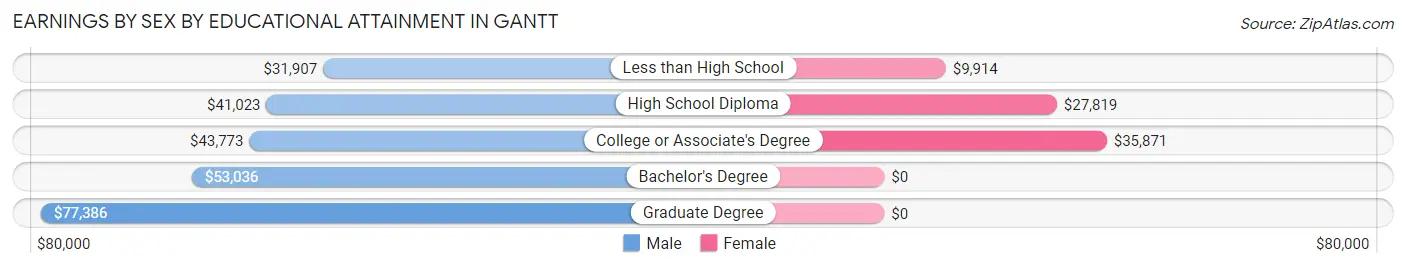
Earnings by Sex by Educational Attainment in Gantt
Average earnings in Gantt are $41,112 for men and $32,610 for women, a difference of 20.7%. Men with an educational attainment of graduate degree enjoy the highest average annual earnings of $77,386, while those with less than high school education earn the least with $31,907. Women with an educational attainment of college or associate's degree earn the most with the average annual earnings of $35,871, while those with less than high school education have the smallest earnings of $9,914.
| Educational Attainment | Male Income | Female Income |
| Less than High School | $31,907 | $9,914 |
| High School Diploma | $41,023 | $27,819 |
| College or Associate's Degree | $43,773 | $35,871 |
| Bachelor's Degree | $53,036 | $0 |
| Graduate Degree | $77,386 | $0 |
| Total | $41,112 | $32,610 |
Family Income in Gantt
Family Income Brackets in Gantt
According to the Gantt family income data, there are 619 families falling into the $50,000 to $74,999 income range, which is the most common income bracket and makes up 16.9% of all families. Conversely, the $10,000 to $14,999 income bracket is the least frequent group with only 103 families (2.8%) belonging to this category.
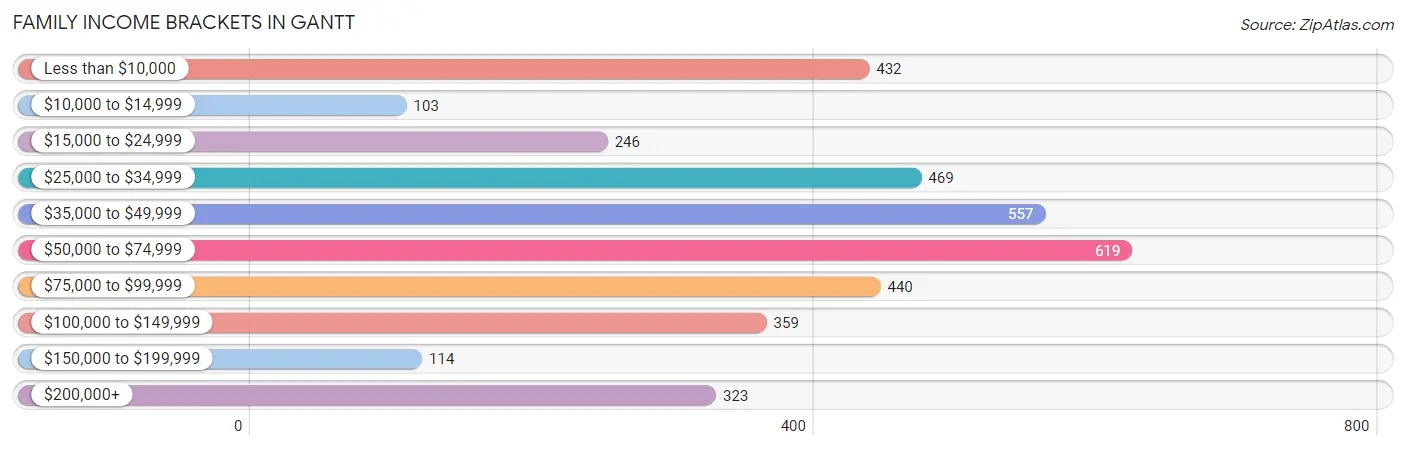
| Income Bracket | # Families | % Families |
| Less than $10,000 | 432 | 11.8% |
| $10,000 to $14,999 | 103 | 2.8% |
| $15,000 to $24,999 | 246 | 6.7% |
| $25,000 to $34,999 | 469 | 12.8% |
| $35,000 to $49,999 | 557 | 15.2% |
| $50,000 to $74,999 | 619 | 16.9% |
| $75,000 to $99,999 | 440 | 12.0% |
| $100,000 to $149,999 | 359 | 9.8% |
| $150,000 to $199,999 | 114 | 3.1% |
| $200,000+ | 323 | 8.8% |
Family Income by Famaliy Size in Gantt
4-person families (464 | 12.7%) account for the highest median family income in Gantt with $65,403 per family, while 2-person families (1,987 | 54.2%) have the highest median income of $23,159 per family member.
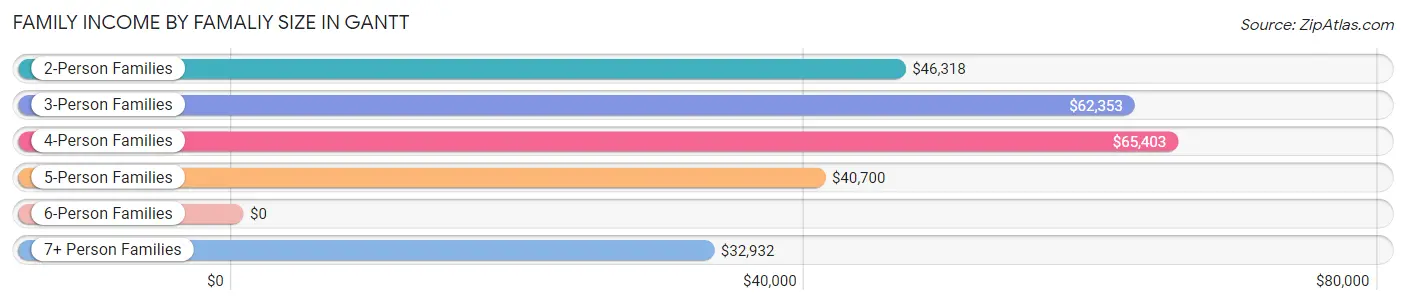
| Income Bracket | # Families | Median Income |
| 2-Person Families | 1,987 (54.2%) | $46,318 |
| 3-Person Families | 838 (22.9%) | $62,353 |
| 4-Person Families | 464 (12.7%) | $65,403 |
| 5-Person Families | 114 (3.1%) | $40,700 |
| 6-Person Families | 37 (1.0%) | $0 |
| 7+ Person Families | 225 (6.1%) | $32,932 |
| Total | 3,665 (100.0%) | $50,805 |
Family Income by Number of Earners in Gantt
The median family income in Gantt is $50,805, with families comprising 3+ earners (245) having the highest median family income of $91,375, while families with no earners (382) have the lowest median family income of $28,846, accounting for 6.7% and 10.4% of families, respectively.
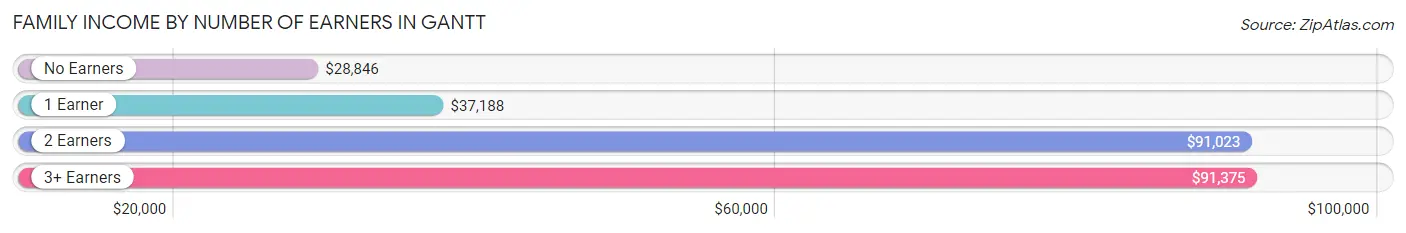
| Number of Earners | # Families | Median Income |
| No Earners | 382 (10.4%) | $28,846 |
| 1 Earner | 1,794 (48.9%) | $37,188 |
| 2 Earners | 1,244 (33.9%) | $91,023 |
| 3+ Earners | 245 (6.7%) | $91,375 |
| Total | 3,665 (100.0%) | $50,805 |
Household Income in Gantt
Household Income Brackets in Gantt
With 887 households falling in the category, the $50,000 to $74,999 income range is the most frequent in Gantt, accounting for 16.2% of all households. In contrast, only 126 households (2.3%) fall into the $150,000 to $199,999 income bracket, making it the least populous group.
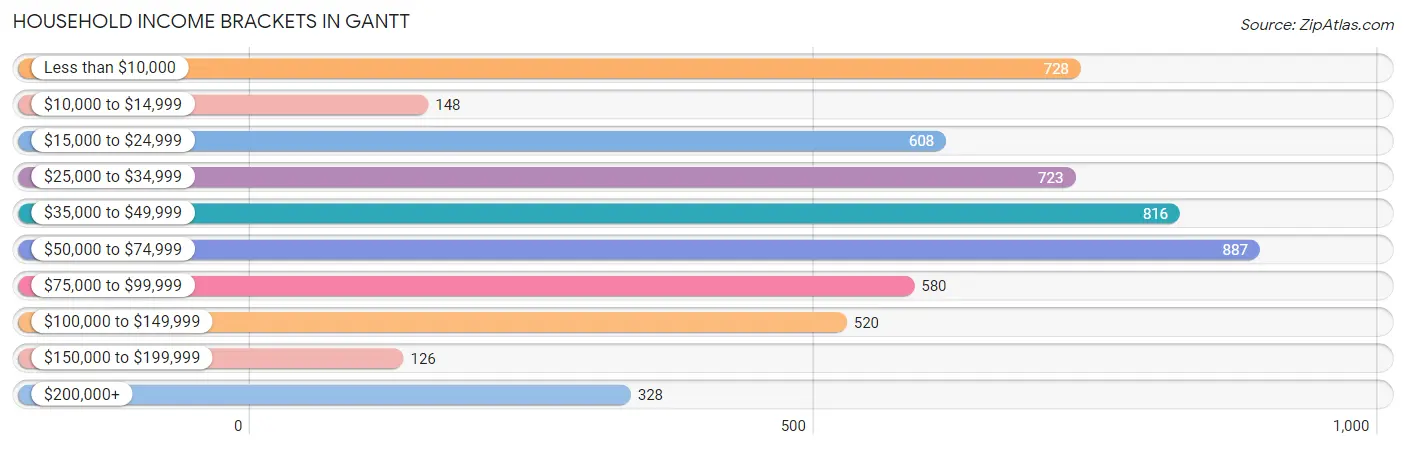
| Income Bracket | # Households | % Households |
| Less than $10,000 | 728 | 13.3% |
| $10,000 to $14,999 | 148 | 2.7% |
| $15,000 to $24,999 | 608 | 11.1% |
| $25,000 to $34,999 | 723 | 13.2% |
| $35,000 to $49,999 | 816 | 14.9% |
| $50,000 to $74,999 | 887 | 16.2% |
| $75,000 to $99,999 | 580 | 10.6% |
| $100,000 to $149,999 | 520 | 9.5% |
| $150,000 to $199,999 | 126 | 2.3% |
| $200,000+ | 328 | 6.0% |
Household Income by Householder Age in Gantt
The median household income in Gantt is $43,796, with the highest median household income of $48,050 found in the 25 to 44 years age bracket for the primary householder. A total of 2,032 households (37.1%) fall into this category. Meanwhile, the 15 to 24 years age bracket for the primary householder has the lowest median household income of $0, with 487 households (8.9%) in this group.
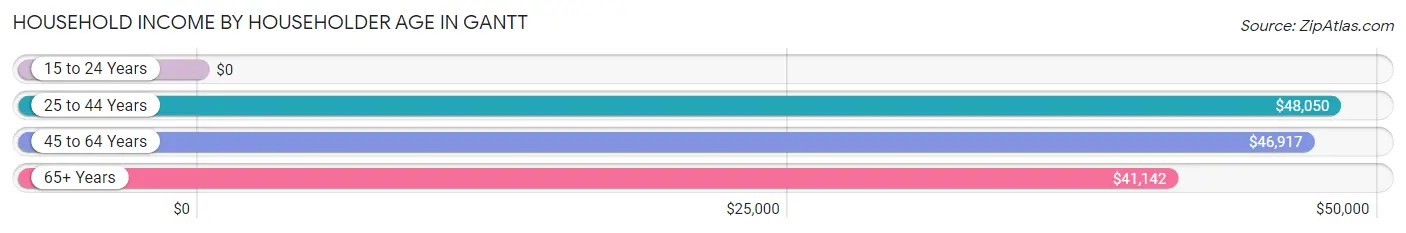
| Income Bracket | # Households | Median Income |
| 15 to 24 Years | 487 (8.9%) | $0 |
| 25 to 44 Years | 2,032 (37.1%) | $48,050 |
| 45 to 64 Years | 1,604 (29.3%) | $46,917 |
| 65+ Years | 1,352 (24.7%) | $41,142 |
| Total | 5,475 (100.0%) | $43,796 |
Poverty in Gantt
Income Below Poverty by Sex and Age in Gantt
With 26.4% poverty level for males and 31.8% for females among the residents of Gantt, 5 year old males and 16 and 17 year old females are the most vulnerable to poverty, with 210 males (93.3%) and 200 females (70.7%) in their respective age groups living below the poverty level.
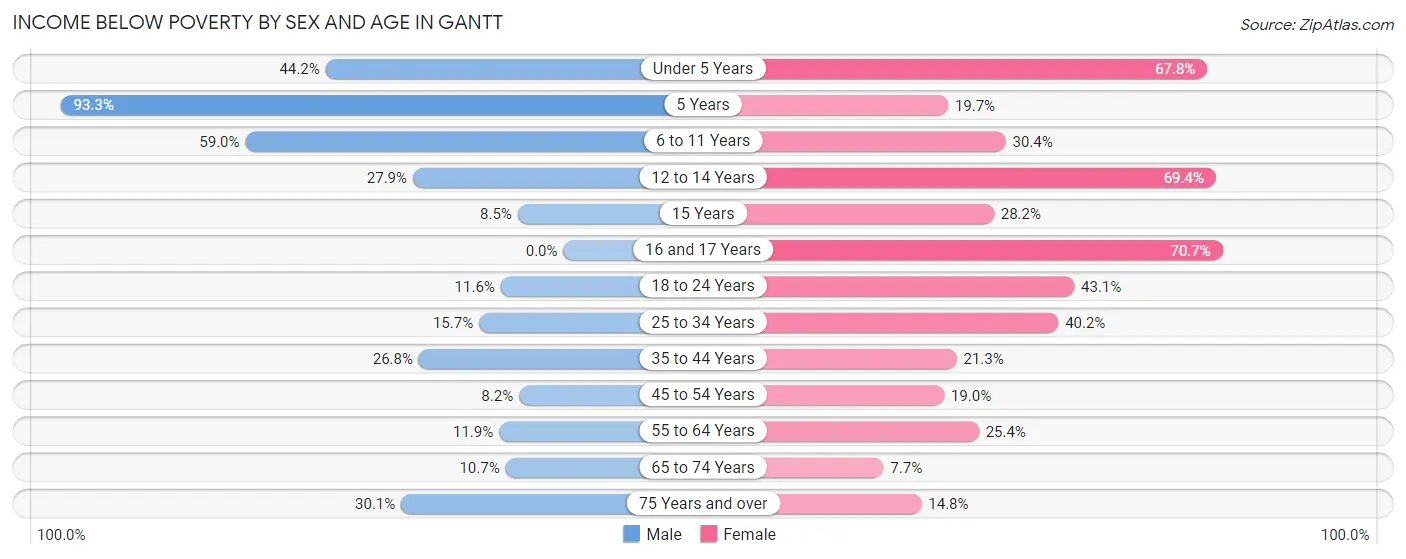
| Age Bracket | Male | Female |
| Under 5 Years | 321 (44.2%) | 352 (67.8%) |
| 5 Years | 210 (93.3%) | 13 (19.7%) |
| 6 to 11 Years | 350 (59.0%) | 220 (30.4%) |
| 12 to 14 Years | 93 (27.9%) | 161 (69.4%) |
| 15 Years | 15 (8.5%) | 11 (28.2%) |
| 16 and 17 Years | 0 (0.0%) | 200 (70.7%) |
| 18 to 24 Years | 66 (11.6%) | 442 (43.1%) |
| 25 to 34 Years | 93 (15.7%) | 333 (40.2%) |
| 35 to 44 Years | 323 (26.8%) | 213 (21.3%) |
| 45 to 54 Years | 61 (8.2%) | 174 (19.0%) |
| 55 to 64 Years | 56 (11.9%) | 184 (25.4%) |
| 65 to 74 Years | 39 (10.7%) | 52 (7.7%) |
| 75 Years and over | 53 (30.1%) | 104 (14.8%) |
| Total | 1,680 (26.4%) | 2,459 (31.8%) |
Income Above Poverty by Sex and Age in Gantt
According to the poverty statistics in Gantt, males aged 16 and 17 years and females aged 65 to 74 years are the age groups that are most secure financially, with 100.0% of males and 92.3% of females in these age groups living above the poverty line.
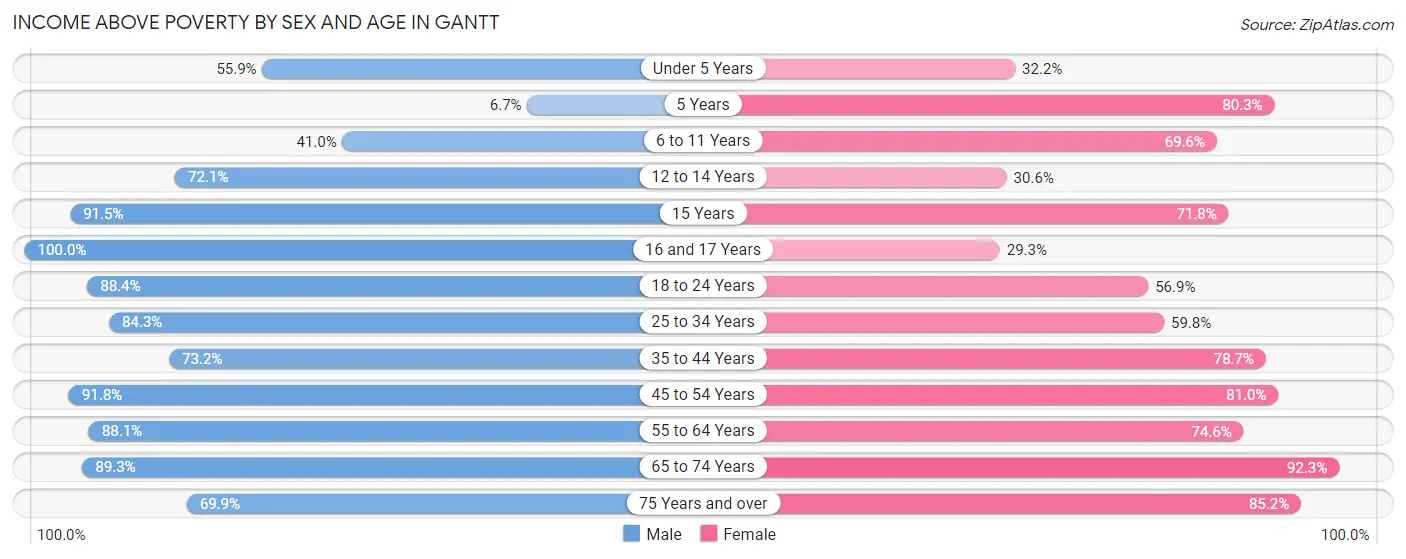
| Age Bracket | Male | Female |
| Under 5 Years | 406 (55.8%) | 167 (32.2%) |
| 5 Years | 15 (6.7%) | 53 (80.3%) |
| 6 to 11 Years | 243 (41.0%) | 504 (69.6%) |
| 12 to 14 Years | 240 (72.1%) | 71 (30.6%) |
| 15 Years | 162 (91.5%) | 28 (71.8%) |
| 16 and 17 Years | 195 (100.0%) | 83 (29.3%) |
| 18 to 24 Years | 501 (88.4%) | 583 (56.9%) |
| 25 to 34 Years | 501 (84.3%) | 496 (59.8%) |
| 35 to 44 Years | 881 (73.2%) | 787 (78.7%) |
| 45 to 54 Years | 680 (91.8%) | 743 (81.0%) |
| 55 to 64 Years | 413 (88.1%) | 540 (74.6%) |
| 65 to 74 Years | 324 (89.3%) | 622 (92.3%) |
| 75 Years and over | 123 (69.9%) | 600 (85.2%) |
| Total | 4,684 (73.6%) | 5,277 (68.2%) |
Income Below Poverty Among Married-Couple Families in Gantt
The poverty statistics for married-couple families in Gantt show that 13.9% or 234 of the total 1,685 families live below the poverty line. Families with 5 or more children have the highest poverty rate of 100.0%, comprising of 109 families. On the other hand, families with no children have the lowest poverty rate of 3.4%, which includes 37 families.
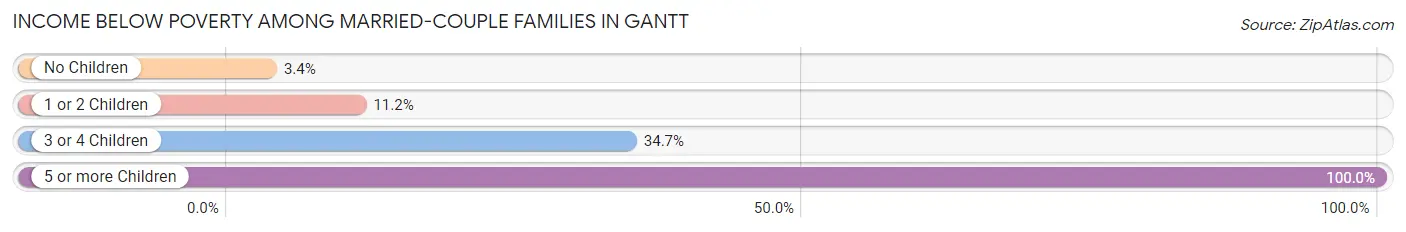
| Children | Above Poverty | Below Poverty |
| No Children | 1,055 (96.6%) | 37 (3.4%) |
| 1 or 2 Children | 302 (88.8%) | 38 (11.2%) |
| 3 or 4 Children | 94 (65.3%) | 50 (34.7%) |
| 5 or more Children | 0 (0.0%) | 109 (100.0%) |
| Total | 1,451 (86.1%) | 234 (13.9%) |
Income Below Poverty Among Single-Parent Households in Gantt
According to the poverty data in Gantt, 15.1% or 60 single-father households and 33.3% or 527 single-mother households are living below the poverty line. Among single-father households, those with 1 or 2 children have the highest poverty rate, with 60 households (22.1%) experiencing poverty. Likewise, among single-mother households, those with 5 or more children have the highest poverty rate, with 59 households (100.0%) falling below the poverty line.
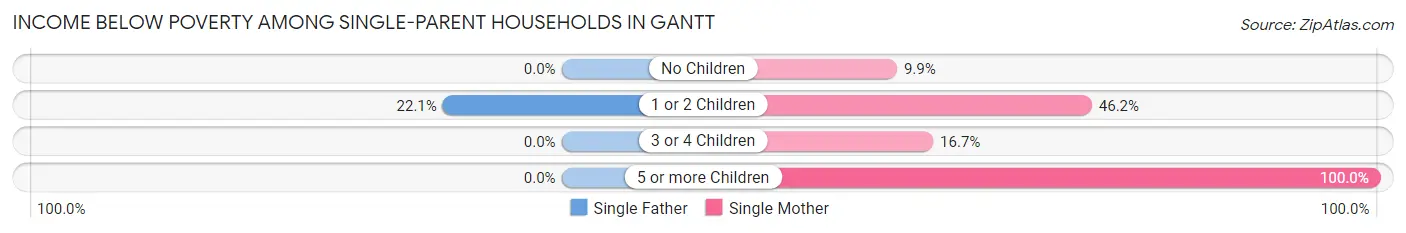
| Children | Single Father | Single Mother |
| No Children | 0 (0.0%) | 60 (9.9%) |
| 1 or 2 Children | 60 (22.1%) | 398 (46.2%) |
| 3 or 4 Children | 0 (0.0%) | 10 (16.7%) |
| 5 or more Children | 0 (0.0%) | 59 (100.0%) |
| Total | 60 (15.1%) | 527 (33.3%) |
Income Below Poverty Among Married-Couple vs Single-Parent Households in Gantt
The poverty data for Gantt shows that 234 of the married-couple family households (13.9%) and 587 of the single-parent households (29.6%) are living below the poverty level. Within the married-couple family households, those with 5 or more children have the highest poverty rate, with 109 households (100.0%) falling below the poverty line. Among the single-parent households, those with 5 or more children have the highest poverty rate, with 59 household (100.0%) living below poverty.
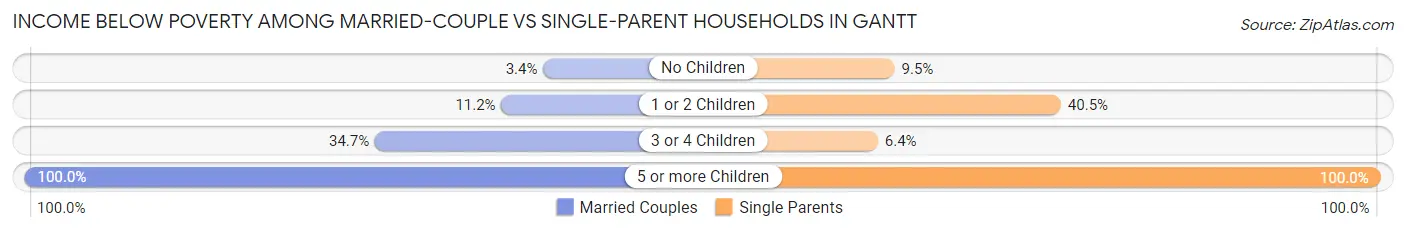
| Children | Married-Couple Families | Single-Parent Households |
| No Children | 37 (3.4%) | 60 (9.5%) |
| 1 or 2 Children | 38 (11.2%) | 458 (40.5%) |
| 3 or 4 Children | 50 (34.7%) | 10 (6.4%) |
| 5 or more Children | 109 (100.0%) | 59 (100.0%) |
| Total | 234 (13.9%) | 587 (29.6%) |
Race in Gantt
The most populous races in Gantt are Black / African American (7,819 | 54.8%), White / Caucasian (3,757 | 26.3%), and Hispanic or Latino (3,569 | 25.0%).
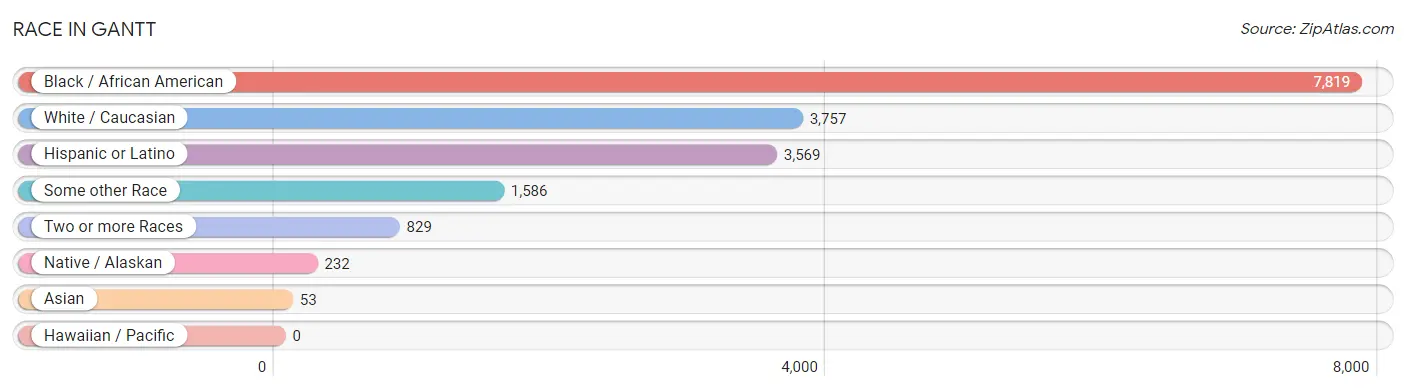
| Race | # Population | % Population |
| Asian | 53 | 0.4% |
| Black / African American | 7,819 | 54.8% |
| Hawaiian / Pacific | 0 | 0.0% |
| Hispanic or Latino | 3,569 | 25.0% |
| Native / Alaskan | 232 | 1.6% |
| White / Caucasian | 3,757 | 26.3% |
| Two or more Races | 829 | 5.8% |
| Some other Race | 1,586 | 11.1% |
| Total | 14,276 | 100.0% |
Ancestry in Gantt
The most populous ancestries reported in Gantt are Mexican (2,676 | 18.7%), American (787 | 5.5%), English (533 | 3.7%), Central American (398 | 2.8%), and German (362 | 2.5%), together accounting for 33.3% of all Gantt residents.
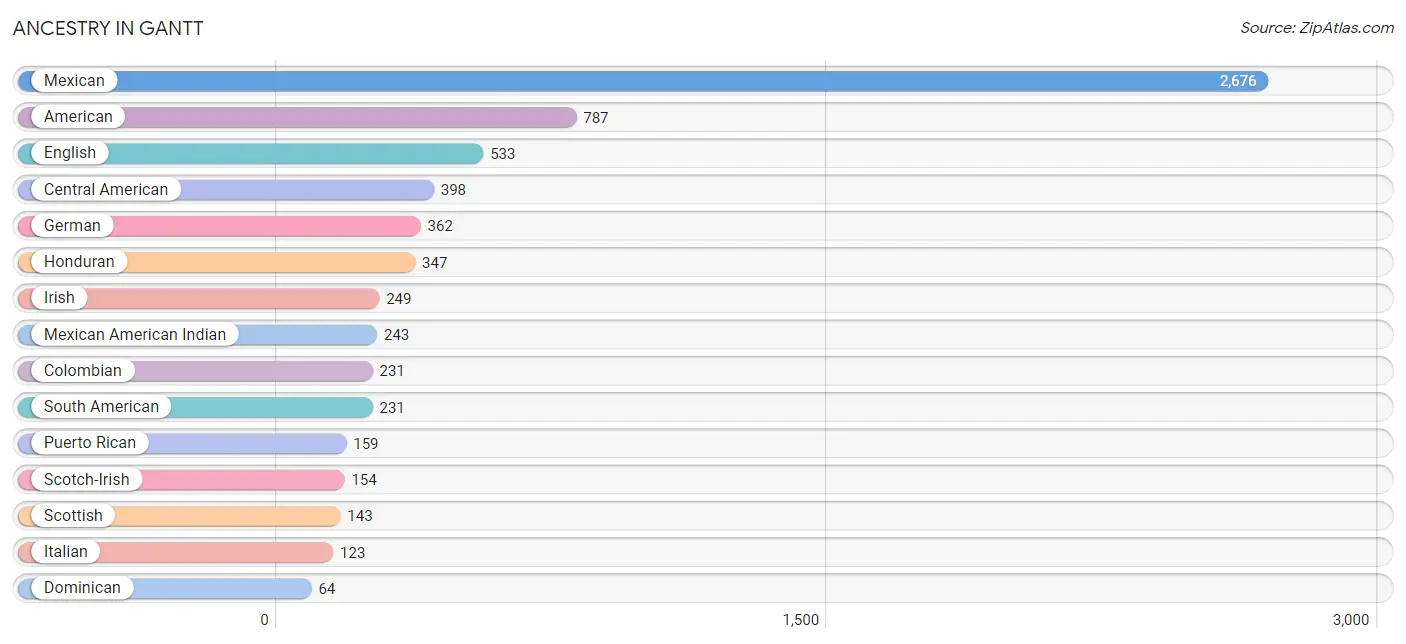
| Ancestry | # Population | % Population |
| African | 14 | 0.1% |
| American | 787 | 5.5% |
| Barbadian | 9 | 0.1% |
| British | 17 | 0.1% |
| Burmese | 50 | 0.4% |
| Central American | 398 | 2.8% |
| Cherokee | 5 | 0.0% |
| Colombian | 231 | 1.6% |
| Cuban | 23 | 0.2% |
| Czechoslovakian | 9 | 0.1% |
| Dominican | 64 | 0.4% |
| Eastern European | 15 | 0.1% |
| English | 533 | 3.7% |
| European | 50 | 0.4% |
| French | 31 | 0.2% |
| French Canadian | 11 | 0.1% |
| German | 362 | 2.5% |
| Honduran | 347 | 2.4% |
| Indian (Asian) | 14 | 0.1% |
| Irish | 249 | 1.7% |
| Israeli | 17 | 0.1% |
| Italian | 123 | 0.9% |
| Jamaican | 7 | 0.1% |
| Korean | 28 | 0.2% |
| Mexican | 2,676 | 18.7% |
| Mexican American Indian | 243 | 1.7% |
| Nicaraguan | 3 | 0.0% |
| Nigerian | 30 | 0.2% |
| Polish | 35 | 0.3% |
| Portuguese | 17 | 0.1% |
| Puerto Rican | 159 | 1.1% |
| Russian | 29 | 0.2% |
| Salvadoran | 48 | 0.3% |
| Scotch-Irish | 154 | 1.1% |
| Scottish | 143 | 1.0% |
| South American | 231 | 1.6% |
| Spaniard | 9 | 0.1% |
| Subsaharan African | 44 | 0.3% |
| Swedish | 6 | 0.0% |
| Swiss | 4 | 0.0% |
| Welsh | 11 | 0.1% |
| West Indian | 7 | 0.1% | View All 42 Rows |
Immigrants in Gantt
The most numerous immigrant groups reported in Gantt came from Latin America (1,343 | 9.4%), Central America (1,174 | 8.2%), Mexico (873 | 6.1%), Honduras (292 | 2.1%), and Colombia (145 | 1.0%), together accounting for 26.8% of all Gantt residents.
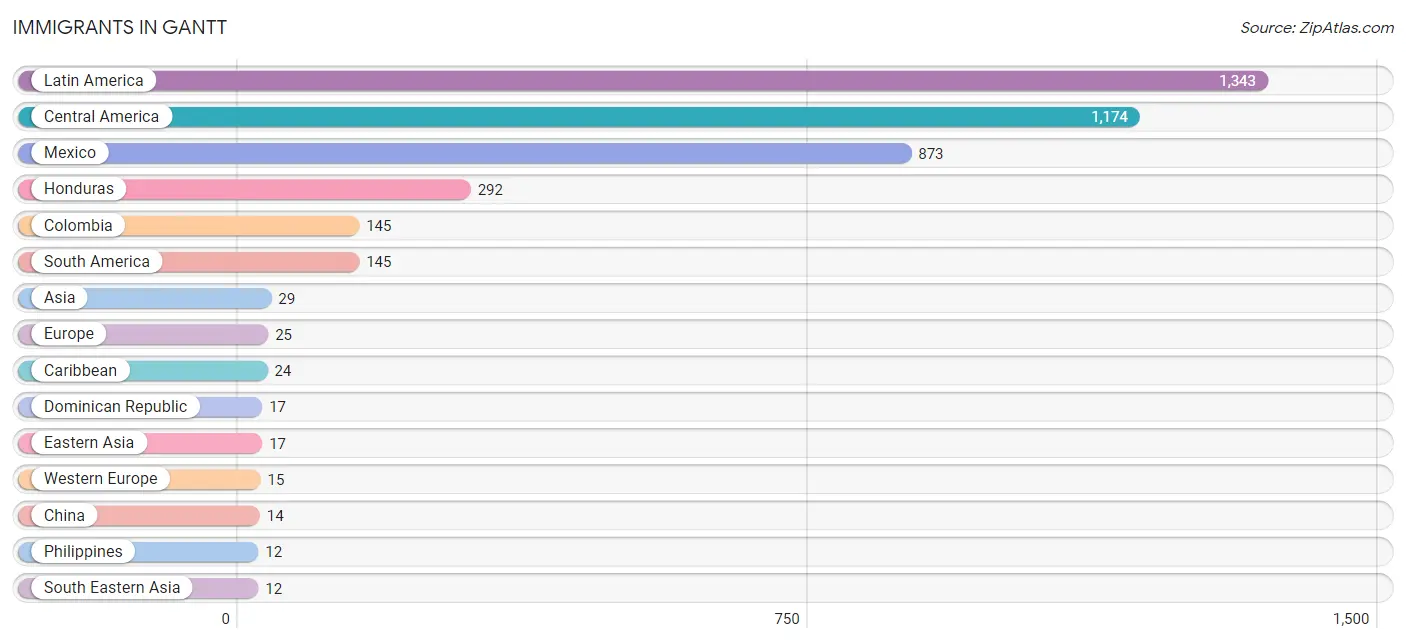
| Immigration Origin | # Population | % Population |
| Asia | 29 | 0.2% |
| Canada | 7 | 0.1% |
| Caribbean | 24 | 0.2% |
| Central America | 1,174 | 8.2% |
| China | 14 | 0.1% |
| Colombia | 145 | 1.0% |
| Dominican Republic | 17 | 0.1% |
| Eastern Asia | 17 | 0.1% |
| El Salvador | 6 | 0.0% |
| England | 10 | 0.1% |
| Europe | 25 | 0.2% |
| Germany | 11 | 0.1% |
| Grenada | 7 | 0.1% |
| Honduras | 292 | 2.1% |
| Korea | 3 | 0.0% |
| Latin America | 1,343 | 9.4% |
| Mexico | 873 | 6.1% |
| Nicaragua | 3 | 0.0% |
| Northern Europe | 10 | 0.1% |
| Philippines | 12 | 0.1% |
| South America | 145 | 1.0% |
| South Eastern Asia | 12 | 0.1% |
| Switzerland | 4 | 0.0% |
| Western Europe | 15 | 0.1% | View All 24 Rows |
Sex and Age in Gantt
Sex and Age in Gantt
The most populous age groups in Gantt are Under 5 Years (727 | 11.4%) for men and 20 to 24 Years (937 | 11.9%) for women.
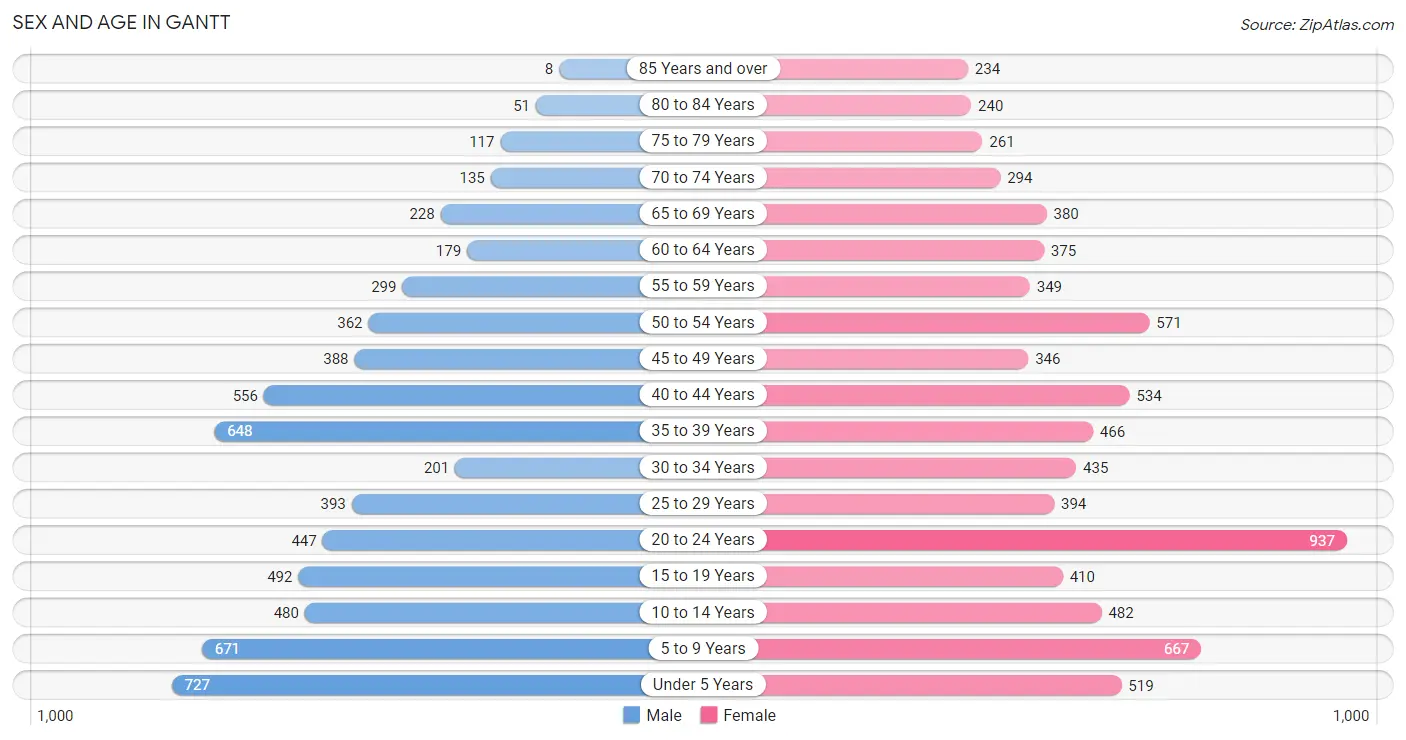
| Age Bracket | Male | Female |
| Under 5 Years | 727 (11.4%) | 519 (6.6%) |
| 5 to 9 Years | 671 (10.5%) | 667 (8.5%) |
| 10 to 14 Years | 480 (7.5%) | 482 (6.1%) |
| 15 to 19 Years | 492 (7.7%) | 410 (5.2%) |
| 20 to 24 Years | 447 (7.0%) | 937 (11.9%) |
| 25 to 29 Years | 393 (6.2%) | 394 (5.0%) |
| 30 to 34 Years | 201 (3.2%) | 435 (5.5%) |
| 35 to 39 Years | 648 (10.2%) | 466 (5.9%) |
| 40 to 44 Years | 556 (8.7%) | 534 (6.8%) |
| 45 to 49 Years | 388 (6.1%) | 346 (4.4%) |
| 50 to 54 Years | 362 (5.7%) | 571 (7.2%) |
| 55 to 59 Years | 299 (4.7%) | 349 (4.4%) |
| 60 to 64 Years | 179 (2.8%) | 375 (4.8%) |
| 65 to 69 Years | 228 (3.6%) | 380 (4.8%) |
| 70 to 74 Years | 135 (2.1%) | 294 (3.7%) |
| 75 to 79 Years | 117 (1.8%) | 261 (3.3%) |
| 80 to 84 Years | 51 (0.8%) | 240 (3.0%) |
| 85 Years and over | 8 (0.1%) | 234 (3.0%) |
| Total | 6,382 (100.0%) | 7,894 (100.0%) |
Families and Households in Gantt
Median Family Size in Gantt
The median family size in Gantt is 3.12 persons per family, with married-couple families (1,685 | 46.0%) accounting for the largest median family size of 3.38 persons per family. On the other hand, single male/father families (396 | 10.8%) represent the smallest median family size with 2.75 persons per family.
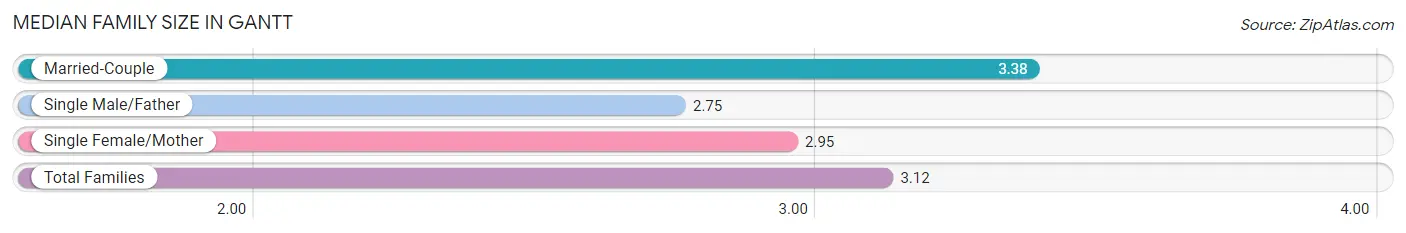
| Family Type | # Families | Family Size |
| Married-Couple | 1,685 (46.0%) | 3.38 |
| Single Male/Father | 396 (10.8%) | 2.75 |
| Single Female/Mother | 1,584 (43.2%) | 2.95 |
| Total Families | 3,665 (100.0%) | 3.12 |
Median Household Size in Gantt
The median household size in Gantt is 2.60 persons per household, with single male/father households (396 | 7.2%) accounting for the largest median household size of 3.49 persons per household. non-family households (1,810 | 33.1%) represent the smallest median household size with 1.17 persons per household.
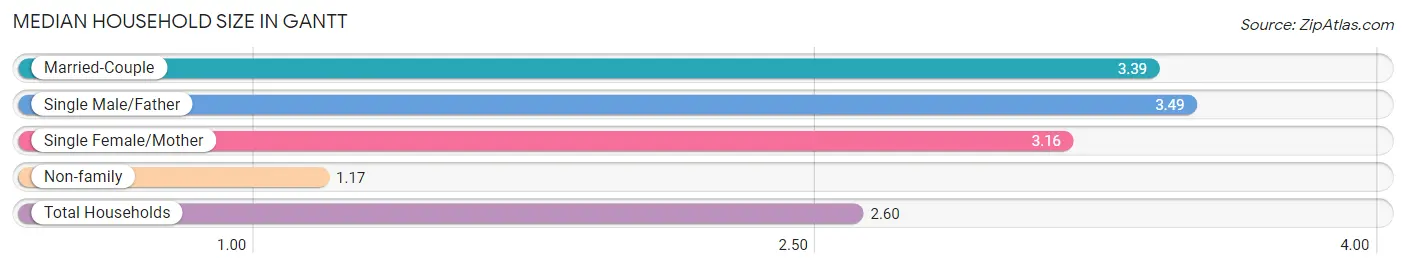
| Household Type | # Households | Household Size |
| Married-Couple | 1,685 (30.8%) | 3.39 |
| Single Male/Father | 396 (7.2%) | 3.49 |
| Single Female/Mother | 1,584 (28.9%) | 3.16 |
| Non-family | 1,810 (33.1%) | 1.17 |
| Total Households | 5,475 (100.0%) | 2.60 |
Household Size by Marriage Status in Gantt
Out of a total of 5,475 households in Gantt, 3,665 (66.9%) are family households, while 1,810 (33.1%) are nonfamily households. The most numerous type of family households are 2-person households, comprising 1,756, and the most common type of nonfamily households are 1-person households, comprising 1,603.
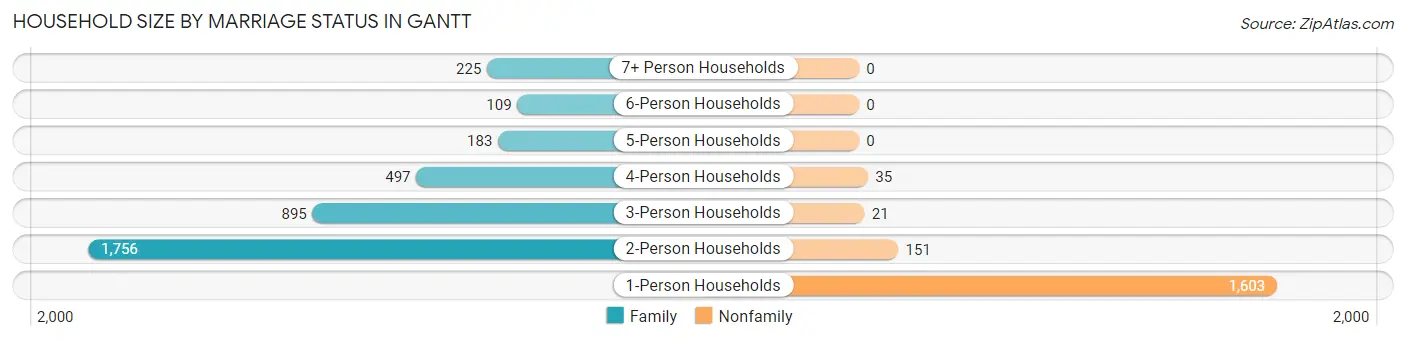
| Household Size | Family Households | Nonfamily Households |
| 1-Person Households | - | 1,603 (29.3%) |
| 2-Person Households | 1,756 (32.1%) | 151 (2.8%) |
| 3-Person Households | 895 (16.4%) | 21 (0.4%) |
| 4-Person Households | 497 (9.1%) | 35 (0.6%) |
| 5-Person Households | 183 (3.3%) | 0 (0.0%) |
| 6-Person Households | 109 (2.0%) | 0 (0.0%) |
| 7+ Person Households | 225 (4.1%) | 0 (0.0%) |
| Total | 3,665 (66.9%) | 1,810 (33.1%) |
Female Fertility in Gantt
Fertility by Age in Gantt
Average fertility rate in Gantt is 44.0 births per 1,000 women. Women in the age bracket of 20 to 34 years have the highest fertility rate with 65.0 births per 1,000 women. Women in the age bracket of 20 to 34 years acount for 70.6% of all women with births.
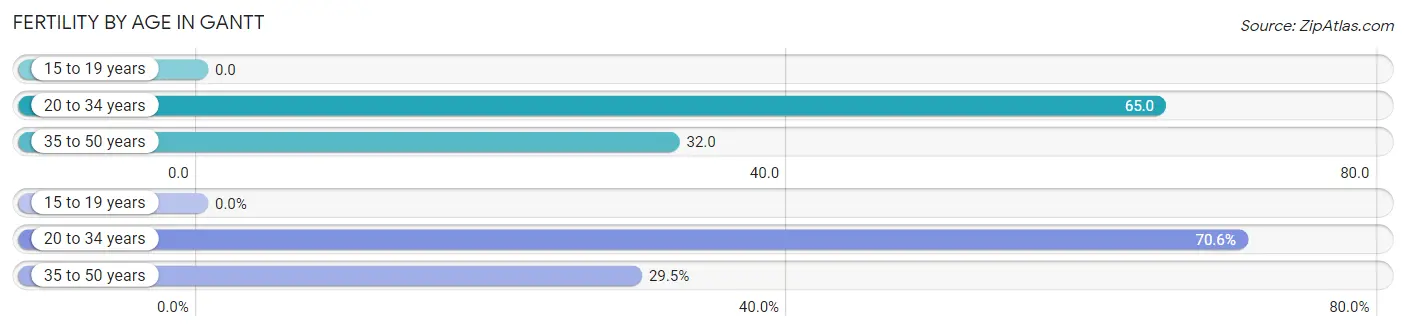
| Age Bracket | Women with Births | Births / 1,000 Women |
| 15 to 19 years | 0 (0.0%) | 0.0 |
| 20 to 34 years | 115 (70.6%) | 65.0 |
| 35 to 50 years | 48 (29.4%) | 32.0 |
| Total | 163 (100.0%) | 44.0 |
Fertility by Age by Marriage Status in Gantt
30.7% of women with births (163) in Gantt are married. The highest percentage of unmarried women with births falls into 35 to 50 years age bracket with 100.0% of them unmarried at the time of birth, while the lowest percentage of unmarried women with births belong to 20 to 34 years age bracket with 56.5% of them unmarried.
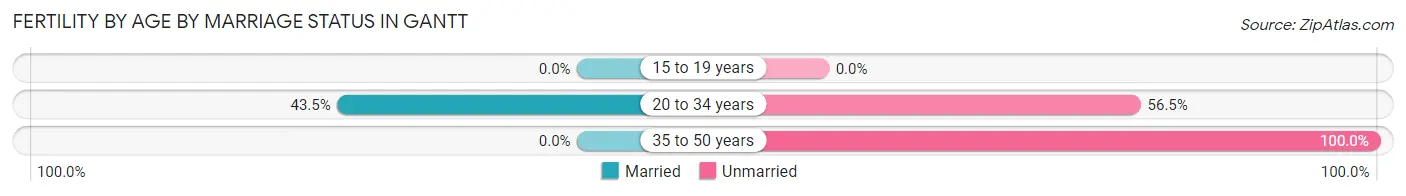
| Age Bracket | Married | Unmarried |
| 15 to 19 years | 0 (0.0%) | 0 (0.0%) |
| 20 to 34 years | 50 (43.5%) | 65 (56.5%) |
| 35 to 50 years | 0 (0.0%) | 48 (100.0%) |
| Total | 50 (30.7%) | 113 (69.3%) |
Fertility by Education in Gantt
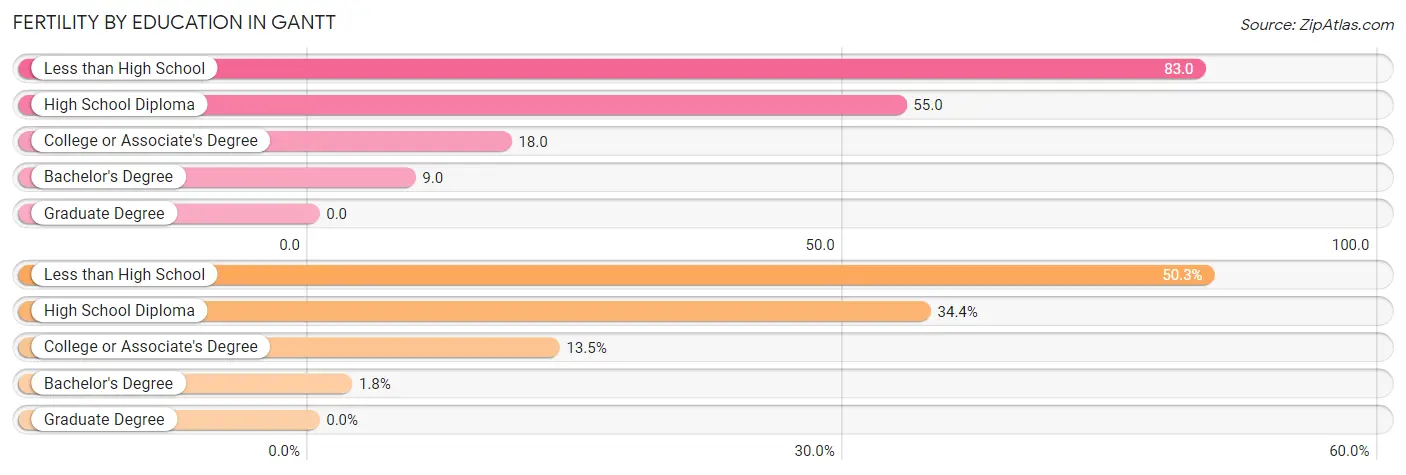
| Educational Attainment | Women with Births | Births / 1,000 Women |
| Less than High School | 82 (50.3%) | 83.0 |
| High School Diploma | 56 (34.4%) | 55.0 |
| College or Associate's Degree | 22 (13.5%) | 18.0 |
| Bachelor's Degree | 3 (1.8%) | 9.0 |
| Graduate Degree | 0 (0.0%) | 0.0 |
| Total | 163 (100.0%) | 44.0 |
Fertility by Education by Marriage Status in Gantt
69.3% of women with births in Gantt are unmarried. Women with the educational attainment of college or associate's degree are most likely to be married with 100.0% of them married at childbirth, while women with the educational attainment of less than high school are least likely to be married with 100.0% of them unmarried at childbirth.
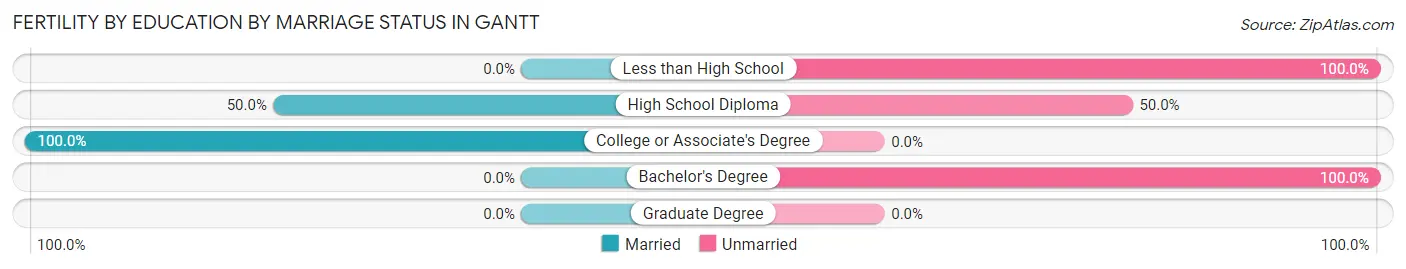
| Educational Attainment | Married | Unmarried |
| Less than High School | 0 (0.0%) | 82 (100.0%) |
| High School Diploma | 28 (50.0%) | 28 (50.0%) |
| College or Associate's Degree | 22 (100.0%) | 0 (0.0%) |
| Bachelor's Degree | 0 (0.0%) | 3 (100.0%) |
| Graduate Degree | 0 (0.0%) | 0 (0.0%) |
| Total | 50 (30.7%) | 113 (69.3%) |
Employment Characteristics in Gantt
Employment by Class of Employer in Gantt
Among the 6,065 employed individuals in Gantt, private company employees (4,746 | 78.2%), self-employed (not incorporated) (374 | 6.2%), and not-for-profit organizations (330 | 5.4%) make up the most common classes of employment.
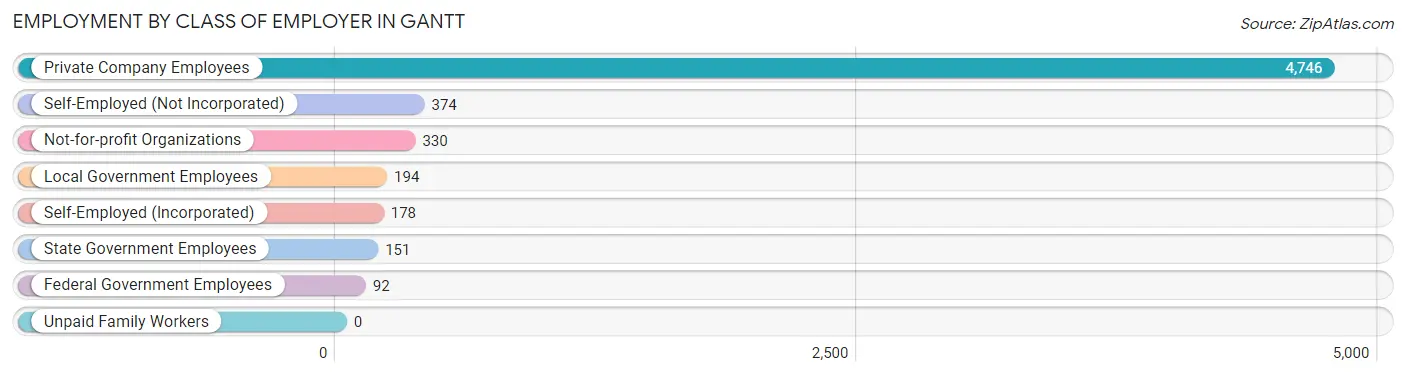
| Employer Class | # Employees | % Employees |
| Private Company Employees | 4,746 | 78.2% |
| Self-Employed (Incorporated) | 178 | 2.9% |
| Self-Employed (Not Incorporated) | 374 | 6.2% |
| Not-for-profit Organizations | 330 | 5.4% |
| Local Government Employees | 194 | 3.2% |
| State Government Employees | 151 | 2.5% |
| Federal Government Employees | 92 | 1.5% |
| Unpaid Family Workers | 0 | 0.0% |
| Total | 6,065 | 100.0% |
Employment Status by Age in Gantt
According to the labor force statistics for Gantt, out of the total population over 16 years of age (10,514), 64.7% or 6,803 individuals are in the labor force, with 8.6% or 585 of them unemployed. The age group with the highest labor force participation rate is 20 to 24 years, with 88.6% or 1,226 individuals in the labor force. Within the labor force, the 30 to 34 years age range has the highest percentage of unemployed individuals, with 29.3% or 113 of them being unemployed.
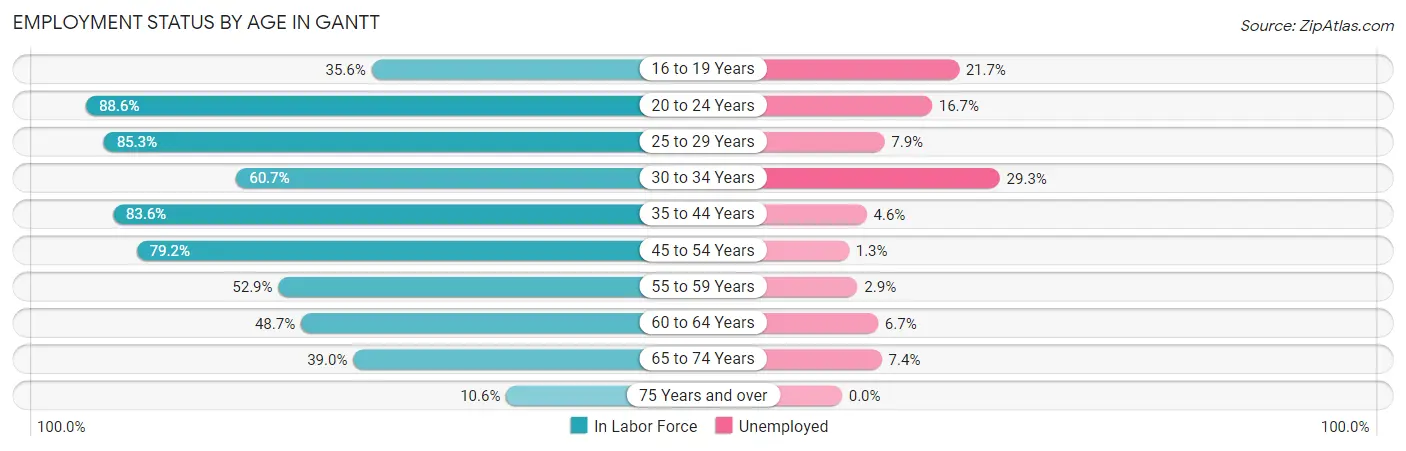
| Age Bracket | In Labor Force | Unemployed |
| 16 to 19 Years | 244 (35.6%) | 53 (21.7%) |
| 20 to 24 Years | 1,226 (88.6%) | 205 (16.7%) |
| 25 to 29 Years | 671 (85.3%) | 53 (7.9%) |
| 30 to 34 Years | 386 (60.7%) | 113 (29.3%) |
| 35 to 44 Years | 1,843 (83.6%) | 85 (4.6%) |
| 45 to 54 Years | 1,320 (79.2%) | 17 (1.3%) |
| 55 to 59 Years | 343 (52.9%) | 10 (2.9%) |
| 60 to 64 Years | 270 (48.7%) | 18 (6.7%) |
| 65 to 74 Years | 404 (39.0%) | 30 (7.4%) |
| 75 Years and over | 97 (10.6%) | 0 (0.0%) |
| Total | 6,803 (64.7%) | 585 (8.6%) |
Employment Status by Educational Attainment in Gantt
According to labor force statistics for Gantt, 74.4% of individuals (4,833) out of the total population between 25 and 64 years of age (6,496) are in the labor force, with 6.1% or 295 of them being unemployed. The group with the highest labor force participation rate are those with the educational attainment of bachelor's degree or higher, with 85.6% or 993 individuals in the labor force. Within the labor force, individuals with less than high school education have the highest percentage of unemployment, with 22.7% or 168 of them being unemployed.
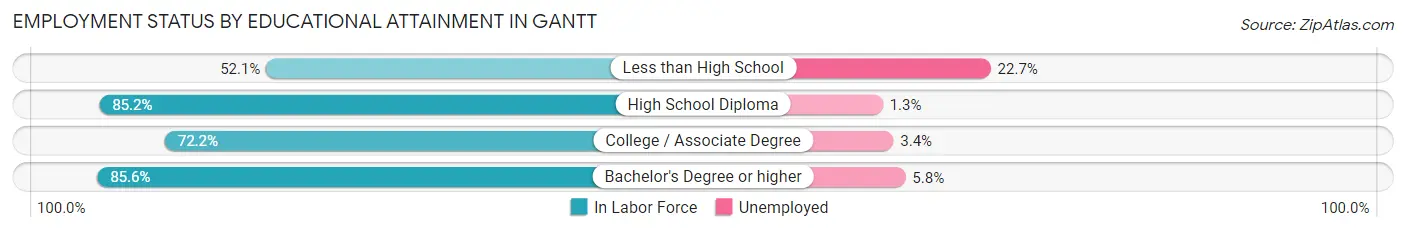
| Educational Attainment | In Labor Force | Unemployed |
| Less than High School | 740 (52.1%) | 323 (22.7%) |
| High School Diploma | 1,791 (85.2%) | 27 (1.3%) |
| College / Associate Degree | 1,309 (72.2%) | 62 (3.4%) |
| Bachelor's Degree or higher | 993 (85.6%) | 67 (5.8%) |
| Total | 4,833 (74.4%) | 396 (6.1%) |
Employment Occupations by Sex in Gantt
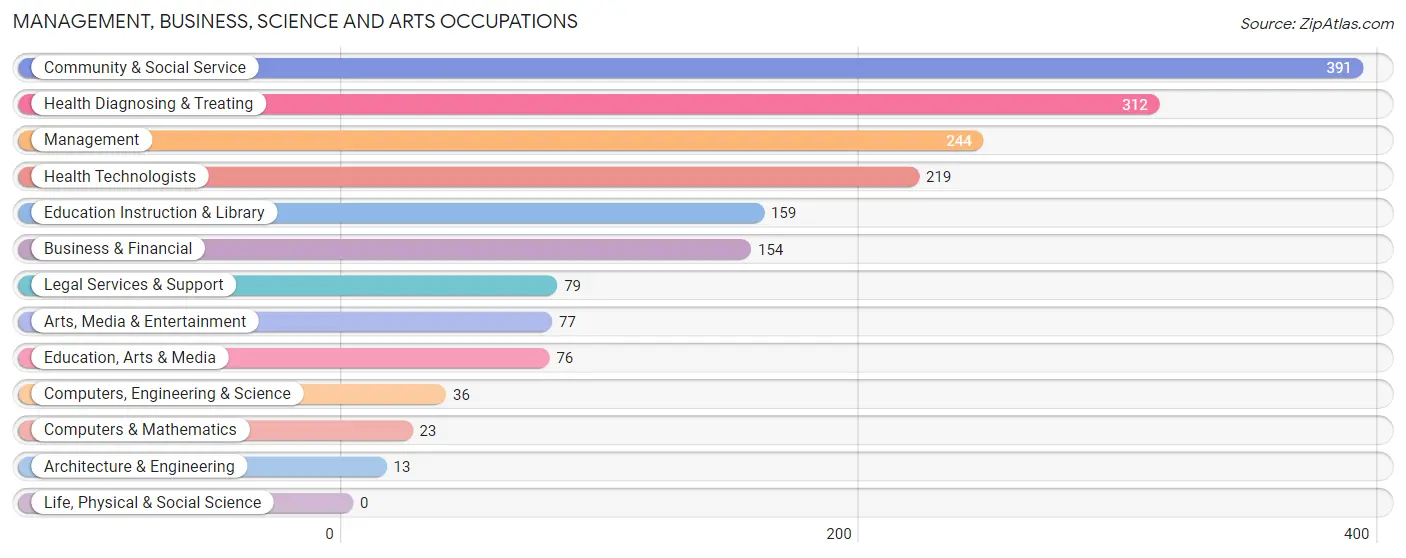
Management, Business, Science and Arts Occupations
The most common Management, Business, Science and Arts occupations in Gantt are Community & Social Service (391 | 6.3%), Health Diagnosing & Treating (312 | 5.0%), Management (244 | 3.9%), Health Technologists (219 | 3.5%), and Education Instruction & Library (159 | 2.6%).
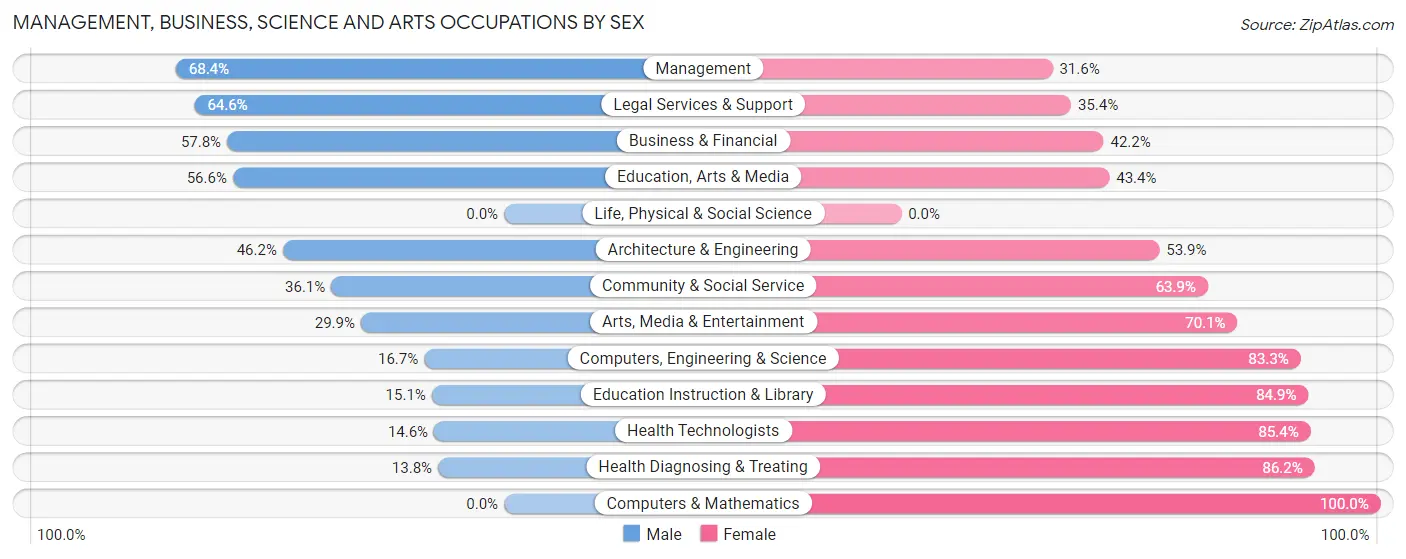
Management, Business, Science and Arts Occupations by Sex
Within the Management, Business, Science and Arts occupations in Gantt, the most male-oriented occupations are Management (68.4%), Legal Services & Support (64.6%), and Business & Financial (57.8%), while the most female-oriented occupations are Computers & Mathematics (100.0%), Health Diagnosing & Treating (86.2%), and Health Technologists (85.4%).
| Occupation | Male | Female |
| Management | 167 (68.4%) | 77 (31.6%) |
| Business & Financial | 89 (57.8%) | 65 (42.2%) |
| Computers, Engineering & Science | 6 (16.7%) | 30 (83.3%) |
| Computers & Mathematics | 0 (0.0%) | 23 (100.0%) |
| Architecture & Engineering | 6 (46.2%) | 7 (53.8%) |
| Life, Physical & Social Science | 0 (0.0%) | 0 (0.0%) |
| Community & Social Service | 141 (36.1%) | 250 (63.9%) |
| Education, Arts & Media | 43 (56.6%) | 33 (43.4%) |
| Legal Services & Support | 51 (64.6%) | 28 (35.4%) |
| Education Instruction & Library | 24 (15.1%) | 135 (84.9%) |
| Arts, Media & Entertainment | 23 (29.9%) | 54 (70.1%) |
| Health Diagnosing & Treating | 43 (13.8%) | 269 (86.2%) |
| Health Technologists | 32 (14.6%) | 187 (85.4%) |
| Total (Category) | 446 (39.2%) | 691 (60.8%) |
| Total (Overall) | 3,186 (51.2%) | 3,035 (48.8%) |
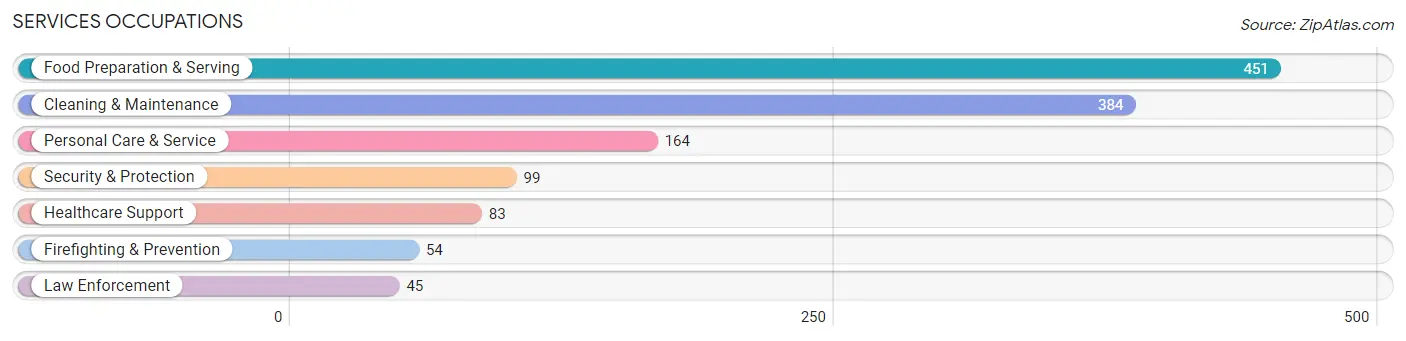
Services Occupations
The most common Services occupations in Gantt are Food Preparation & Serving (451 | 7.2%), Cleaning & Maintenance (384 | 6.2%), Personal Care & Service (164 | 2.6%), Security & Protection (99 | 1.6%), and Healthcare Support (83 | 1.3%).
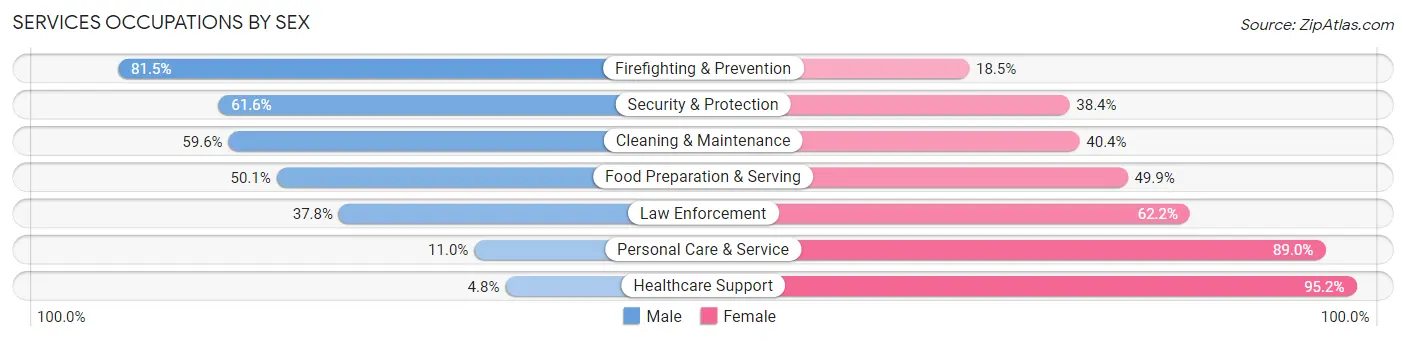
Services Occupations by Sex
Within the Services occupations in Gantt, the most male-oriented occupations are Firefighting & Prevention (81.5%), Security & Protection (61.6%), and Cleaning & Maintenance (59.6%), while the most female-oriented occupations are Healthcare Support (95.2%), Personal Care & Service (89.0%), and Law Enforcement (62.2%).
| Occupation | Male | Female |
| Healthcare Support | 4 (4.8%) | 79 (95.2%) |
| Security & Protection | 61 (61.6%) | 38 (38.4%) |
| Firefighting & Prevention | 44 (81.5%) | 10 (18.5%) |
| Law Enforcement | 17 (37.8%) | 28 (62.2%) |
| Food Preparation & Serving | 226 (50.1%) | 225 (49.9%) |
| Cleaning & Maintenance | 229 (59.6%) | 155 (40.4%) |
| Personal Care & Service | 18 (11.0%) | 146 (89.0%) |
| Total (Category) | 538 (45.6%) | 643 (54.4%) |
| Total (Overall) | 3,186 (51.2%) | 3,035 (48.8%) |
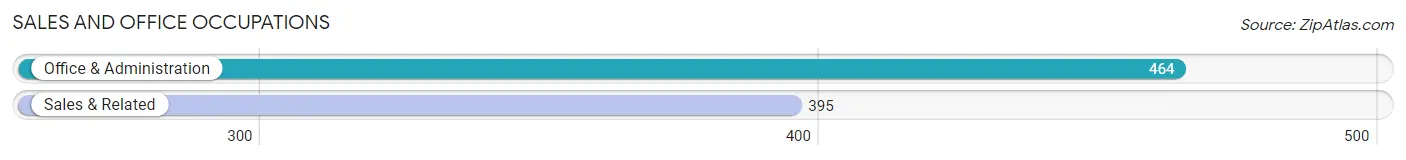
Sales and Office Occupations
The most common Sales and Office occupations in Gantt are Office & Administration (464 | 7.5%), and Sales & Related (395 | 6.4%).
Sales and Office Occupations by Sex
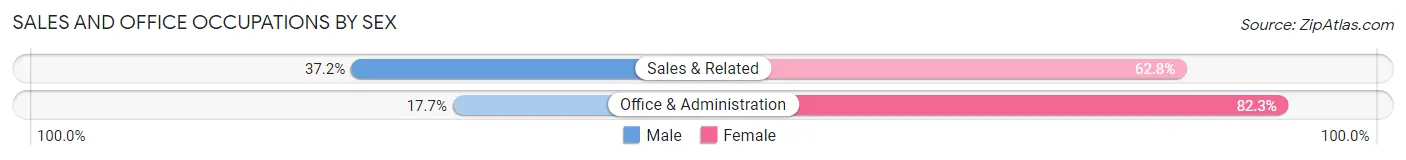
| Occupation | Male | Female |
| Sales & Related | 147 (37.2%) | 248 (62.8%) |
| Office & Administration | 82 (17.7%) | 382 (82.3%) |
| Total (Category) | 229 (26.7%) | 630 (73.3%) |
| Total (Overall) | 3,186 (51.2%) | 3,035 (48.8%) |
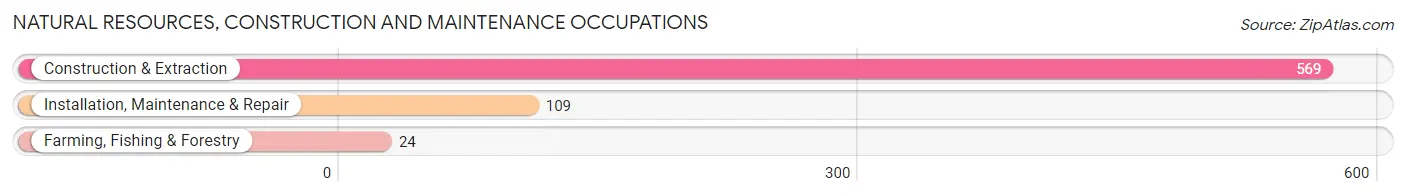
Natural Resources, Construction and Maintenance Occupations
The most common Natural Resources, Construction and Maintenance occupations in Gantt are Construction & Extraction (569 | 9.1%), Installation, Maintenance & Repair (109 | 1.8%), and Farming, Fishing & Forestry (24 | 0.4%).
Natural Resources, Construction and Maintenance Occupations by Sex
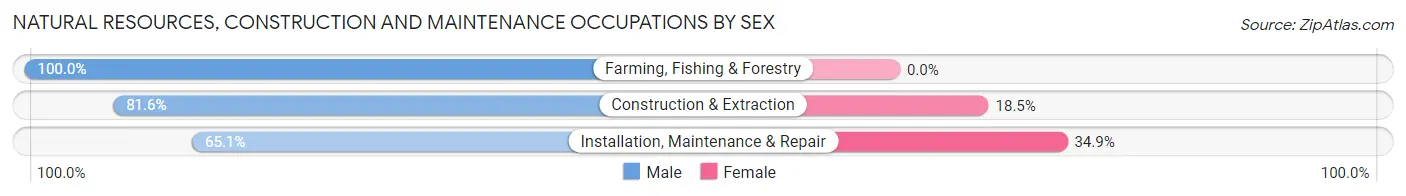
| Occupation | Male | Female |
| Farming, Fishing & Forestry | 24 (100.0%) | 0 (0.0%) |
| Construction & Extraction | 464 (81.6%) | 105 (18.4%) |
| Installation, Maintenance & Repair | 71 (65.1%) | 38 (34.9%) |
| Total (Category) | 559 (79.6%) | 143 (20.4%) |
| Total (Overall) | 3,186 (51.2%) | 3,035 (48.8%) |
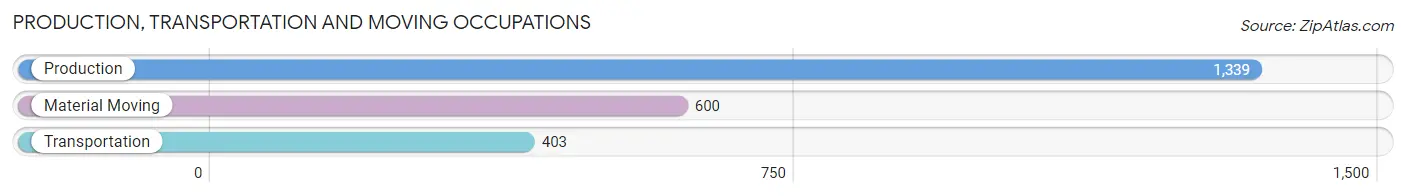
Production, Transportation and Moving Occupations
The most common Production, Transportation and Moving occupations in Gantt are Production (1,339 | 21.5%), Material Moving (600 | 9.6%), and Transportation (403 | 6.5%).
Production, Transportation and Moving Occupations by Sex
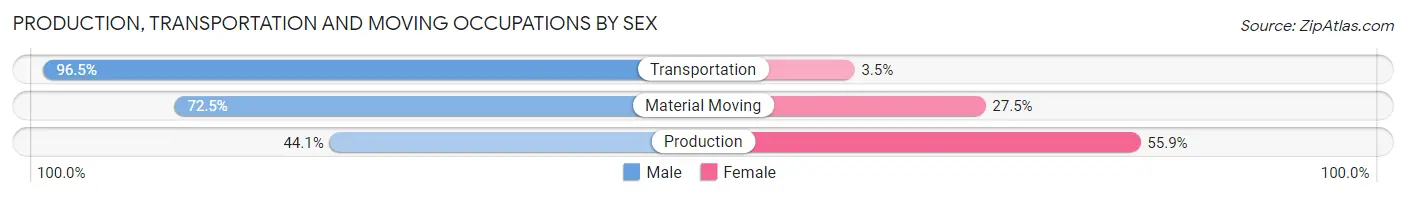
| Occupation | Male | Female |
| Production | 590 (44.1%) | 749 (55.9%) |
| Transportation | 389 (96.5%) | 14 (3.5%) |
| Material Moving | 435 (72.5%) | 165 (27.5%) |
| Total (Category) | 1,414 (60.4%) | 928 (39.6%) |
| Total (Overall) | 3,186 (51.2%) | 3,035 (48.8%) |
Employment Industries by Sex in Gantt
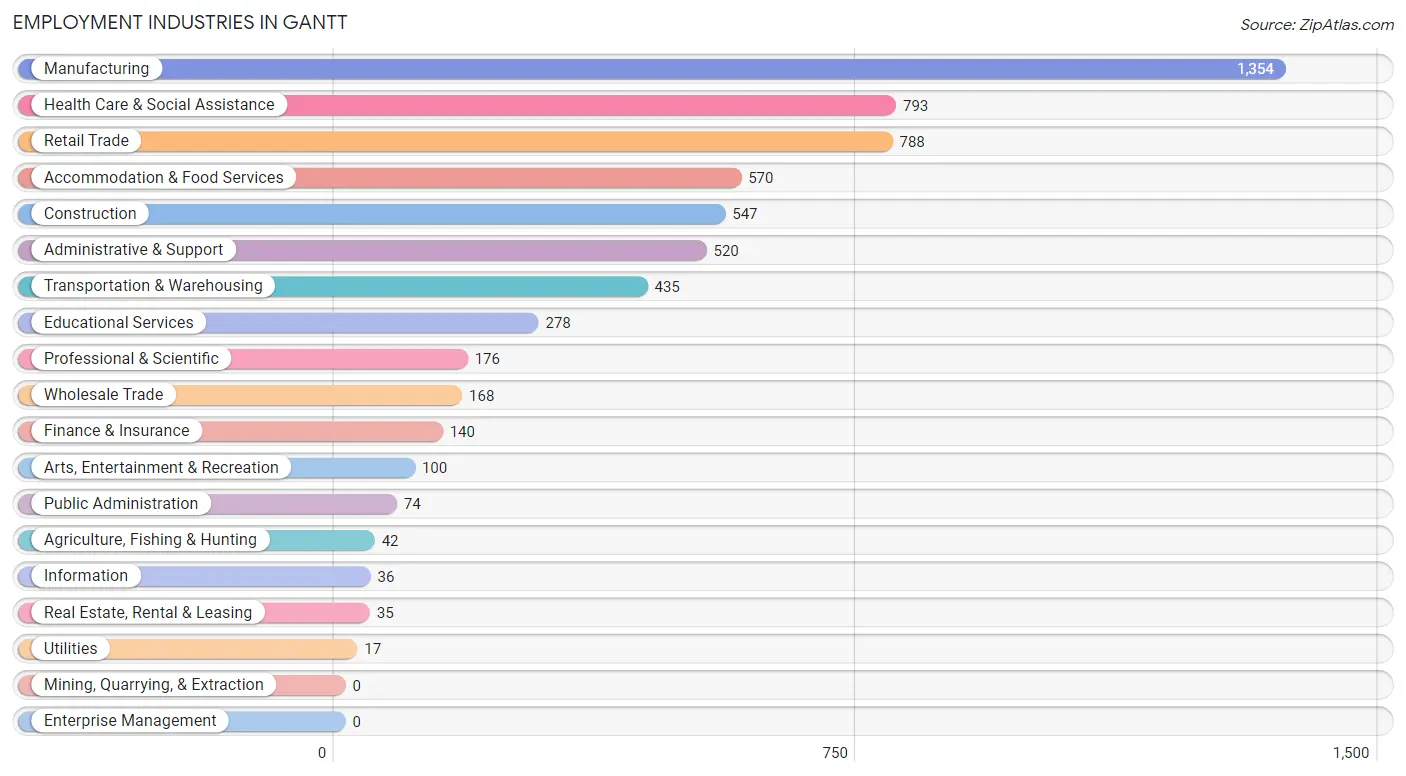
Employment Industries in Gantt
The major employment industries in Gantt include Manufacturing (1,354 | 21.8%), Health Care & Social Assistance (793 | 12.8%), Retail Trade (788 | 12.7%), Accommodation & Food Services (570 | 9.2%), and Construction (547 | 8.8%).
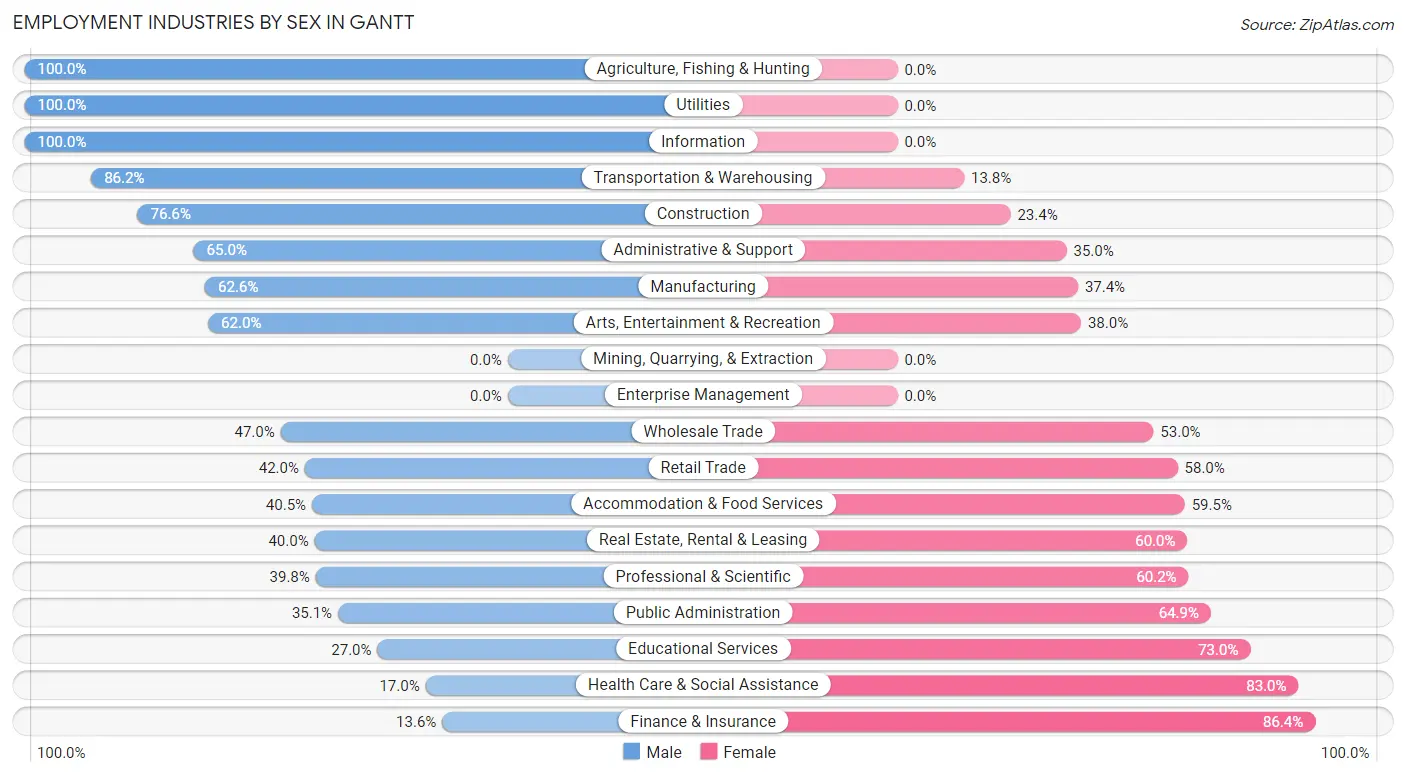
Employment Industries by Sex in Gantt
The Gantt industries that see more men than women are Agriculture, Fishing & Hunting (100.0%), Utilities (100.0%), and Information (100.0%), whereas the industries that tend to have a higher number of women are Finance & Insurance (86.4%), Health Care & Social Assistance (83.0%), and Educational Services (73.0%).
| Industry | Male | Female |
| Agriculture, Fishing & Hunting | 42 (100.0%) | 0 (0.0%) |
| Mining, Quarrying, & Extraction | 0 (0.0%) | 0 (0.0%) |
| Construction | 419 (76.6%) | 128 (23.4%) |
| Manufacturing | 848 (62.6%) | 506 (37.4%) |
| Wholesale Trade | 79 (47.0%) | 89 (53.0%) |
| Retail Trade | 331 (42.0%) | 457 (58.0%) |
| Transportation & Warehousing | 375 (86.2%) | 60 (13.8%) |
| Utilities | 17 (100.0%) | 0 (0.0%) |
| Information | 36 (100.0%) | 0 (0.0%) |
| Finance & Insurance | 19 (13.6%) | 121 (86.4%) |
| Real Estate, Rental & Leasing | 14 (40.0%) | 21 (60.0%) |
| Professional & Scientific | 70 (39.8%) | 106 (60.2%) |
| Enterprise Management | 0 (0.0%) | 0 (0.0%) |
| Administrative & Support | 338 (65.0%) | 182 (35.0%) |
| Educational Services | 75 (27.0%) | 203 (73.0%) |
| Health Care & Social Assistance | 135 (17.0%) | 658 (83.0%) |
| Arts, Entertainment & Recreation | 62 (62.0%) | 38 (38.0%) |
| Accommodation & Food Services | 231 (40.5%) | 339 (59.5%) |
| Public Administration | 26 (35.1%) | 48 (64.9%) |
| Total | 3,186 (51.2%) | 3,035 (48.8%) |
Education in Gantt
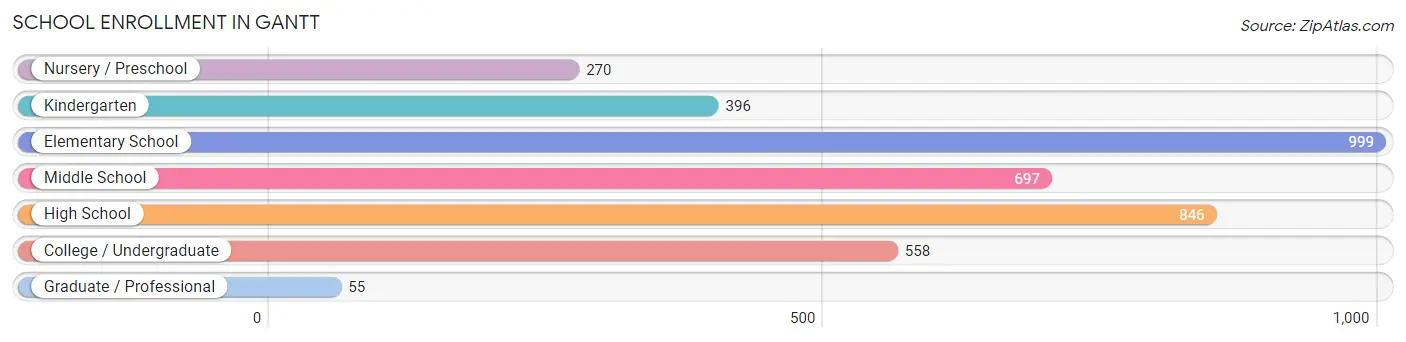
School Enrollment in Gantt
The most common levels of schooling among the 3,821 students in Gantt are elementary school (999 | 26.1%), high school (846 | 22.1%), and middle school (697 | 18.2%).
| School Level | # Students | % Students |
| Nursery / Preschool | 270 | 7.1% |
| Kindergarten | 396 | 10.4% |
| Elementary School | 999 | 26.1% |
| Middle School | 697 | 18.2% |
| High School | 846 | 22.1% |
| College / Undergraduate | 558 | 14.6% |
| Graduate / Professional | 55 | 1.4% |
| Total | 3,821 | 100.0% |
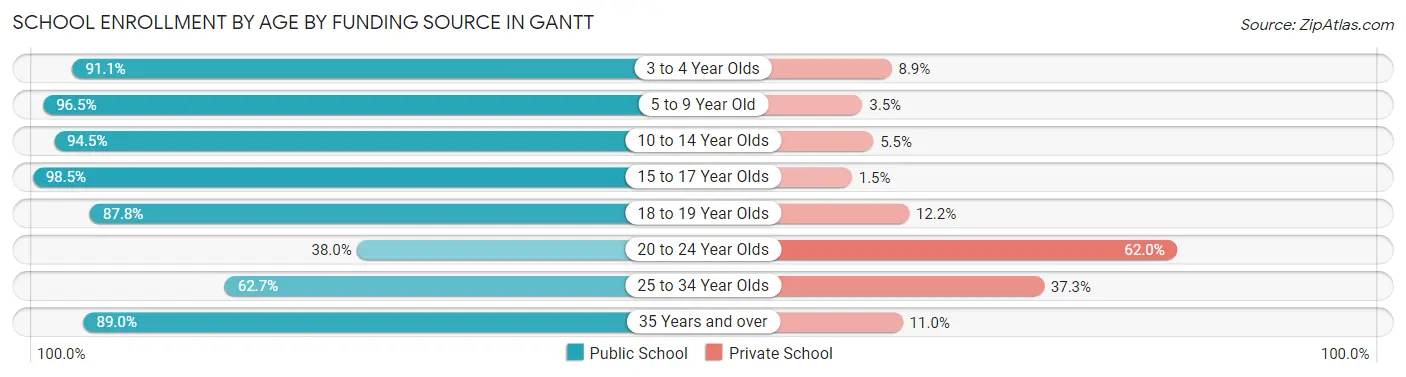
School Enrollment by Age by Funding Source in Gantt
Out of a total of 3,821 students who are enrolled in schools in Gantt, 405 (10.6%) attend a private institution, while the remaining 3,416 (89.4%) are enrolled in public schools. The age group of 20 to 24 year olds has the highest likelihood of being enrolled in private schools, with 222 (62.0% in the age bracket) enrolled. Conversely, the age group of 15 to 17 year olds has the lowest likelihood of being enrolled in a private school, with 651 (98.5% in the age bracket) attending a public institution.
| Age Bracket | Public School | Private School |
| 3 to 4 Year Olds | 245 (91.1%) | 24 (8.9%) |
| 5 to 9 Year Old | 1,277 (96.5%) | 46 (3.5%) |
| 10 to 14 Year Olds | 807 (94.5%) | 47 (5.5%) |
| 15 to 17 Year Olds | 651 (98.5%) | 10 (1.5%) |
| 18 to 19 Year Olds | 101 (87.8%) | 14 (12.2%) |
| 20 to 24 Year Olds | 136 (38.0%) | 222 (62.0%) |
| 25 to 34 Year Olds | 37 (62.7%) | 22 (37.3%) |
| 35 Years and over | 162 (89.0%) | 20 (11.0%) |
| Total | 3,416 (89.4%) | 405 (10.6%) |
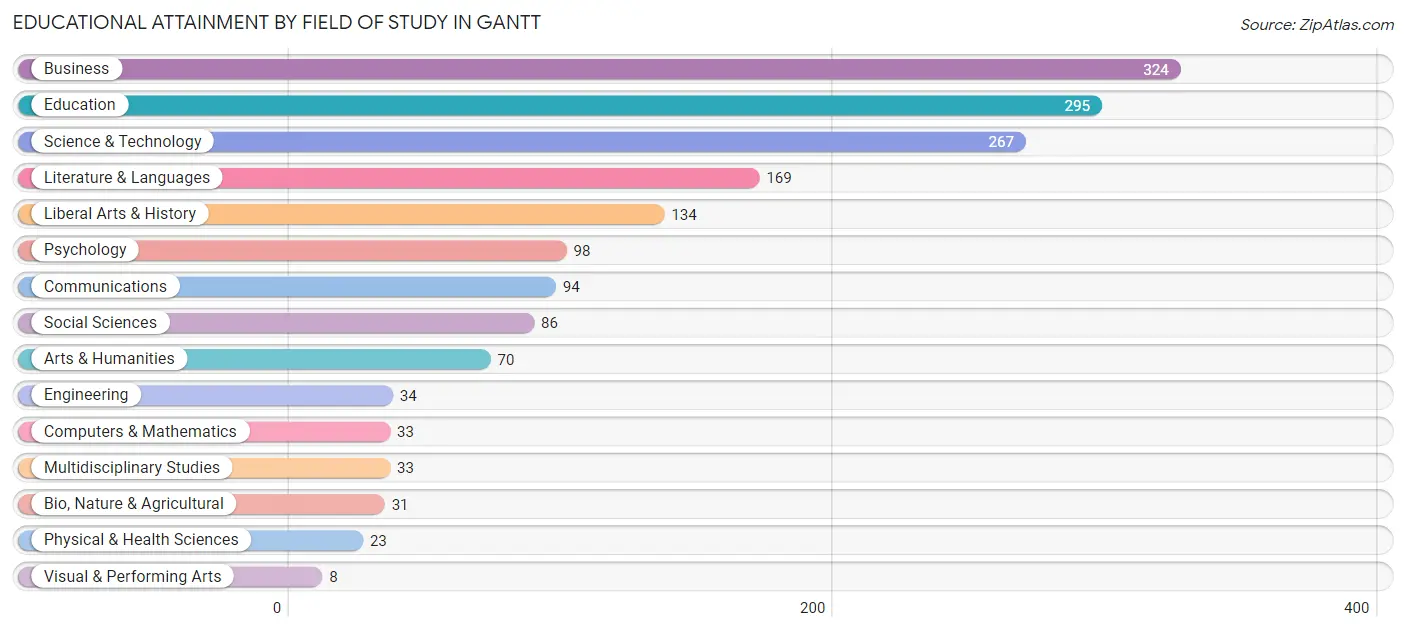
Educational Attainment by Field of Study in Gantt
Business (324 | 19.1%), education (295 | 17.4%), science & technology (267 | 15.7%), literature & languages (169 | 10.0%), and liberal arts & history (134 | 7.9%) are the most common fields of study among 1,699 individuals in Gantt who have obtained a bachelor's degree or higher.
| Field of Study | # Graduates | % Graduates |
| Computers & Mathematics | 33 | 1.9% |
| Bio, Nature & Agricultural | 31 | 1.8% |
| Physical & Health Sciences | 23 | 1.3% |
| Psychology | 98 | 5.8% |
| Social Sciences | 86 | 5.1% |
| Engineering | 34 | 2.0% |
| Multidisciplinary Studies | 33 | 1.9% |
| Science & Technology | 267 | 15.7% |
| Business | 324 | 19.1% |
| Education | 295 | 17.4% |
| Literature & Languages | 169 | 10.0% |
| Liberal Arts & History | 134 | 7.9% |
| Visual & Performing Arts | 8 | 0.5% |
| Communications | 94 | 5.5% |
| Arts & Humanities | 70 | 4.1% |
| Total | 1,699 | 100.0% |
Transportation & Commute in Gantt
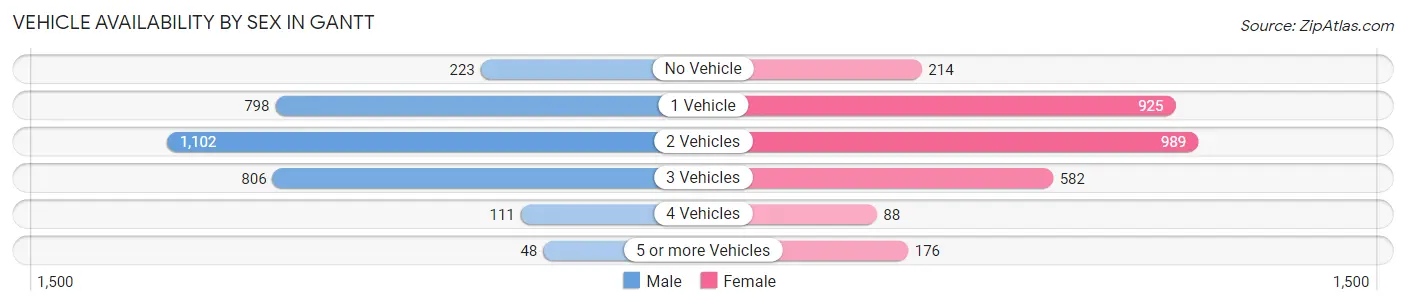
Vehicle Availability by Sex in Gantt
The most prevalent vehicle ownership categories in Gantt are males with 2 vehicles (1,102, accounting for 35.7%) and females with 2 vehicles (989, making up 37.0%).
| Vehicles Available | Male | Female |
| No Vehicle | 223 (7.2%) | 214 (7.2%) |
| 1 Vehicle | 798 (25.8%) | 925 (31.1%) |
| 2 Vehicles | 1,102 (35.7%) | 989 (33.3%) |
| 3 Vehicles | 806 (26.1%) | 582 (19.6%) |
| 4 Vehicles | 111 (3.6%) | 88 (3.0%) |
| 5 or more Vehicles | 48 (1.5%) | 176 (5.9%) |
| Total | 3,088 (100.0%) | 2,974 (100.0%) |
Commute Time in Gantt
The most frequently occuring commute durations in Gantt are 15 to 19 minutes (1,363 commuters, 23.7%), 20 to 24 minutes (1,259 commuters, 21.9%), and 30 to 34 minutes (827 commuters, 14.4%).
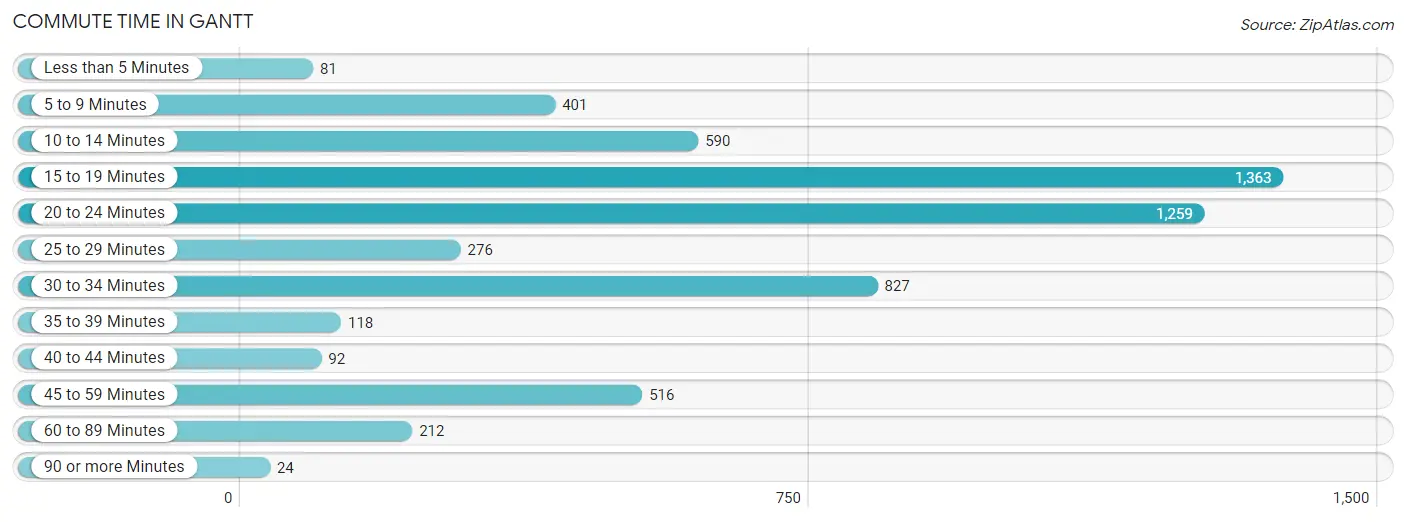
| Commute Time | # Commuters | % Commuters |
| Less than 5 Minutes | 81 | 1.4% |
| 5 to 9 Minutes | 401 | 7.0% |
| 10 to 14 Minutes | 590 | 10.2% |
| 15 to 19 Minutes | 1,363 | 23.7% |
| 20 to 24 Minutes | 1,259 | 21.9% |
| 25 to 29 Minutes | 276 | 4.8% |
| 30 to 34 Minutes | 827 | 14.4% |
| 35 to 39 Minutes | 118 | 2.1% |
| 40 to 44 Minutes | 92 | 1.6% |
| 45 to 59 Minutes | 516 | 9.0% |
| 60 to 89 Minutes | 212 | 3.7% |
| 90 or more Minutes | 24 | 0.4% |
Commute Time by Sex in Gantt
The most common commute times in Gantt are 15 to 19 minutes (743 commuters, 24.7%) for males and 20 to 24 minutes (821 commuters, 29.8%) for females.
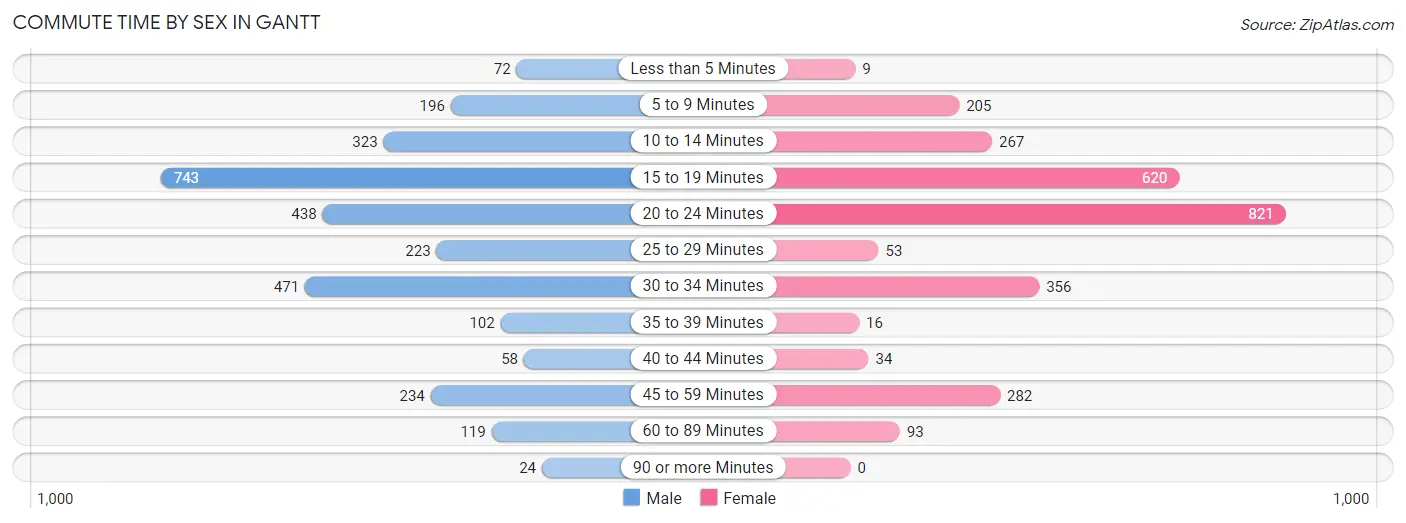
| Commute Time | Male | Female |
| Less than 5 Minutes | 72 (2.4%) | 9 (0.3%) |
| 5 to 9 Minutes | 196 (6.5%) | 205 (7.4%) |
| 10 to 14 Minutes | 323 (10.8%) | 267 (9.7%) |
| 15 to 19 Minutes | 743 (24.7%) | 620 (22.5%) |
| 20 to 24 Minutes | 438 (14.6%) | 821 (29.8%) |
| 25 to 29 Minutes | 223 (7.4%) | 53 (1.9%) |
| 30 to 34 Minutes | 471 (15.7%) | 356 (12.9%) |
| 35 to 39 Minutes | 102 (3.4%) | 16 (0.6%) |
| 40 to 44 Minutes | 58 (1.9%) | 34 (1.2%) |
| 45 to 59 Minutes | 234 (7.8%) | 282 (10.2%) |
| 60 to 89 Minutes | 119 (4.0%) | 93 (3.4%) |
| 90 or more Minutes | 24 (0.8%) | 0 (0.0%) |
Time of Departure to Work by Sex in Gantt
The most frequent times of departure to work in Gantt are 8:00 AM to 8:29 AM (440, 14.6%) for males and 7:00 AM to 7:29 AM (635, 23.0%) for females.
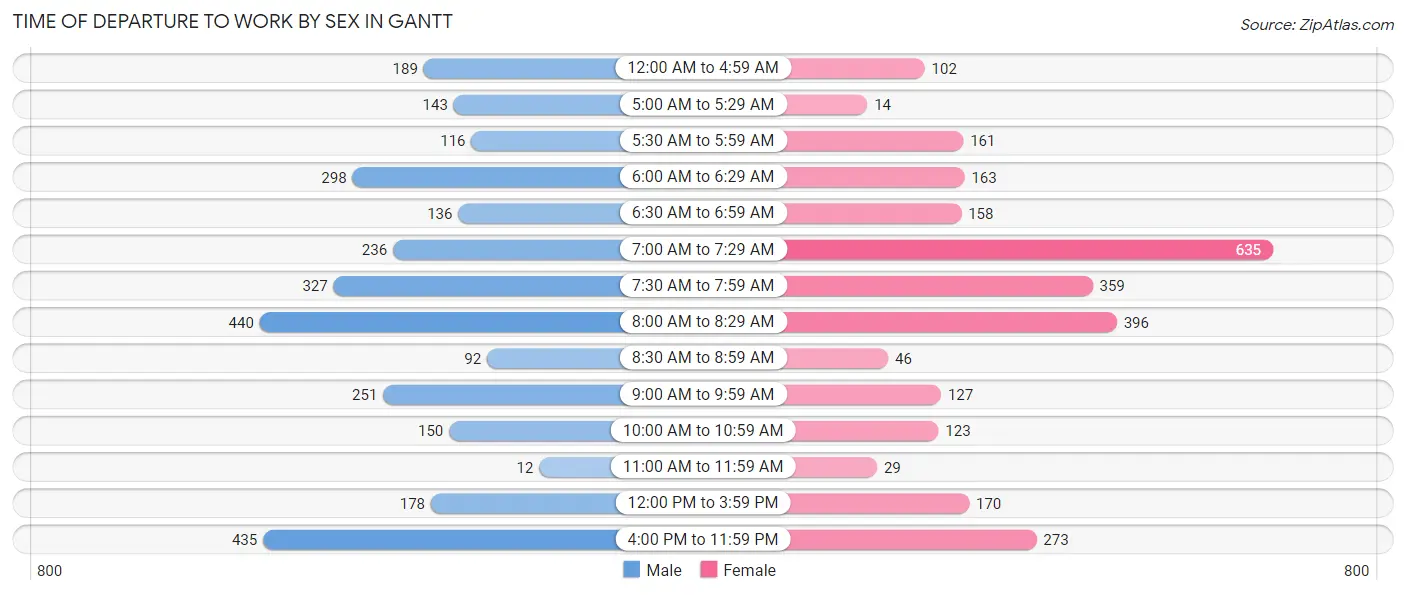
| Time of Departure | Male | Female |
| 12:00 AM to 4:59 AM | 189 (6.3%) | 102 (3.7%) |
| 5:00 AM to 5:29 AM | 143 (4.8%) | 14 (0.5%) |
| 5:30 AM to 5:59 AM | 116 (3.9%) | 161 (5.8%) |
| 6:00 AM to 6:29 AM | 298 (9.9%) | 163 (5.9%) |
| 6:30 AM to 6:59 AM | 136 (4.5%) | 158 (5.7%) |
| 7:00 AM to 7:29 AM | 236 (7.9%) | 635 (23.0%) |
| 7:30 AM to 7:59 AM | 327 (10.9%) | 359 (13.0%) |
| 8:00 AM to 8:29 AM | 440 (14.6%) | 396 (14.4%) |
| 8:30 AM to 8:59 AM | 92 (3.1%) | 46 (1.7%) |
| 9:00 AM to 9:59 AM | 251 (8.4%) | 127 (4.6%) |
| 10:00 AM to 10:59 AM | 150 (5.0%) | 123 (4.5%) |
| 11:00 AM to 11:59 AM | 12 (0.4%) | 29 (1.1%) |
| 12:00 PM to 3:59 PM | 178 (5.9%) | 170 (6.2%) |
| 4:00 PM to 11:59 PM | 435 (14.5%) | 273 (9.9%) |
| Total | 3,003 (100.0%) | 2,756 (100.0%) |
Housing Occupancy in Gantt
Occupancy by Ownership in Gantt
Of the total 5,475 dwellings in Gantt, owner-occupied units account for 3,214 (58.7%), while renter-occupied units make up 2,261 (41.3%).
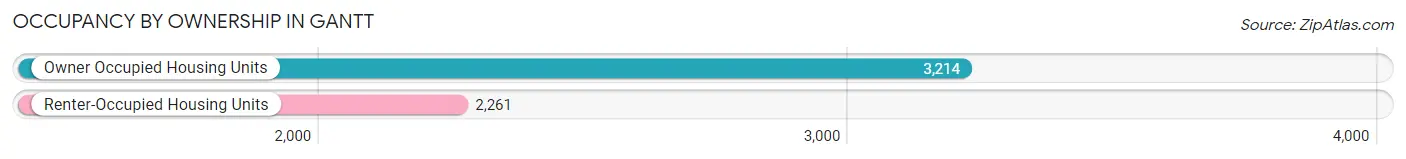
| Occupancy | # Housing Units | % Housing Units |
| Owner Occupied Housing Units | 3,214 | 58.7% |
| Renter-Occupied Housing Units | 2,261 | 41.3% |
| Total Occupied Housing Units | 5,475 | 100.0% |
Occupancy by Household Size in Gantt
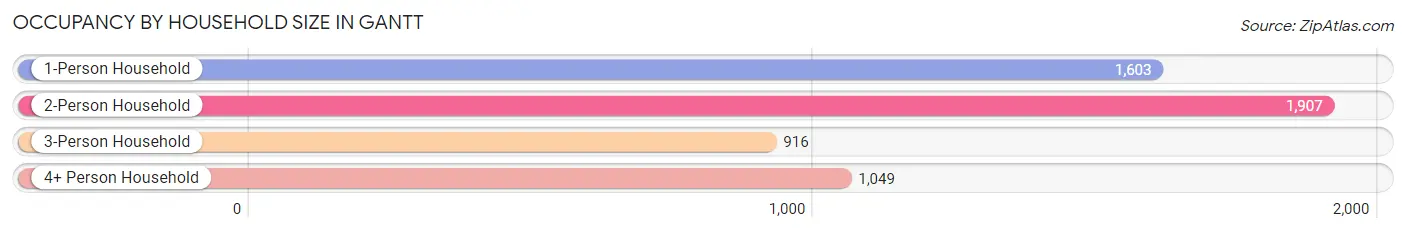
| Household Size | # Housing Units | % Housing Units |
| 1-Person Household | 1,603 | 29.3% |
| 2-Person Household | 1,907 | 34.8% |
| 3-Person Household | 916 | 16.7% |
| 4+ Person Household | 1,049 | 19.2% |
| Total Housing Units | 5,475 | 100.0% |
Occupancy by Ownership by Household Size in Gantt
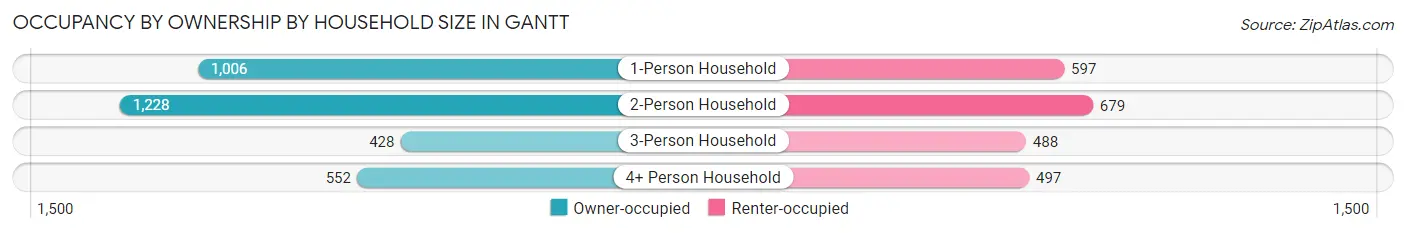
| Household Size | Owner-occupied | Renter-occupied |
| 1-Person Household | 1,006 (62.8%) | 597 (37.2%) |
| 2-Person Household | 1,228 (64.4%) | 679 (35.6%) |
| 3-Person Household | 428 (46.7%) | 488 (53.3%) |
| 4+ Person Household | 552 (52.6%) | 497 (47.4%) |
| Total Housing Units | 3,214 (58.7%) | 2,261 (41.3%) |
Occupancy by Educational Attainment in Gantt
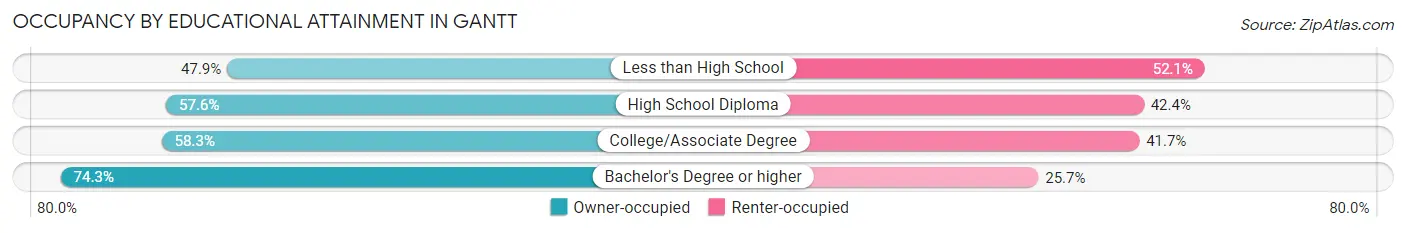
| Household Size | Owner-occupied | Renter-occupied |
| Less than High School | 496 (47.9%) | 540 (52.1%) |
| High School Diploma | 1,119 (57.6%) | 825 (42.4%) |
| College/Associate Degree | 926 (58.3%) | 663 (41.7%) |
| Bachelor's Degree or higher | 673 (74.3%) | 233 (25.7%) |
Occupancy by Age of Householder in Gantt
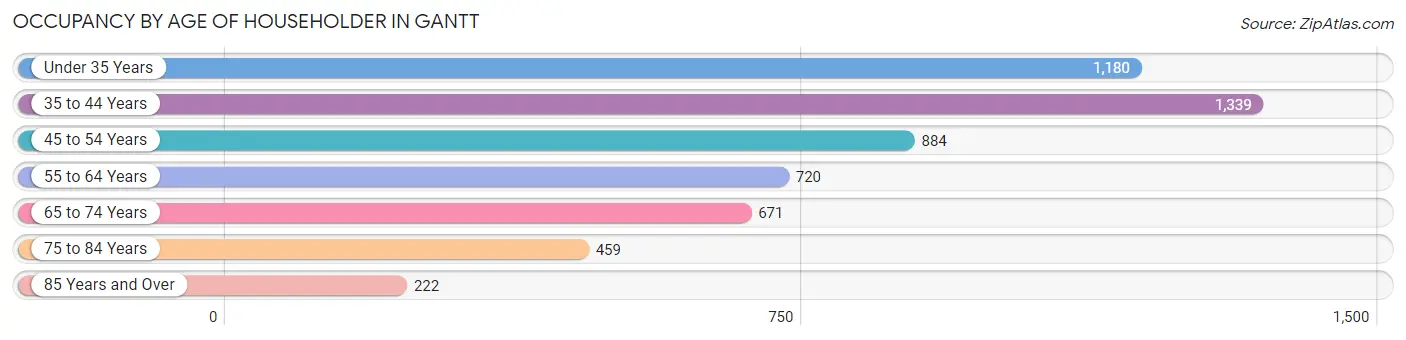
| Age Bracket | # Households | % Households |
| Under 35 Years | 1,180 | 21.5% |
| 35 to 44 Years | 1,339 | 24.5% |
| 45 to 54 Years | 884 | 16.2% |
| 55 to 64 Years | 720 | 13.2% |
| 65 to 74 Years | 671 | 12.3% |
| 75 to 84 Years | 459 | 8.4% |
| 85 Years and Over | 222 | 4.1% |
| Total | 5,475 | 100.0% |
Housing Finances in Gantt
Median Income by Occupancy in Gantt
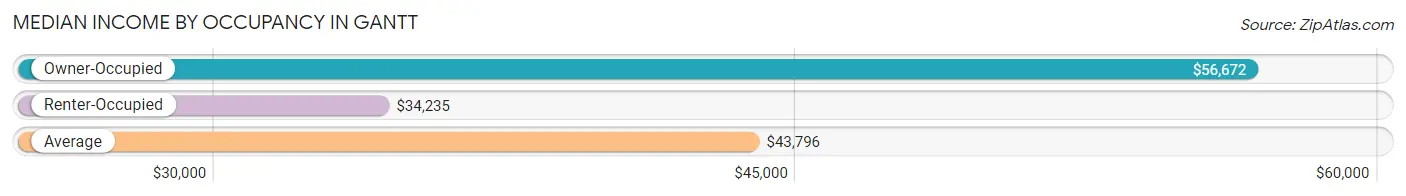
| Occupancy Type | # Households | Median Income |
| Owner-Occupied | 3,214 (58.7%) | $56,672 |
| Renter-Occupied | 2,261 (41.3%) | $34,235 |
| Average | 5,475 (100.0%) | $43,796 |
Occupancy by Householder Income Bracket in Gantt
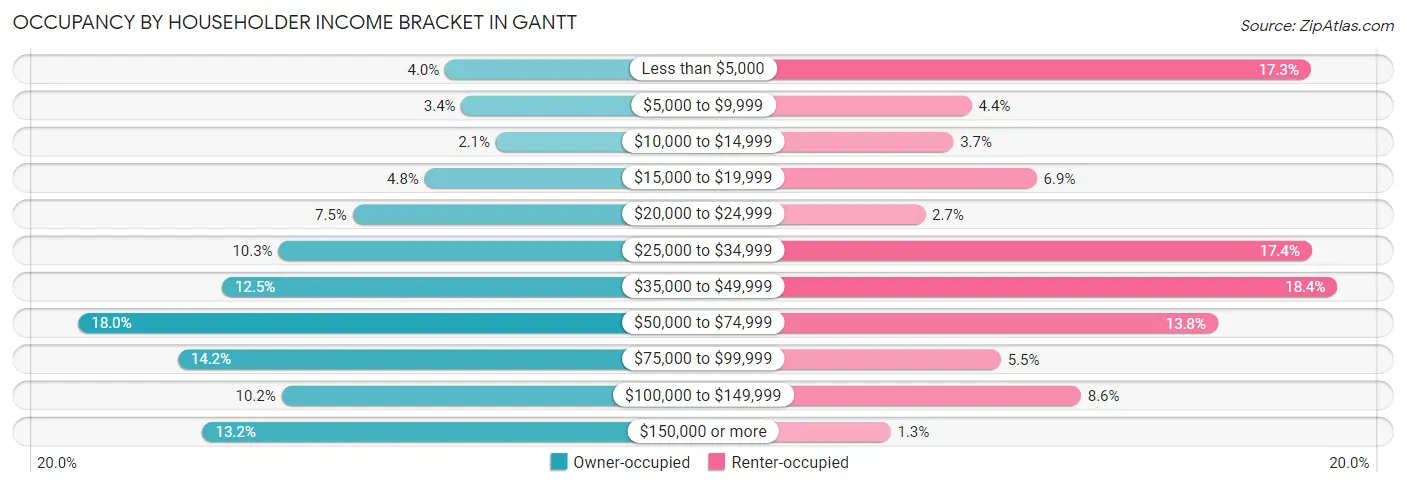
| Income Bracket | Owner-occupied | Renter-occupied |
| Less than $5,000 | 128 (4.0%) | 392 (17.3%) |
| $5,000 to $9,999 | 108 (3.4%) | 100 (4.4%) |
| $10,000 to $14,999 | 66 (2.1%) | 84 (3.7%) |
| $15,000 to $19,999 | 153 (4.8%) | 156 (6.9%) |
| $20,000 to $24,999 | 241 (7.5%) | 60 (2.6%) |
| $25,000 to $34,999 | 332 (10.3%) | 393 (17.4%) |
| $35,000 to $49,999 | 401 (12.5%) | 415 (18.3%) |
| $50,000 to $74,999 | 577 (17.9%) | 312 (13.8%) |
| $75,000 to $99,999 | 455 (14.2%) | 125 (5.5%) |
| $100,000 to $149,999 | 328 (10.2%) | 194 (8.6%) |
| $150,000 or more | 425 (13.2%) | 30 (1.3%) |
| Total | 3,214 (100.0%) | 2,261 (100.0%) |
Monthly Housing Cost Tiers in Gantt
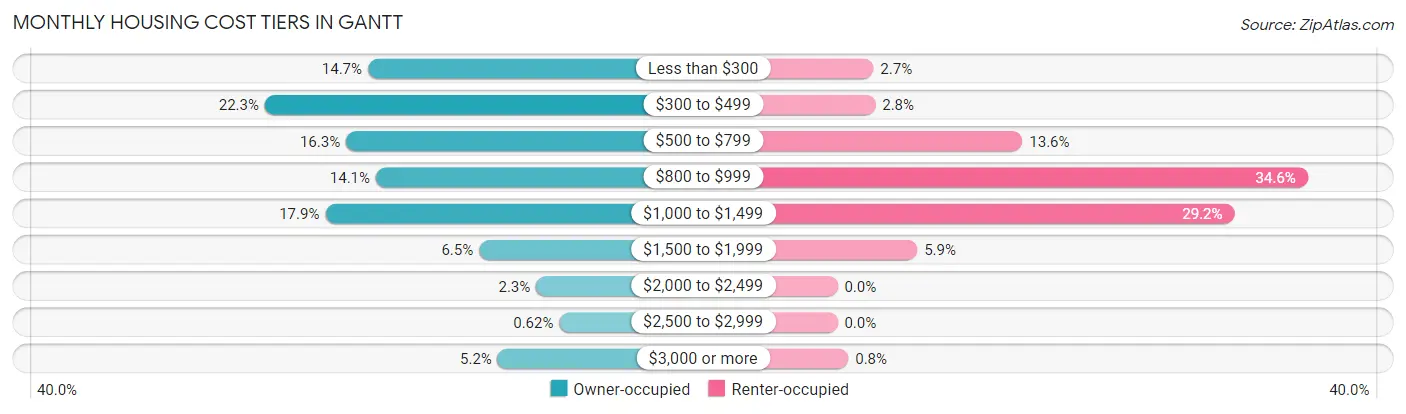
| Monthly Cost | Owner-occupied | Renter-occupied |
| Less than $300 | 473 (14.7%) | 60 (2.6%) |
| $300 to $499 | 717 (22.3%) | 63 (2.8%) |
| $500 to $799 | 525 (16.3%) | 308 (13.6%) |
| $800 to $999 | 454 (14.1%) | 783 (34.6%) |
| $1,000 to $1,499 | 574 (17.9%) | 661 (29.2%) |
| $1,500 to $1,999 | 210 (6.5%) | 133 (5.9%) |
| $2,000 to $2,499 | 75 (2.3%) | 0 (0.0%) |
| $2,500 to $2,999 | 20 (0.6%) | 0 (0.0%) |
| $3,000 or more | 166 (5.2%) | 18 (0.8%) |
| Total | 3,214 (100.0%) | 2,261 (100.0%) |
Physical Housing Characteristics in Gantt
Housing Structures in Gantt
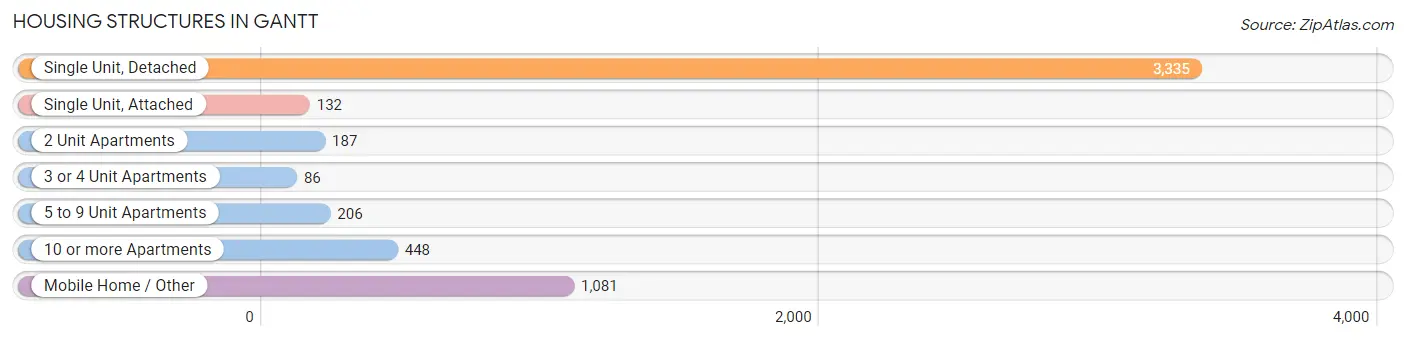
| Structure Type | # Housing Units | % Housing Units |
| Single Unit, Detached | 3,335 | 60.9% |
| Single Unit, Attached | 132 | 2.4% |
| 2 Unit Apartments | 187 | 3.4% |
| 3 or 4 Unit Apartments | 86 | 1.6% |
| 5 to 9 Unit Apartments | 206 | 3.8% |
| 10 or more Apartments | 448 | 8.2% |
| Mobile Home / Other | 1,081 | 19.7% |
| Total | 5,475 | 100.0% |
Housing Structures by Occupancy in Gantt
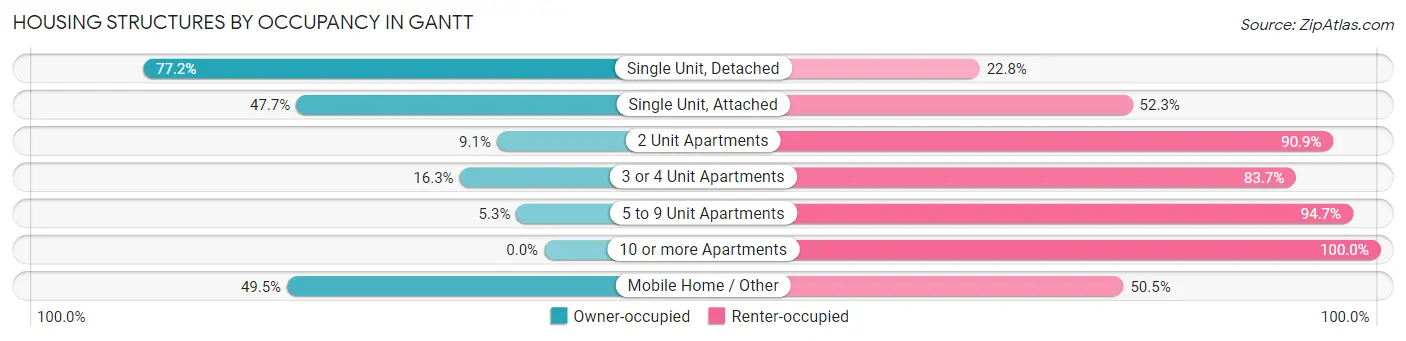
| Structure Type | Owner-occupied | Renter-occupied |
| Single Unit, Detached | 2,574 (77.2%) | 761 (22.8%) |
| Single Unit, Attached | 63 (47.7%) | 69 (52.3%) |
| 2 Unit Apartments | 17 (9.1%) | 170 (90.9%) |
| 3 or 4 Unit Apartments | 14 (16.3%) | 72 (83.7%) |
| 5 to 9 Unit Apartments | 11 (5.3%) | 195 (94.7%) |
| 10 or more Apartments | 0 (0.0%) | 448 (100.0%) |
| Mobile Home / Other | 535 (49.5%) | 546 (50.5%) |
| Total | 3,214 (58.7%) | 2,261 (41.3%) |
Housing Structures by Number of Rooms in Gantt
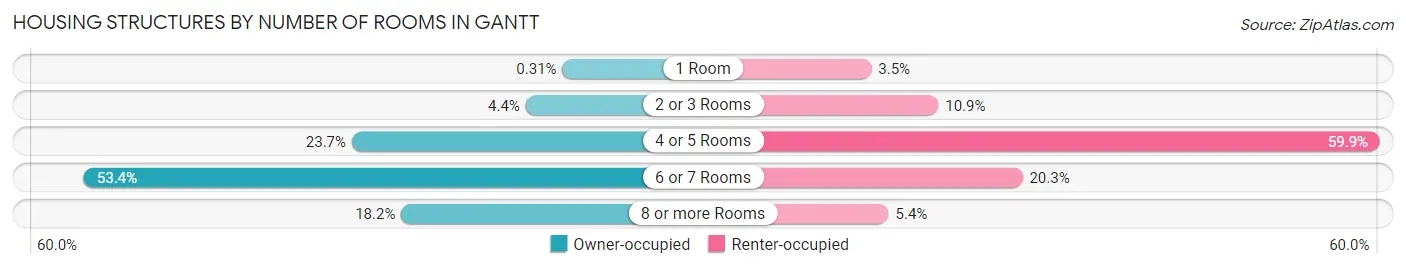
| Number of Rooms | Owner-occupied | Renter-occupied |
| 1 Room | 10 (0.3%) | 79 (3.5%) |
| 2 or 3 Rooms | 141 (4.4%) | 247 (10.9%) |
| 4 or 5 Rooms | 761 (23.7%) | 1,355 (59.9%) |
| 6 or 7 Rooms | 1,717 (53.4%) | 458 (20.3%) |
| 8 or more Rooms | 585 (18.2%) | 122 (5.4%) |
| Total | 3,214 (100.0%) | 2,261 (100.0%) |
Housing Structure by Heating Type in Gantt
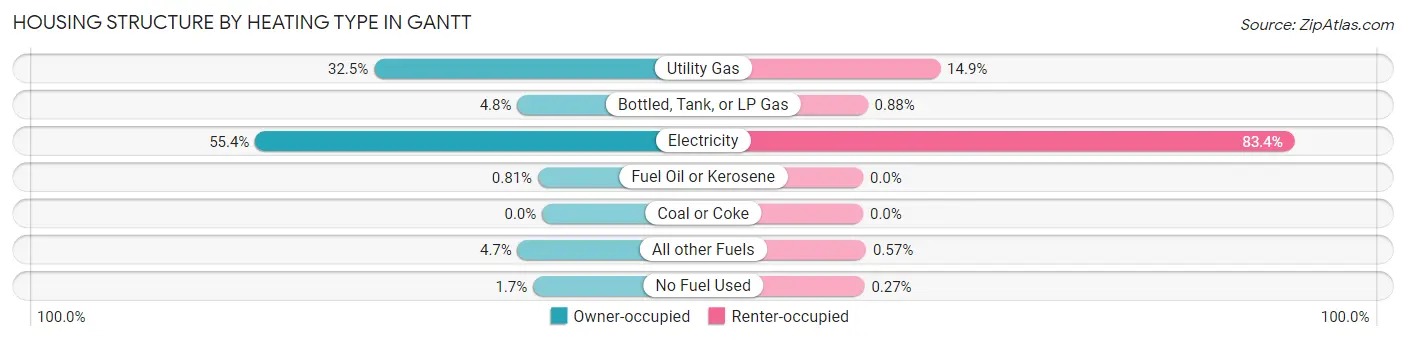
| Heating Type | Owner-occupied | Renter-occupied |
| Utility Gas | 1,044 (32.5%) | 337 (14.9%) |
| Bottled, Tank, or LP Gas | 154 (4.8%) | 20 (0.9%) |
| Electricity | 1,782 (55.4%) | 1,885 (83.4%) |
| Fuel Oil or Kerosene | 26 (0.8%) | 0 (0.0%) |
| Coal or Coke | 0 (0.0%) | 0 (0.0%) |
| All other Fuels | 152 (4.7%) | 13 (0.6%) |
| No Fuel Used | 56 (1.7%) | 6 (0.3%) |
| Total | 3,214 (100.0%) | 2,261 (100.0%) |
Household Vehicle Usage in Gantt
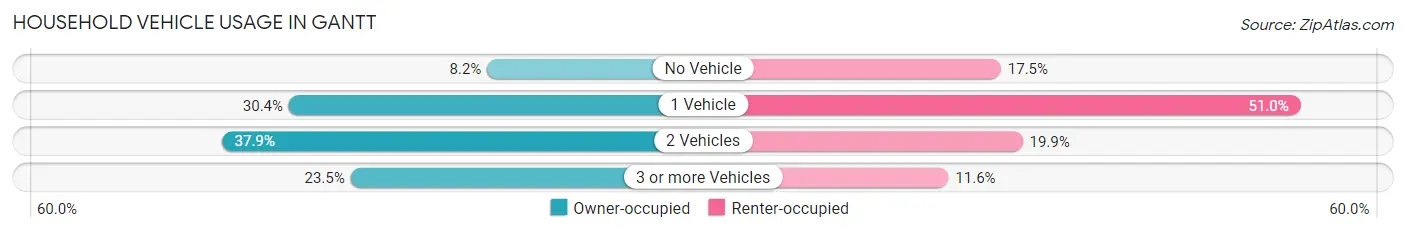
| Vehicles per Household | Owner-occupied | Renter-occupied |
| No Vehicle | 263 (8.2%) | 395 (17.5%) |
| 1 Vehicle | 977 (30.4%) | 1,154 (51.0%) |
| 2 Vehicles | 1,219 (37.9%) | 450 (19.9%) |
| 3 or more Vehicles | 755 (23.5%) | 262 (11.6%) |
| Total | 3,214 (100.0%) | 2,261 (100.0%) |
Real Estate & Mortgages in Gantt
Real Estate and Mortgage Overview in Gantt
| Characteristic | Without Mortgage | With Mortgage |
| Housing Units | 1,752 | 1,462 |
| Median Property Value | $123,200 | $160,900 |
| Median Household Income | $39,375 | $165 |
| Monthly Housing Costs | $360 | $150 |
| Real Estate Taxes | $722 | $131 |
Property Value by Mortgage Status in Gantt
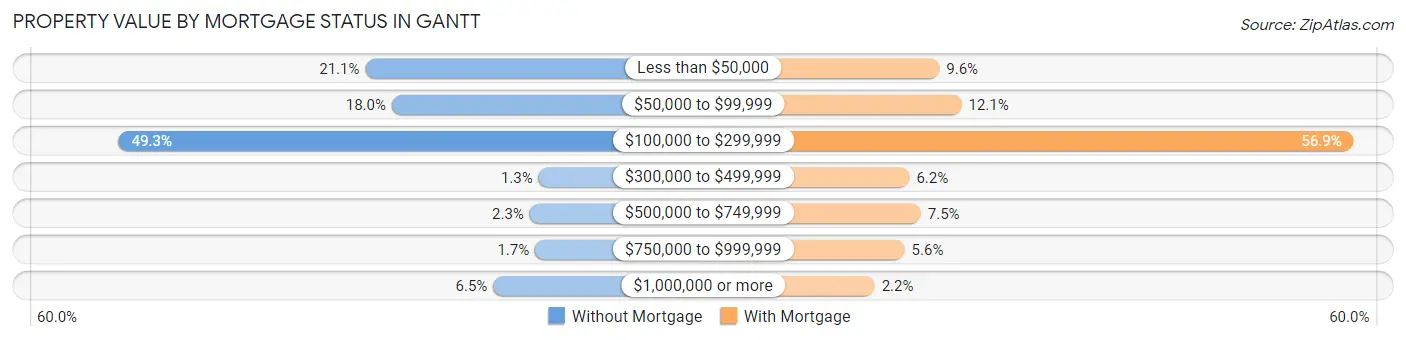
| Property Value | Without Mortgage | With Mortgage |
| Less than $50,000 | 369 (21.1%) | 140 (9.6%) |
| $50,000 to $99,999 | 316 (18.0%) | 177 (12.1%) |
| $100,000 to $299,999 | 863 (49.3%) | 832 (56.9%) |
| $300,000 to $499,999 | 22 (1.3%) | 90 (6.2%) |
| $500,000 to $749,999 | 40 (2.3%) | 109 (7.5%) |
| $750,000 to $999,999 | 29 (1.7%) | 82 (5.6%) |
| $1,000,000 or more | 113 (6.5%) | 32 (2.2%) |
| Total | 1,752 (100.0%) | 1,462 (100.0%) |
Household Income by Mortgage Status in Gantt
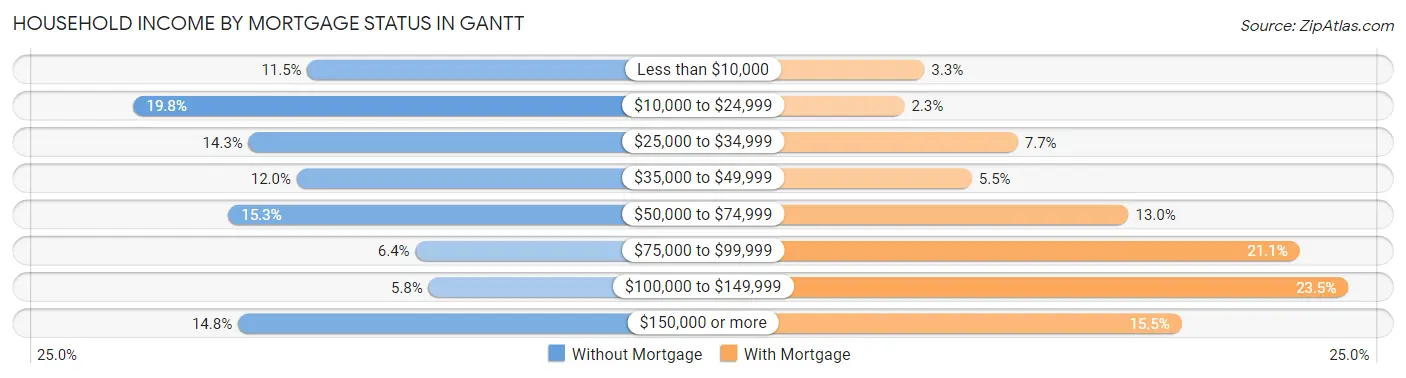
| Household Income | Without Mortgage | With Mortgage |
| Less than $10,000 | 202 (11.5%) | 48 (3.3%) |
| $10,000 to $24,999 | 347 (19.8%) | 34 (2.3%) |
| $25,000 to $34,999 | 251 (14.3%) | 113 (7.7%) |
| $35,000 to $49,999 | 211 (12.0%) | 81 (5.5%) |
| $50,000 to $74,999 | 268 (15.3%) | 190 (13.0%) |
| $75,000 to $99,999 | 112 (6.4%) | 309 (21.1%) |
| $100,000 to $149,999 | 101 (5.8%) | 343 (23.5%) |
| $150,000 or more | 260 (14.8%) | 227 (15.5%) |
| Total | 1,752 (100.0%) | 1,462 (100.0%) |
Property Value to Household Income Ratio in Gantt
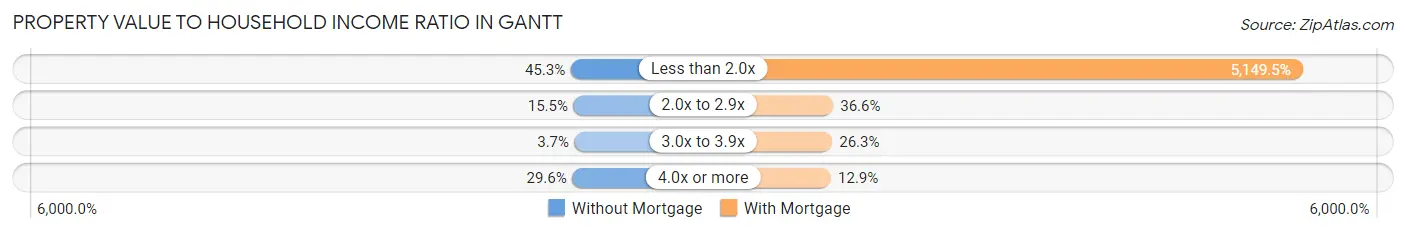
| Value-to-Income Ratio | Without Mortgage | With Mortgage |
| Less than 2.0x | 793 (45.3%) | 75,286 (5,149.5%) |
| 2.0x to 2.9x | 271 (15.5%) | 535 (36.6%) |
| 3.0x to 3.9x | 65 (3.7%) | 385 (26.3%) |
| 4.0x or more | 518 (29.6%) | 188 (12.9%) |
| Total | 1,752 (100.0%) | 1,462 (100.0%) |
Real Estate Taxes by Mortgage Status in Gantt
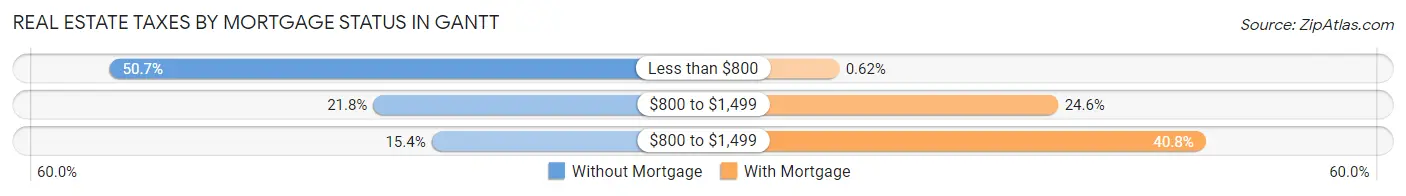
| Property Taxes | Without Mortgage | With Mortgage |
| Less than $800 | 888 (50.7%) | 9 (0.6%) |
| $800 to $1,499 | 382 (21.8%) | 360 (24.6%) |
| $800 to $1,499 | 270 (15.4%) | 597 (40.8%) |
| Total | 1,752 (100.0%) | 1,462 (100.0%) |
Health & Disability in Gantt
Health Insurance Coverage by Age in Gantt
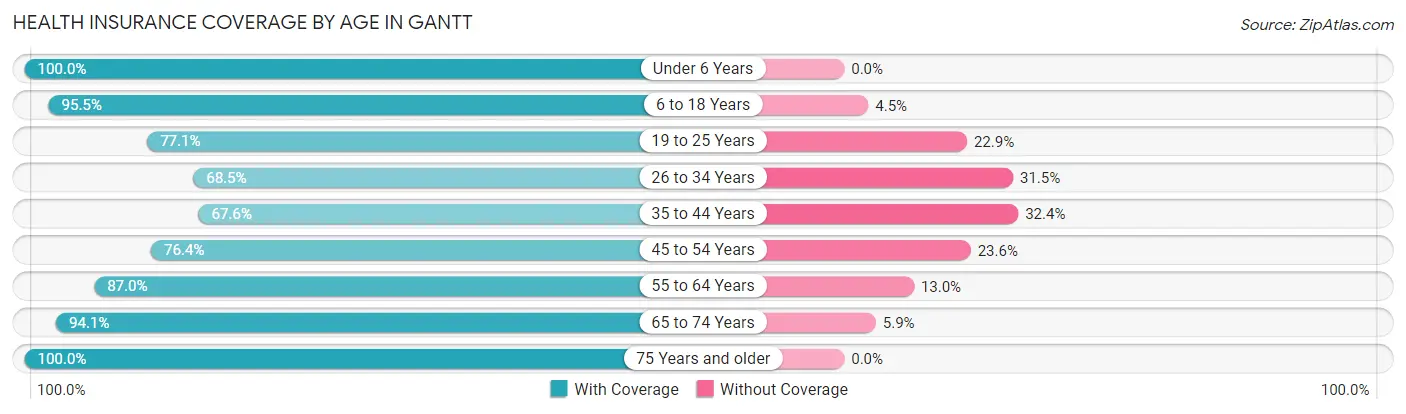
| Age Bracket | With Coverage | Without Coverage |
| Under 6 Years | 1,563 (100.0%) | 0 (0.0%) |
| 6 to 18 Years | 2,624 (95.5%) | 123 (4.5%) |
| 19 to 25 Years | 1,237 (77.1%) | 367 (22.9%) |
| 26 to 34 Years | 919 (68.5%) | 422 (31.5%) |
| 35 to 44 Years | 1,489 (67.6%) | 715 (32.4%) |
| 45 to 54 Years | 1,267 (76.4%) | 391 (23.6%) |
| 55 to 64 Years | 1,038 (87.0%) | 155 (13.0%) |
| 65 to 74 Years | 976 (94.1%) | 61 (5.9%) |
| 75 Years and older | 880 (100.0%) | 0 (0.0%) |
| Total | 11,993 (84.3%) | 2,234 (15.7%) |
Health Insurance Coverage by Citizenship Status in Gantt
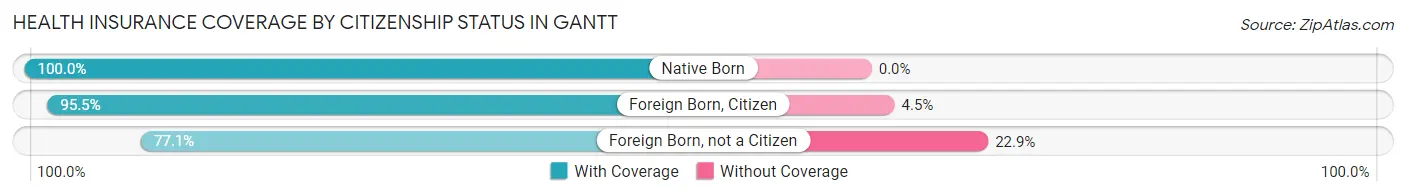
| Citizenship Status | With Coverage | Without Coverage |
| Native Born | 1,563 (100.0%) | 0 (0.0%) |
| Foreign Born, Citizen | 2,624 (95.5%) | 123 (4.5%) |
| Foreign Born, not a Citizen | 1,237 (77.1%) | 367 (22.9%) |
Health Insurance Coverage by Household Income in Gantt
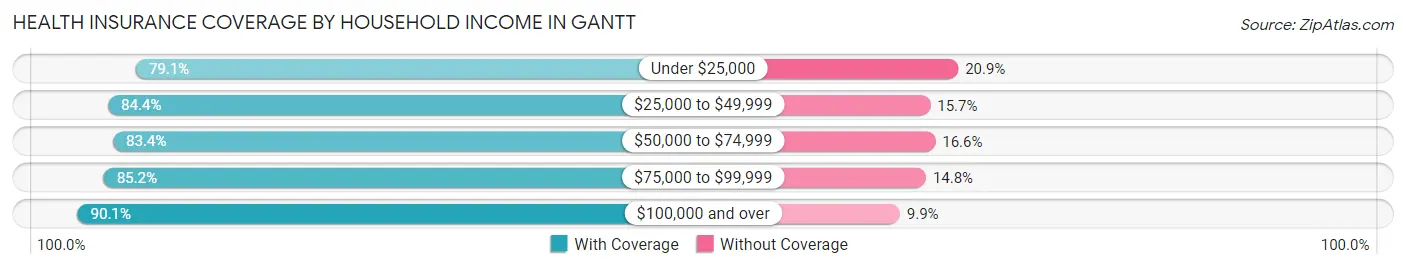
| Household Income | With Coverage | Without Coverage |
| Under $25,000 | 2,373 (79.1%) | 626 (20.9%) |
| $25,000 to $49,999 | 3,515 (84.4%) | 652 (15.7%) |
| $50,000 to $74,999 | 2,239 (83.4%) | 445 (16.6%) |
| $75,000 to $99,999 | 1,332 (85.2%) | 232 (14.8%) |
| $100,000 and over | 2,528 (90.1%) | 279 (9.9%) |
Public vs Private Health Insurance Coverage by Age in Gantt
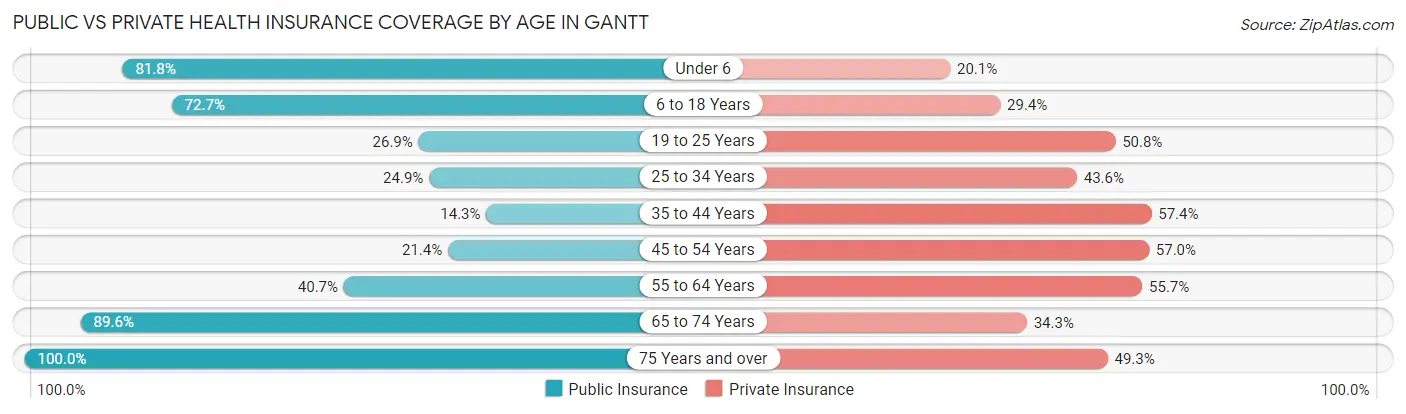
| Age Bracket | Public Insurance | Private Insurance |
| Under 6 | 1,279 (81.8%) | 314 (20.1%) |
| 6 to 18 Years | 1,997 (72.7%) | 807 (29.4%) |
| 19 to 25 Years | 431 (26.9%) | 814 (50.7%) |
| 25 to 34 Years | 334 (24.9%) | 585 (43.6%) |
| 35 to 44 Years | 315 (14.3%) | 1,266 (57.4%) |
| 45 to 54 Years | 355 (21.4%) | 945 (57.0%) |
| 55 to 64 Years | 486 (40.7%) | 665 (55.7%) |
| 65 to 74 Years | 929 (89.6%) | 356 (34.3%) |
| 75 Years and over | 880 (100.0%) | 434 (49.3%) |
| Total | 7,006 (49.2%) | 6,186 (43.5%) |
Disability Status by Sex by Age in Gantt
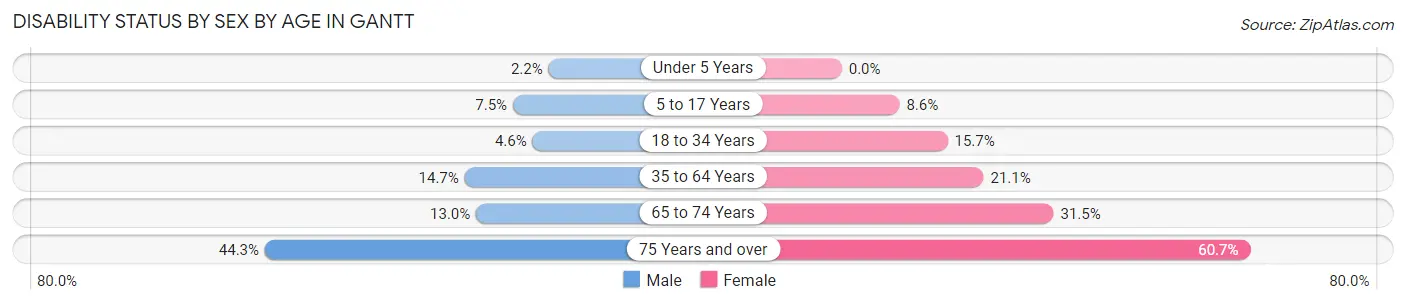
| Age Bracket | Male | Female |
| Under 5 Years | 16 (2.2%) | 0 (0.0%) |
| 5 to 17 Years | 114 (7.5%) | 126 (8.6%) |
| 18 to 34 Years | 53 (4.6%) | 291 (15.7%) |
| 35 to 64 Years | 354 (14.7%) | 556 (21.0%) |
| 65 to 74 Years | 47 (13.0%) | 212 (31.5%) |
| 75 Years and over | 78 (44.3%) | 427 (60.7%) |
Disability Class by Sex by Age in Gantt
Disability Class: Hearing Difficulty
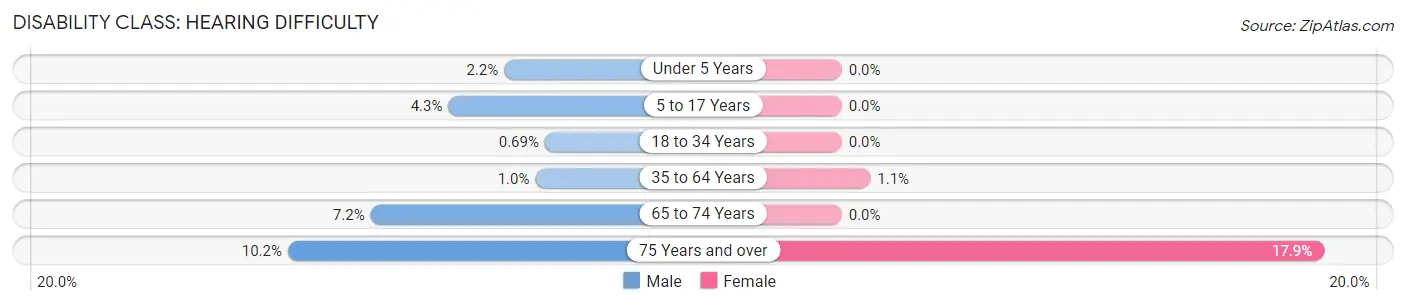
| Age Bracket | Male | Female |
| Under 5 Years | 16 (2.2%) | 0 (0.0%) |
| 5 to 17 Years | 65 (4.3%) | 0 (0.0%) |
| 18 to 34 Years | 8 (0.7%) | 0 (0.0%) |
| 35 to 64 Years | 25 (1.0%) | 28 (1.1%) |
| 65 to 74 Years | 26 (7.2%) | 0 (0.0%) |
| 75 Years and over | 18 (10.2%) | 126 (17.9%) |
Disability Class: Vision Difficulty
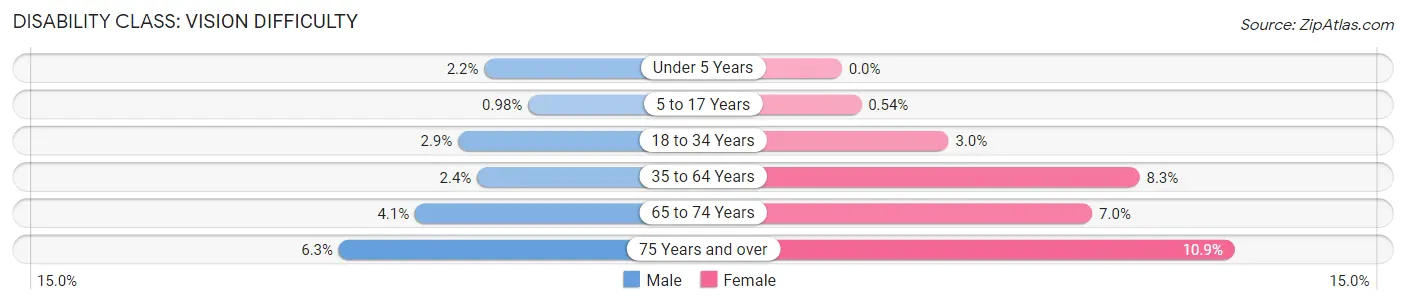
| Age Bracket | Male | Female |
| Under 5 Years | 16 (2.2%) | 0 (0.0%) |
| 5 to 17 Years | 15 (1.0%) | 8 (0.5%) |
| 18 to 34 Years | 34 (2.9%) | 55 (3.0%) |
| 35 to 64 Years | 58 (2.4%) | 219 (8.3%) |
| 65 to 74 Years | 15 (4.1%) | 47 (7.0%) |
| 75 Years and over | 11 (6.2%) | 77 (10.9%) |
Disability Class: Cognitive Difficulty
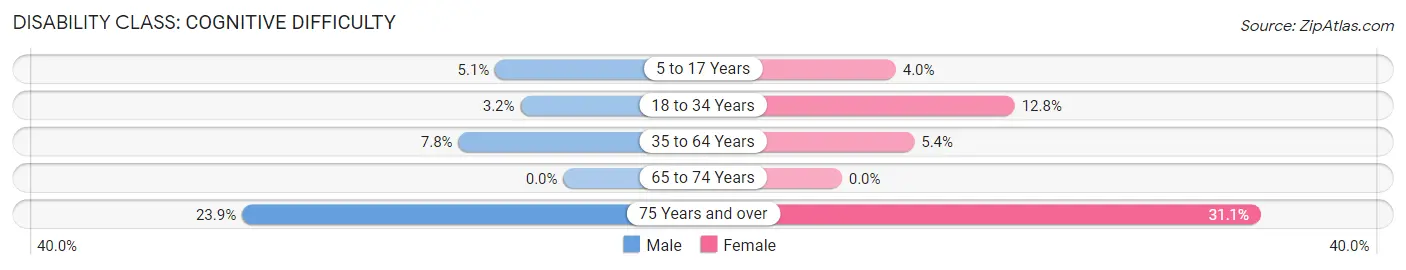
| Age Bracket | Male | Female |
| 5 to 17 Years | 77 (5.1%) | 59 (4.0%) |
| 18 to 34 Years | 37 (3.2%) | 238 (12.8%) |
| 35 to 64 Years | 188 (7.8%) | 142 (5.4%) |
| 65 to 74 Years | 0 (0.0%) | 0 (0.0%) |
| 75 Years and over | 42 (23.9%) | 219 (31.1%) |
Disability Class: Ambulatory Difficulty
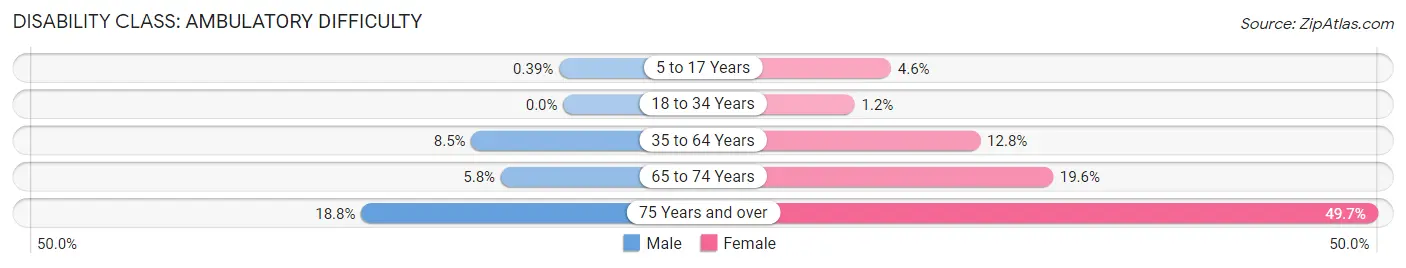
| Age Bracket | Male | Female |
| 5 to 17 Years | 6 (0.4%) | 67 (4.5%) |
| 18 to 34 Years | 0 (0.0%) | 22 (1.2%) |
| 35 to 64 Years | 206 (8.5%) | 339 (12.8%) |
| 65 to 74 Years | 21 (5.8%) | 132 (19.6%) |
| 75 Years and over | 33 (18.8%) | 350 (49.7%) |
Disability Class: Self-Care Difficulty
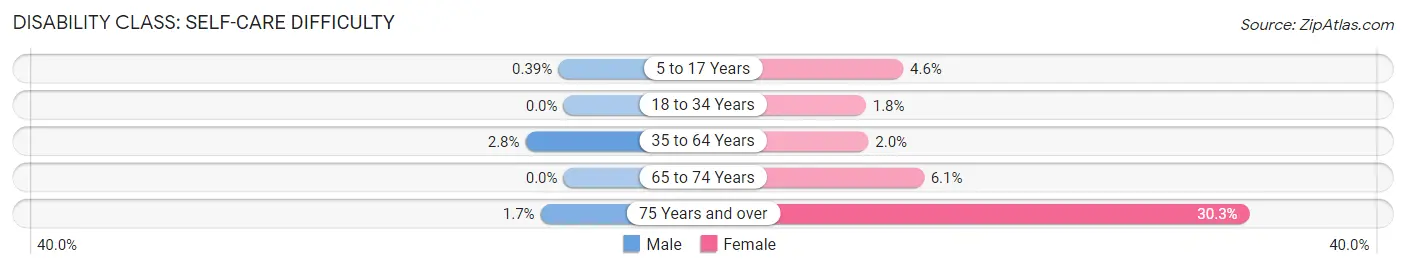
| Age Bracket | Male | Female |
| 5 to 17 Years | 6 (0.4%) | 67 (4.5%) |
| 18 to 34 Years | 0 (0.0%) | 33 (1.8%) |
| 35 to 64 Years | 68 (2.8%) | 52 (2.0%) |
| 65 to 74 Years | 0 (0.0%) | 41 (6.1%) |
| 75 Years and over | 3 (1.7%) | 213 (30.3%) |
Technology Access in Gantt
Computing Device Access in Gantt
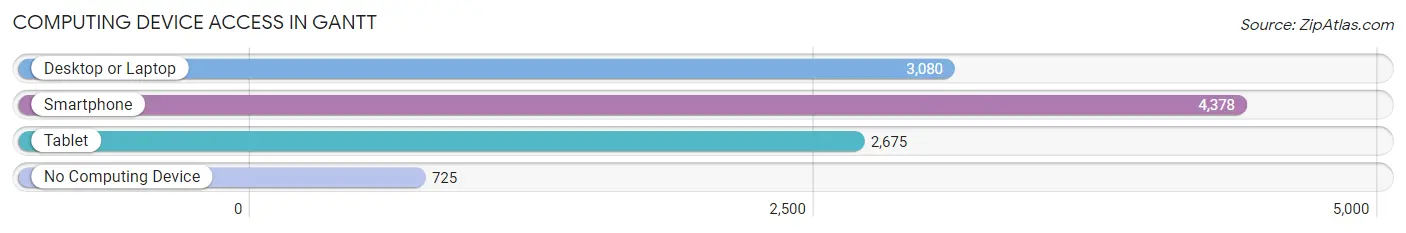
| Device Type | # Households | % Households |
| Desktop or Laptop | 3,080 | 56.3% |
| Smartphone | 4,378 | 80.0% |
| Tablet | 2,675 | 48.9% |
| No Computing Device | 725 | 13.2% |
| Total | 5,475 | 100.0% |
Internet Access in Gantt
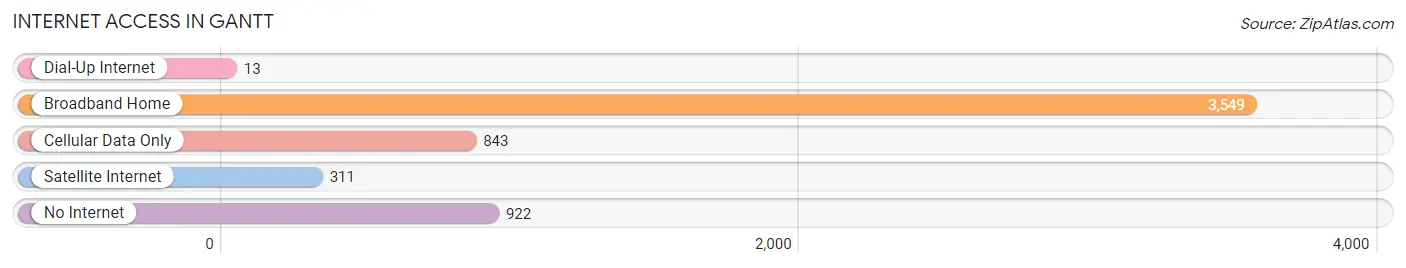
| Internet Type | # Households | % Households |
| Dial-Up Internet | 13 | 0.2% |
| Broadband Home | 3,549 | 64.8% |
| Cellular Data Only | 843 | 15.4% |
| Satellite Internet | 311 | 5.7% |
| No Internet | 922 | 16.8% |
| Total | 5,475 | 100.0% |
Gantt Summary
Gantt, South Carolina is a small town located in Aiken County, South Carolina. It is situated along the Savannah River, just south of the city of Aiken. The town was founded in 1887 and is named after the Gantt family, who were early settlers in the area.
Geography
Gantt is located in the western part of Aiken County, South Carolina. It is situated along the Savannah River, just south of the city of Aiken. The town is located at an elevation of approximately 200 feet above sea level. The town is surrounded by a variety of natural features, including the Savannah River, the South Carolina Sandhills, and the Aiken State Park.
The climate in Gantt is classified as humid subtropical, with hot, humid summers and mild winters. The average annual temperature is around 70 degrees Fahrenheit, with an average high of around 90 degrees in the summer and an average low of around 50 degrees in the winter. The average annual precipitation is around 50 inches.
Economy
Gantt’s economy is largely based on agriculture and manufacturing. The town is home to several large agricultural operations, including a poultry farm, a dairy farm, and a cotton gin. The town also has several manufacturing plants, including a paper mill, a furniture factory, and a plastics plant.
The town is also home to several small businesses, including restaurants, retail stores, and service providers. The town is also home to a number of tourist attractions, including the Aiken State Park, the Savannah River, and the Gantt Historical Museum.
Demographics
As of the 2010 census, Gantt had a population of 1,845 people. The racial makeup of the town was 79.3% White, 17.2% African American, 0.3% Native American, 0.7% Asian, 0.1% Pacific Islander, and 2.4% from other races. The median household income was $35,938, and the median family income was $41,250.
Conclusion
Gantt, South Carolina is a small town located in Aiken County, South Carolina. It is situated along the Savannah River, just south of the city of Aiken. The town was founded in 1887 and is named after the Gantt family, who were early settlers in the area. The town’s economy is largely based on agriculture and manufacturing, and it is home to several tourist attractions. As of the 2010 census, Gantt had a population of 1,845 people. The racial makeup of the town was 79.3% White, 17.2% African American, 0.3% Native American, 0.7% Asian, 0.1% Pacific Islander, and 2.4% from other races. The median household income was $35,938, and the median family income was $41,250.
Common Questions
What is Per Capita Income in Gantt?
Per Capita income in Gantt is $31,011.
What is the Median Family Income in Gantt?
Median Family Income in Gantt is $50,805.
What is the Median Household income in Gantt?
Median Household Income in Gantt is $43,796.
What is Income or Wage Gap in Gantt?
Income or Wage Gap in Gantt is 35.7%.
Women in Gantt earn 64.3 cents for every dollar earned by a man.
What is Family Income Deficit in Gantt?
Family Income Deficit in Gantt is $15,018.
Families that are below poverty line in Gantt earn $15,018 less on average than the poverty threshold level.
What is Inequality or Gini Index in Gantt?
Inequality or Gini Index in Gantt is 0.58.
What is the Total Population of Gantt?
Total Population of Gantt is 14,276.
What is the Total Male Population of Gantt?
Total Male Population of Gantt is 6,382.
What is the Total Female Population of Gantt?
Total Female Population of Gantt is 7,894.
What is the Ratio of Males per 100 Females in Gantt?
There are 80.85 Males per 100 Females in Gantt.
What is the Ratio of Females per 100 Males in Gantt?
There are 123.69 Females per 100 Males in Gantt.
What is the Median Population Age in Gantt?
Median Population Age in Gantt is 34.5 Years.
What is the Average Family Size in Gantt
Average Family Size in Gantt is 3.1 People.
What is the Average Household Size in Gantt
Average Household Size in Gantt is 2.6 People.
How Large is the Labor Force in Gantt?
There are 6,803 People in the Labor Forcein in Gantt.
What is the Percentage of People in the Labor Force in Gantt?
64.7% of People are in the Labor Force in Gantt.
What is the Unemployment Rate in Gantt?
Unemployment Rate in Gantt is 8.6%.