Fairforest, SC Map & Demographics
Fairforest Map
Fairforest Overview
$24,990
PER CAPITA INCOME
$48,250
AVG FAMILY INCOME
$49,650
AVG HOUSEHOLD INCOME
55.7%
WAGE / INCOME GAP [ % ]
44.3¢/ $1
WAGE / INCOME GAP [ $ ]
0.33
INEQUALITY / GINI INDEX
1,626
TOTAL POPULATION
775
MALE POPULATION
851
FEMALE POPULATION
91.07
MALES / 100 FEMALES
109.81
FEMALES / 100 MALES
43.4
MEDIAN AGE
2.4
AVG FAMILY SIZE
3.0
AVG HOUSEHOLD SIZE
806
LABOR FORCE [ PEOPLE ]
54.2%
PERCENT IN LABOR FORCE
8.3%
UNEMPLOYMENT RATE
Fairforest Area Codes
Income in Fairforest
Income Overview in Fairforest
Per Capita Income in Fairforest is $24,990, while median incomes of families and households are $48,250 and $49,650 respectively.
| Characteristic | Number | Measure |
| Per Capita Income | 1,626 | $24,990 |
| Median Family Income | 457 | $48,250 |
| Mean Family Income | 457 | $53,259 |
| Median Household Income | 550 | $49,650 |
| Mean Household Income | 550 | $60,478 |
| Income Deficit | 457 | $0 |
| Wage / Income Gap (%) | 1,626 | 55.67% |
| Wage / Income Gap ($) | 1,626 | 44.33¢ per $1 |
| Gini / Inequality Index | 1,626 | 0.33 |
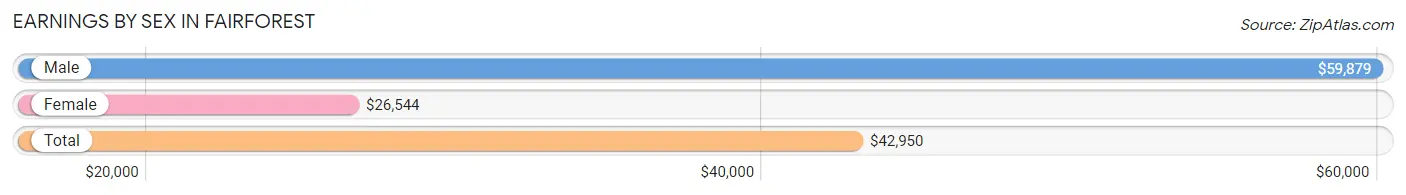
Earnings by Sex in Fairforest
Average Earnings in Fairforest are $42,950, $59,879 for men and $26,544 for women, a difference of 55.7%.
| Sex | Number | Average Earnings |
| Male | 480 (64.3%) | $59,879 |
| Female | 266 (35.7%) | $26,544 |
| Total | 746 (100.0%) | $42,950 |
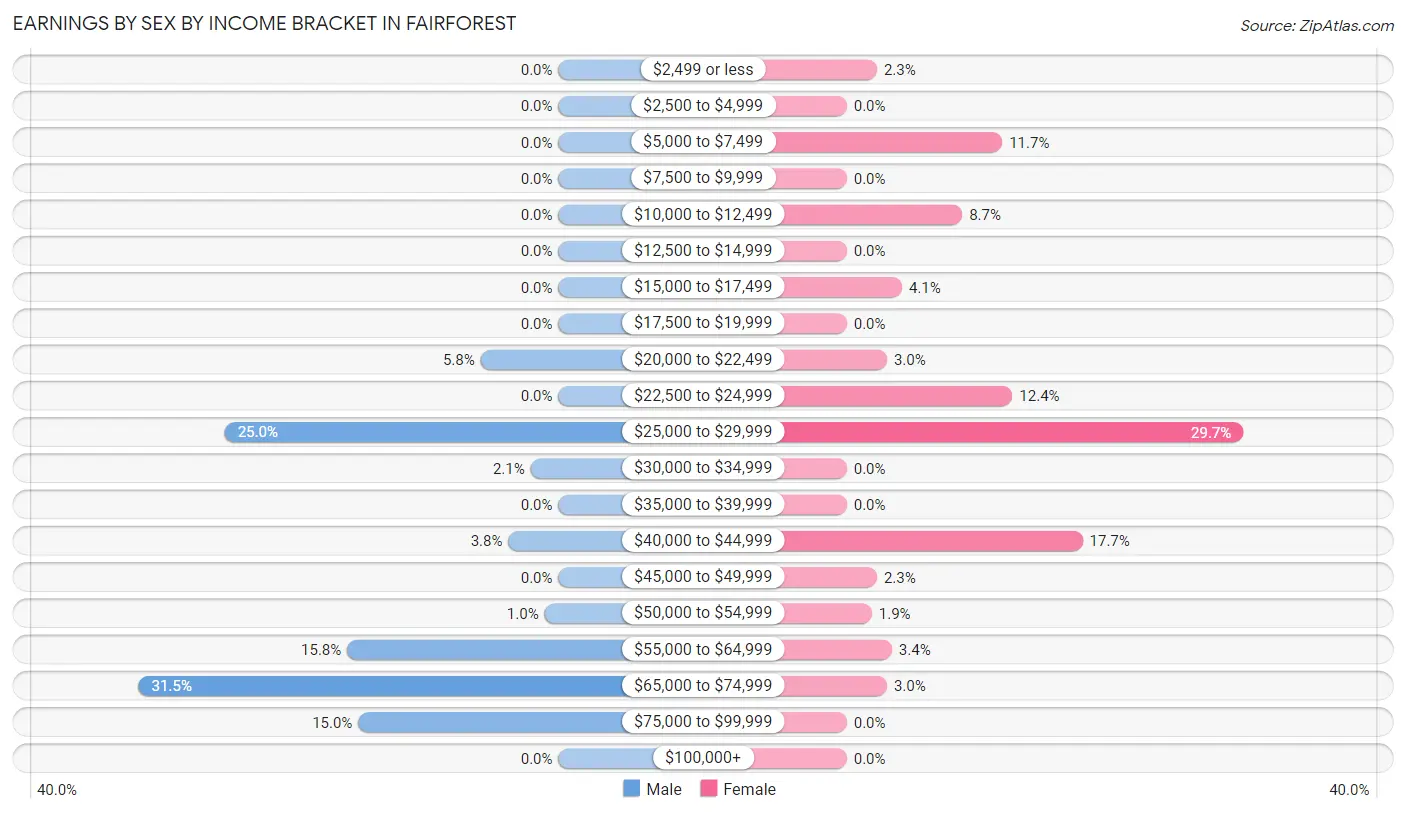
Earnings by Sex by Income Bracket in Fairforest
The most common earnings brackets in Fairforest are $65,000 to $74,999 for men (151 | 31.5%) and $25,000 to $29,999 for women (79 | 29.7%).
| Income | Male | Female |
| $2,499 or less | 0 (0.0%) | 6 (2.3%) |
| $2,500 to $4,999 | 0 (0.0%) | 0 (0.0%) |
| $5,000 to $7,499 | 0 (0.0%) | 31 (11.7%) |
| $7,500 to $9,999 | 0 (0.0%) | 0 (0.0%) |
| $10,000 to $12,499 | 0 (0.0%) | 23 (8.6%) |
| $12,500 to $14,999 | 0 (0.0%) | 0 (0.0%) |
| $15,000 to $17,499 | 0 (0.0%) | 11 (4.1%) |
| $17,500 to $19,999 | 0 (0.0%) | 0 (0.0%) |
| $20,000 to $22,499 | 28 (5.8%) | 8 (3.0%) |
| $22,500 to $24,999 | 0 (0.0%) | 33 (12.4%) |
| $25,000 to $29,999 | 120 (25.0%) | 79 (29.7%) |
| $30,000 to $34,999 | 10 (2.1%) | 0 (0.0%) |
| $35,000 to $39,999 | 0 (0.0%) | 0 (0.0%) |
| $40,000 to $44,999 | 18 (3.7%) | 47 (17.7%) |
| $45,000 to $49,999 | 0 (0.0%) | 6 (2.3%) |
| $50,000 to $54,999 | 5 (1.0%) | 5 (1.9%) |
| $55,000 to $64,999 | 76 (15.8%) | 9 (3.4%) |
| $65,000 to $74,999 | 151 (31.5%) | 8 (3.0%) |
| $75,000 to $99,999 | 72 (15.0%) | 0 (0.0%) |
| $100,000+ | 0 (0.0%) | 0 (0.0%) |
| Total | 480 (100.0%) | 266 (100.0%) |
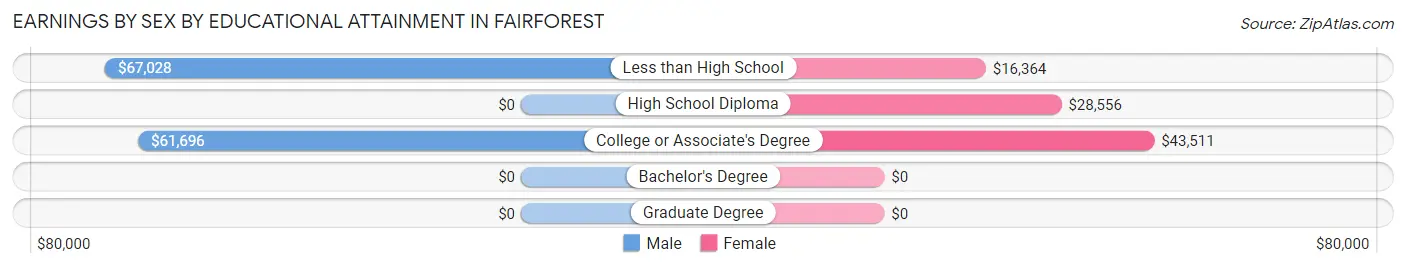
Earnings by Sex by Educational Attainment in Fairforest
Average earnings in Fairforest are $61,964 for men and $28,861 for women, a difference of 53.4%. Men with an educational attainment of less than high school enjoy the highest average annual earnings of $67,028, while those with college or associate's degree education earn the least with $61,696. Women with an educational attainment of college or associate's degree earn the most with the average annual earnings of $43,511, while those with less than high school education have the smallest earnings of $16,364.
| Educational Attainment | Male Income | Female Income |
| Less than High School | $67,028 | $16,364 |
| High School Diploma | - | - |
| College or Associate's Degree | $61,696 | $43,511 |
| Bachelor's Degree | - | - |
| Graduate Degree | - | - |
| Total | $61,964 | $28,861 |
Family Income in Fairforest
Family Income Brackets in Fairforest
According to the Fairforest family income data, there are 130 families falling into the $35,000 to $49,999 income range, which is the most common income bracket and makes up 28.4% of all families.
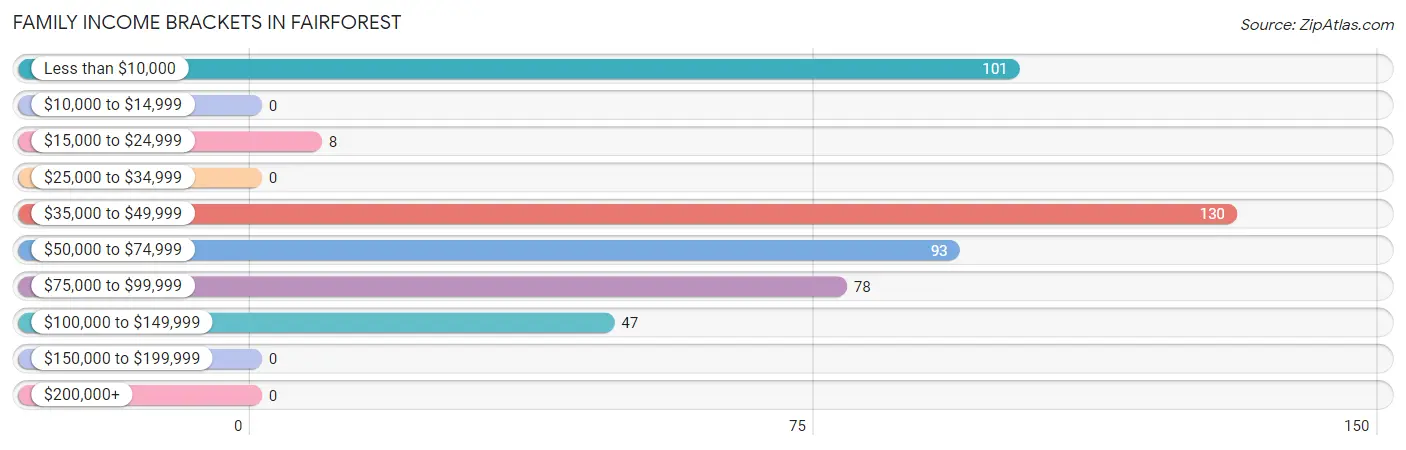
| Income Bracket | # Families | % Families |
| Less than $10,000 | 101 | 22.1% |
| $10,000 to $14,999 | 0 | 0.0% |
| $15,000 to $24,999 | 8 | 1.8% |
| $25,000 to $34,999 | 0 | 0.0% |
| $35,000 to $49,999 | 130 | 28.4% |
| $50,000 to $74,999 | 93 | 20.4% |
| $75,000 to $99,999 | 78 | 17.1% |
| $100,000 to $149,999 | 47 | 10.3% |
| $150,000 to $199,999 | 0 | 0.0% |
| $200,000+ | 0 | 0.0% |
Family Income by Famaliy Size in Fairforest
4-person families (34 | 7.4%) account for the highest median family income in Fairforest with $61,250 per family, while 2-person families (323 | 70.7%) have the highest median income of $21,833 per family member.
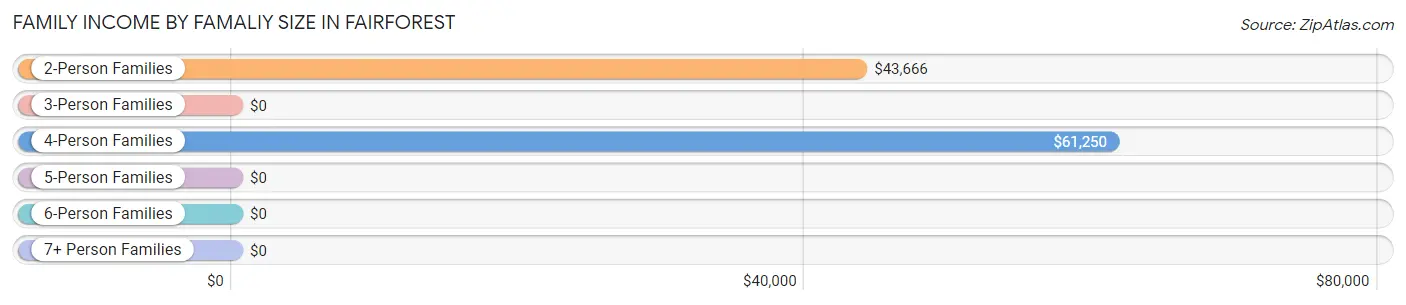
| Income Bracket | # Families | Median Income |
| 2-Person Families | 323 (70.7%) | $43,666 |
| 3-Person Families | 85 (18.6%) | $0 |
| 4-Person Families | 34 (7.4%) | $61,250 |
| 5-Person Families | 15 (3.3%) | $0 |
| 6-Person Families | 0 (0.0%) | $0 |
| 7+ Person Families | 0 (0.0%) | $0 |
| Total | 457 (100.0%) | $48,250 |
Family Income by Number of Earners in Fairforest
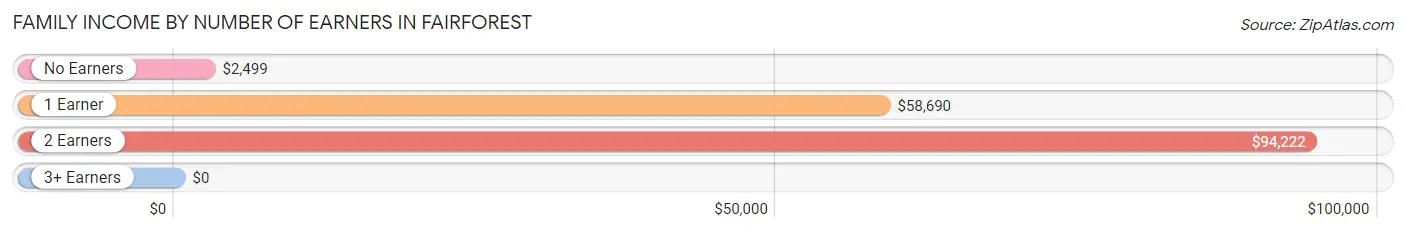
| Number of Earners | # Families | Median Income |
| No Earners | 197 (43.1%) | $2,499 |
| 1 Earner | 105 (23.0%) | $58,690 |
| 2 Earners | 132 (28.9%) | $94,222 |
| 3+ Earners | 23 (5.0%) | $0 |
| Total | 457 (100.0%) | $48,250 |
Household Income in Fairforest
Household Income Brackets in Fairforest
With 130 households falling in the category, the $35,000 to $49,999 income range is the most frequent in Fairforest, accounting for 23.6% of all households.
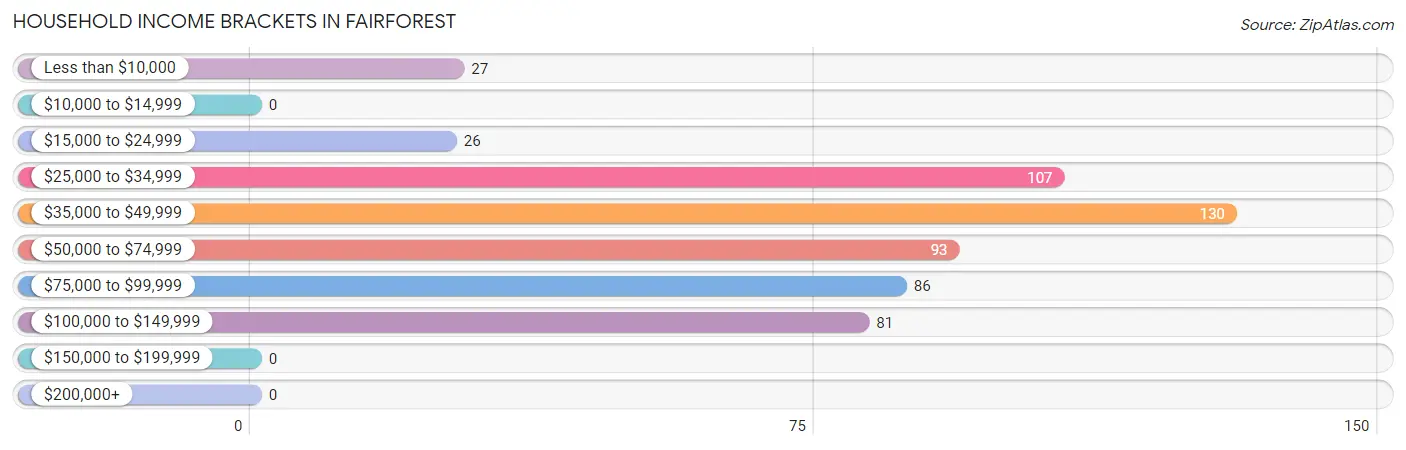
| Income Bracket | # Households | % Households |
| Less than $10,000 | 27 | 4.9% |
| $10,000 to $14,999 | 0 | 0.0% |
| $15,000 to $24,999 | 26 | 4.7% |
| $25,000 to $34,999 | 107 | 19.5% |
| $35,000 to $49,999 | 130 | 23.6% |
| $50,000 to $74,999 | 93 | 16.9% |
| $75,000 to $99,999 | 86 | 15.6% |
| $100,000 to $149,999 | 81 | 14.7% |
| $150,000 to $199,999 | 0 | 0.0% |
| $200,000+ | 0 | 0.0% |
Household Income by Householder Age in Fairforest
The median household income in Fairforest is $49,650, with the highest median household income of $49,837 found in the 45 to 64 years age bracket for the primary householder. A total of 236 households (42.9%) fall into this category. Meanwhile, the 15 to 24 years age bracket for the primary householder has the lowest median household income of $0, with 34 households (6.2%) in this group.
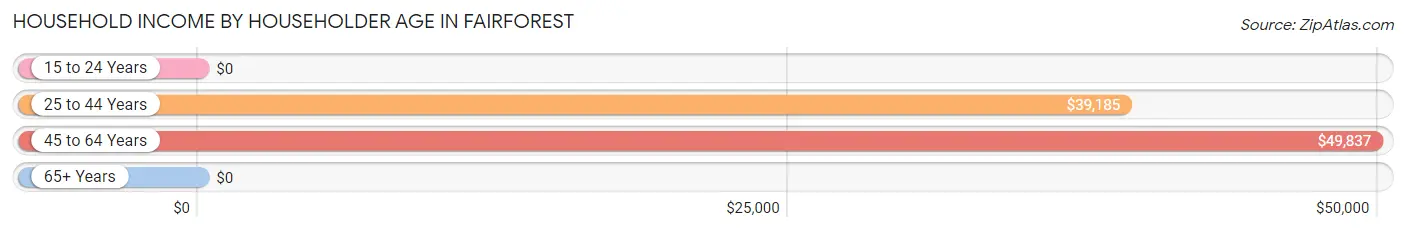
| Income Bracket | # Households | Median Income |
| 15 to 24 Years | 34 (6.2%) | $0 |
| 25 to 44 Years | 233 (42.4%) | $39,185 |
| 45 to 64 Years | 236 (42.9%) | $49,837 |
| 65+ Years | 47 (8.6%) | $0 |
| Total | 550 (100.0%) | $49,650 |
Poverty in Fairforest
Income Below Poverty by Sex and Age in Fairforest
With 12.3% poverty level for males and 31.6% for females among the residents of Fairforest, 55 to 64 year old males and 6 to 11 year old females are the most vulnerable to poverty, with 89 males (77.4%) and 40 females (95.2%) in their respective age groups living below the poverty level.
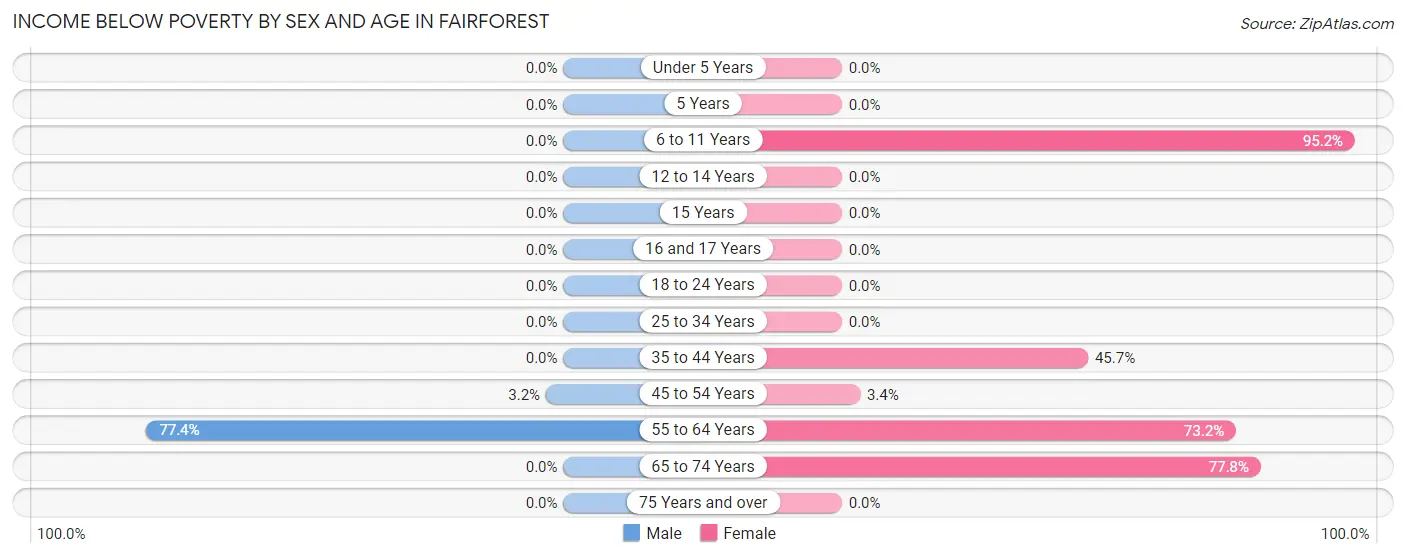
| Age Bracket | Male | Female |
| Under 5 Years | 0 (0.0%) | 0 (0.0%) |
| 5 Years | 0 (0.0%) | 0 (0.0%) |
| 6 to 11 Years | 0 (0.0%) | 40 (95.2%) |
| 12 to 14 Years | 0 (0.0%) | 0 (0.0%) |
| 15 Years | 0 (0.0%) | 0 (0.0%) |
| 16 and 17 Years | 0 (0.0%) | 0 (0.0%) |
| 18 to 24 Years | 0 (0.0%) | 0 (0.0%) |
| 25 to 34 Years | 0 (0.0%) | 0 (0.0%) |
| 35 to 44 Years | 0 (0.0%) | 101 (45.7%) |
| 45 to 54 Years | 6 (3.2%) | 6 (3.4%) |
| 55 to 64 Years | 89 (77.4%) | 101 (73.2%) |
| 65 to 74 Years | 0 (0.0%) | 21 (77.8%) |
| 75 Years and over | 0 (0.0%) | 0 (0.0%) |
| Total | 95 (12.3%) | 269 (31.6%) |
Income Above Poverty by Sex and Age in Fairforest
According to the poverty statistics in Fairforest, males aged under 5 years and females aged under 5 years are the age groups that are most secure financially, with 100.0% of males and 100.0% of females in these age groups living above the poverty line.
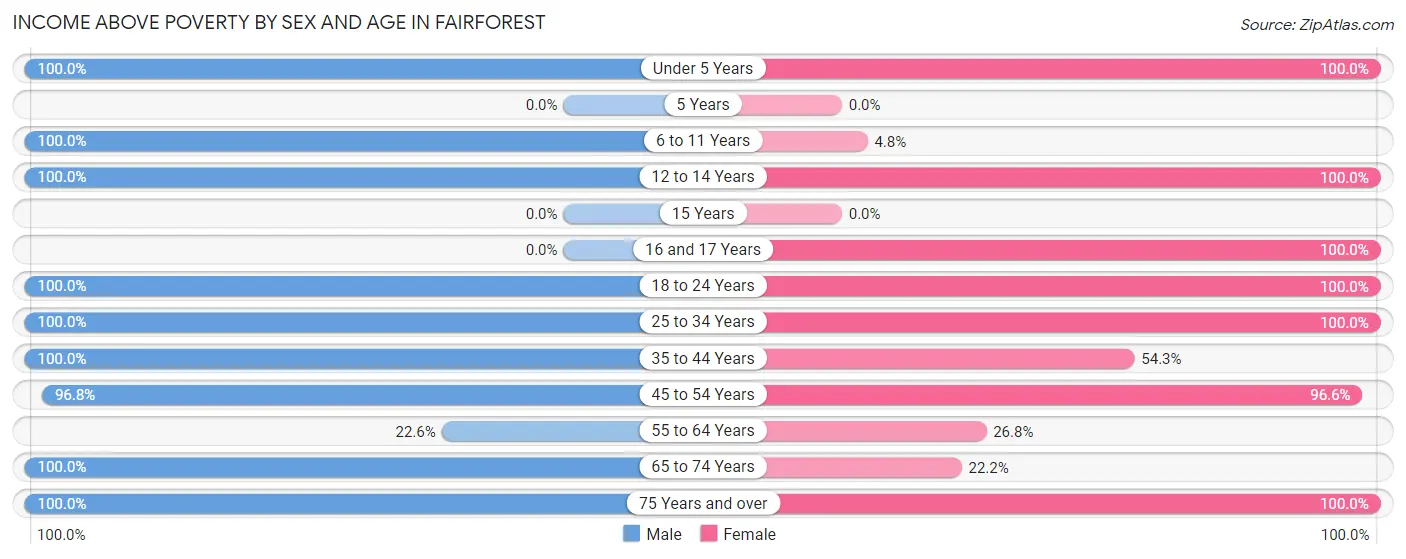
| Age Bracket | Male | Female |
| Under 5 Years | 11 (100.0%) | 24 (100.0%) |
| 5 Years | 0 (0.0%) | 0 (0.0%) |
| 6 to 11 Years | 30 (100.0%) | 2 (4.8%) |
| 12 to 14 Years | 12 (100.0%) | 15 (100.0%) |
| 15 Years | 0 (0.0%) | 0 (0.0%) |
| 16 and 17 Years | 0 (0.0%) | 77 (100.0%) |
| 18 to 24 Years | 28 (100.0%) | 75 (100.0%) |
| 25 to 34 Years | 193 (100.0%) | 40 (100.0%) |
| 35 to 44 Years | 79 (100.0%) | 120 (54.3%) |
| 45 to 54 Years | 180 (96.8%) | 172 (96.6%) |
| 55 to 64 Years | 26 (22.6%) | 37 (26.8%) |
| 65 to 74 Years | 104 (100.0%) | 6 (22.2%) |
| 75 Years and over | 13 (100.0%) | 14 (100.0%) |
| Total | 676 (87.7%) | 582 (68.4%) |
Income Below Poverty Among Married-Couple Families in Fairforest
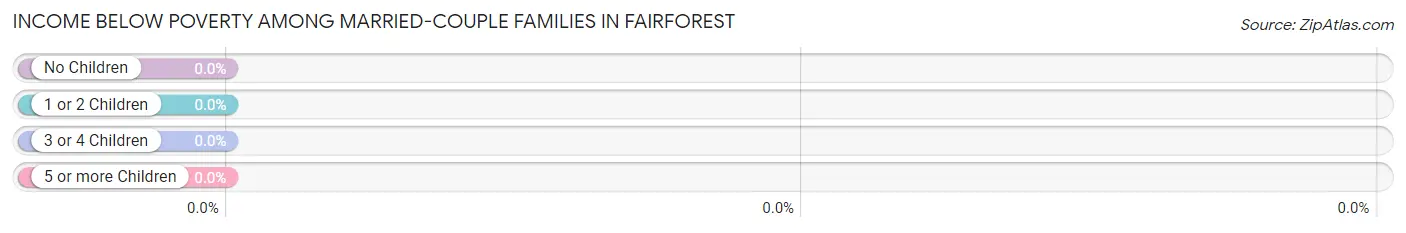
| Children | Above Poverty | Below Poverty |
| No Children | 83 (100.0%) | 0 (0.0%) |
| 1 or 2 Children | 96 (100.0%) | 0 (0.0%) |
| 3 or 4 Children | 15 (100.0%) | 0 (0.0%) |
| 5 or more Children | 0 (0.0%) | 0 (0.0%) |
| Total | 194 (100.0%) | 0 (0.0%) |
Income Below Poverty Among Single-Parent Households in Fairforest
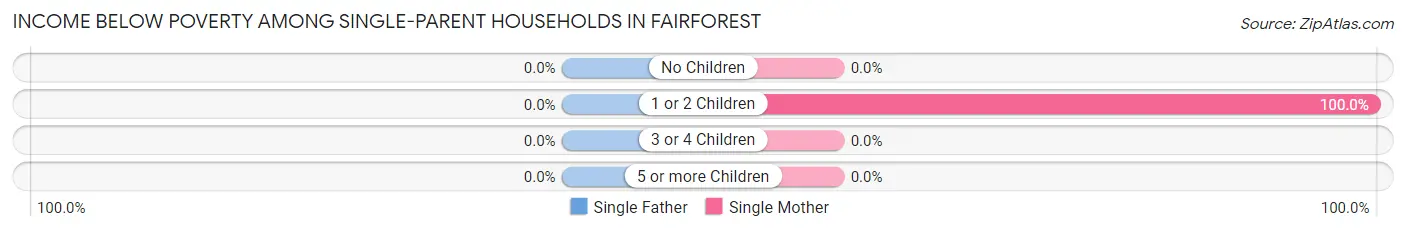
| Children | Single Father | Single Mother |
| No Children | 0 (0.0%) | 0 (0.0%) |
| 1 or 2 Children | 0 (0.0%) | 101 (100.0%) |
| 3 or 4 Children | 0 (0.0%) | 0 (0.0%) |
| 5 or more Children | 0 (0.0%) | 0 (0.0%) |
| Total | 0 (0.0%) | 101 (41.2%) |
Income Below Poverty Among Married-Couple vs Single-Parent Households in Fairforest
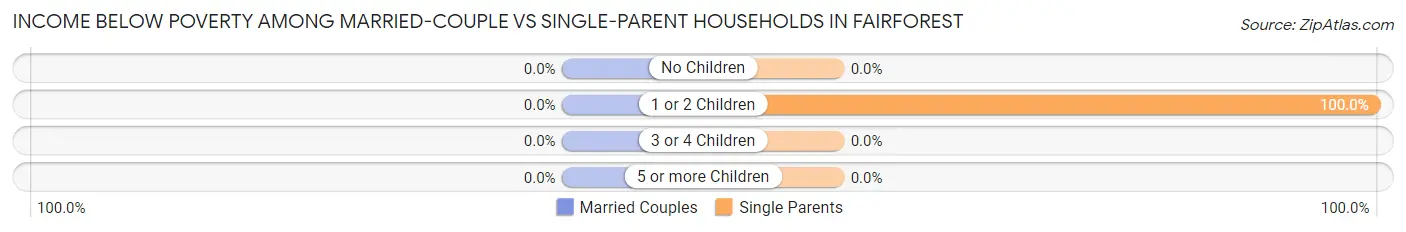
| Children | Married-Couple Families | Single-Parent Households |
| No Children | 0 (0.0%) | 0 (0.0%) |
| 1 or 2 Children | 0 (0.0%) | 101 (100.0%) |
| 3 or 4 Children | 0 (0.0%) | 0 (0.0%) |
| 5 or more Children | 0 (0.0%) | 0 (0.0%) |
| Total | 0 (0.0%) | 101 (38.4%) |
Race in Fairforest
The most populous races in Fairforest are White / Caucasian (1,134 | 69.7%), Hispanic or Latino (448 | 27.6%), and Some other Race (194 | 11.9%).
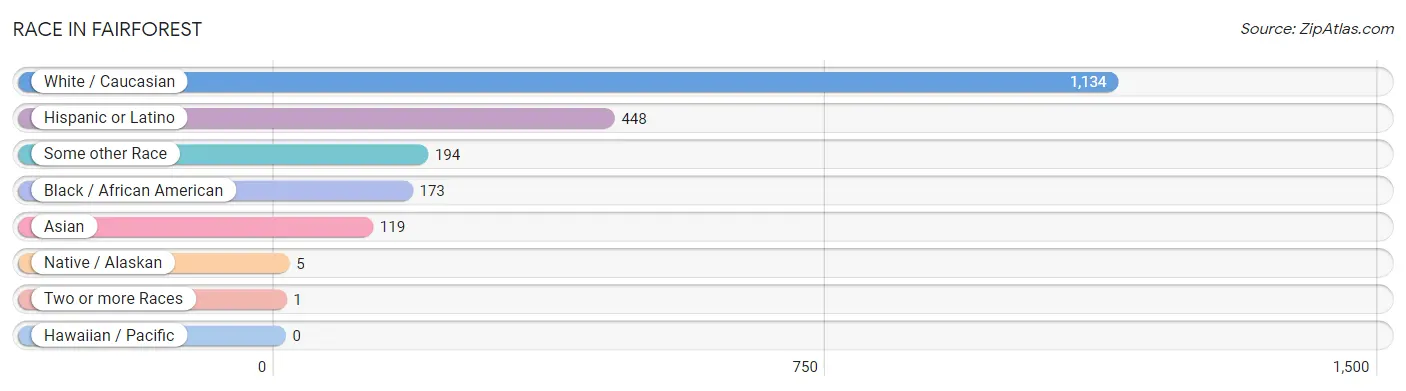
| Race | # Population | % Population |
| Asian | 119 | 7.3% |
| Black / African American | 173 | 10.6% |
| Hawaiian / Pacific | 0 | 0.0% |
| Hispanic or Latino | 448 | 27.6% |
| Native / Alaskan | 5 | 0.3% |
| White / Caucasian | 1,134 | 69.7% |
| Two or more Races | 1 | 0.1% |
| Some other Race | 194 | 11.9% |
| Total | 1,626 | 100.0% |
Ancestry in Fairforest
The most populous ancestries reported in Fairforest are Mexican (447 | 27.5%), English (395 | 24.3%), Indian (Asian) (119 | 7.3%), American (9 | 0.5%), and German (8 | 0.5%), together accounting for 60.1% of all Fairforest residents.
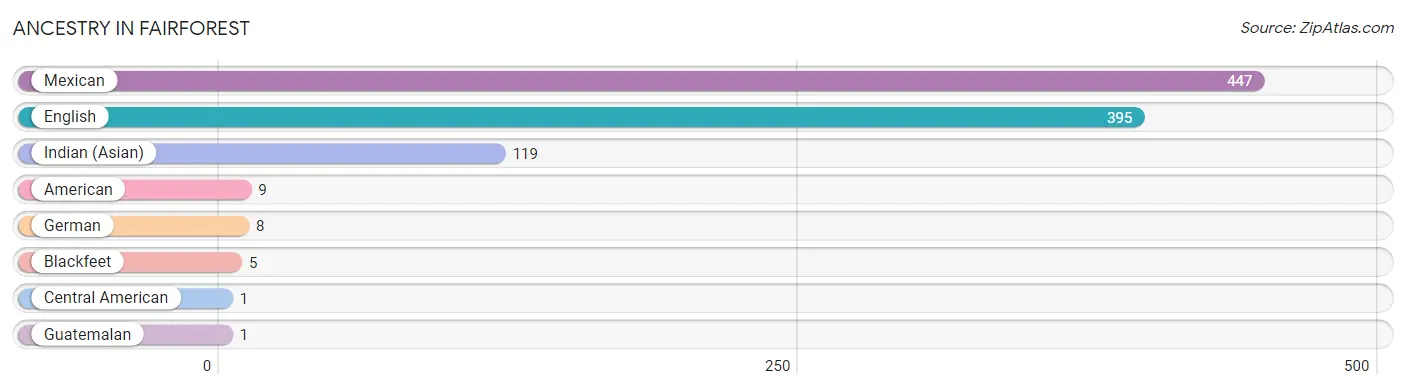
| Ancestry | # Population | % Population |
| American | 9 | 0.5% |
| Blackfeet | 5 | 0.3% |
| Central American | 1 | 0.1% |
| English | 395 | 24.3% |
| German | 8 | 0.5% |
| Guatemalan | 1 | 0.1% |
| Indian (Asian) | 119 | 7.3% |
| Mexican | 447 | 27.5% | View All 8 Rows |
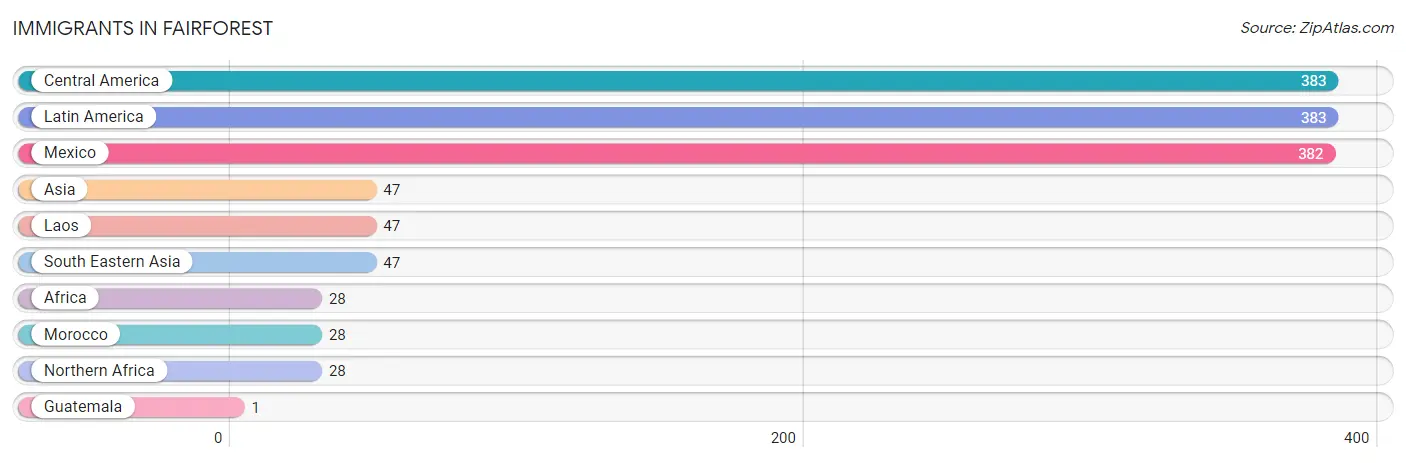
Immigrants in Fairforest
The most numerous immigrant groups reported in Fairforest came from Central America (383 | 23.5%), Latin America (383 | 23.5%), Mexico (382 | 23.5%), Asia (47 | 2.9%), and Laos (47 | 2.9%), together accounting for 76.4% of all Fairforest residents.
| Immigration Origin | # Population | % Population |
| Africa | 28 | 1.7% |
| Asia | 47 | 2.9% |
| Central America | 383 | 23.5% |
| Guatemala | 1 | 0.1% |
| Laos | 47 | 2.9% |
| Latin America | 383 | 23.5% |
| Mexico | 382 | 23.5% |
| Morocco | 28 | 1.7% |
| Northern Africa | 28 | 1.7% |
| South Eastern Asia | 47 | 2.9% | View All 10 Rows |
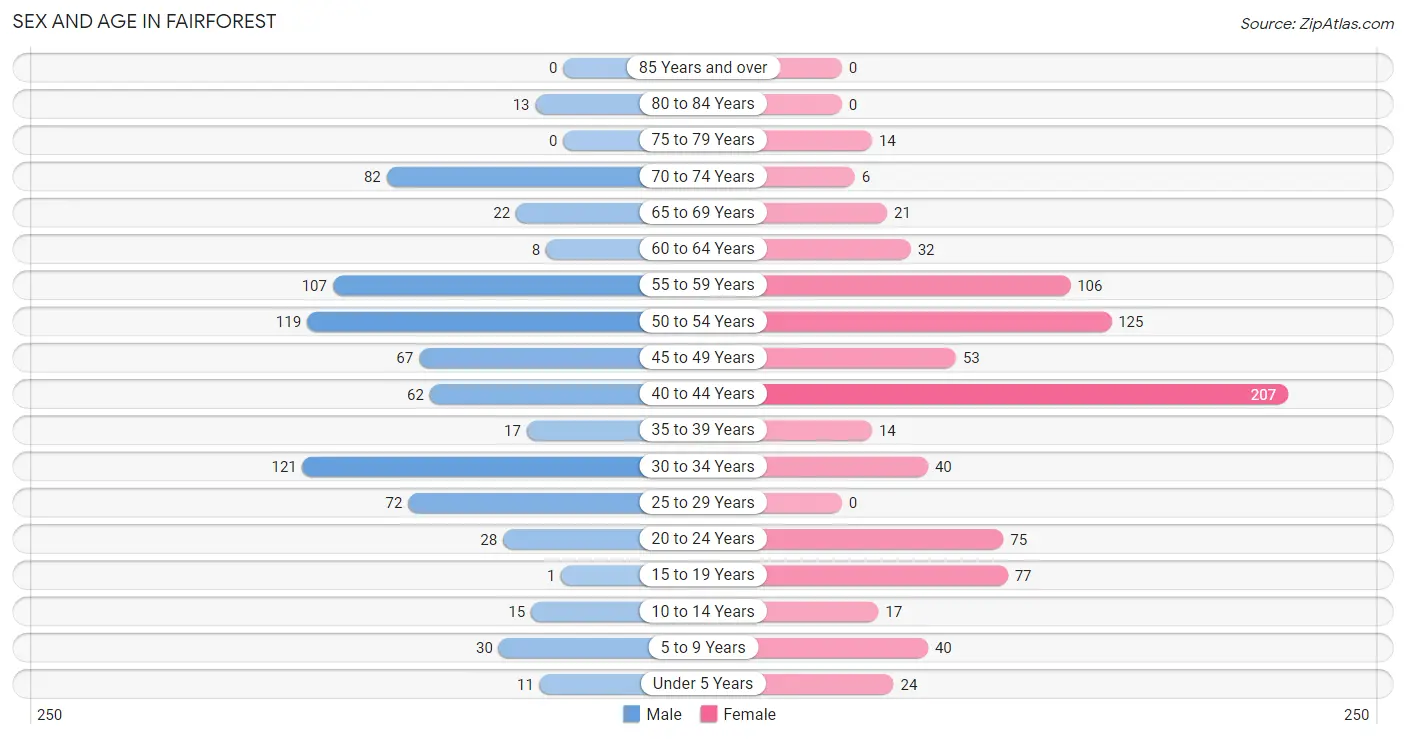
Sex and Age in Fairforest
Sex and Age in Fairforest
The most populous age groups in Fairforest are 30 to 34 Years (121 | 15.6%) for men and 40 to 44 Years (207 | 24.3%) for women.
| Age Bracket | Male | Female |
| Under 5 Years | 11 (1.4%) | 24 (2.8%) |
| 5 to 9 Years | 30 (3.9%) | 40 (4.7%) |
| 10 to 14 Years | 15 (1.9%) | 17 (2.0%) |
| 15 to 19 Years | 1 (0.1%) | 77 (9.0%) |
| 20 to 24 Years | 28 (3.6%) | 75 (8.8%) |
| 25 to 29 Years | 72 (9.3%) | 0 (0.0%) |
| 30 to 34 Years | 121 (15.6%) | 40 (4.7%) |
| 35 to 39 Years | 17 (2.2%) | 14 (1.7%) |
| 40 to 44 Years | 62 (8.0%) | 207 (24.3%) |
| 45 to 49 Years | 67 (8.6%) | 53 (6.2%) |
| 50 to 54 Years | 119 (15.3%) | 125 (14.7%) |
| 55 to 59 Years | 107 (13.8%) | 106 (12.5%) |
| 60 to 64 Years | 8 (1.0%) | 32 (3.8%) |
| 65 to 69 Years | 22 (2.8%) | 21 (2.5%) |
| 70 to 74 Years | 82 (10.6%) | 6 (0.7%) |
| 75 to 79 Years | 0 (0.0%) | 14 (1.7%) |
| 80 to 84 Years | 13 (1.7%) | 0 (0.0%) |
| 85 Years and over | 0 (0.0%) | 0 (0.0%) |
| Total | 775 (100.0%) | 851 (100.0%) |
Families and Households in Fairforest
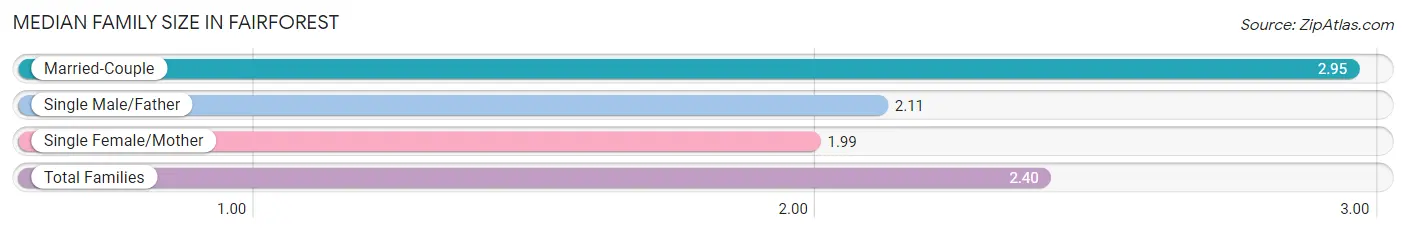
Median Family Size in Fairforest
The median family size in Fairforest is 2.40 persons per family, with married-couple families (194 | 42.4%) accounting for the largest median family size of 2.95 persons per family. On the other hand, single female/mother families (245 | 53.6%) represent the smallest median family size with 1.99 persons per family.
| Family Type | # Families | Family Size |
| Married-Couple | 194 (42.4%) | 2.95 |
| Single Male/Father | 18 (3.9%) | 2.11 |
| Single Female/Mother | 245 (53.6%) | 1.99 |
| Total Families | 457 (100.0%) | 2.40 |
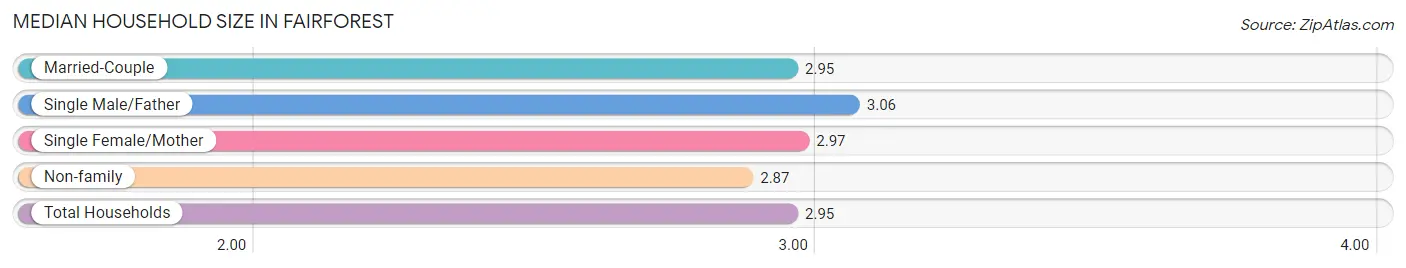
Median Household Size in Fairforest
The median household size in Fairforest is 2.95 persons per household, with single male/father households (18 | 3.3%) accounting for the largest median household size of 3.06 persons per household. non-family households (93 | 16.9%) represent the smallest median household size with 2.87 persons per household.
| Household Type | # Households | Household Size |
| Married-Couple | 194 (35.3%) | 2.95 |
| Single Male/Father | 18 (3.3%) | 3.06 |
| Single Female/Mother | 245 (44.6%) | 2.97 |
| Non-family | 93 (16.9%) | 2.87 |
| Total Households | 550 (100.0%) | 2.95 |
Household Size by Marriage Status in Fairforest
Out of a total of 550 households in Fairforest, 457 (83.1%) are family households, while 93 (16.9%) are nonfamily households. The most numerous type of family households are 3-person households, comprising 204, and the most common type of nonfamily households are 1-person households, comprising 45.
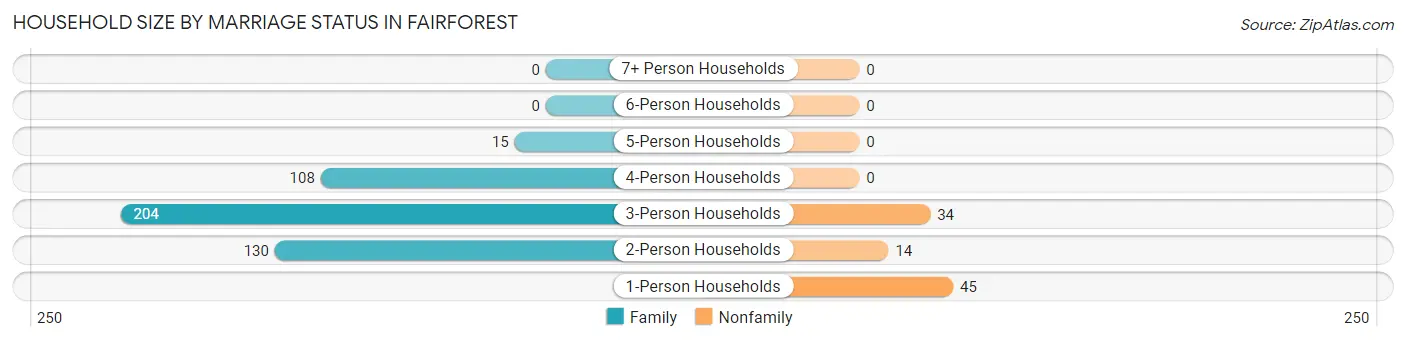
| Household Size | Family Households | Nonfamily Households |
| 1-Person Households | - | 45 (8.2%) |
| 2-Person Households | 130 (23.6%) | 14 (2.5%) |
| 3-Person Households | 204 (37.1%) | 34 (6.2%) |
| 4-Person Households | 108 (19.6%) | 0 (0.0%) |
| 5-Person Households | 15 (2.7%) | 0 (0.0%) |
| 6-Person Households | 0 (0.0%) | 0 (0.0%) |
| 7+ Person Households | 0 (0.0%) | 0 (0.0%) |
| Total | 457 (83.1%) | 93 (16.9%) |
Female Fertility in Fairforest
Fertility by Age in Fairforest
Average fertility rate in Fairforest is 20.0 births per 1,000 women. Women in the age bracket of 20 to 34 years have the highest fertility rate with 87.0 births per 1,000 women. Women in the age bracket of 20 to 34 years acount for 100.0% of all women with births.
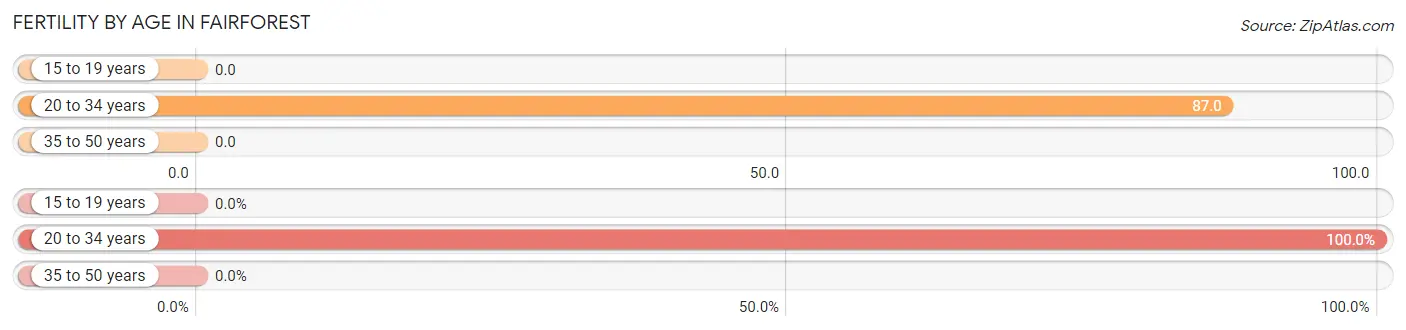
| Age Bracket | Women with Births | Births / 1,000 Women |
| 15 to 19 years | 0 (0.0%) | 0.0 |
| 20 to 34 years | 10 (100.0%) | 87.0 |
| 35 to 50 years | 0 (0.0%) | 0.0 |
| Total | 10 (100.0%) | 20.0 |
Fertility by Age by Marriage Status in Fairforest
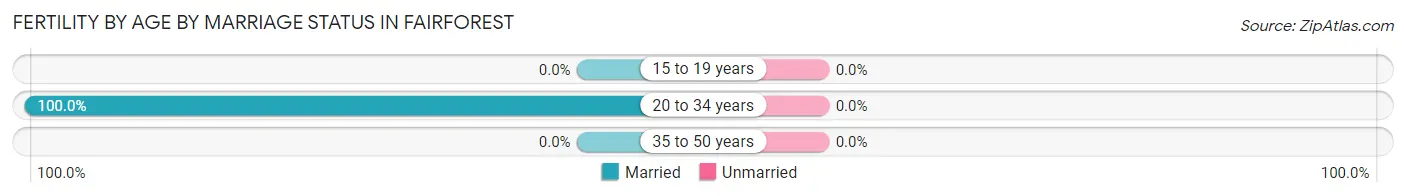
| Age Bracket | Married | Unmarried |
| 15 to 19 years | 0 (0.0%) | 0 (0.0%) |
| 20 to 34 years | 10 (100.0%) | 0 (0.0%) |
| 35 to 50 years | 0 (0.0%) | 0 (0.0%) |
| Total | 10 (100.0%) | 0 (0.0%) |
Fertility by Education in Fairforest
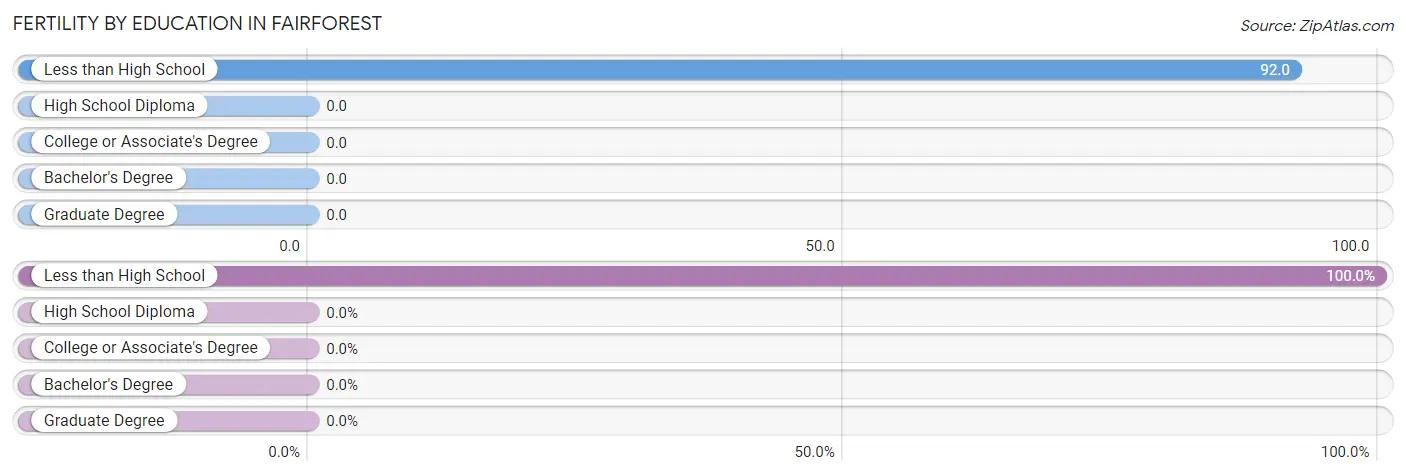
| Educational Attainment | Women with Births | Births / 1,000 Women |
| Less than High School | 10 (100.0%) | 92.0 |
| High School Diploma | 0 (0.0%) | 0.0 |
| College or Associate's Degree | 0 (0.0%) | 0.0 |
| Bachelor's Degree | 0 (0.0%) | 0.0 |
| Graduate Degree | 0 (0.0%) | 0.0 |
| Total | 10 (100.0%) | 20.0 |
Fertility by Education by Marriage Status in Fairforest
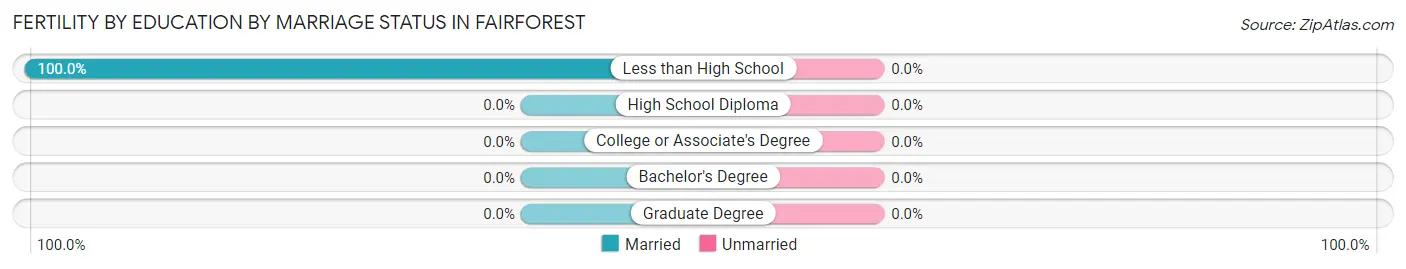
| Educational Attainment | Married | Unmarried |
| Less than High School | 10 (100.0%) | 0 (0.0%) |
| High School Diploma | 0 (0.0%) | 0 (0.0%) |
| College or Associate's Degree | 0 (0.0%) | 0 (0.0%) |
| Bachelor's Degree | 0 (0.0%) | 0 (0.0%) |
| Graduate Degree | 0 (0.0%) | 0 (0.0%) |
| Total | 10 (100.0%) | 0 (0.0%) |
Employment Characteristics in Fairforest
Employment by Class of Employer in Fairforest
Among the 719 employed individuals in Fairforest, private company employees (656 | 91.2%), self-employed (not incorporated) (58 | 8.1%), and not-for-profit organizations (5 | 0.7%) make up the most common classes of employment.
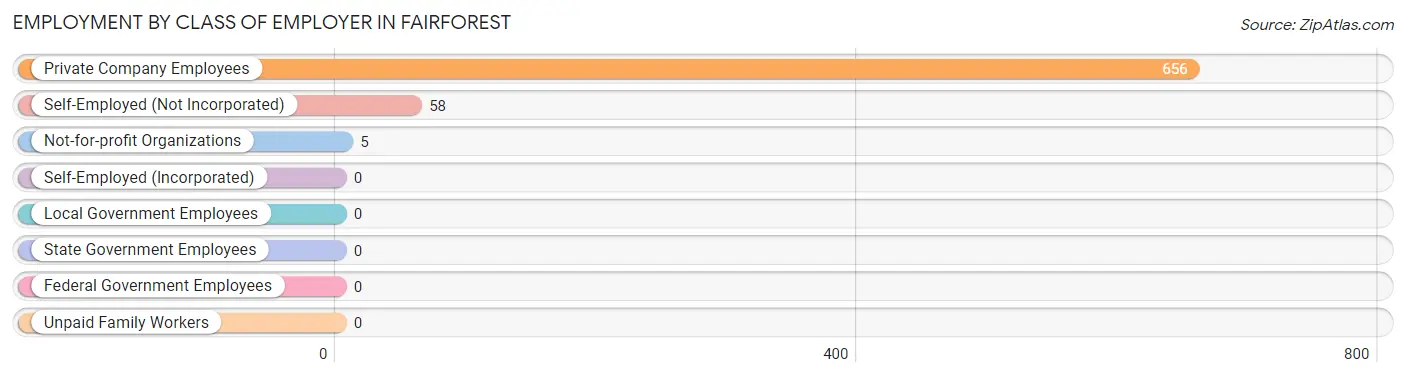
| Employer Class | # Employees | % Employees |
| Private Company Employees | 656 | 91.2% |
| Self-Employed (Incorporated) | 0 | 0.0% |
| Self-Employed (Not Incorporated) | 58 | 8.1% |
| Not-for-profit Organizations | 5 | 0.7% |
| Local Government Employees | 0 | 0.0% |
| State Government Employees | 0 | 0.0% |
| Federal Government Employees | 0 | 0.0% |
| Unpaid Family Workers | 0 | 0.0% |
| Total | 719 | 100.0% |
Employment Status by Age in Fairforest
According to the labor force statistics for Fairforest, out of the total population over 16 years of age (1,488), 54.2% or 806 individuals are in the labor force, with 8.3% or 67 of them unemployed. The age group with the highest labor force participation rate is 20 to 24 years, with 100.0% or 103 individuals in the labor force. Within the labor force, the 16 to 19 years age range has the highest percentage of unemployed individuals, with 100.0% or 67 of them being unemployed.
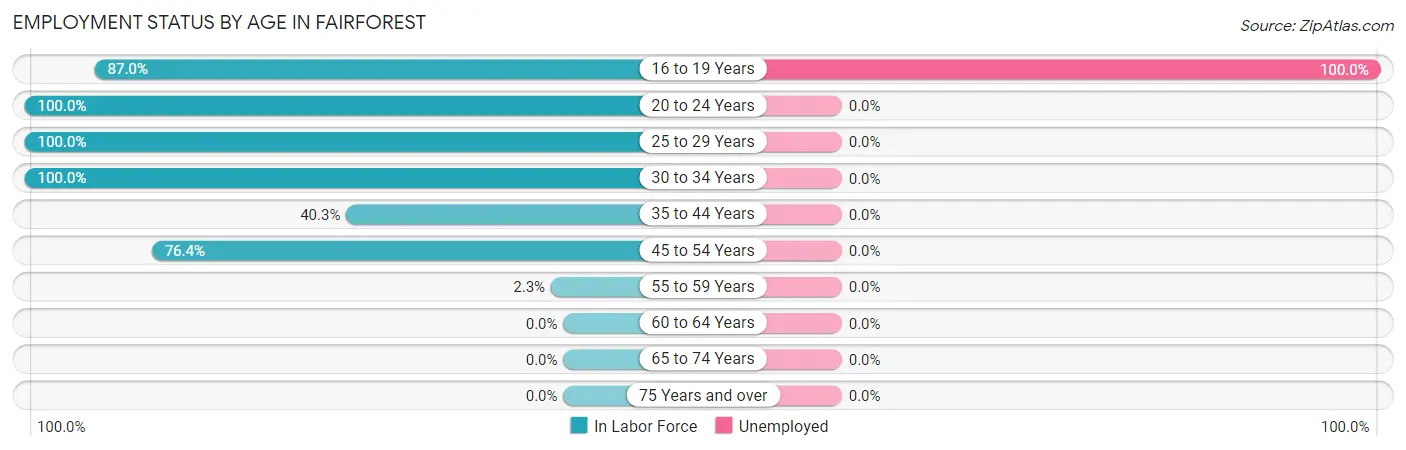
| Age Bracket | In Labor Force | Unemployed |
| 16 to 19 Years | 67 (87.0%) | 67 (100.0%) |
| 20 to 24 Years | 103 (100.0%) | 0 (0.0%) |
| 25 to 29 Years | 72 (100.0%) | 0 (0.0%) |
| 30 to 34 Years | 161 (100.0%) | 0 (0.0%) |
| 35 to 44 Years | 121 (40.3%) | 0 (0.0%) |
| 45 to 54 Years | 278 (76.4%) | 0 (0.0%) |
| 55 to 59 Years | 5 (2.3%) | 0 (0.0%) |
| 60 to 64 Years | 0 (0.0%) | 0 (0.0%) |
| 65 to 74 Years | 0 (0.0%) | 0 (0.0%) |
| 75 Years and over | 0 (0.0%) | 0 (0.0%) |
| Total | 806 (54.2%) | 67 (8.3%) |
Employment Status by Educational Attainment in Fairforest
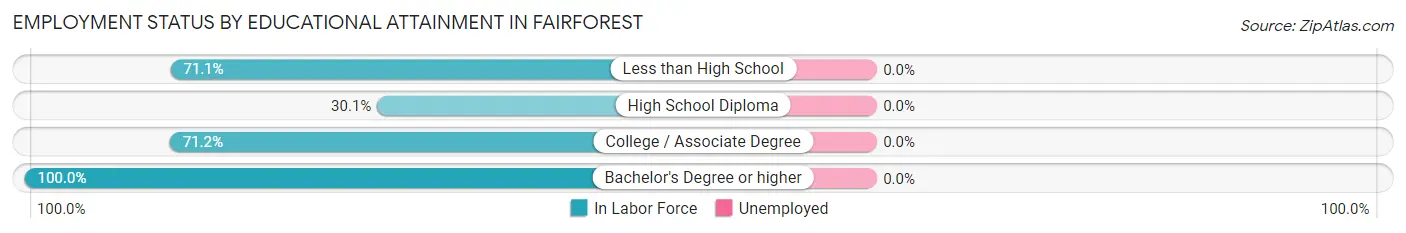
| Educational Attainment | In Labor Force | Unemployed |
| Less than High School | 261 (71.1%) | 0 (0.0%) |
| High School Diploma | 134 (30.1%) | 0 (0.0%) |
| College / Associate Degree | 237 (71.2%) | 0 (0.0%) |
| Bachelor's Degree or higher | 5 (100.0%) | 0 (0.0%) |
| Total | 637 (55.4%) | 0 (0.0%) |
Employment Occupations by Sex in Fairforest
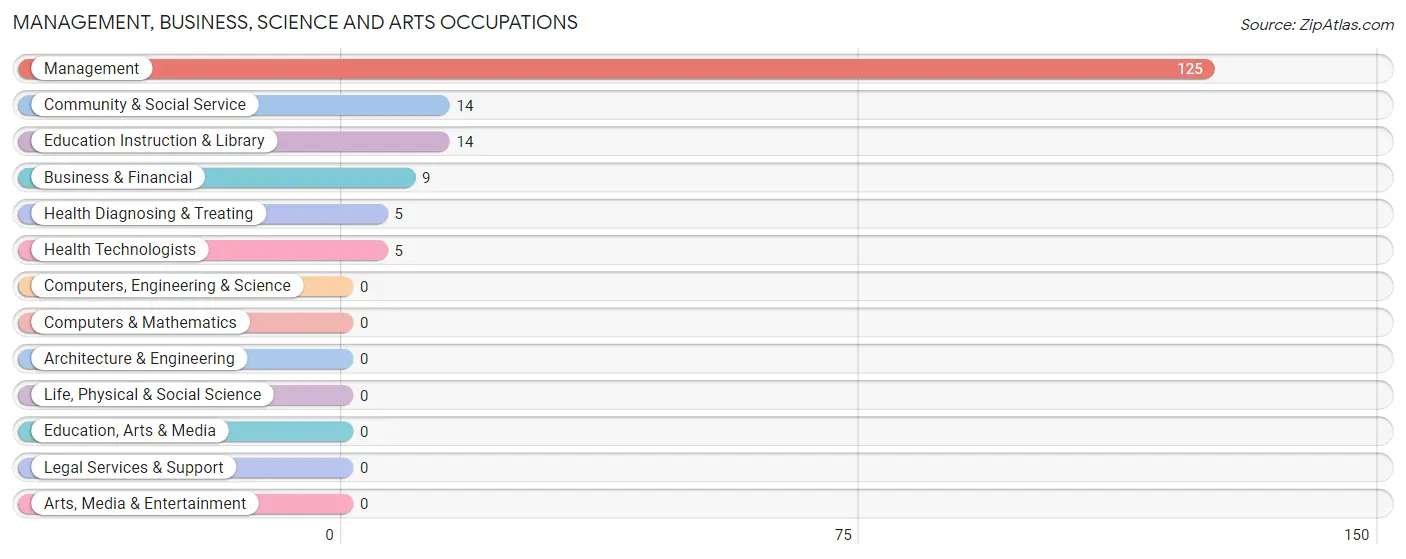
Management, Business, Science and Arts Occupations
The most common Management, Business, Science and Arts occupations in Fairforest are Management (125 | 16.9%), Community & Social Service (14 | 1.9%), Education Instruction & Library (14 | 1.9%), Business & Financial (9 | 1.2%), and Health Diagnosing & Treating (5 | 0.7%).
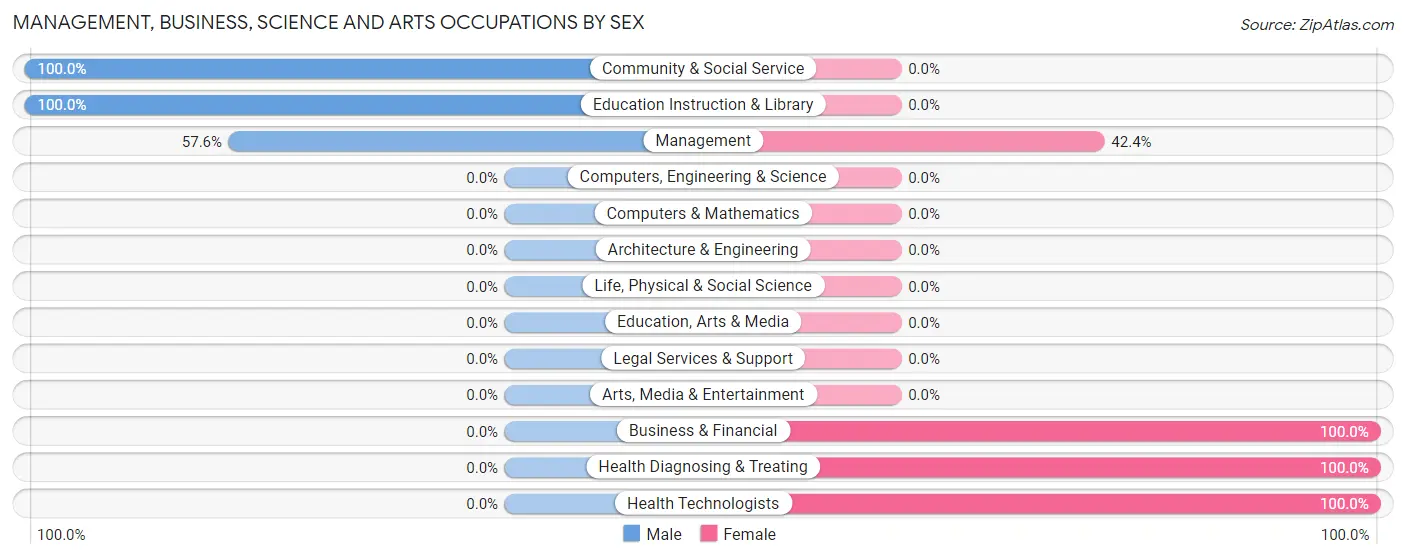
Management, Business, Science and Arts Occupations by Sex
Within the Management, Business, Science and Arts occupations in Fairforest, the most male-oriented occupations are Community & Social Service (100.0%), Education Instruction & Library (100.0%), and Management (57.6%), while the most female-oriented occupations are Business & Financial (100.0%), Health Diagnosing & Treating (100.0%), and Health Technologists (100.0%).
| Occupation | Male | Female |
| Management | 72 (57.6%) | 53 (42.4%) |
| Business & Financial | 0 (0.0%) | 9 (100.0%) |
| Computers, Engineering & Science | 0 (0.0%) | 0 (0.0%) |
| Computers & Mathematics | 0 (0.0%) | 0 (0.0%) |
| Architecture & Engineering | 0 (0.0%) | 0 (0.0%) |
| Life, Physical & Social Science | 0 (0.0%) | 0 (0.0%) |
| Community & Social Service | 14 (100.0%) | 0 (0.0%) |
| Education, Arts & Media | 0 (0.0%) | 0 (0.0%) |
| Legal Services & Support | 0 (0.0%) | 0 (0.0%) |
| Education Instruction & Library | 14 (100.0%) | 0 (0.0%) |
| Arts, Media & Entertainment | 0 (0.0%) | 0 (0.0%) |
| Health Diagnosing & Treating | 0 (0.0%) | 5 (100.0%) |
| Health Technologists | 0 (0.0%) | 5 (100.0%) |
| Total (Category) | 86 (56.2%) | 67 (43.8%) |
| Total (Overall) | 480 (64.9%) | 260 (35.1%) |
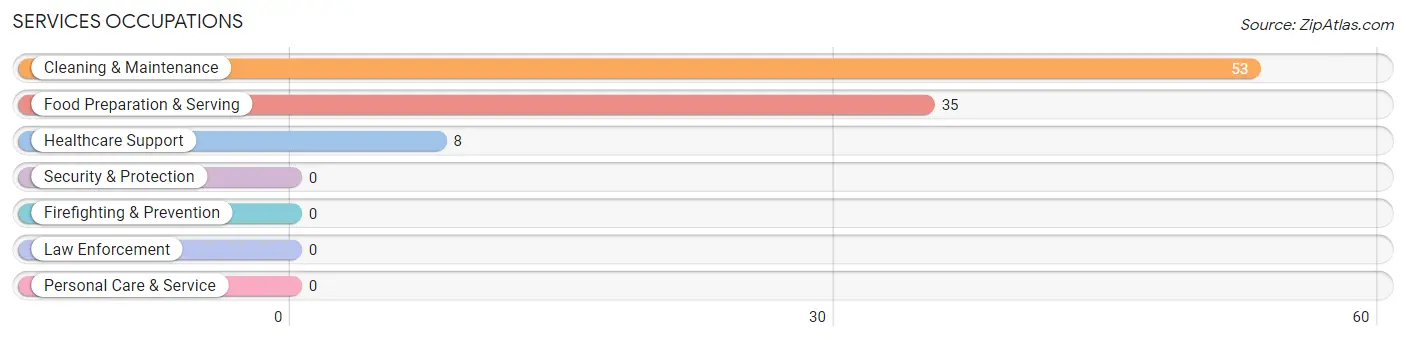
Services Occupations
The most common Services occupations in Fairforest are Cleaning & Maintenance (53 | 7.2%), Food Preparation & Serving (35 | 4.7%), and Healthcare Support (8 | 1.1%).
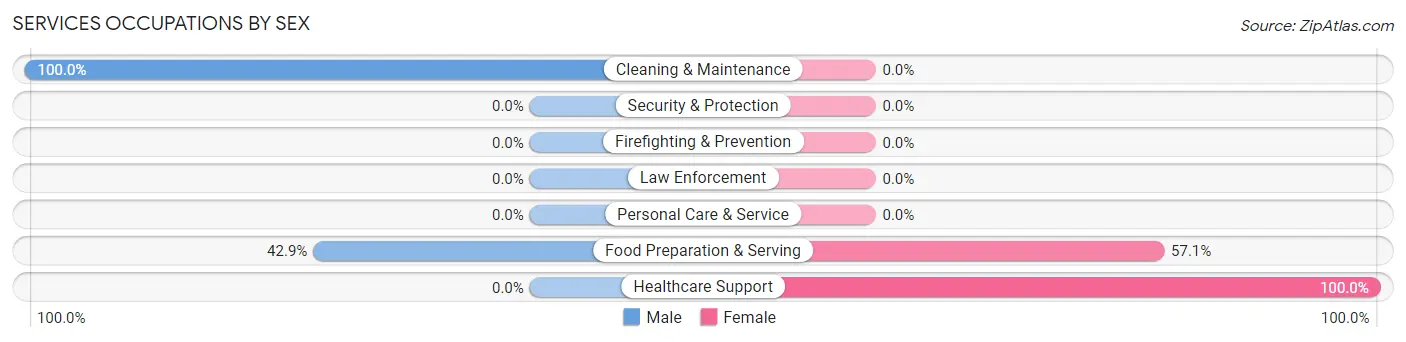
Services Occupations by Sex
Within the Services occupations in Fairforest, the most male-oriented occupations are Cleaning & Maintenance (100.0%), and Food Preparation & Serving (42.9%), while the most female-oriented occupations are Healthcare Support (100.0%), and Food Preparation & Serving (57.1%).
| Occupation | Male | Female |
| Healthcare Support | 0 (0.0%) | 8 (100.0%) |
| Security & Protection | 0 (0.0%) | 0 (0.0%) |
| Firefighting & Prevention | 0 (0.0%) | 0 (0.0%) |
| Law Enforcement | 0 (0.0%) | 0 (0.0%) |
| Food Preparation & Serving | 15 (42.9%) | 20 (57.1%) |
| Cleaning & Maintenance | 53 (100.0%) | 0 (0.0%) |
| Personal Care & Service | 0 (0.0%) | 0 (0.0%) |
| Total (Category) | 68 (70.8%) | 28 (29.2%) |
| Total (Overall) | 480 (64.9%) | 260 (35.1%) |
Sales and Office Occupations
The most common Sales and Office occupations in Fairforest are , and Sales & Related (72 | 9.7%).
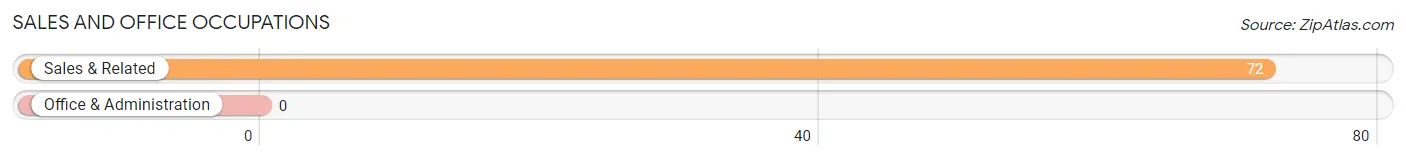
Sales and Office Occupations by Sex
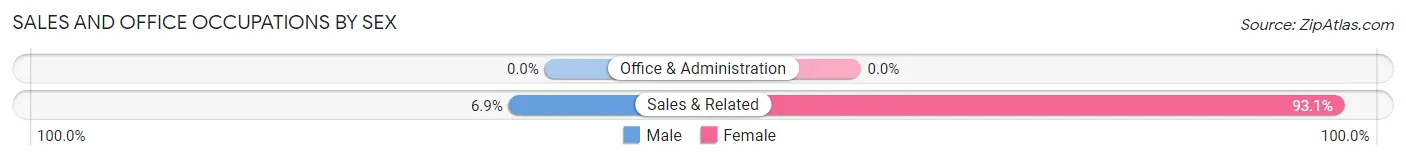
| Occupation | Male | Female |
| Sales & Related | 5 (6.9%) | 67 (93.1%) |
| Office & Administration | 0 (0.0%) | 0 (0.0%) |
| Total (Category) | 5 (6.9%) | 67 (93.1%) |
| Total (Overall) | 480 (64.9%) | 260 (35.1%) |
Natural Resources, Construction and Maintenance Occupations
The most common Natural Resources, Construction and Maintenance occupations in Fairforest are Farming, Fishing & Forestry (140 | 18.9%), Construction & Extraction (67 | 9.0%), and Installation, Maintenance & Repair (62 | 8.4%).
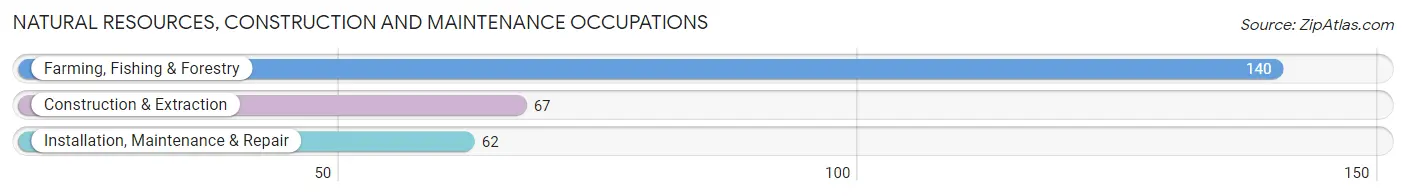
Natural Resources, Construction and Maintenance Occupations by Sex
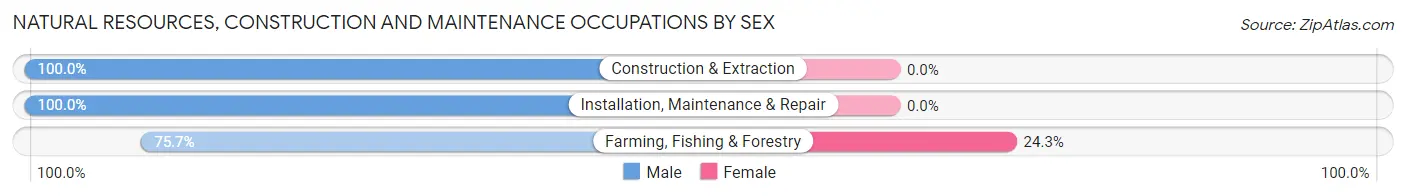
| Occupation | Male | Female |
| Farming, Fishing & Forestry | 106 (75.7%) | 34 (24.3%) |
| Construction & Extraction | 67 (100.0%) | 0 (0.0%) |
| Installation, Maintenance & Repair | 62 (100.0%) | 0 (0.0%) |
| Total (Category) | 235 (87.4%) | 34 (12.6%) |
| Total (Overall) | 480 (64.9%) | 260 (35.1%) |
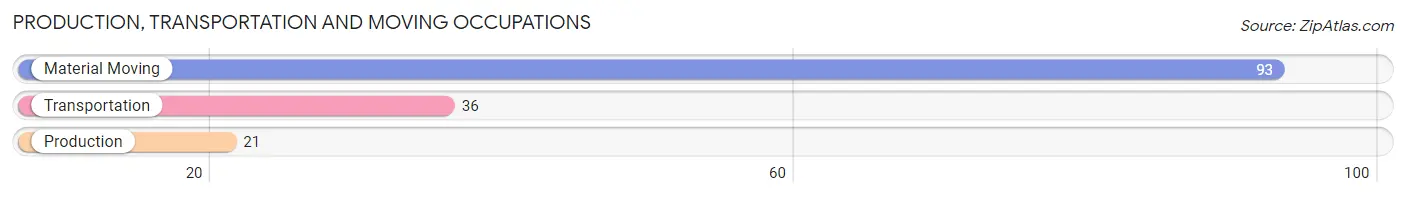
Production, Transportation and Moving Occupations
The most common Production, Transportation and Moving occupations in Fairforest are Material Moving (93 | 12.6%), Transportation (36 | 4.9%), and Production (21 | 2.8%).
Production, Transportation and Moving Occupations by Sex
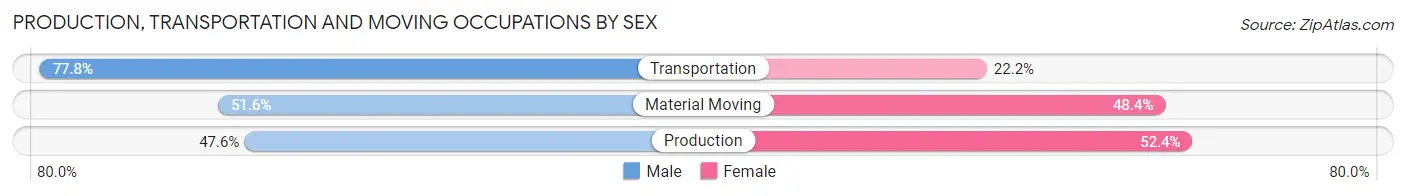
| Occupation | Male | Female |
| Production | 10 (47.6%) | 11 (52.4%) |
| Transportation | 28 (77.8%) | 8 (22.2%) |
| Material Moving | 48 (51.6%) | 45 (48.4%) |
| Total (Category) | 86 (57.3%) | 64 (42.7%) |
| Total (Overall) | 480 (64.9%) | 260 (35.1%) |
Employment Industries by Sex in Fairforest
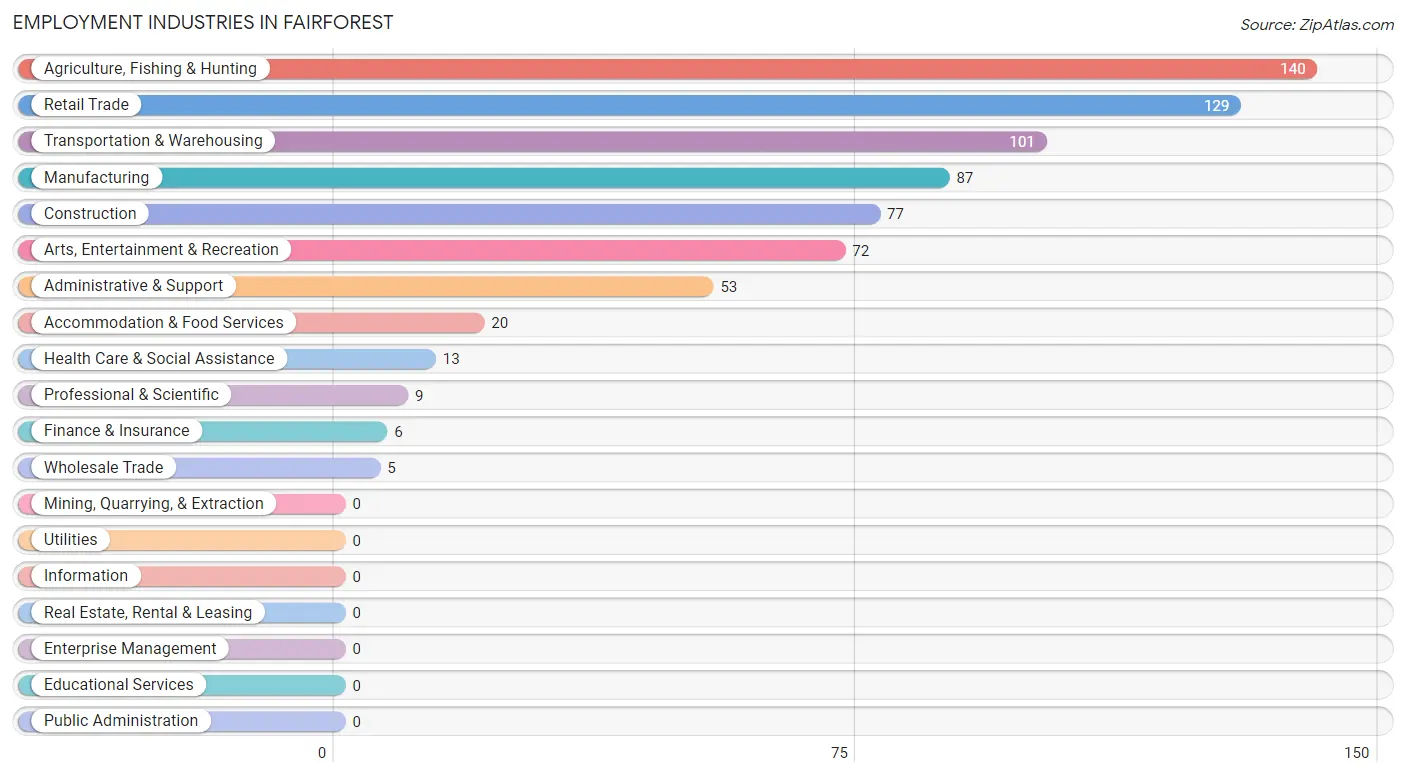
Employment Industries in Fairforest
The major employment industries in Fairforest include Agriculture, Fishing & Hunting (140 | 18.9%), Retail Trade (129 | 17.4%), Transportation & Warehousing (101 | 13.7%), Manufacturing (87 | 11.8%), and Construction (77 | 10.4%).
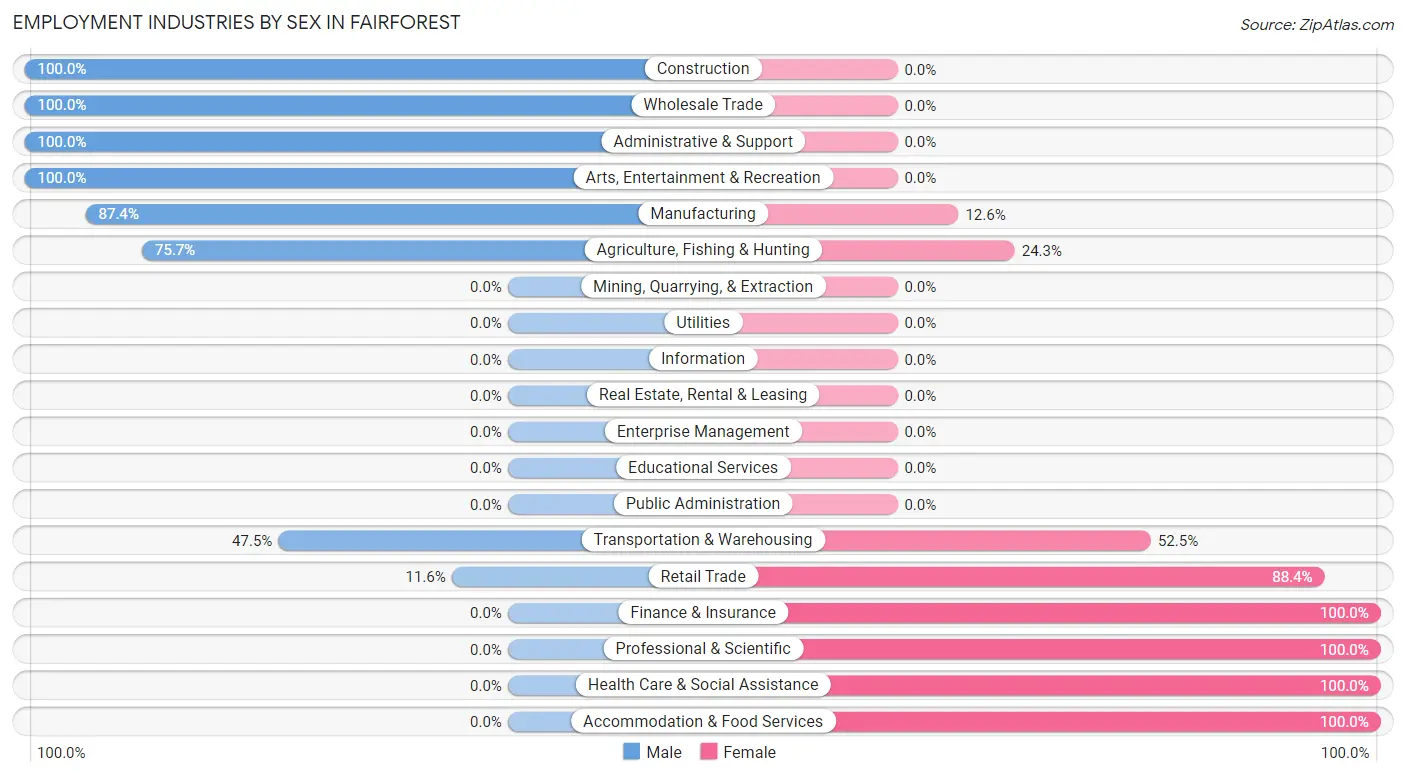
Employment Industries by Sex in Fairforest
The Fairforest industries that see more men than women are Construction (100.0%), Wholesale Trade (100.0%), and Administrative & Support (100.0%), whereas the industries that tend to have a higher number of women are Finance & Insurance (100.0%), Professional & Scientific (100.0%), and Health Care & Social Assistance (100.0%).
| Industry | Male | Female |
| Agriculture, Fishing & Hunting | 106 (75.7%) | 34 (24.3%) |
| Mining, Quarrying, & Extraction | 0 (0.0%) | 0 (0.0%) |
| Construction | 77 (100.0%) | 0 (0.0%) |
| Manufacturing | 76 (87.4%) | 11 (12.6%) |
| Wholesale Trade | 5 (100.0%) | 0 (0.0%) |
| Retail Trade | 15 (11.6%) | 114 (88.4%) |
| Transportation & Warehousing | 48 (47.5%) | 53 (52.5%) |
| Utilities | 0 (0.0%) | 0 (0.0%) |
| Information | 0 (0.0%) | 0 (0.0%) |
| Finance & Insurance | 0 (0.0%) | 6 (100.0%) |
| Real Estate, Rental & Leasing | 0 (0.0%) | 0 (0.0%) |
| Professional & Scientific | 0 (0.0%) | 9 (100.0%) |
| Enterprise Management | 0 (0.0%) | 0 (0.0%) |
| Administrative & Support | 53 (100.0%) | 0 (0.0%) |
| Educational Services | 0 (0.0%) | 0 (0.0%) |
| Health Care & Social Assistance | 0 (0.0%) | 13 (100.0%) |
| Arts, Entertainment & Recreation | 72 (100.0%) | 0 (0.0%) |
| Accommodation & Food Services | 0 (0.0%) | 20 (100.0%) |
| Public Administration | 0 (0.0%) | 0 (0.0%) |
| Total | 480 (64.9%) | 260 (35.1%) |
Education in Fairforest
School Enrollment in Fairforest
The most common levels of schooling among the 231 students in Fairforest are high school (88 | 38.1%), college / undergraduate (56 | 24.2%), and kindergarten (48 | 20.8%).
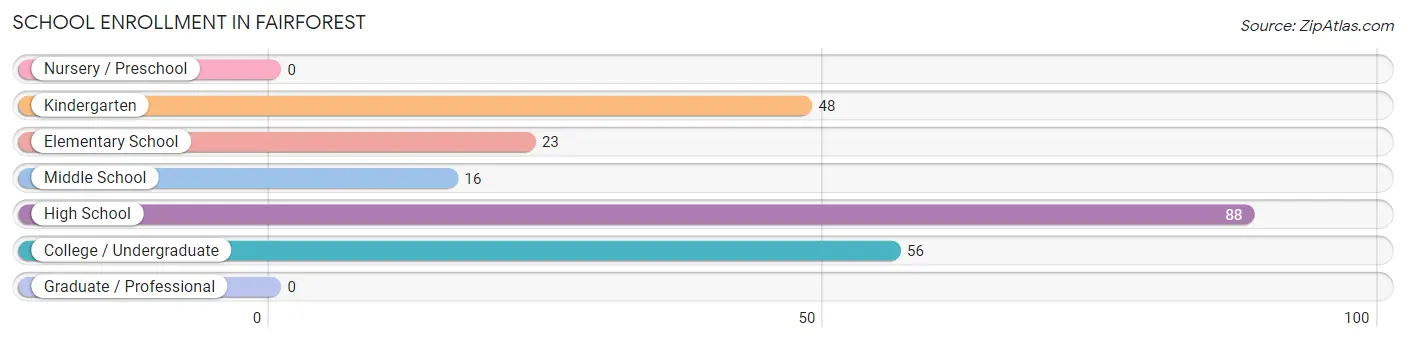
| School Level | # Students | % Students |
| Nursery / Preschool | 0 | 0.0% |
| Kindergarten | 48 | 20.8% |
| Elementary School | 23 | 10.0% |
| Middle School | 16 | 6.9% |
| High School | 88 | 38.1% |
| College / Undergraduate | 56 | 24.2% |
| Graduate / Professional | 0 | 0.0% |
| Total | 231 | 100.0% |
School Enrollment by Age by Funding Source in Fairforest
Out of a total of 231 students who are enrolled in schools in Fairforest, 2 (0.9%) attend a private institution, while the remaining 229 (99.1%) are enrolled in public schools. The age group of 10 to 14 year olds has the highest likelihood of being enrolled in private schools, with 2 (7.4% in the age bracket) enrolled. Conversely, the age group of 5 to 9 year old has the lowest likelihood of being enrolled in a private school, with 70 (100.0% in the age bracket) attending a public institution.
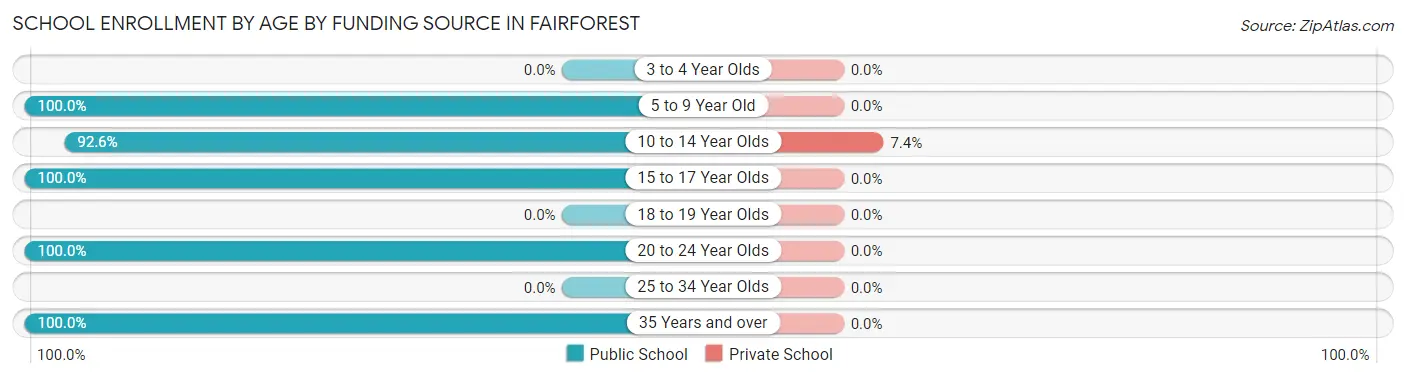
| Age Bracket | Public School | Private School |
| 3 to 4 Year Olds | 0 (0.0%) | 0 (0.0%) |
| 5 to 9 Year Old | 70 (100.0%) | 0 (0.0%) |
| 10 to 14 Year Olds | 25 (92.6%) | 2 (7.4%) |
| 15 to 17 Year Olds | 78 (100.0%) | 0 (0.0%) |
| 18 to 19 Year Olds | 0 (0.0%) | 0 (0.0%) |
| 20 to 24 Year Olds | 28 (100.0%) | 0 (0.0%) |
| 25 to 34 Year Olds | 0 (0.0%) | 0 (0.0%) |
| 35 Years and over | 28 (100.0%) | 0 (0.0%) |
| Total | 229 (99.1%) | 2 (0.9%) |
Educational Attainment by Field of Study in Fairforest
Education (14 | 73.7%), and science & technology (5 | 26.3%) are the most common fields of study among 19 individuals in Fairforest who have obtained a bachelor's degree or higher.
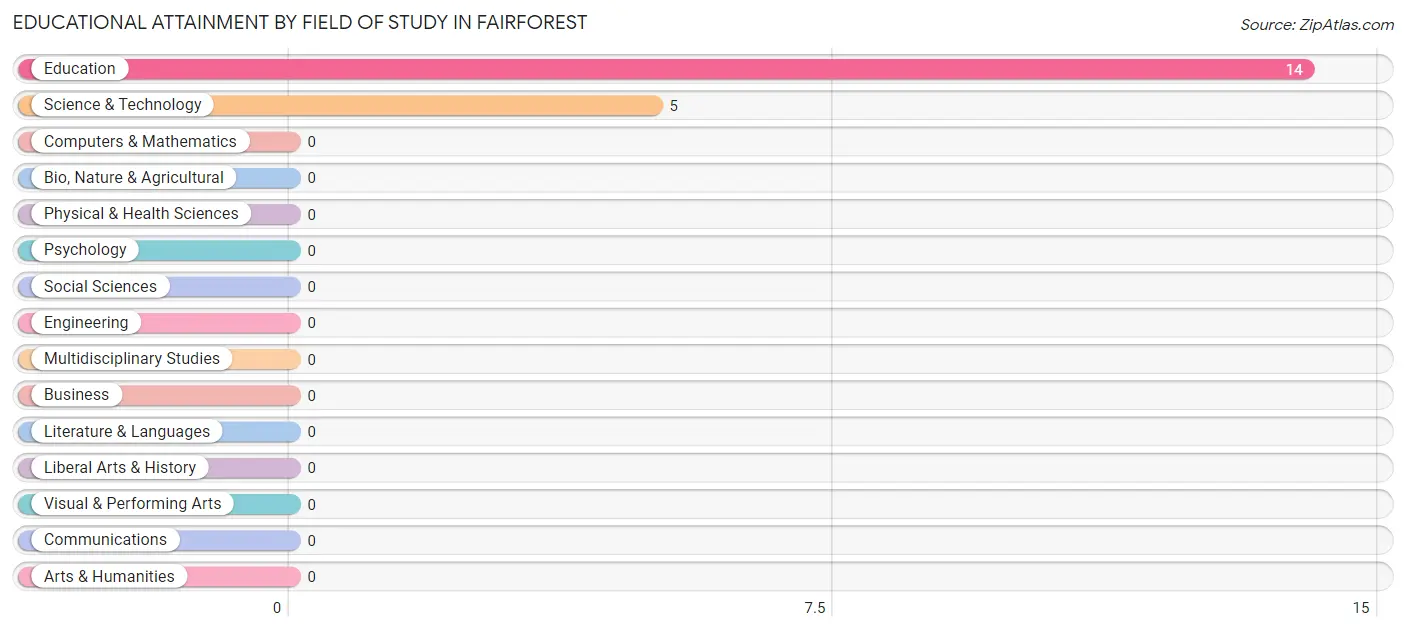
| Field of Study | # Graduates | % Graduates |
| Computers & Mathematics | 0 | 0.0% |
| Bio, Nature & Agricultural | 0 | 0.0% |
| Physical & Health Sciences | 0 | 0.0% |
| Psychology | 0 | 0.0% |
| Social Sciences | 0 | 0.0% |
| Engineering | 0 | 0.0% |
| Multidisciplinary Studies | 0 | 0.0% |
| Science & Technology | 5 | 26.3% |
| Business | 0 | 0.0% |
| Education | 14 | 73.7% |
| Literature & Languages | 0 | 0.0% |
| Liberal Arts & History | 0 | 0.0% |
| Visual & Performing Arts | 0 | 0.0% |
| Communications | 0 | 0.0% |
| Arts & Humanities | 0 | 0.0% |
| Total | 19 | 100.0% |
Transportation & Commute in Fairforest
Vehicle Availability by Sex in Fairforest
The most prevalent vehicle ownership categories in Fairforest are males with 1 vehicle (239, accounting for 49.8%) and females with 1 vehicle (65, making up 100.0%).
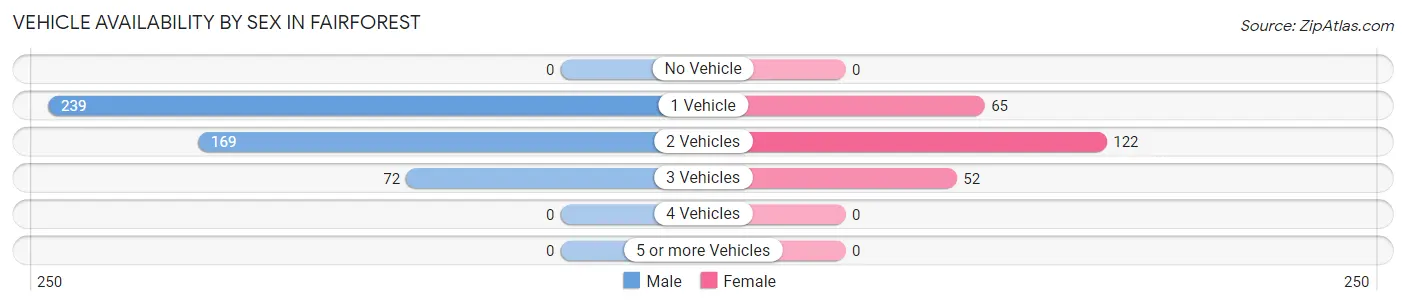
| Vehicles Available | Male | Female |
| No Vehicle | 0 (0.0%) | 0 (0.0%) |
| 1 Vehicle | 239 (49.8%) | 65 (27.2%) |
| 2 Vehicles | 169 (35.2%) | 122 (51.0%) |
| 3 Vehicles | 72 (15.0%) | 52 (21.8%) |
| 4 Vehicles | 0 (0.0%) | 0 (0.0%) |
| 5 or more Vehicles | 0 (0.0%) | 0 (0.0%) |
| Total | 480 (100.0%) | 239 (100.0%) |
Commute Time in Fairforest
The most frequently occuring commute durations in Fairforest are less than 5 minutes (193 commuters, 27.1%), 20 to 24 minutes (152 commuters, 21.4%), and 25 to 29 minutes (123 commuters, 17.3%).
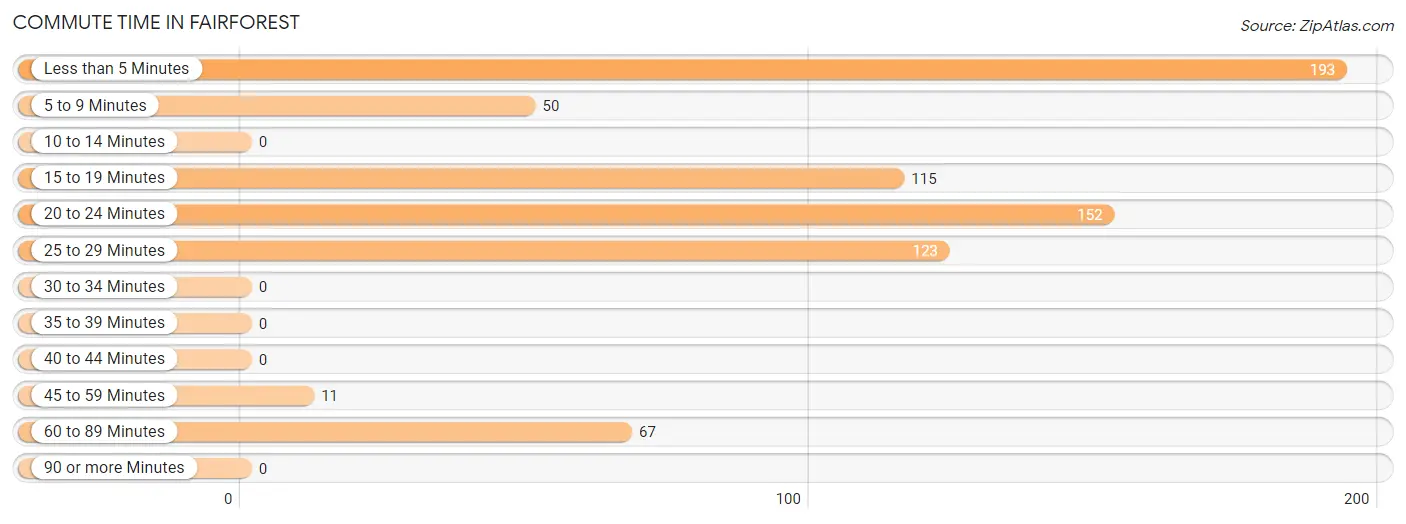
| Commute Time | # Commuters | % Commuters |
| Less than 5 Minutes | 193 | 27.1% |
| 5 to 9 Minutes | 50 | 7.0% |
| 10 to 14 Minutes | 0 | 0.0% |
| 15 to 19 Minutes | 115 | 16.2% |
| 20 to 24 Minutes | 152 | 21.4% |
| 25 to 29 Minutes | 123 | 17.3% |
| 30 to 34 Minutes | 0 | 0.0% |
| 35 to 39 Minutes | 0 | 0.0% |
| 40 to 44 Minutes | 0 | 0.0% |
| 45 to 59 Minutes | 11 | 1.5% |
| 60 to 89 Minutes | 67 | 9.4% |
| 90 or more Minutes | 0 | 0.0% |
Commute Time by Sex in Fairforest
The most common commute times in Fairforest are less than 5 minutes (159 commuters, 33.1%) for males and 25 to 29 minutes (66 commuters, 28.6%) for females.
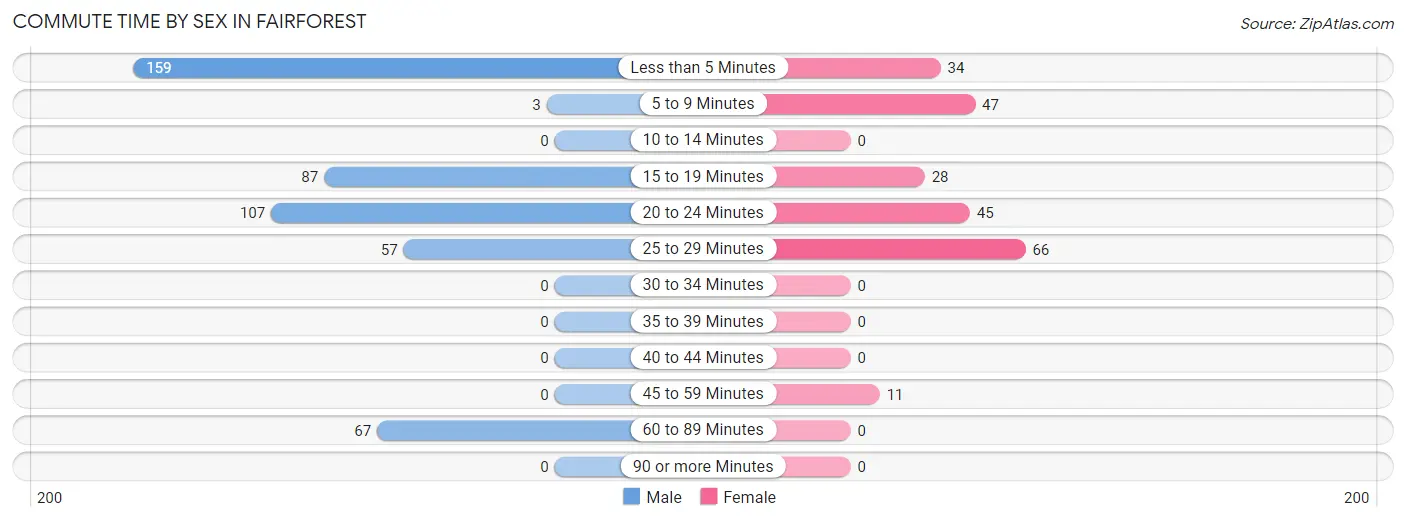
| Commute Time | Male | Female |
| Less than 5 Minutes | 159 (33.1%) | 34 (14.7%) |
| 5 to 9 Minutes | 3 (0.6%) | 47 (20.3%) |
| 10 to 14 Minutes | 0 (0.0%) | 0 (0.0%) |
| 15 to 19 Minutes | 87 (18.1%) | 28 (12.1%) |
| 20 to 24 Minutes | 107 (22.3%) | 45 (19.5%) |
| 25 to 29 Minutes | 57 (11.9%) | 66 (28.6%) |
| 30 to 34 Minutes | 0 (0.0%) | 0 (0.0%) |
| 35 to 39 Minutes | 0 (0.0%) | 0 (0.0%) |
| 40 to 44 Minutes | 0 (0.0%) | 0 (0.0%) |
| 45 to 59 Minutes | 0 (0.0%) | 11 (4.8%) |
| 60 to 89 Minutes | 67 (14.0%) | 0 (0.0%) |
| 90 or more Minutes | 0 (0.0%) | 0 (0.0%) |
Time of Departure to Work by Sex in Fairforest
The most frequent times of departure to work in Fairforest are 7:00 AM to 7:29 AM (181, 37.7%) for males and 7:00 AM to 7:29 AM (89, 38.5%) for females.
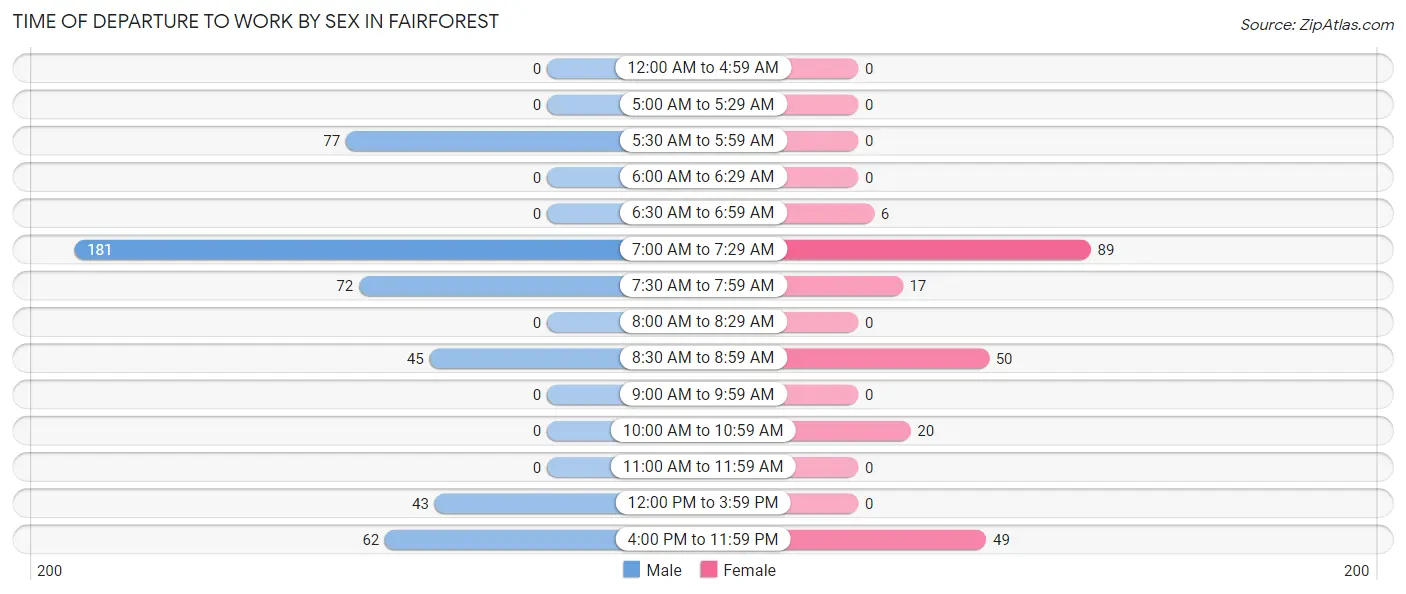
| Time of Departure | Male | Female |
| 12:00 AM to 4:59 AM | 0 (0.0%) | 0 (0.0%) |
| 5:00 AM to 5:29 AM | 0 (0.0%) | 0 (0.0%) |
| 5:30 AM to 5:59 AM | 77 (16.0%) | 0 (0.0%) |
| 6:00 AM to 6:29 AM | 0 (0.0%) | 0 (0.0%) |
| 6:30 AM to 6:59 AM | 0 (0.0%) | 6 (2.6%) |
| 7:00 AM to 7:29 AM | 181 (37.7%) | 89 (38.5%) |
| 7:30 AM to 7:59 AM | 72 (15.0%) | 17 (7.4%) |
| 8:00 AM to 8:29 AM | 0 (0.0%) | 0 (0.0%) |
| 8:30 AM to 8:59 AM | 45 (9.4%) | 50 (21.6%) |
| 9:00 AM to 9:59 AM | 0 (0.0%) | 0 (0.0%) |
| 10:00 AM to 10:59 AM | 0 (0.0%) | 20 (8.7%) |
| 11:00 AM to 11:59 AM | 0 (0.0%) | 0 (0.0%) |
| 12:00 PM to 3:59 PM | 43 (9.0%) | 0 (0.0%) |
| 4:00 PM to 11:59 PM | 62 (12.9%) | 49 (21.2%) |
| Total | 480 (100.0%) | 231 (100.0%) |
Housing Occupancy in Fairforest
Occupancy by Ownership in Fairforest
Of the total 550 dwellings in Fairforest, owner-occupied units account for 406 (73.8%), while renter-occupied units make up 144 (26.2%).
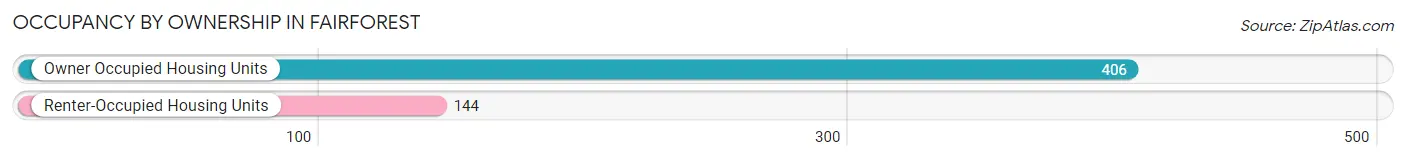
| Occupancy | # Housing Units | % Housing Units |
| Owner Occupied Housing Units | 406 | 73.8% |
| Renter-Occupied Housing Units | 144 | 26.2% |
| Total Occupied Housing Units | 550 | 100.0% |
Occupancy by Household Size in Fairforest
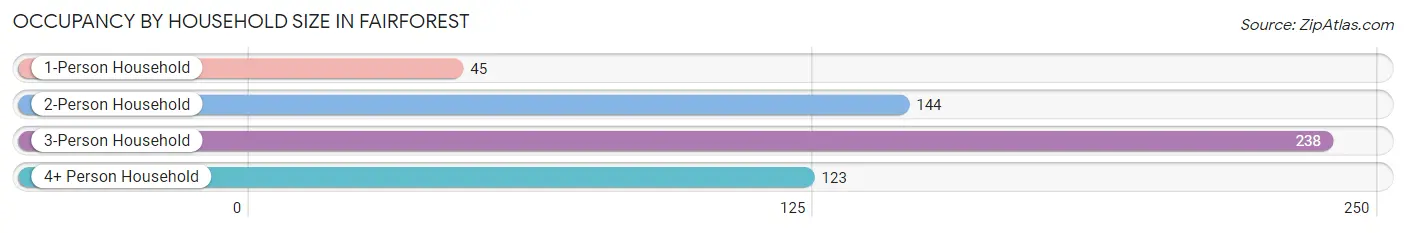
| Household Size | # Housing Units | % Housing Units |
| 1-Person Household | 45 | 8.2% |
| 2-Person Household | 144 | 26.2% |
| 3-Person Household | 238 | 43.3% |
| 4+ Person Household | 123 | 22.4% |
| Total Housing Units | 550 | 100.0% |
Occupancy by Ownership by Household Size in Fairforest
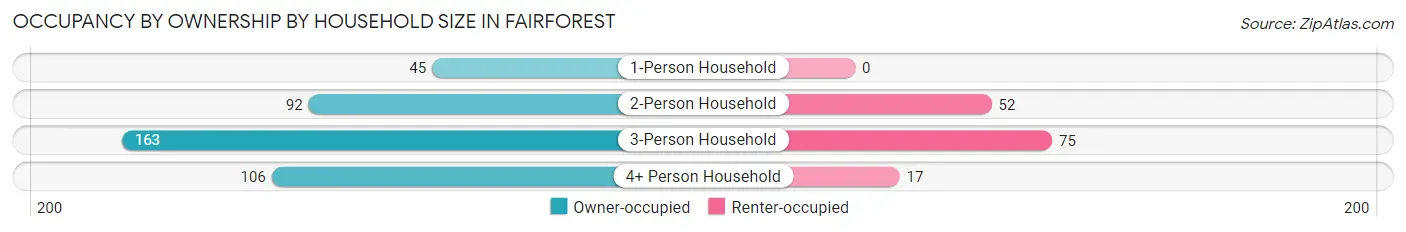
| Household Size | Owner-occupied | Renter-occupied |
| 1-Person Household | 45 (100.0%) | 0 (0.0%) |
| 2-Person Household | 92 (63.9%) | 52 (36.1%) |
| 3-Person Household | 163 (68.5%) | 75 (31.5%) |
| 4+ Person Household | 106 (86.2%) | 17 (13.8%) |
| Total Housing Units | 406 (73.8%) | 144 (26.2%) |
Occupancy by Educational Attainment in Fairforest
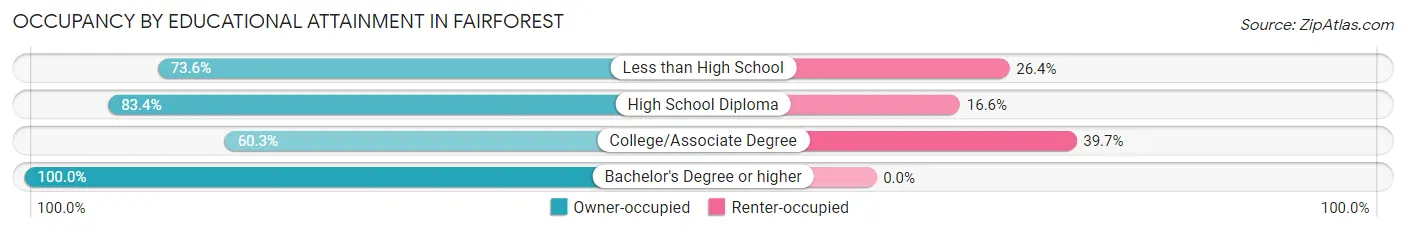
| Household Size | Owner-occupied | Renter-occupied |
| Less than High School | 92 (73.6%) | 33 (26.4%) |
| High School Diploma | 181 (83.4%) | 36 (16.6%) |
| College/Associate Degree | 114 (60.3%) | 75 (39.7%) |
| Bachelor's Degree or higher | 19 (100.0%) | 0 (0.0%) |
Occupancy by Age of Householder in Fairforest
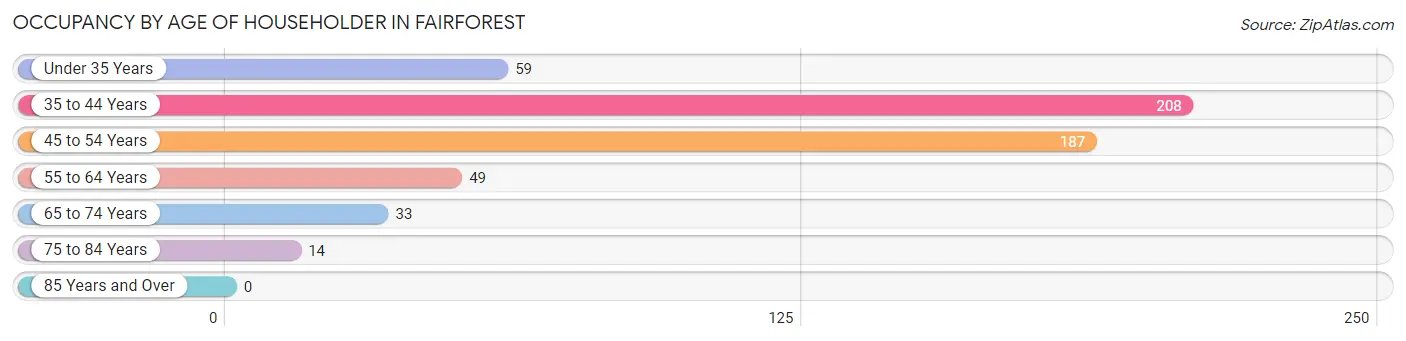
| Age Bracket | # Households | % Households |
| Under 35 Years | 59 | 10.7% |
| 35 to 44 Years | 208 | 37.8% |
| 45 to 54 Years | 187 | 34.0% |
| 55 to 64 Years | 49 | 8.9% |
| 65 to 74 Years | 33 | 6.0% |
| 75 to 84 Years | 14 | 2.5% |
| 85 Years and Over | 0 | 0.0% |
| Total | 550 | 100.0% |
Housing Finances in Fairforest
Median Income by Occupancy in Fairforest
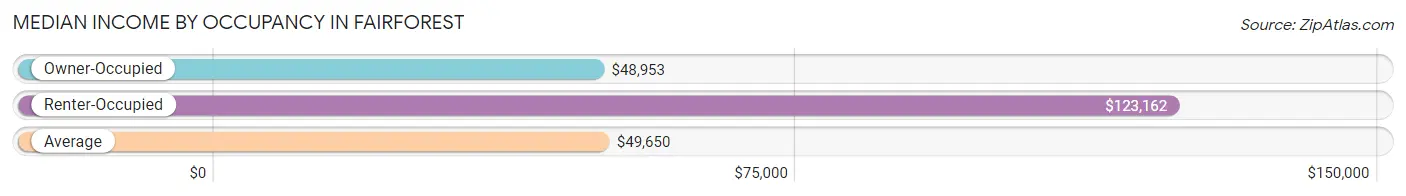
| Occupancy Type | # Households | Median Income |
| Owner-Occupied | 406 (73.8%) | $48,953 |
| Renter-Occupied | 144 (26.2%) | $123,162 |
| Average | 550 (100.0%) | $49,650 |
Occupancy by Householder Income Bracket in Fairforest
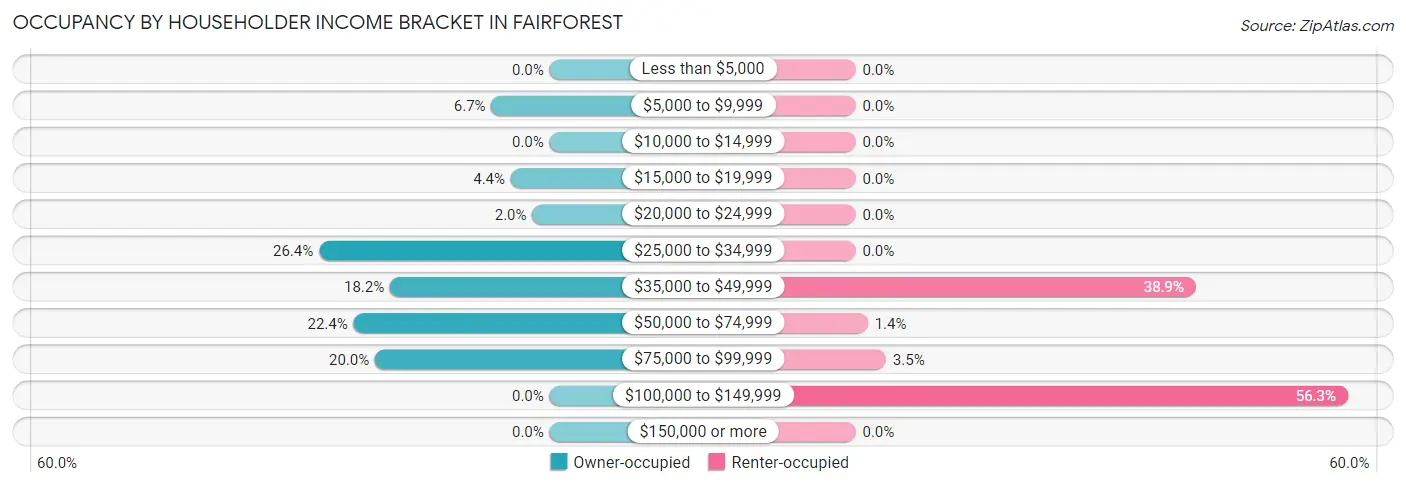
| Income Bracket | Owner-occupied | Renter-occupied |
| Less than $5,000 | 0 (0.0%) | 0 (0.0%) |
| $5,000 to $9,999 | 27 (6.7%) | 0 (0.0%) |
| $10,000 to $14,999 | 0 (0.0%) | 0 (0.0%) |
| $15,000 to $19,999 | 18 (4.4%) | 0 (0.0%) |
| $20,000 to $24,999 | 8 (2.0%) | 0 (0.0%) |
| $25,000 to $34,999 | 107 (26.4%) | 0 (0.0%) |
| $35,000 to $49,999 | 74 (18.2%) | 56 (38.9%) |
| $50,000 to $74,999 | 91 (22.4%) | 2 (1.4%) |
| $75,000 to $99,999 | 81 (20.0%) | 5 (3.5%) |
| $100,000 to $149,999 | 0 (0.0%) | 81 (56.2%) |
| $150,000 or more | 0 (0.0%) | 0 (0.0%) |
| Total | 406 (100.0%) | 144 (100.0%) |
Monthly Housing Cost Tiers in Fairforest
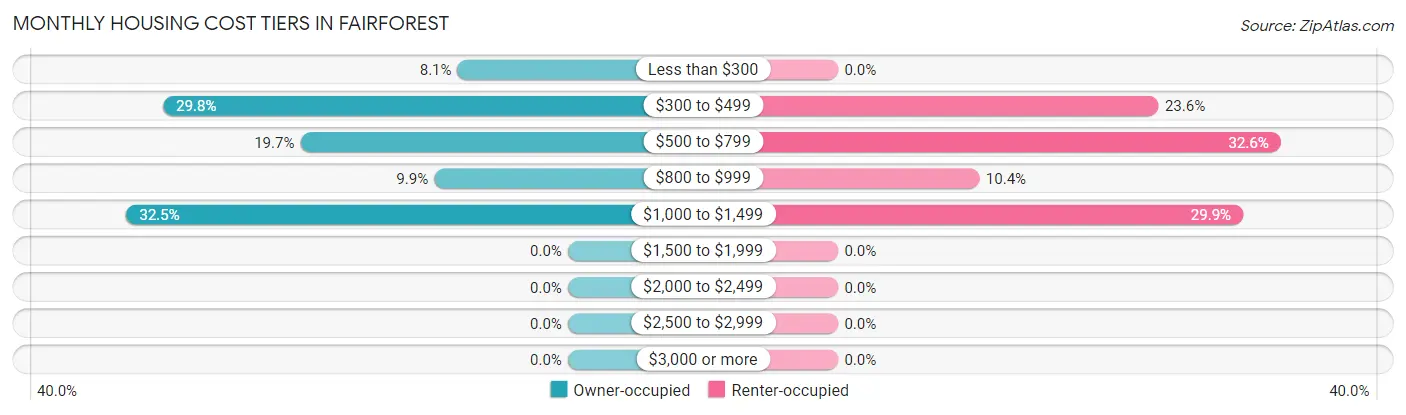
| Monthly Cost | Owner-occupied | Renter-occupied |
| Less than $300 | 33 (8.1%) | 0 (0.0%) |
| $300 to $499 | 121 (29.8%) | 34 (23.6%) |
| $500 to $799 | 80 (19.7%) | 47 (32.6%) |
| $800 to $999 | 40 (9.9%) | 15 (10.4%) |
| $1,000 to $1,499 | 132 (32.5%) | 43 (29.9%) |
| $1,500 to $1,999 | 0 (0.0%) | 0 (0.0%) |
| $2,000 to $2,499 | 0 (0.0%) | 0 (0.0%) |
| $2,500 to $2,999 | 0 (0.0%) | 0 (0.0%) |
| $3,000 or more | 0 (0.0%) | 0 (0.0%) |
| Total | 406 (100.0%) | 144 (100.0%) |
Physical Housing Characteristics in Fairforest
Housing Structures in Fairforest
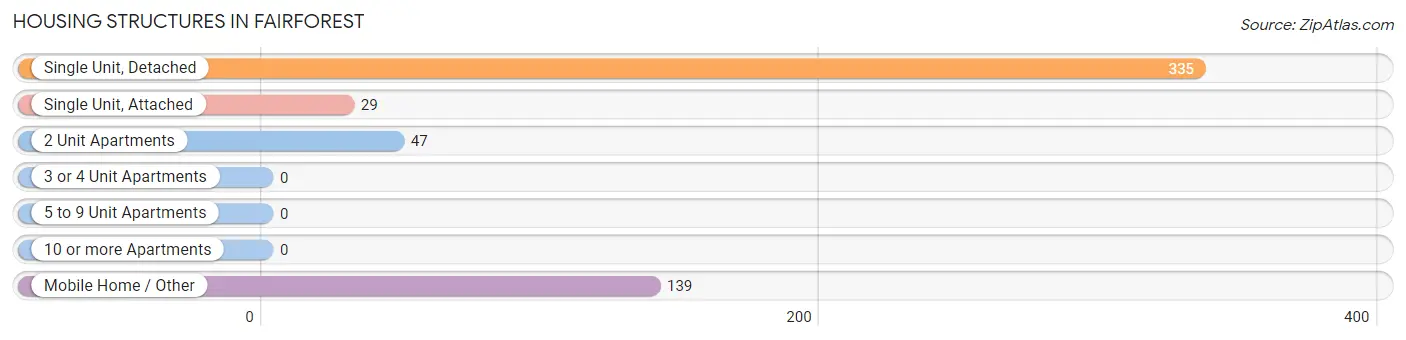
| Structure Type | # Housing Units | % Housing Units |
| Single Unit, Detached | 335 | 60.9% |
| Single Unit, Attached | 29 | 5.3% |
| 2 Unit Apartments | 47 | 8.6% |
| 3 or 4 Unit Apartments | 0 | 0.0% |
| 5 to 9 Unit Apartments | 0 | 0.0% |
| 10 or more Apartments | 0 | 0.0% |
| Mobile Home / Other | 139 | 25.3% |
| Total | 550 | 100.0% |
Housing Structures by Occupancy in Fairforest
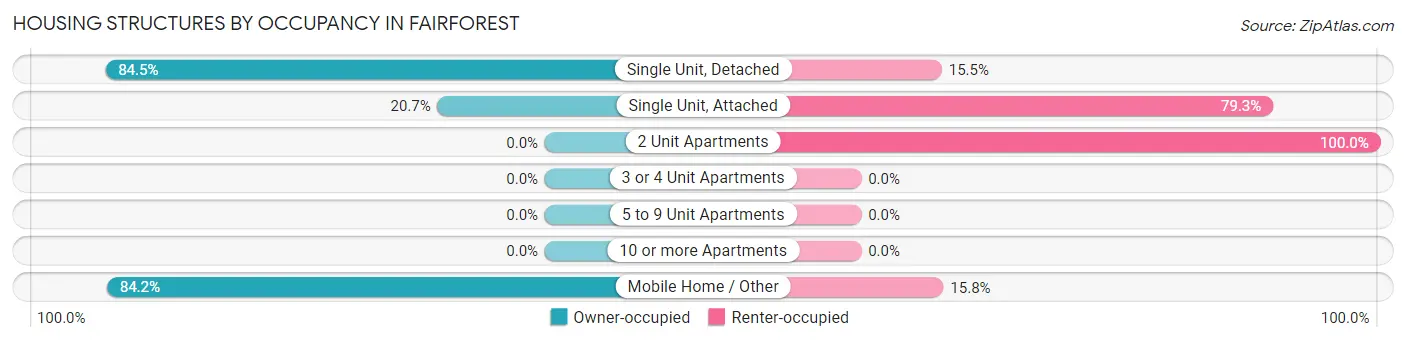
| Structure Type | Owner-occupied | Renter-occupied |
| Single Unit, Detached | 283 (84.5%) | 52 (15.5%) |
| Single Unit, Attached | 6 (20.7%) | 23 (79.3%) |
| 2 Unit Apartments | 0 (0.0%) | 47 (100.0%) |
| 3 or 4 Unit Apartments | 0 (0.0%) | 0 (0.0%) |
| 5 to 9 Unit Apartments | 0 (0.0%) | 0 (0.0%) |
| 10 or more Apartments | 0 (0.0%) | 0 (0.0%) |
| Mobile Home / Other | 117 (84.2%) | 22 (15.8%) |
| Total | 406 (73.8%) | 144 (26.2%) |
Housing Structures by Number of Rooms in Fairforest
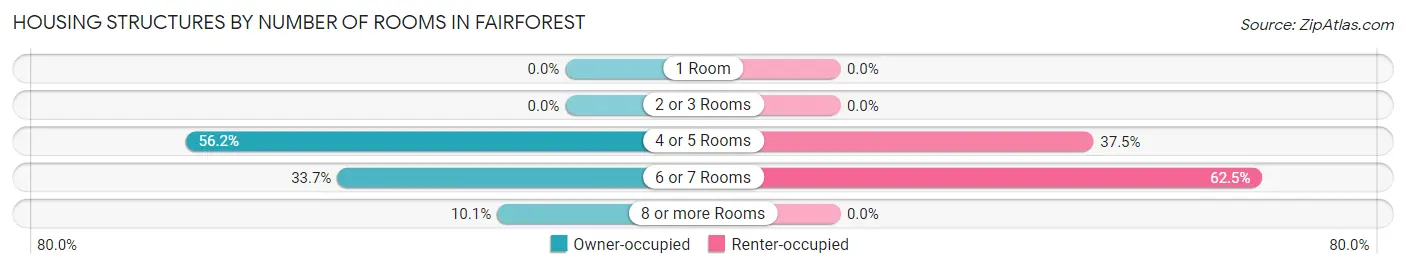
| Number of Rooms | Owner-occupied | Renter-occupied |
| 1 Room | 0 (0.0%) | 0 (0.0%) |
| 2 or 3 Rooms | 0 (0.0%) | 0 (0.0%) |
| 4 or 5 Rooms | 228 (56.2%) | 54 (37.5%) |
| 6 or 7 Rooms | 137 (33.7%) | 90 (62.5%) |
| 8 or more Rooms | 41 (10.1%) | 0 (0.0%) |
| Total | 406 (100.0%) | 144 (100.0%) |
Housing Structure by Heating Type in Fairforest
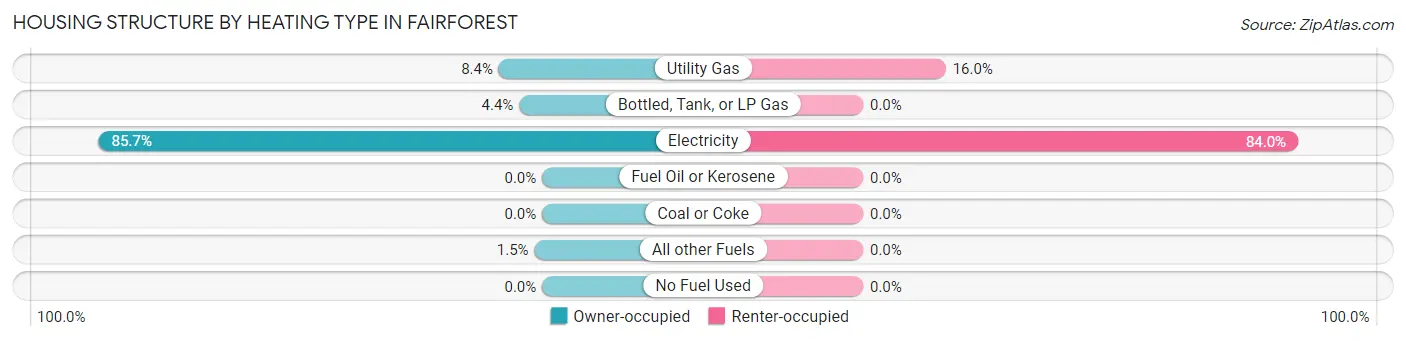
| Heating Type | Owner-occupied | Renter-occupied |
| Utility Gas | 34 (8.4%) | 23 (16.0%) |
| Bottled, Tank, or LP Gas | 18 (4.4%) | 0 (0.0%) |
| Electricity | 348 (85.7%) | 121 (84.0%) |
| Fuel Oil or Kerosene | 0 (0.0%) | 0 (0.0%) |
| Coal or Coke | 0 (0.0%) | 0 (0.0%) |
| All other Fuels | 6 (1.5%) | 0 (0.0%) |
| No Fuel Used | 0 (0.0%) | 0 (0.0%) |
| Total | 406 (100.0%) | 144 (100.0%) |
Household Vehicle Usage in Fairforest
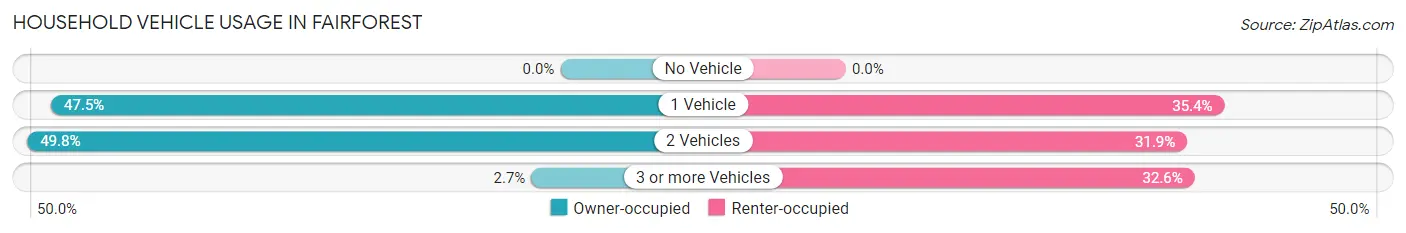
| Vehicles per Household | Owner-occupied | Renter-occupied |
| No Vehicle | 0 (0.0%) | 0 (0.0%) |
| 1 Vehicle | 193 (47.5%) | 51 (35.4%) |
| 2 Vehicles | 202 (49.7%) | 46 (31.9%) |
| 3 or more Vehicles | 11 (2.7%) | 47 (32.6%) |
| Total | 406 (100.0%) | 144 (100.0%) |
Real Estate & Mortgages in Fairforest
Real Estate and Mortgage Overview in Fairforest
| Characteristic | Without Mortgage | With Mortgage |
| Housing Units | 164 | 242 |
| Median Property Value | $212,400 | $95,800 |
| Median Household Income | $28,785 | $0 |
| Monthly Housing Costs | $366 | $0 |
| Real Estate Taxes | $458 | $0 |
Property Value by Mortgage Status in Fairforest
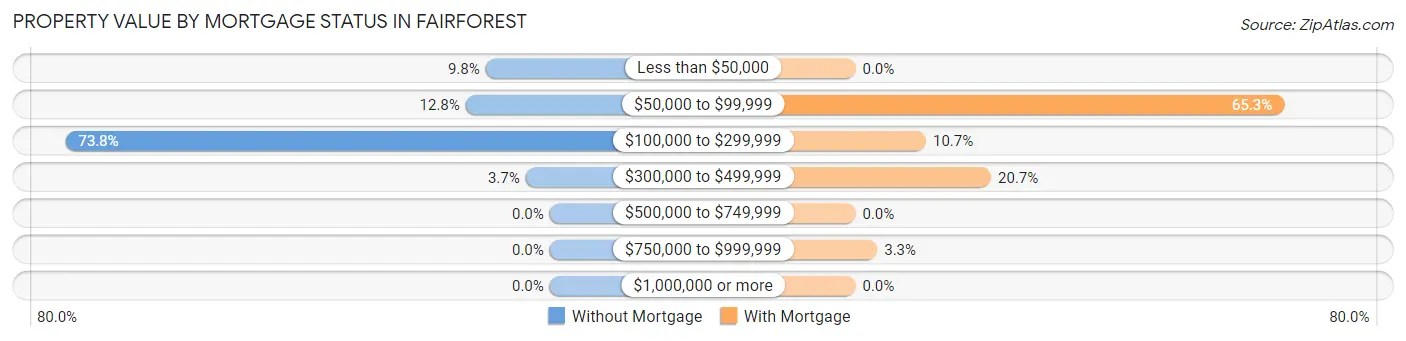
| Property Value | Without Mortgage | With Mortgage |
| Less than $50,000 | 16 (9.8%) | 0 (0.0%) |
| $50,000 to $99,999 | 21 (12.8%) | 158 (65.3%) |
| $100,000 to $299,999 | 121 (73.8%) | 26 (10.7%) |
| $300,000 to $499,999 | 6 (3.7%) | 50 (20.7%) |
| $500,000 to $749,999 | 0 (0.0%) | 0 (0.0%) |
| $750,000 to $999,999 | 0 (0.0%) | 8 (3.3%) |
| $1,000,000 or more | 0 (0.0%) | 0 (0.0%) |
| Total | 164 (100.0%) | 242 (100.0%) |
Household Income by Mortgage Status in Fairforest
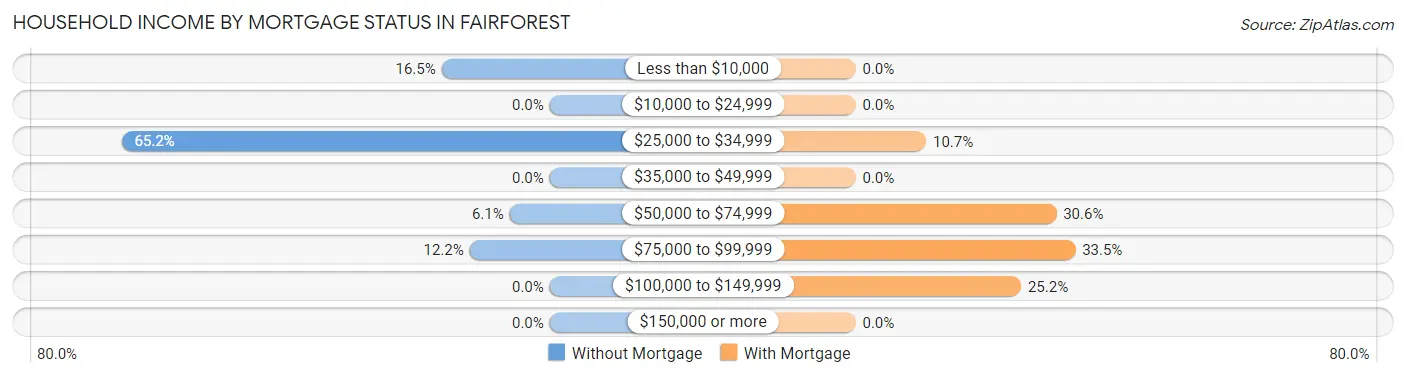
| Household Income | Without Mortgage | With Mortgage |
| Less than $10,000 | 27 (16.5%) | 0 (0.0%) |
| $10,000 to $24,999 | 0 (0.0%) | 0 (0.0%) |
| $25,000 to $34,999 | 107 (65.2%) | 26 (10.7%) |
| $35,000 to $49,999 | 0 (0.0%) | 0 (0.0%) |
| $50,000 to $74,999 | 10 (6.1%) | 74 (30.6%) |
| $75,000 to $99,999 | 20 (12.2%) | 81 (33.5%) |
| $100,000 to $149,999 | 0 (0.0%) | 61 (25.2%) |
| $150,000 or more | 0 (0.0%) | 0 (0.0%) |
| Total | 164 (100.0%) | 242 (100.0%) |
Property Value to Household Income Ratio in Fairforest
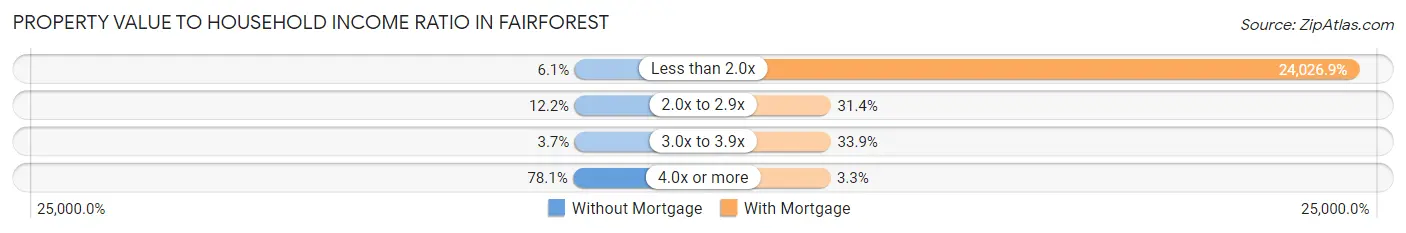
| Value-to-Income Ratio | Without Mortgage | With Mortgage |
| Less than 2.0x | 10 (6.1%) | 58,145 (24,026.9%) |
| 2.0x to 2.9x | 20 (12.2%) | 76 (31.4%) |
| 3.0x to 3.9x | 6 (3.7%) | 82 (33.9%) |
| 4.0x or more | 128 (78.0%) | 8 (3.3%) |
| Total | 164 (100.0%) | 242 (100.0%) |
Real Estate Taxes by Mortgage Status in Fairforest
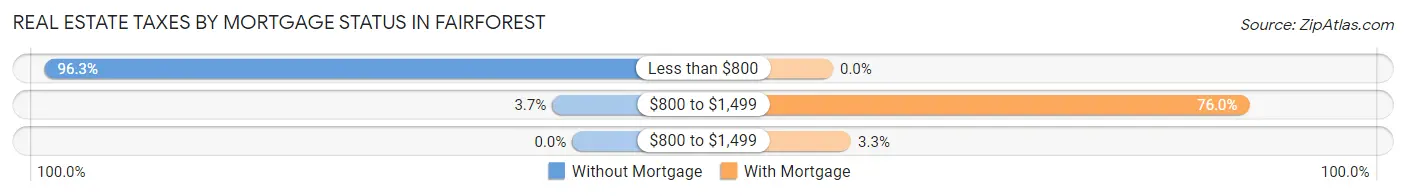
| Property Taxes | Without Mortgage | With Mortgage |
| Less than $800 | 158 (96.3%) | 0 (0.0%) |
| $800 to $1,499 | 6 (3.7%) | 184 (76.0%) |
| $800 to $1,499 | 0 (0.0%) | 8 (3.3%) |
| Total | 164 (100.0%) | 242 (100.0%) |
Health & Disability in Fairforest
Health Insurance Coverage by Age in Fairforest
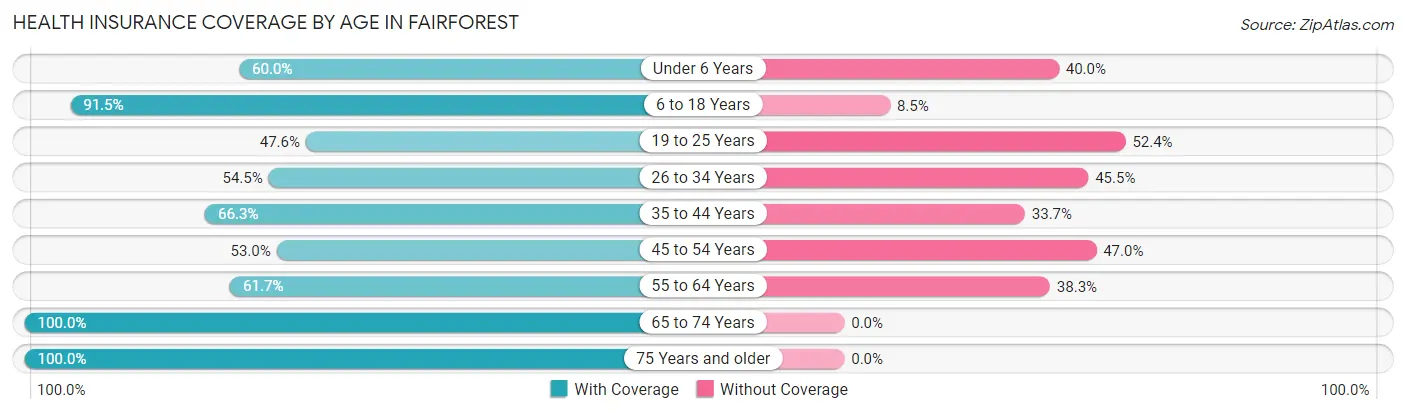
| Age Bracket | With Coverage | Without Coverage |
| Under 6 Years | 21 (60.0%) | 14 (40.0%) |
| 6 to 18 Years | 161 (91.5%) | 15 (8.5%) |
| 19 to 25 Years | 49 (47.6%) | 54 (52.4%) |
| 26 to 34 Years | 127 (54.5%) | 106 (45.5%) |
| 35 to 44 Years | 199 (66.3%) | 101 (33.7%) |
| 45 to 54 Years | 193 (53.0%) | 171 (47.0%) |
| 55 to 64 Years | 156 (61.7%) | 97 (38.3%) |
| 65 to 74 Years | 131 (100.0%) | 0 (0.0%) |
| 75 Years and older | 27 (100.0%) | 0 (0.0%) |
| Total | 1,064 (65.6%) | 558 (34.4%) |
Health Insurance Coverage by Citizenship Status in Fairforest
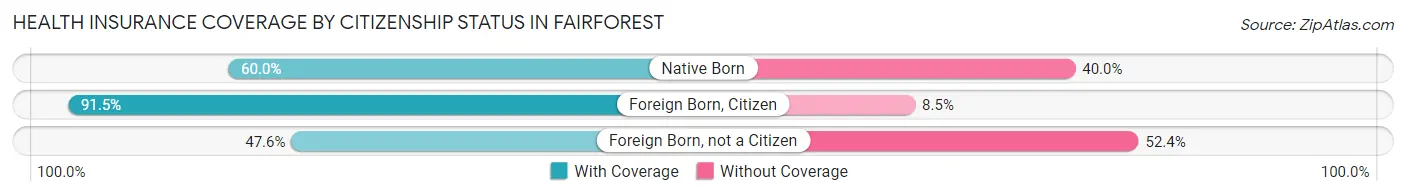
| Citizenship Status | With Coverage | Without Coverage |
| Native Born | 21 (60.0%) | 14 (40.0%) |
| Foreign Born, Citizen | 161 (91.5%) | 15 (8.5%) |
| Foreign Born, not a Citizen | 49 (47.6%) | 54 (52.4%) |
Health Insurance Coverage by Household Income in Fairforest
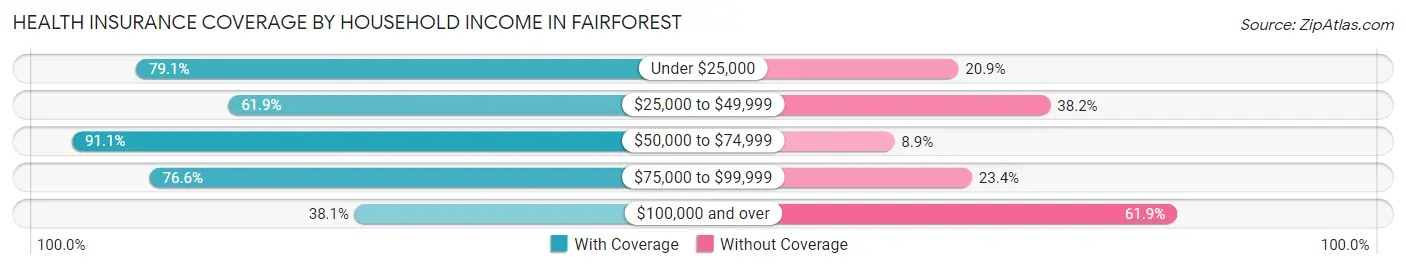
| Household Income | With Coverage | Without Coverage |
| Under $25,000 | 53 (79.1%) | 14 (20.9%) |
| $25,000 to $49,999 | 449 (61.9%) | 277 (38.2%) |
| $50,000 to $74,999 | 296 (91.1%) | 29 (8.9%) |
| $75,000 to $99,999 | 147 (76.6%) | 45 (23.4%) |
| $100,000 and over | 119 (38.1%) | 193 (61.9%) |
Public vs Private Health Insurance Coverage by Age in Fairforest
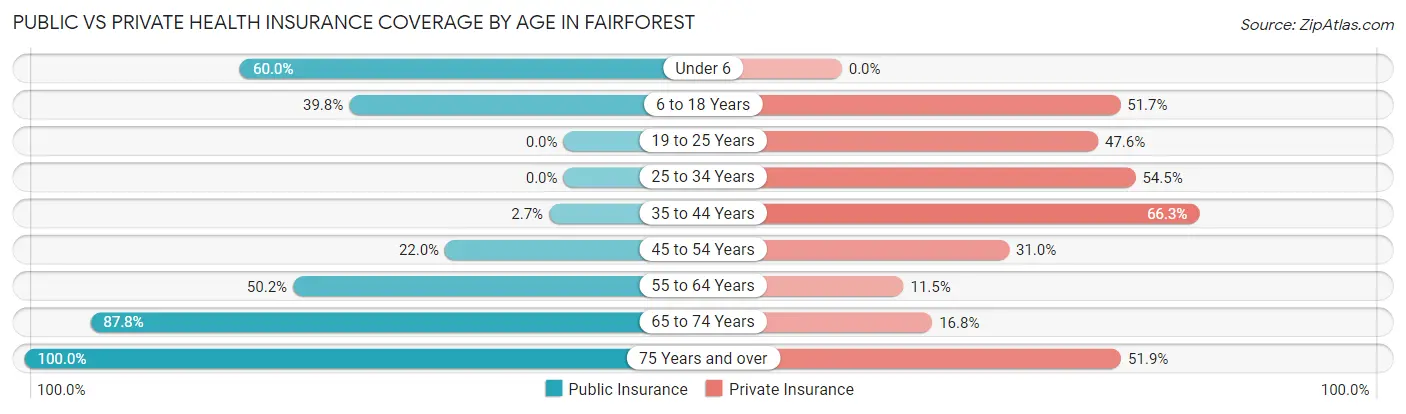
| Age Bracket | Public Insurance | Private Insurance |
| Under 6 | 21 (60.0%) | 0 (0.0%) |
| 6 to 18 Years | 70 (39.8%) | 91 (51.7%) |
| 19 to 25 Years | 0 (0.0%) | 49 (47.6%) |
| 25 to 34 Years | 0 (0.0%) | 127 (54.5%) |
| 35 to 44 Years | 8 (2.7%) | 199 (66.3%) |
| 45 to 54 Years | 80 (22.0%) | 113 (31.0%) |
| 55 to 64 Years | 127 (50.2%) | 29 (11.5%) |
| 65 to 74 Years | 115 (87.8%) | 22 (16.8%) |
| 75 Years and over | 27 (100.0%) | 14 (51.8%) |
| Total | 448 (27.6%) | 644 (39.7%) |
Disability Status by Sex by Age in Fairforest
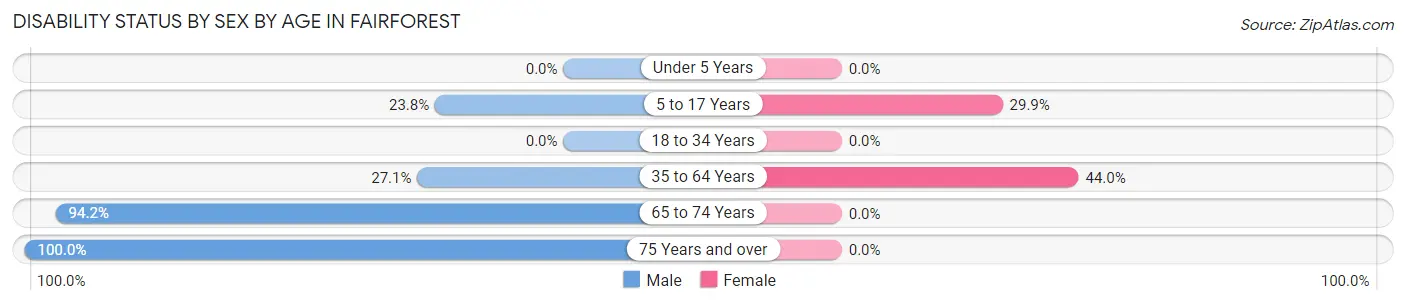
| Age Bracket | Male | Female |
| Under 5 Years | 0 (0.0%) | 0 (0.0%) |
| 5 to 17 Years | 10 (23.8%) | 40 (29.8%) |
| 18 to 34 Years | 0 (0.0%) | 0 (0.0%) |
| 35 to 64 Years | 103 (27.1%) | 236 (44.0%) |
| 65 to 74 Years | 98 (94.2%) | 0 (0.0%) |
| 75 Years and over | 13 (100.0%) | 0 (0.0%) |
Disability Class by Sex by Age in Fairforest
Disability Class: Hearing Difficulty
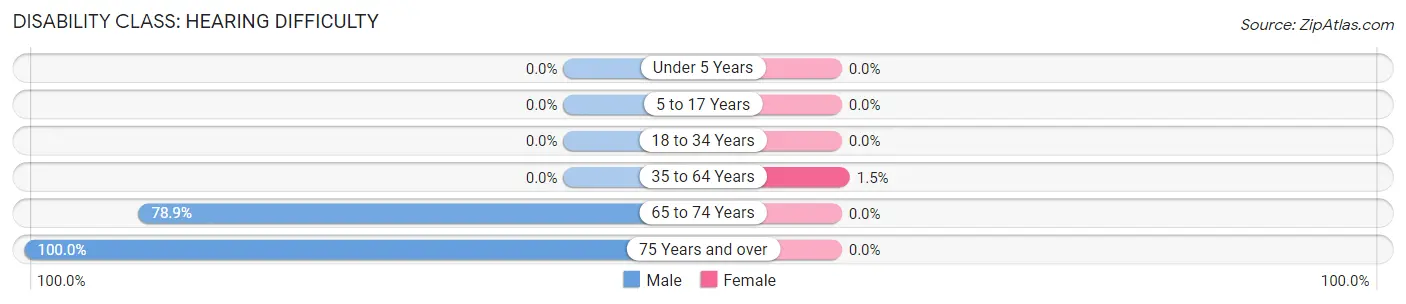
| Age Bracket | Male | Female |
| Under 5 Years | 0 (0.0%) | 0 (0.0%) |
| 5 to 17 Years | 0 (0.0%) | 0 (0.0%) |
| 18 to 34 Years | 0 (0.0%) | 0 (0.0%) |
| 35 to 64 Years | 0 (0.0%) | 8 (1.5%) |
| 65 to 74 Years | 82 (78.8%) | 0 (0.0%) |
| 75 Years and over | 13 (100.0%) | 0 (0.0%) |
Disability Class: Vision Difficulty
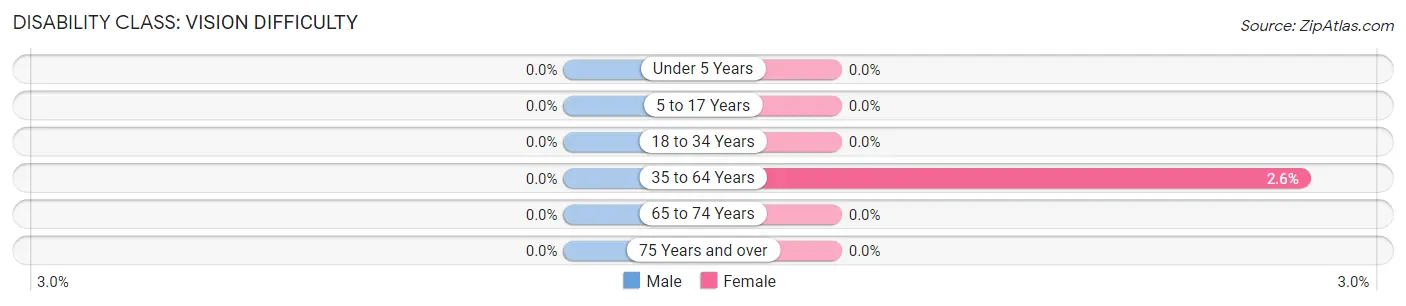
| Age Bracket | Male | Female |
| Under 5 Years | 0 (0.0%) | 0 (0.0%) |
| 5 to 17 Years | 0 (0.0%) | 0 (0.0%) |
| 18 to 34 Years | 0 (0.0%) | 0 (0.0%) |
| 35 to 64 Years | 0 (0.0%) | 14 (2.6%) |
| 65 to 74 Years | 0 (0.0%) | 0 (0.0%) |
| 75 Years and over | 0 (0.0%) | 0 (0.0%) |
Disability Class: Cognitive Difficulty
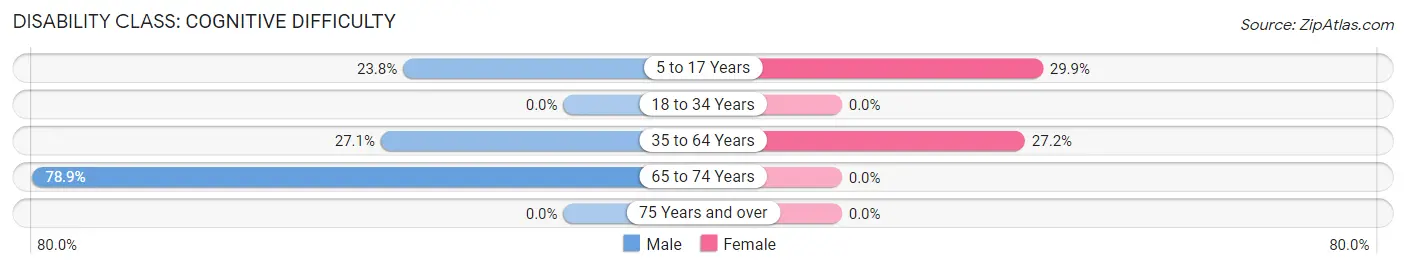
| Age Bracket | Male | Female |
| 5 to 17 Years | 10 (23.8%) | 40 (29.8%) |
| 18 to 34 Years | 0 (0.0%) | 0 (0.0%) |
| 35 to 64 Years | 103 (27.1%) | 146 (27.2%) |
| 65 to 74 Years | 82 (78.8%) | 0 (0.0%) |
| 75 Years and over | 0 (0.0%) | 0 (0.0%) |
Disability Class: Ambulatory Difficulty
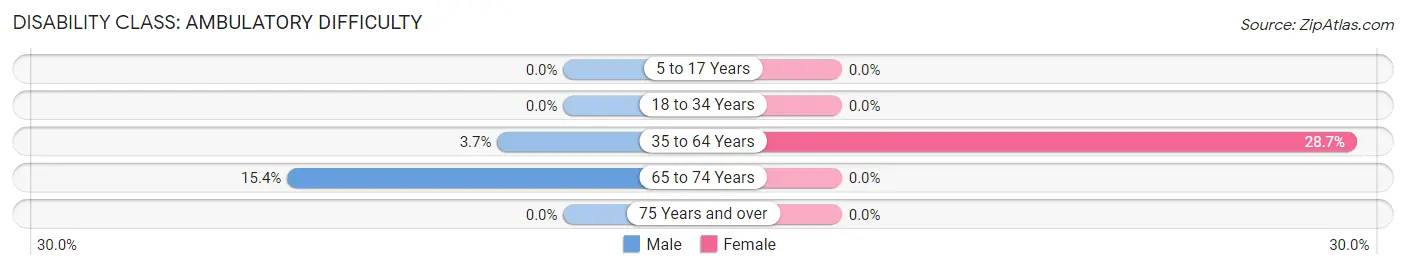
| Age Bracket | Male | Female |
| 5 to 17 Years | 0 (0.0%) | 0 (0.0%) |
| 18 to 34 Years | 0 (0.0%) | 0 (0.0%) |
| 35 to 64 Years | 14 (3.7%) | 154 (28.7%) |
| 65 to 74 Years | 16 (15.4%) | 0 (0.0%) |
| 75 Years and over | 0 (0.0%) | 0 (0.0%) |
Disability Class: Self-Care Difficulty
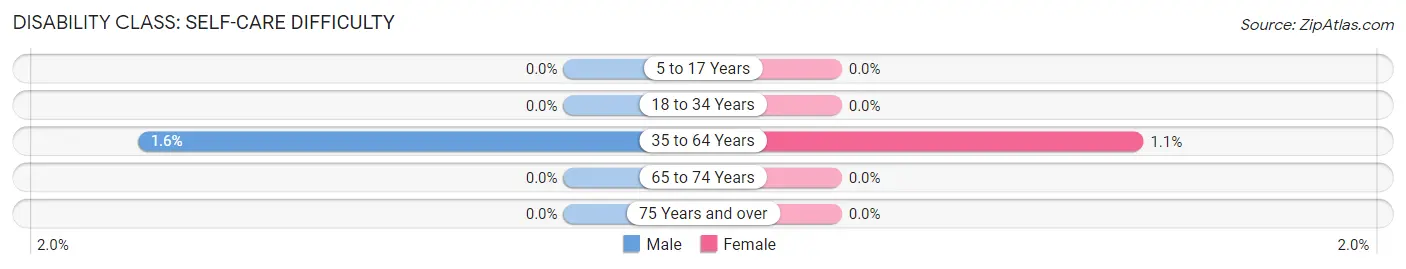
| Age Bracket | Male | Female |
| 5 to 17 Years | 0 (0.0%) | 0 (0.0%) |
| 18 to 34 Years | 0 (0.0%) | 0 (0.0%) |
| 35 to 64 Years | 6 (1.6%) | 6 (1.1%) |
| 65 to 74 Years | 0 (0.0%) | 0 (0.0%) |
| 75 Years and over | 0 (0.0%) | 0 (0.0%) |
Technology Access in Fairforest
Computing Device Access in Fairforest
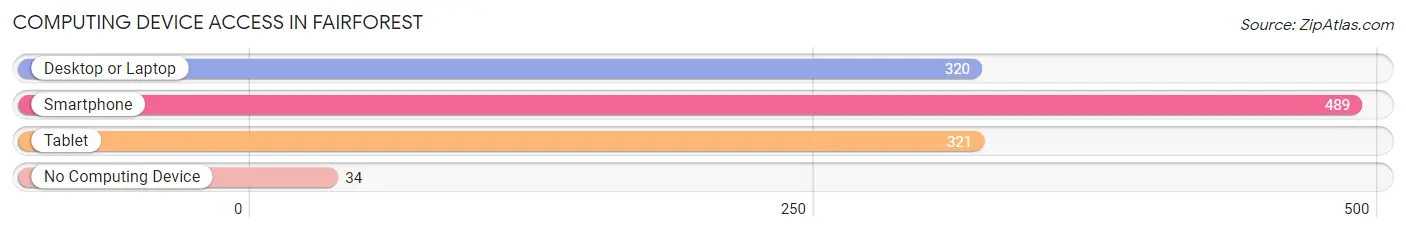
| Device Type | # Households | % Households |
| Desktop or Laptop | 320 | 58.2% |
| Smartphone | 489 | 88.9% |
| Tablet | 321 | 58.4% |
| No Computing Device | 34 | 6.2% |
| Total | 550 | 100.0% |
Internet Access in Fairforest
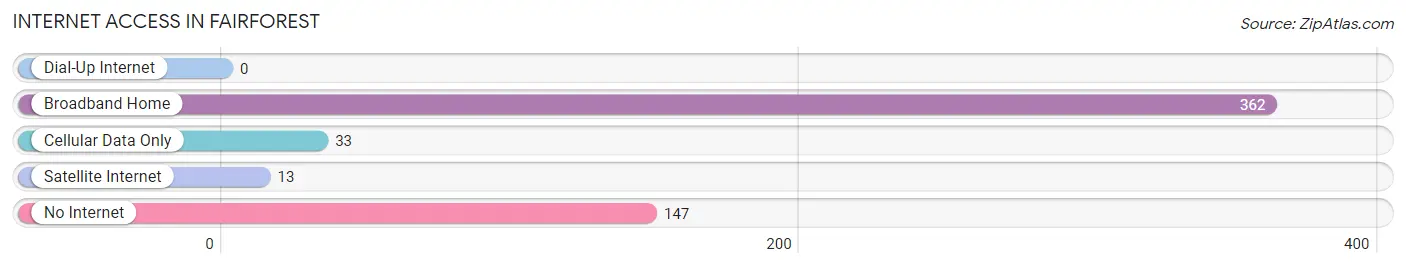
| Internet Type | # Households | % Households |
| Dial-Up Internet | 0 | 0.0% |
| Broadband Home | 362 | 65.8% |
| Cellular Data Only | 33 | 6.0% |
| Satellite Internet | 13 | 2.4% |
| No Internet | 147 | 26.7% |
| Total | 550 | 100.0% |
Fairforest Summary
Forests are a vital part of the environment, providing a habitat for wildlife, regulating the climate, and providing resources for humans. The town of Fairforest, South Carolina is located in the foothills of the Blue Ridge Mountains and is surrounded by a lush forest. This forest has been a part of the town’s history since its founding in 1790.
Geography
Fairforest is located in Spartanburg County, South Carolina, in the foothills of the Blue Ridge Mountains. The town is situated on the banks of the Pacolet River, which flows through the town and provides a source of recreation for the residents. The town is surrounded by a lush forest, which provides a habitat for a variety of wildlife. The town is located at an elevation of 1,000 feet and has a total area of 4.2 square miles.
Economy
The economy of Fairforest is largely based on the timber industry. The town is home to several sawmills and lumber companies, which provide employment for many of the town’s residents. The town is also home to several small businesses, including restaurants, retail stores, and service providers. The town is also home to a number of farms, which provide fresh produce to the local community.
Demographics
As of the 2010 census, the population of Fairforest was 1,845. The population is predominantly white, with African Americans making up the second largest racial group. The median household income in the town is $37,000, and the median age is 38. The town has a high rate of homeownership, with nearly 80% of the population owning their own homes.
Conclusion
Fairforest, South Carolina is a small town located in the foothills of the Blue Ridge Mountains. The town is surrounded by a lush forest, which provides a habitat for a variety of wildlife. The economy of the town is largely based on the timber industry, and the town is home to several small businesses. The population of the town is predominantly white, with African Americans making up the second largest racial group. The town has a high rate of homeownership, and the median household income is $37,000.
Common Questions
What is Per Capita Income in Fairforest?
Per Capita income in Fairforest is $24,990.
What is the Median Family Income in Fairforest?
Median Family Income in Fairforest is $48,250.
What is the Median Household income in Fairforest?
Median Household Income in Fairforest is $49,650.
What is Income or Wage Gap in Fairforest?
Income or Wage Gap in Fairforest is 55.7%.
Women in Fairforest earn 44.3 cents for every dollar earned by a man.
What is Inequality or Gini Index in Fairforest?
Inequality or Gini Index in Fairforest is 0.33.
What is the Total Population of Fairforest?
Total Population of Fairforest is 1,626.
What is the Total Male Population of Fairforest?
Total Male Population of Fairforest is 775.
What is the Total Female Population of Fairforest?
Total Female Population of Fairforest is 851.
What is the Ratio of Males per 100 Females in Fairforest?
There are 91.07 Males per 100 Females in Fairforest.
What is the Ratio of Females per 100 Males in Fairforest?
There are 109.81 Females per 100 Males in Fairforest.
What is the Median Population Age in Fairforest?
Median Population Age in Fairforest is 43.4 Years.
What is the Average Family Size in Fairforest
Average Family Size in Fairforest is 2.4 People.
What is the Average Household Size in Fairforest
Average Household Size in Fairforest is 3.0 People.
How Large is the Labor Force in Fairforest?
There are 806 People in the Labor Forcein in Fairforest.
What is the Percentage of People in the Labor Force in Fairforest?
54.2% of People are in the Labor Force in Fairforest.
What is the Unemployment Rate in Fairforest?
Unemployment Rate in Fairforest is 8.3%.