Boykin, SC Map & Demographics
Boykin Map
Boykin Overview
$46,057
PER CAPITA INCOME
$128,580
AVG HOUSEHOLD INCOME
0.15
INEQUALITY / GINI INDEX
109
TOTAL POPULATION
42
MALE POPULATION
67
FEMALE POPULATION
62.69
MALES / 100 FEMALES
159.52
FEMALES / 100 MALES
66.7
MEDIAN AGE
3.3
AVG FAMILY SIZE
2.8
AVG HOUSEHOLD SIZE
102
LABOR FORCE [ PEOPLE ]
93.6%
PERCENT IN LABOR FORCE
Income in Boykin
Income Overview in Boykin
| Characteristic | Number | Measure |
| Per Capita Income | 109 | $46,057 |
| Median Family Income | 29 | $0 |
| Mean Family Income | 29 | $0 |
| Median Household Income | 39 | $128,580 |
| Mean Household Income | 39 | $116,523 |
| Income Deficit | 29 | $0 |
| Wage / Income Gap (%) | 109 | 0.00% |
| Wage / Income Gap ($) | 109 | 100.00¢ per $1 |
| Gini / Inequality Index | 109 | 0.15 |
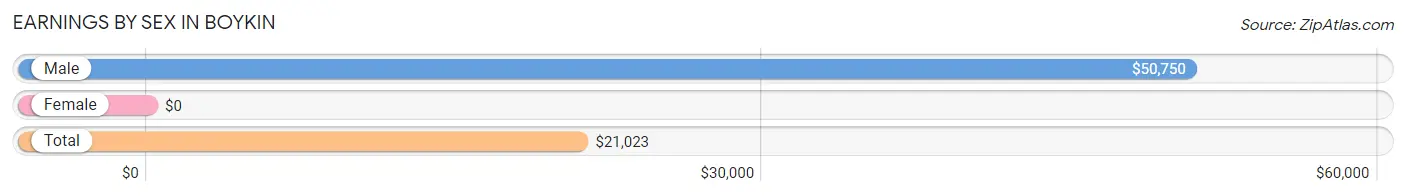
Earnings by Sex in Boykin
| Sex | Number | Average Earnings |
| Male | 35 (34.3%) | $50,750 |
| Female | 67 (65.7%) | $0 |
| Total | 102 (100.0%) | $21,023 |
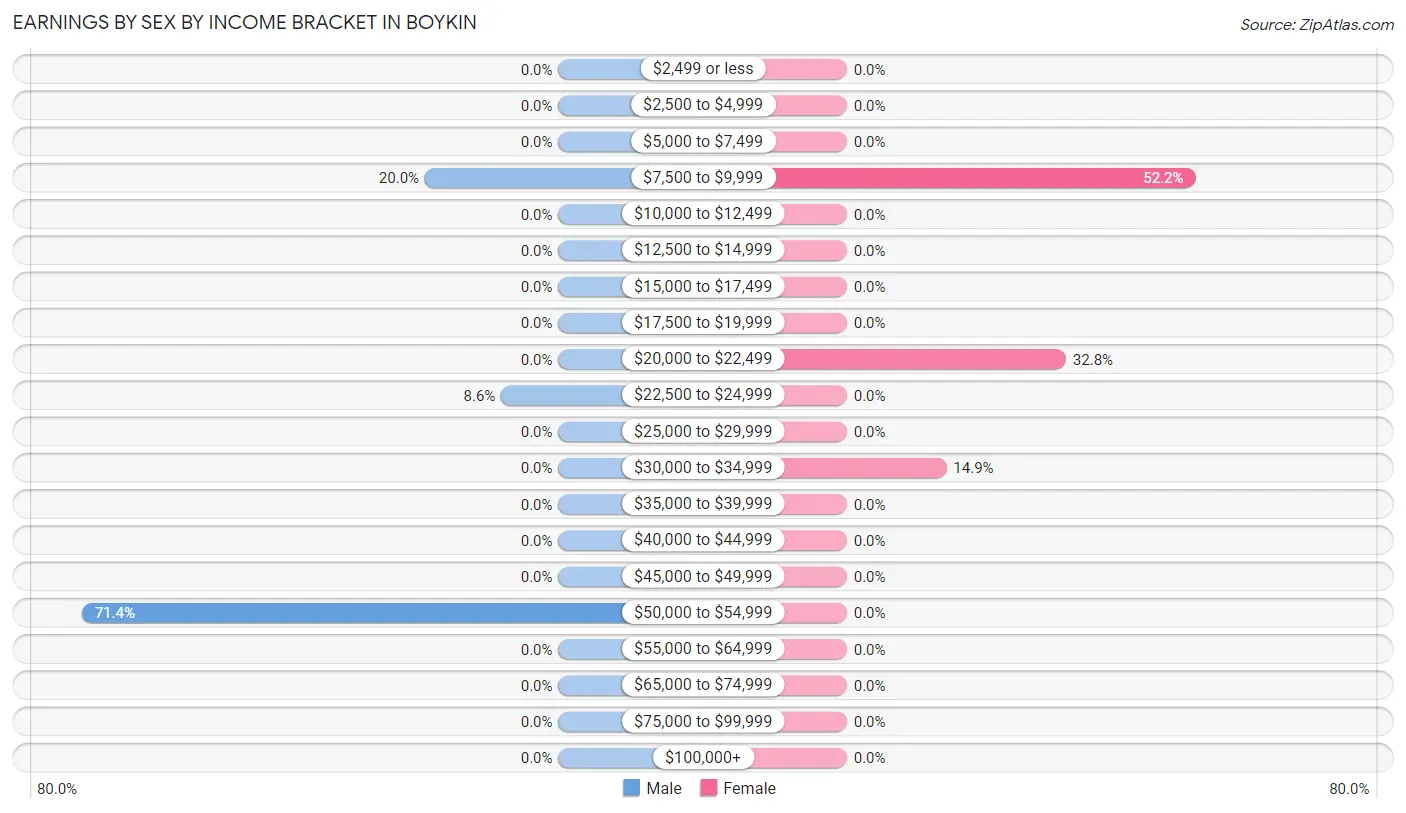
Earnings by Sex by Income Bracket in Boykin
The most common earnings brackets in Boykin are $50,000 to $54,999 for men (25 | 71.4%) and $7,500 to $9,999 for women (35 | 52.2%).
| Income | Male | Female |
| $2,499 or less | 0 (0.0%) | 0 (0.0%) |
| $2,500 to $4,999 | 0 (0.0%) | 0 (0.0%) |
| $5,000 to $7,499 | 0 (0.0%) | 0 (0.0%) |
| $7,500 to $9,999 | 7 (20.0%) | 35 (52.2%) |
| $10,000 to $12,499 | 0 (0.0%) | 0 (0.0%) |
| $12,500 to $14,999 | 0 (0.0%) | 0 (0.0%) |
| $15,000 to $17,499 | 0 (0.0%) | 0 (0.0%) |
| $17,500 to $19,999 | 0 (0.0%) | 0 (0.0%) |
| $20,000 to $22,499 | 0 (0.0%) | 22 (32.8%) |
| $22,500 to $24,999 | 3 (8.6%) | 0 (0.0%) |
| $25,000 to $29,999 | 0 (0.0%) | 0 (0.0%) |
| $30,000 to $34,999 | 0 (0.0%) | 10 (14.9%) |
| $35,000 to $39,999 | 0 (0.0%) | 0 (0.0%) |
| $40,000 to $44,999 | 0 (0.0%) | 0 (0.0%) |
| $45,000 to $49,999 | 0 (0.0%) | 0 (0.0%) |
| $50,000 to $54,999 | 25 (71.4%) | 0 (0.0%) |
| $55,000 to $64,999 | 0 (0.0%) | 0 (0.0%) |
| $65,000 to $74,999 | 0 (0.0%) | 0 (0.0%) |
| $75,000 to $99,999 | 0 (0.0%) | 0 (0.0%) |
| $100,000+ | 0 (0.0%) | 0 (0.0%) |
| Total | 35 (100.0%) | 67 (100.0%) |
Earnings by Sex by Educational Attainment in Boykin
| Educational Attainment | Male Income | Female Income |
| Less than High School | - | - |
| High School Diploma | - | - |
| College or Associate's Degree | - | - |
| Bachelor's Degree | - | - |
| Graduate Degree | - | - |
| Total | $50,750 | $0 |
Family Income in Boykin
Family Income Brackets in Boykin
According to the Boykin family income data, there are 22 families falling into the $100,000 to $149,999 income range, which is the most common income bracket and makes up 75.9% of all families.
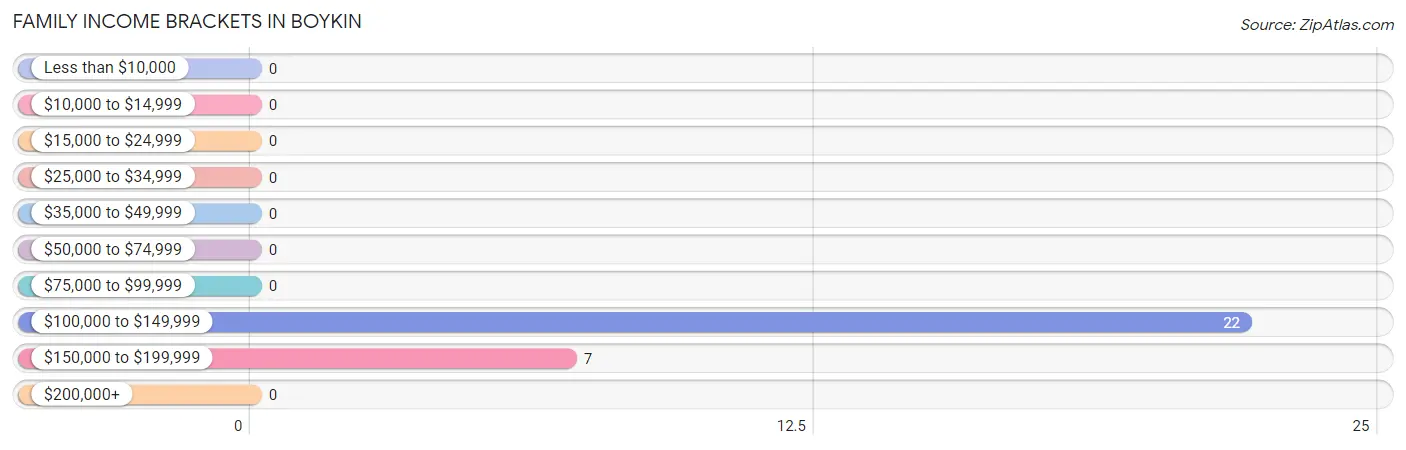
| Income Bracket | # Families | % Families |
| Less than $10,000 | 0 | 0.0% |
| $10,000 to $14,999 | 0 | 0.0% |
| $15,000 to $24,999 | 0 | 0.0% |
| $25,000 to $34,999 | 0 | 0.0% |
| $35,000 to $49,999 | 0 | 0.0% |
| $50,000 to $74,999 | 0 | 0.0% |
| $75,000 to $99,999 | 0 | 0.0% |
| $100,000 to $149,999 | 22 | 75.9% |
| $150,000 to $199,999 | 7 | 24.1% |
| $200,000+ | 0 | 0.0% |
Family Income by Famaliy Size in Boykin
| Income Bracket | # Families | Median Income |
| 2-Person Families | 7 (24.1%) | $0 |
| 3-Person Families | 22 (75.9%) | $0 |
| 4-Person Families | 0 (0.0%) | $0 |
| 5-Person Families | 0 (0.0%) | $0 |
| 6-Person Families | 0 (0.0%) | $0 |
| 7+ Person Families | 0 (0.0%) | $0 |
| Total | 29 (100.0%) | $0 |
Family Income by Number of Earners in Boykin
| Number of Earners | # Families | Median Income |
| No Earners | 0 (0.0%) | $0 |
| 1 Earner | 0 (0.0%) | $0 |
| 2 Earners | 7 (24.1%) | $0 |
| 3+ Earners | 22 (75.9%) | $0 |
| Total | 29 (100.0%) | $0 |
Household Income in Boykin
Household Income Brackets in Boykin
With 22 households falling in the category, the $100,000 to $149,999 income range is the most frequent in Boykin, accounting for 56.4% of all households.
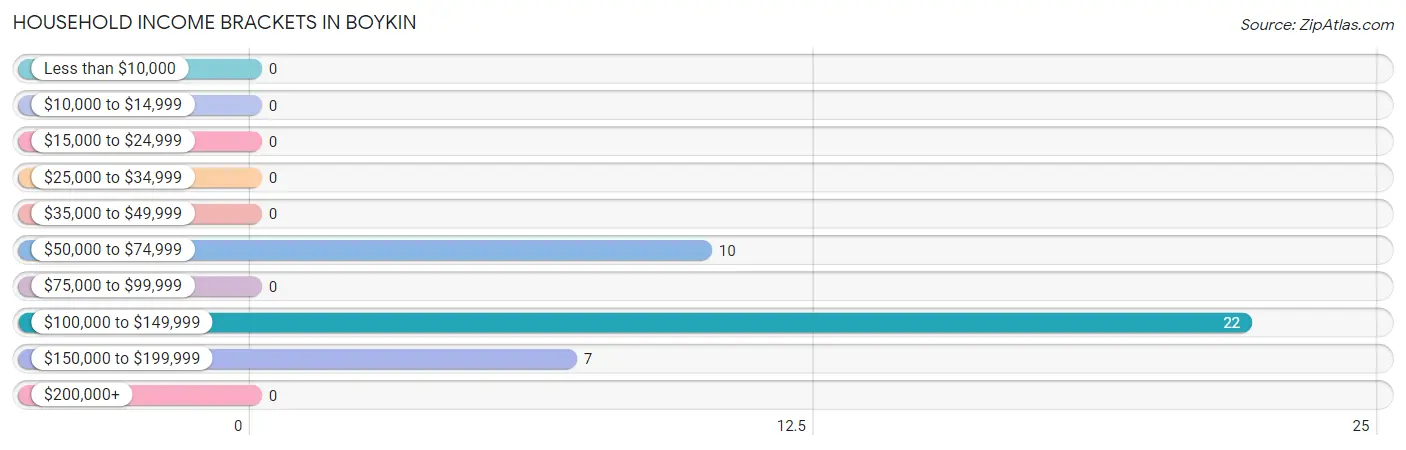
| Income Bracket | # Households | % Households |
| Less than $10,000 | 0 | 0.0% |
| $10,000 to $14,999 | 0 | 0.0% |
| $15,000 to $24,999 | 0 | 0.0% |
| $25,000 to $34,999 | 0 | 0.0% |
| $35,000 to $49,999 | 0 | 0.0% |
| $50,000 to $74,999 | 10 | 25.6% |
| $75,000 to $99,999 | 0 | 0.0% |
| $100,000 to $149,999 | 22 | 56.4% |
| $150,000 to $199,999 | 7 | 17.9% |
| $200,000+ | 0 | 0.0% |
Household Income by Householder Age in Boykin
The median household income in Boykin is $128,580, with the highest median household income of $128,750 found in the 65+ years age bracket for the primary householder. A total of 36 households (92.3%) fall into this category.
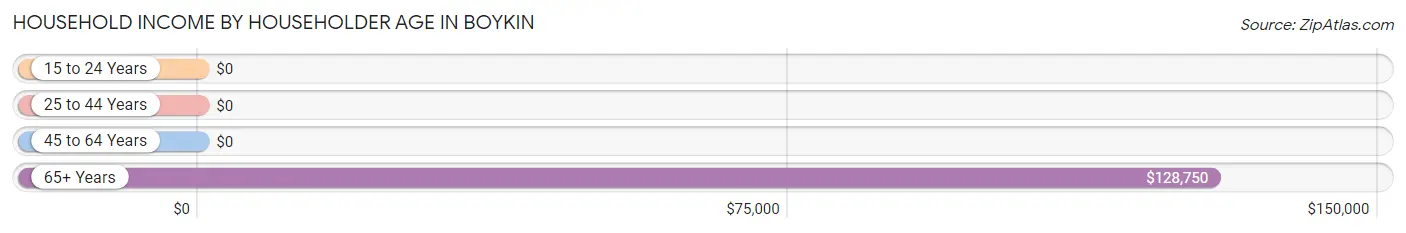
| Income Bracket | # Households | Median Income |
| 15 to 24 Years | 0 (0.0%) | $0 |
| 25 to 44 Years | 0 (0.0%) | $0 |
| 45 to 64 Years | 3 (7.7%) | $0 |
| 65+ Years | 36 (92.3%) | $128,750 |
| Total | 39 (100.0%) | $128,580 |
Poverty in Boykin
Income Below Poverty by Sex and Age in Boykin
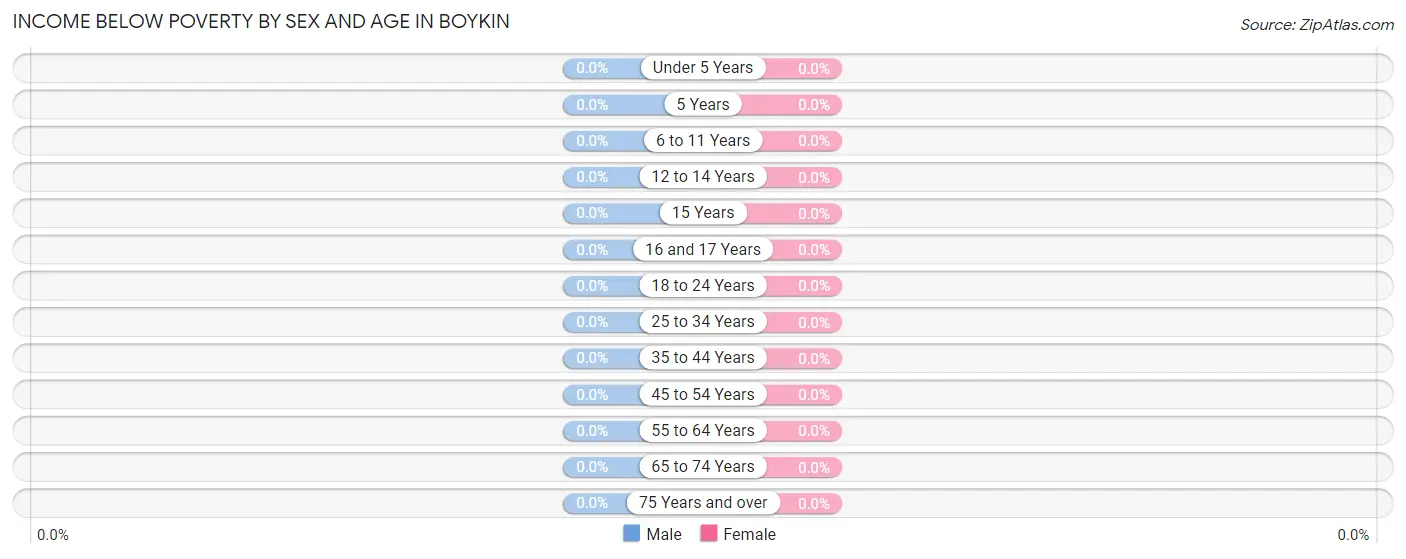
| Age Bracket | Male | Female |
| Under 5 Years | 0 (0.0%) | 0 (0.0%) |
| 5 Years | 0 (0.0%) | 0 (0.0%) |
| 6 to 11 Years | 0 (0.0%) | 0 (0.0%) |
| 12 to 14 Years | 0 (0.0%) | 0 (0.0%) |
| 15 Years | 0 (0.0%) | 0 (0.0%) |
| 16 and 17 Years | 0 (0.0%) | 0 (0.0%) |
| 18 to 24 Years | 0 (0.0%) | 0 (0.0%) |
| 25 to 34 Years | 0 (0.0%) | 0 (0.0%) |
| 35 to 44 Years | 0 (0.0%) | 0 (0.0%) |
| 45 to 54 Years | 0 (0.0%) | 0 (0.0%) |
| 55 to 64 Years | 0 (0.0%) | 0 (0.0%) |
| 65 to 74 Years | 0 (0.0%) | 0 (0.0%) |
| 75 Years and over | 0 (0.0%) | 0 (0.0%) |
| Total | 0 (0.0%) | 0 (0.0%) |
Income Above Poverty by Sex and Age in Boykin
According to the poverty statistics in Boykin, males aged 65 to 74 years and females aged 35 to 44 years are the age groups that are most secure financially, with 100.0% of males and 100.0% of females in these age groups living above the poverty line.
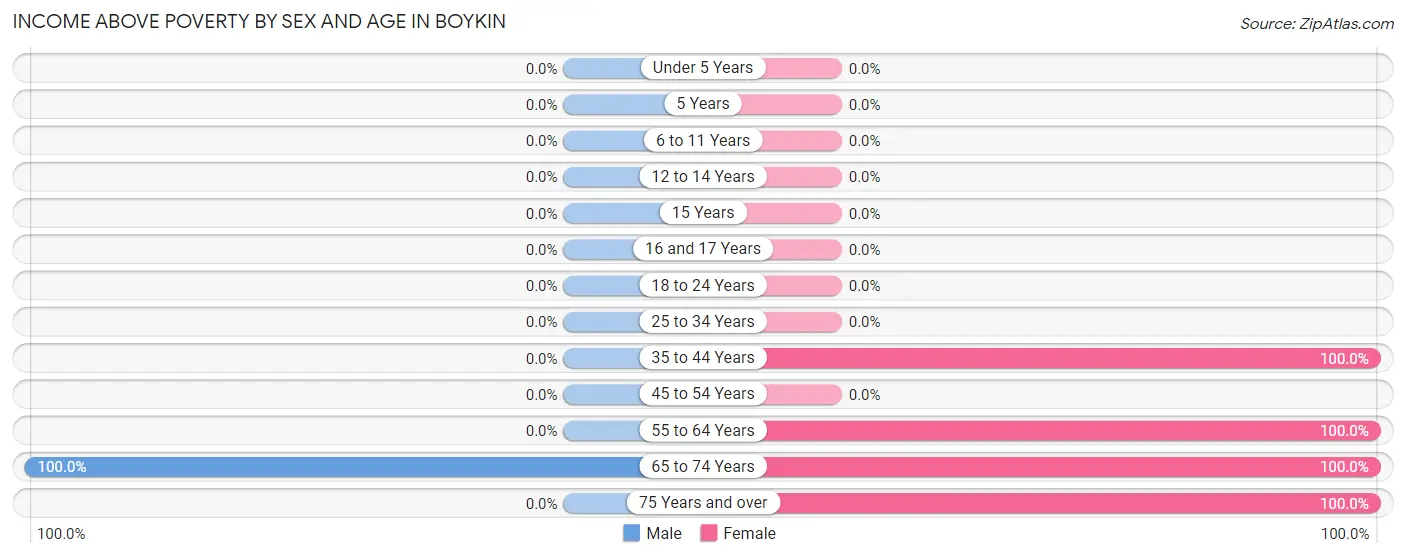
| Age Bracket | Male | Female |
| Under 5 Years | 0 (0.0%) | 0 (0.0%) |
| 5 Years | 0 (0.0%) | 0 (0.0%) |
| 6 to 11 Years | 0 (0.0%) | 0 (0.0%) |
| 12 to 14 Years | 0 (0.0%) | 0 (0.0%) |
| 15 Years | 0 (0.0%) | 0 (0.0%) |
| 16 and 17 Years | 0 (0.0%) | 0 (0.0%) |
| 18 to 24 Years | 0 (0.0%) | 0 (0.0%) |
| 25 to 34 Years | 0 (0.0%) | 0 (0.0%) |
| 35 to 44 Years | 0 (0.0%) | 35 (100.0%) |
| 45 to 54 Years | 0 (0.0%) | 0 (0.0%) |
| 55 to 64 Years | 0 (0.0%) | 3 (100.0%) |
| 65 to 74 Years | 42 (100.0%) | 22 (100.0%) |
| 75 Years and over | 0 (0.0%) | 7 (100.0%) |
| Total | 42 (100.0%) | 67 (100.0%) |
Income Below Poverty Among Married-Couple Families in Boykin
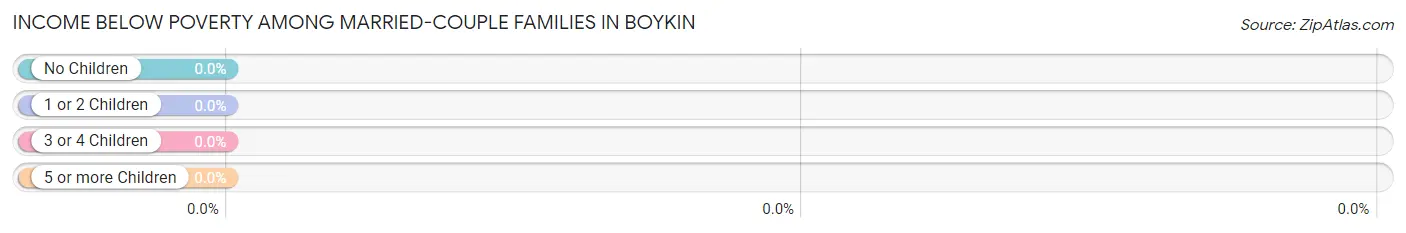
| Children | Above Poverty | Below Poverty |
| No Children | 29 (100.0%) | 0 (0.0%) |
| 1 or 2 Children | 0 (0.0%) | 0 (0.0%) |
| 3 or 4 Children | 0 (0.0%) | 0 (0.0%) |
| 5 or more Children | 0 (0.0%) | 0 (0.0%) |
| Total | 29 (100.0%) | 0 (0.0%) |
Income Below Poverty Among Single-Parent Households in Boykin
| Children | Single Father | Single Mother |
| No Children | 0 (0.0%) | 0 (0.0%) |
| 1 or 2 Children | 0 (0.0%) | 0 (0.0%) |
| 3 or 4 Children | 0 (0.0%) | 0 (0.0%) |
| 5 or more Children | 0 (0.0%) | 0 (0.0%) |
| Total | 0 (0.0%) | 0 (0.0%) |
Income Below Poverty Among Married-Couple vs Single-Parent Households in Boykin
| Children | Married-Couple Families | Single-Parent Households |
| No Children | 0 (0.0%) | 0 (0.0%) |
| 1 or 2 Children | 0 (0.0%) | 0 (0.0%) |
| 3 or 4 Children | 0 (0.0%) | 0 (0.0%) |
| 5 or more Children | 0 (0.0%) | 0 (0.0%) |
| Total | 0 (0.0%) | 0 (0.0%) |
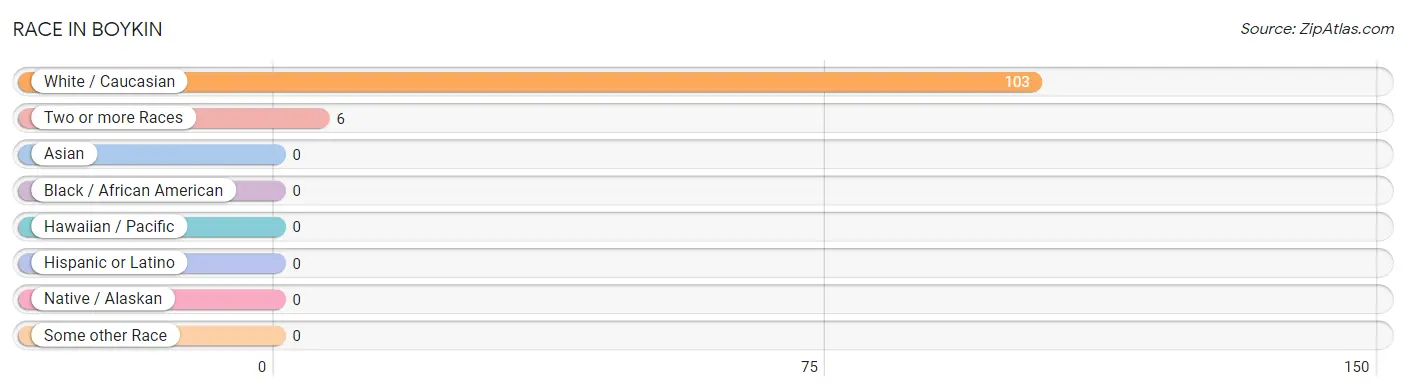
Race in Boykin
The most populous races in Boykin are White / Caucasian (103 | 94.5%), and Two or more Races (6 | 5.5%).
| Race | # Population | % Population |
| Asian | 0 | 0.0% |
| Black / African American | 0 | 0.0% |
| Hawaiian / Pacific | 0 | 0.0% |
| Hispanic or Latino | 0 | 0.0% |
| Native / Alaskan | 0 | 0.0% |
| White / Caucasian | 103 | 94.5% |
| Two or more Races | 6 | 5.5% |
| Some other Race | 0 | 0.0% |
| Total | 109 | 100.0% |
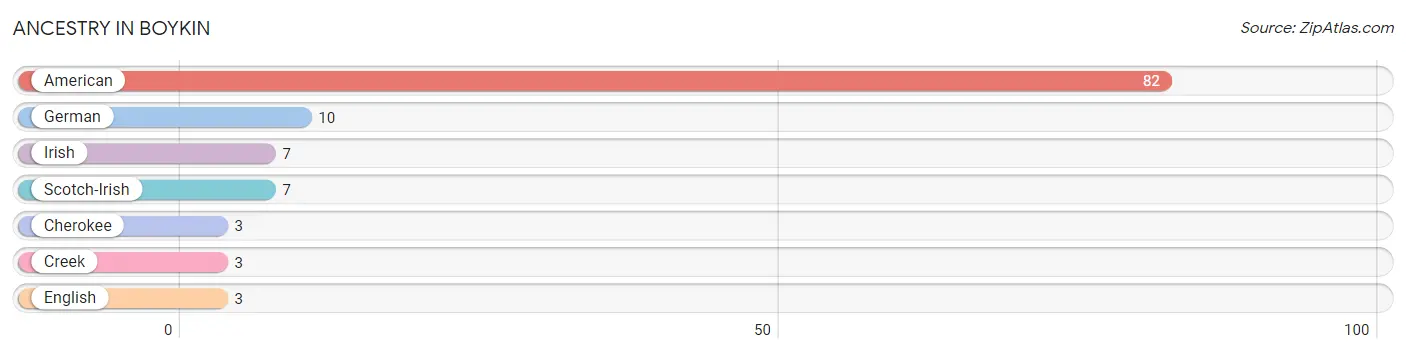
Ancestry in Boykin
The most populous ancestries reported in Boykin are American (82 | 75.2%), German (10 | 9.2%), Irish (7 | 6.4%), Scotch-Irish (7 | 6.4%), and Cherokee (3 | 2.8%), together accounting for 100.0% of all Boykin residents.
| Ancestry | # Population | % Population |
| American | 82 | 75.2% |
| Cherokee | 3 | 2.8% |
| Creek | 3 | 2.8% |
| English | 3 | 2.8% |
| German | 10 | 9.2% |
| Irish | 7 | 6.4% |
| Scotch-Irish | 7 | 6.4% | View All 7 Rows |
Immigrants in Boykin

| Immigration Origin | # Population | % Population | View All 0 Rows |
Sex and Age in Boykin
Sex and Age in Boykin
The most populous age groups in Boykin are 70 to 74 Years (39 | 92.9%) for men and 35 to 39 Years (35 | 52.2%) for women.
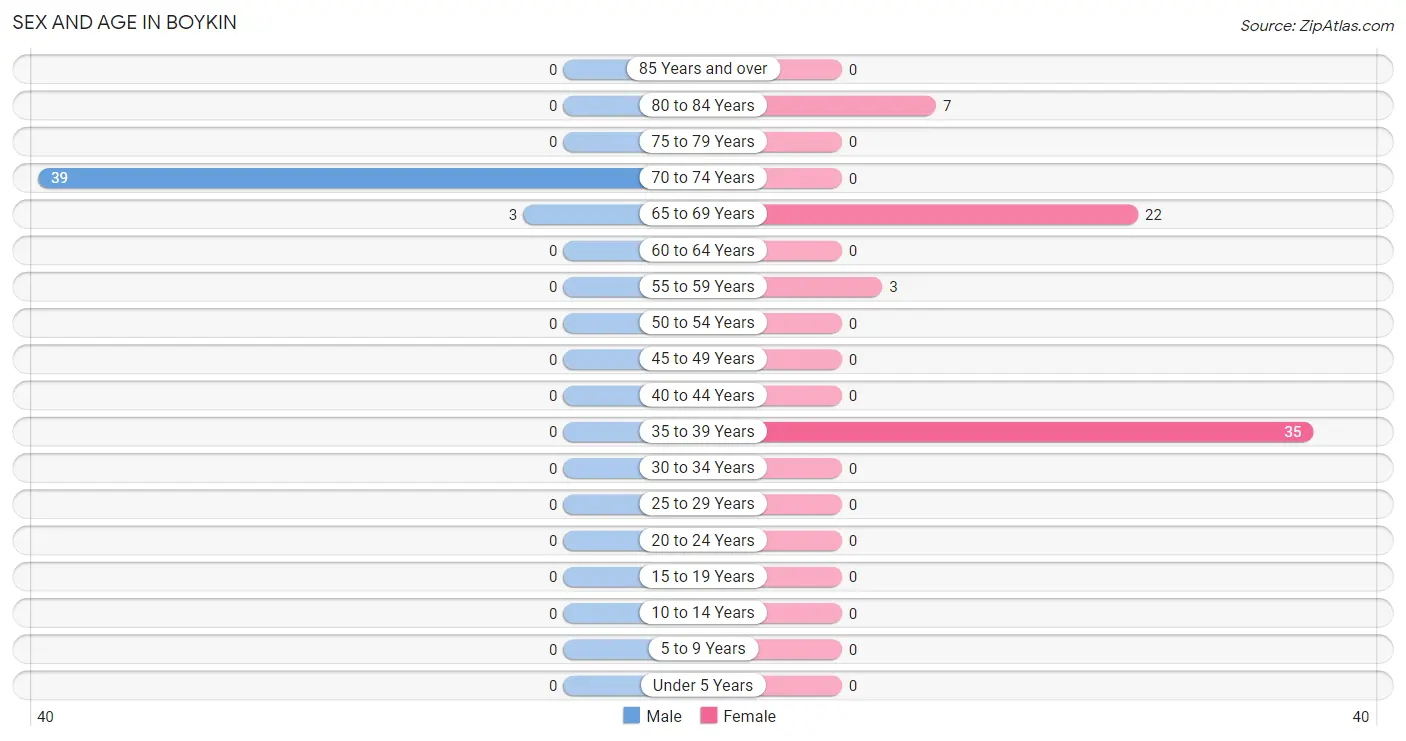
| Age Bracket | Male | Female |
| Under 5 Years | 0 (0.0%) | 0 (0.0%) |
| 5 to 9 Years | 0 (0.0%) | 0 (0.0%) |
| 10 to 14 Years | 0 (0.0%) | 0 (0.0%) |
| 15 to 19 Years | 0 (0.0%) | 0 (0.0%) |
| 20 to 24 Years | 0 (0.0%) | 0 (0.0%) |
| 25 to 29 Years | 0 (0.0%) | 0 (0.0%) |
| 30 to 34 Years | 0 (0.0%) | 0 (0.0%) |
| 35 to 39 Years | 0 (0.0%) | 35 (52.2%) |
| 40 to 44 Years | 0 (0.0%) | 0 (0.0%) |
| 45 to 49 Years | 0 (0.0%) | 0 (0.0%) |
| 50 to 54 Years | 0 (0.0%) | 0 (0.0%) |
| 55 to 59 Years | 0 (0.0%) | 3 (4.5%) |
| 60 to 64 Years | 0 (0.0%) | 0 (0.0%) |
| 65 to 69 Years | 3 (7.1%) | 22 (32.8%) |
| 70 to 74 Years | 39 (92.9%) | 0 (0.0%) |
| 75 to 79 Years | 0 (0.0%) | 0 (0.0%) |
| 80 to 84 Years | 0 (0.0%) | 7 (10.4%) |
| 85 Years and over | 0 (0.0%) | 0 (0.0%) |
| Total | 42 (100.0%) | 67 (100.0%) |
Families and Households in Boykin
Median Family Size in Boykin
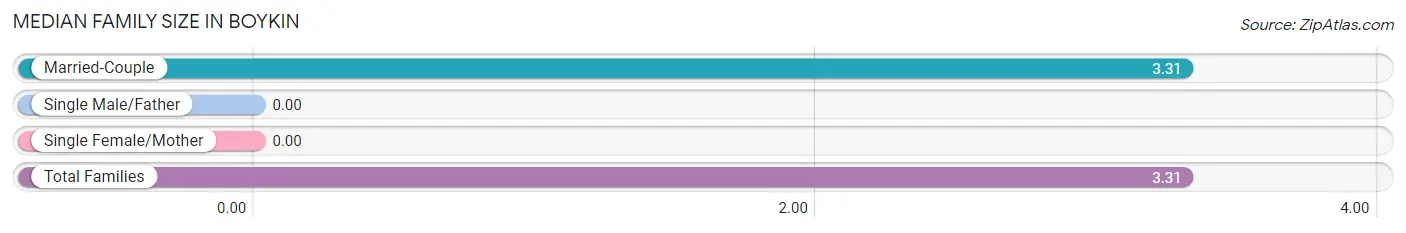
| Family Type | # Families | Family Size |
| Married-Couple | 29 (100.0%) | 3.31 |
| Single Male/Father | 0 (0.0%) | - |
| Single Female/Mother | 0 (0.0%) | - |
| Total Families | 29 (100.0%) | 3.31 |
Median Household Size in Boykin
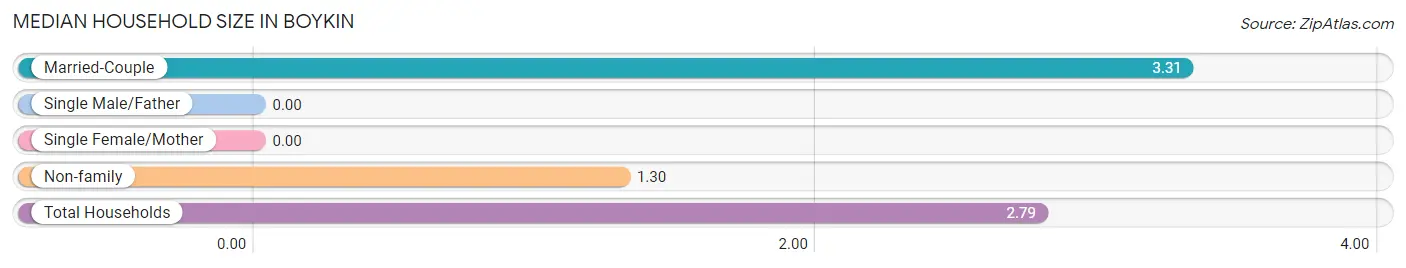
| Household Type | # Households | Household Size |
| Married-Couple | 29 (74.4%) | 3.31 |
| Single Male/Father | 0 (0.0%) | - |
| Single Female/Mother | 0 (0.0%) | - |
| Non-family | 10 (25.6%) | 1.30 |
| Total Households | 39 (100.0%) | 2.79 |
Household Size by Marriage Status in Boykin
Out of a total of 39 households in Boykin, 29 (74.4%) are family households, while 10 (25.6%) are nonfamily households. The most numerous type of family households are 3-person households, comprising 22, and the most common type of nonfamily households are 1-person households, comprising 7.
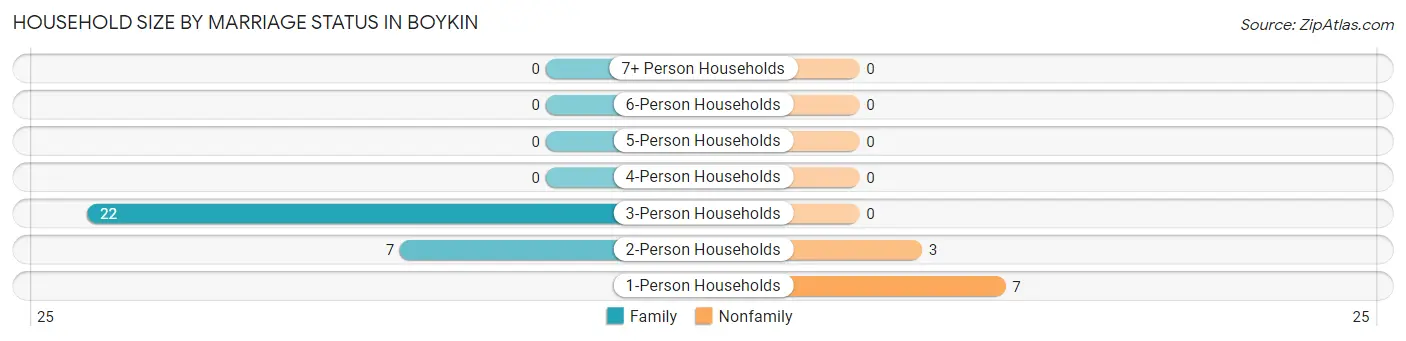
| Household Size | Family Households | Nonfamily Households |
| 1-Person Households | - | 7 (17.9%) |
| 2-Person Households | 7 (17.9%) | 3 (7.7%) |
| 3-Person Households | 22 (56.4%) | 0 (0.0%) |
| 4-Person Households | 0 (0.0%) | 0 (0.0%) |
| 5-Person Households | 0 (0.0%) | 0 (0.0%) |
| 6-Person Households | 0 (0.0%) | 0 (0.0%) |
| 7+ Person Households | 0 (0.0%) | 0 (0.0%) |
| Total | 29 (74.4%) | 10 (25.6%) |
Female Fertility in Boykin
Fertility by Age in Boykin
| Age Bracket | Women with Births | Births / 1,000 Women |
| 15 to 19 years | 0 (0.0%) | 0.0 |
| 20 to 34 years | 0 (0.0%) | 0.0 |
| 35 to 50 years | 0 (0.0%) | 0.0 |
| Total | 0 (0.0%) | 0.0 |
Fertility by Age by Marriage Status in Boykin
| Age Bracket | Married | Unmarried |
| 15 to 19 years | 0 (0.0%) | 0 (0.0%) |
| 20 to 34 years | 0 (0.0%) | 0 (0.0%) |
| 35 to 50 years | 0 (0.0%) | 0 (0.0%) |
| Total | 0 (0.0%) | 0 (0.0%) |
Fertility by Education in Boykin
| Educational Attainment | Women with Births | Births / 1,000 Women |
| Less than High School | 0 (0.0%) | 0.0 |
| High School Diploma | 0 (0.0%) | 0.0 |
| College or Associate's Degree | 0 (0.0%) | 0.0 |
| Bachelor's Degree | 0 (0.0%) | 0.0 |
| Graduate Degree | 0 (0.0%) | 0.0 |
| Total | 0 (0.0%) | 0.0 |
Fertility by Education by Marriage Status in Boykin
| Educational Attainment | Married | Unmarried |
| Less than High School | 0 (0.0%) | 0 (0.0%) |
| High School Diploma | 0 (0.0%) | 0 (0.0%) |
| College or Associate's Degree | 0 (0.0%) | 0 (0.0%) |
| Bachelor's Degree | 0 (0.0%) | 0 (0.0%) |
| Graduate Degree | 0 (0.0%) | 0 (0.0%) |
| Total | 0 (0.0%) | 0 (0.0%) |
Employment Characteristics in Boykin
Employment by Class of Employer in Boykin
Among the 102 employed individuals in Boykin, not-for-profit organizations (35 | 34.3%), self-employed (incorporated) (25 | 24.5%), and local government employees (22 | 21.6%) make up the most common classes of employment.
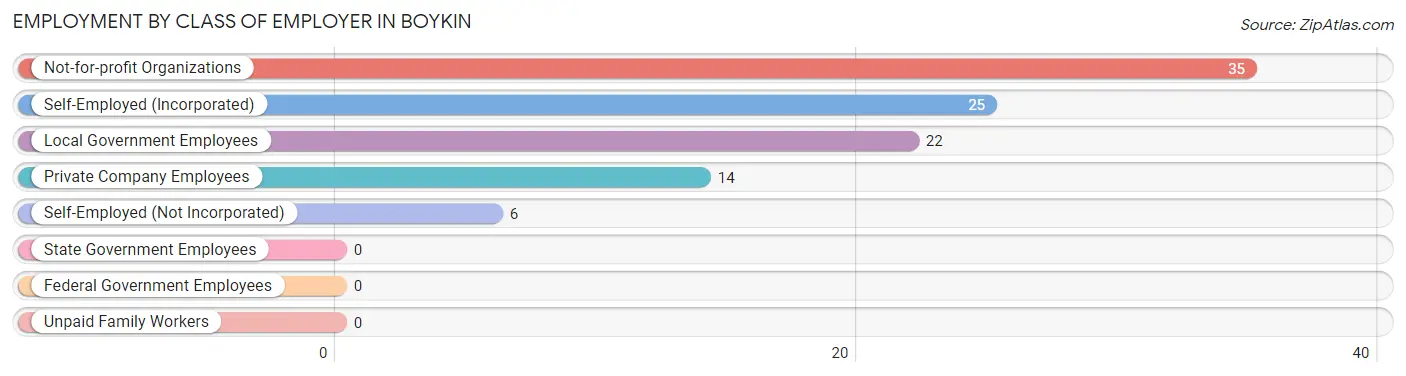
| Employer Class | # Employees | % Employees |
| Private Company Employees | 14 | 13.7% |
| Self-Employed (Incorporated) | 25 | 24.5% |
| Self-Employed (Not Incorporated) | 6 | 5.9% |
| Not-for-profit Organizations | 35 | 34.3% |
| Local Government Employees | 22 | 21.6% |
| State Government Employees | 0 | 0.0% |
| Federal Government Employees | 0 | 0.0% |
| Unpaid Family Workers | 0 | 0.0% |
| Total | 102 | 100.0% |
Employment Status by Age in Boykin
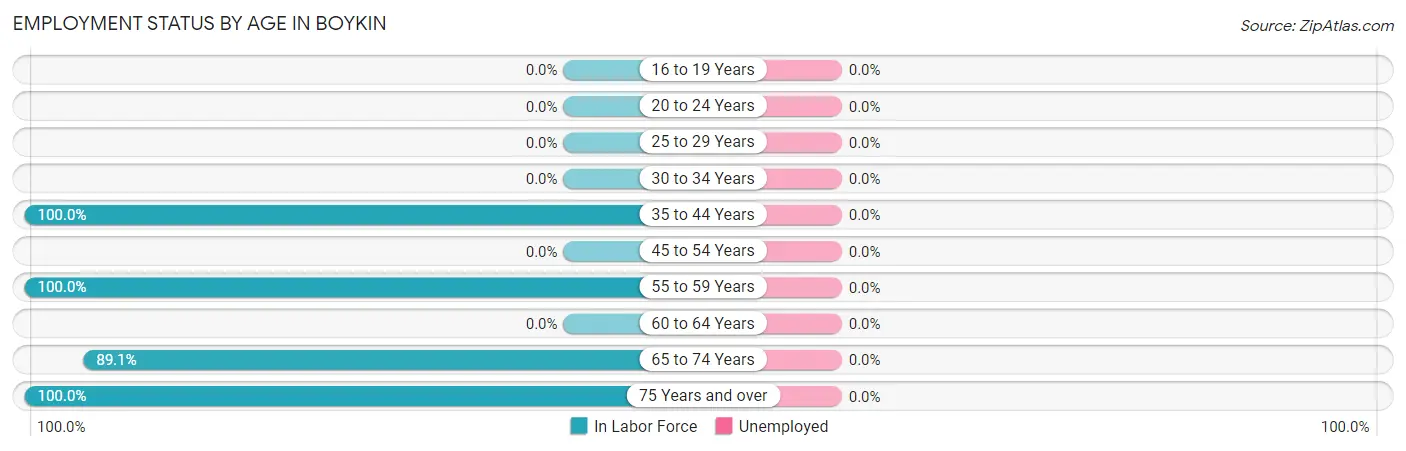
| Age Bracket | In Labor Force | Unemployed |
| 16 to 19 Years | 0 (0.0%) | 0 (0.0%) |
| 20 to 24 Years | 0 (0.0%) | 0 (0.0%) |
| 25 to 29 Years | 0 (0.0%) | 0 (0.0%) |
| 30 to 34 Years | 0 (0.0%) | 0 (0.0%) |
| 35 to 44 Years | 35 (100.0%) | 0 (0.0%) |
| 45 to 54 Years | 0 (0.0%) | 0 (0.0%) |
| 55 to 59 Years | 3 (100.0%) | 0 (0.0%) |
| 60 to 64 Years | 0 (0.0%) | 0 (0.0%) |
| 65 to 74 Years | 57 (89.1%) | 0 (0.0%) |
| 75 Years and over | 7 (100.0%) | 0 (0.0%) |
| Total | 102 (93.6%) | 0 (0.0%) |
Employment Status by Educational Attainment in Boykin
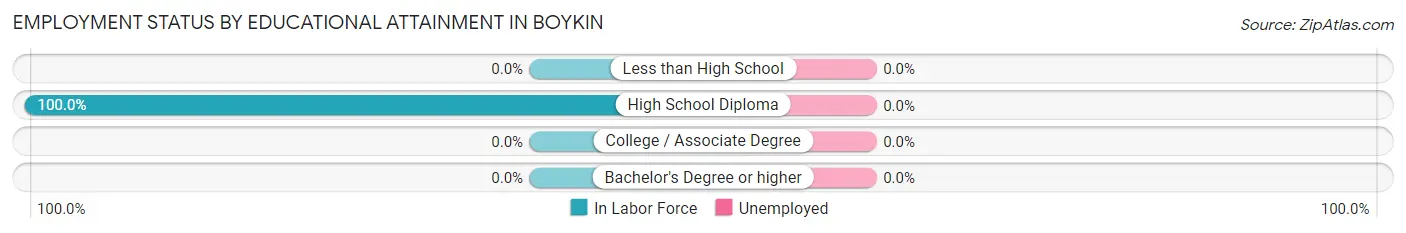
| Educational Attainment | In Labor Force | Unemployed |
| Less than High School | 0 (0.0%) | 0 (0.0%) |
| High School Diploma | 38 (100.0%) | 0 (0.0%) |
| College / Associate Degree | 0 (0.0%) | 0 (0.0%) |
| Bachelor's Degree or higher | 0 (0.0%) | 0 (0.0%) |
| Total | 38 (100.0%) | 0 (0.0%) |
Employment Occupations by Sex in Boykin
Management, Business, Science and Arts Occupations
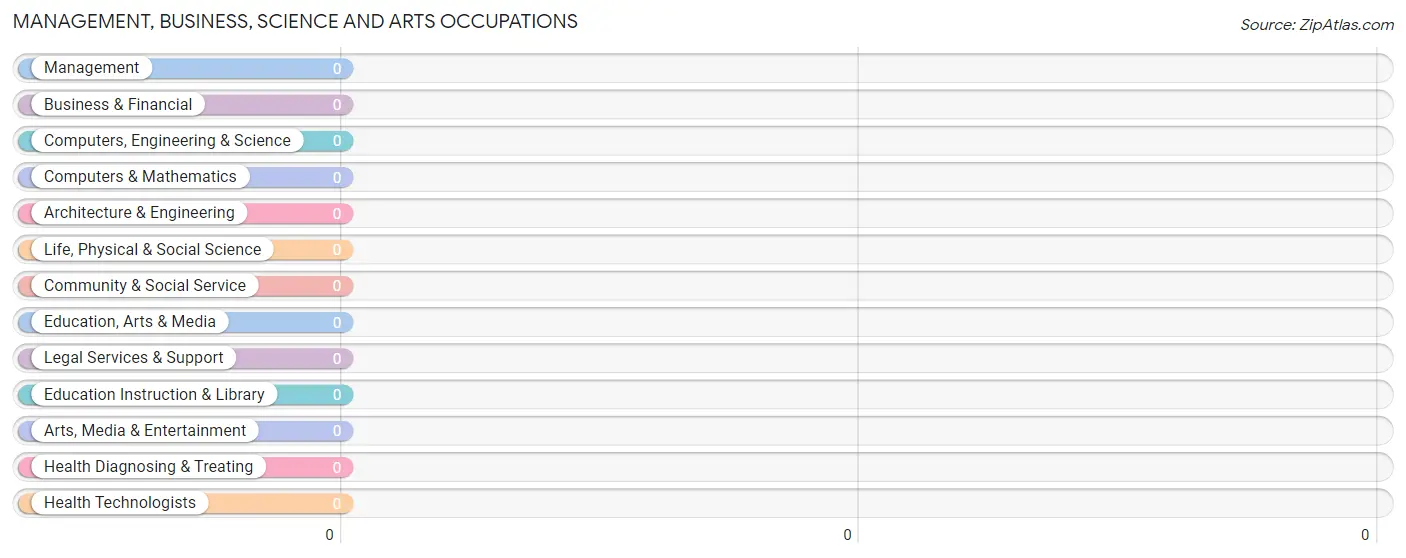
Management, Business, Science and Arts Occupations by Sex
| Occupation | Male | Female |
| Management | 0 (0.0%) | 0 (0.0%) |
| Business & Financial | 0 (0.0%) | 0 (0.0%) |
| Computers, Engineering & Science | 0 (0.0%) | 0 (0.0%) |
| Computers & Mathematics | 0 (0.0%) | 0 (0.0%) |
| Architecture & Engineering | 0 (0.0%) | 0 (0.0%) |
| Life, Physical & Social Science | 0 (0.0%) | 0 (0.0%) |
| Community & Social Service | 0 (0.0%) | 0 (0.0%) |
| Education, Arts & Media | 0 (0.0%) | 0 (0.0%) |
| Legal Services & Support | 0 (0.0%) | 0 (0.0%) |
| Education Instruction & Library | 0 (0.0%) | 0 (0.0%) |
| Arts, Media & Entertainment | 0 (0.0%) | 0 (0.0%) |
| Health Diagnosing & Treating | 0 (0.0%) | 0 (0.0%) |
| Health Technologists | 0 (0.0%) | 0 (0.0%) |
| Total (Category) | 0 (0.0%) | 0 (0.0%) |
| Total (Overall) | 35 (34.3%) | 67 (65.7%) |
Services Occupations
The most common Services occupations in Boykin are , and Personal Care & Service (35 | 34.3%).
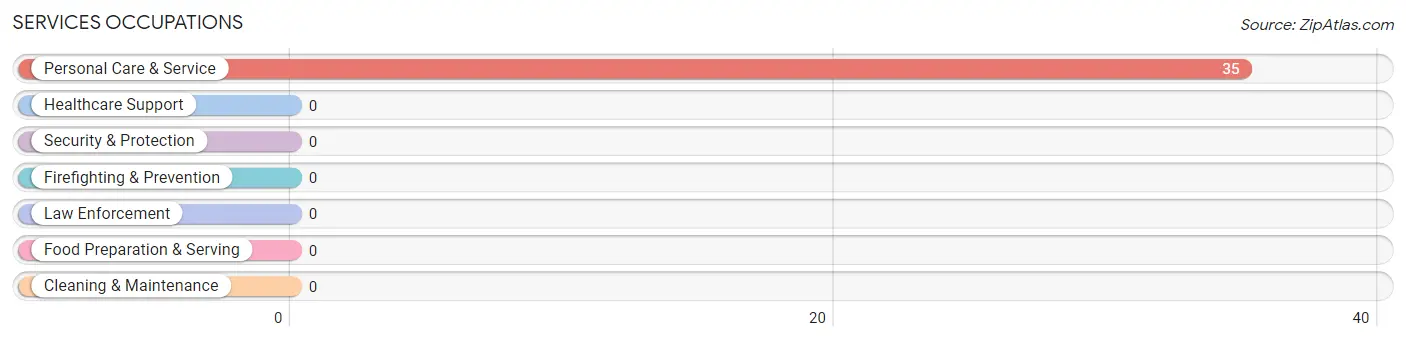
Services Occupations by Sex
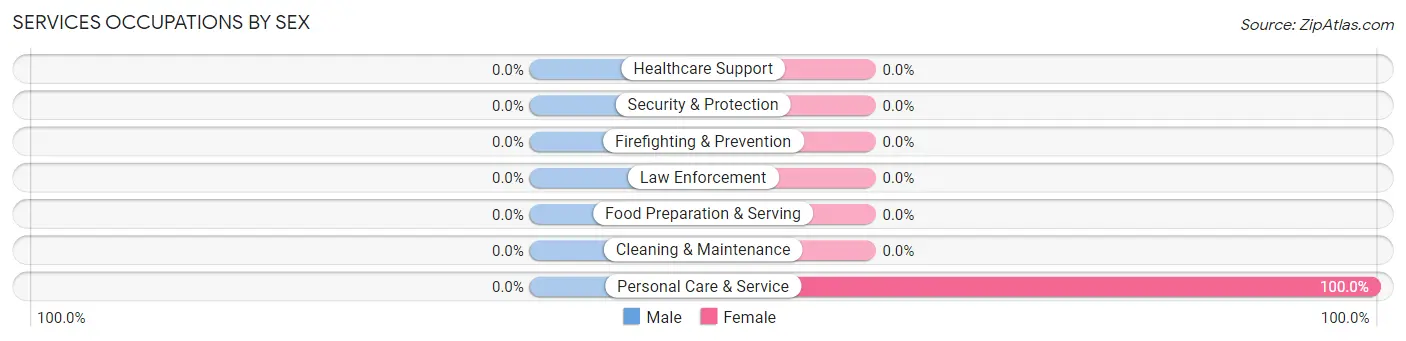
| Occupation | Male | Female |
| Healthcare Support | 0 (0.0%) | 0 (0.0%) |
| Security & Protection | 0 (0.0%) | 0 (0.0%) |
| Firefighting & Prevention | 0 (0.0%) | 0 (0.0%) |
| Law Enforcement | 0 (0.0%) | 0 (0.0%) |
| Food Preparation & Serving | 0 (0.0%) | 0 (0.0%) |
| Cleaning & Maintenance | 0 (0.0%) | 0 (0.0%) |
| Personal Care & Service | 0 (0.0%) | 35 (100.0%) |
| Total (Category) | 0 (0.0%) | 35 (100.0%) |
| Total (Overall) | 35 (34.3%) | 67 (65.7%) |
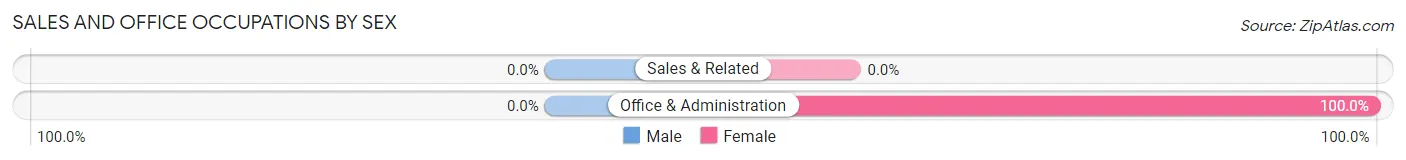
Sales and Office Occupations
The most common Sales and Office occupations in Boykin are , and Office & Administration (7 | 6.9%).
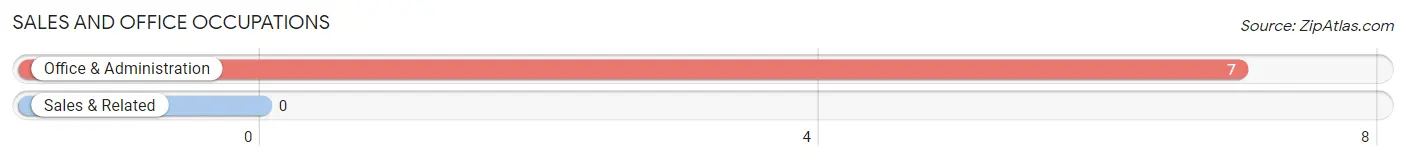
Sales and Office Occupations by Sex
| Occupation | Male | Female |
| Sales & Related | 0 (0.0%) | 0 (0.0%) |
| Office & Administration | 0 (0.0%) | 7 (100.0%) |
| Total (Category) | 0 (0.0%) | 7 (100.0%) |
| Total (Overall) | 35 (34.3%) | 67 (65.7%) |
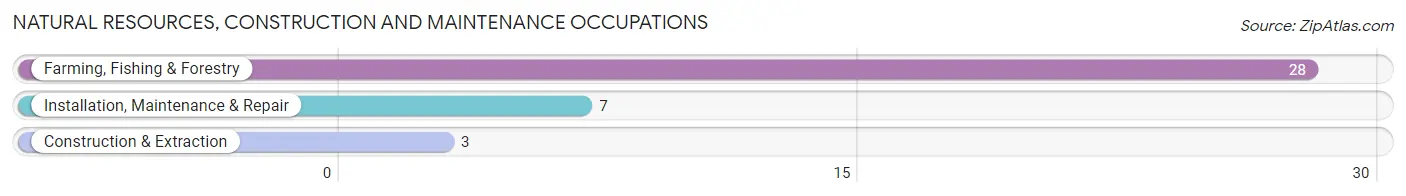
Natural Resources, Construction and Maintenance Occupations
The most common Natural Resources, Construction and Maintenance occupations in Boykin are Farming, Fishing & Forestry (28 | 27.5%), Installation, Maintenance & Repair (7 | 6.9%), and Construction & Extraction (3 | 2.9%).
Natural Resources, Construction and Maintenance Occupations by Sex
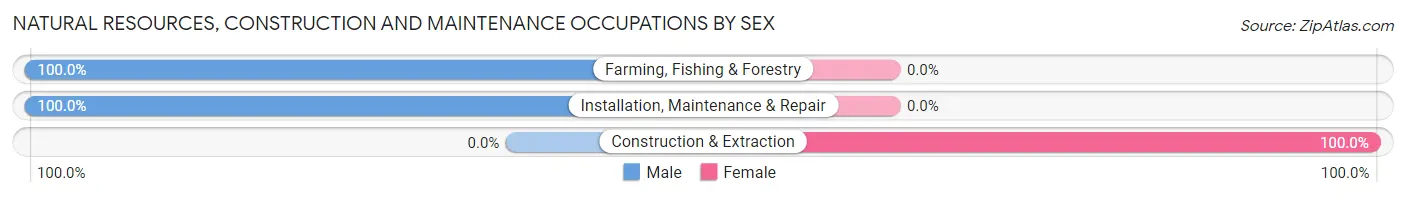
| Occupation | Male | Female |
| Farming, Fishing & Forestry | 28 (100.0%) | 0 (0.0%) |
| Construction & Extraction | 0 (0.0%) | 3 (100.0%) |
| Installation, Maintenance & Repair | 7 (100.0%) | 0 (0.0%) |
| Total (Category) | 35 (92.1%) | 3 (7.9%) |
| Total (Overall) | 35 (34.3%) | 67 (65.7%) |
Production, Transportation and Moving Occupations
The most common Production, Transportation and Moving occupations in Boykin are , and Transportation (22 | 21.6%).
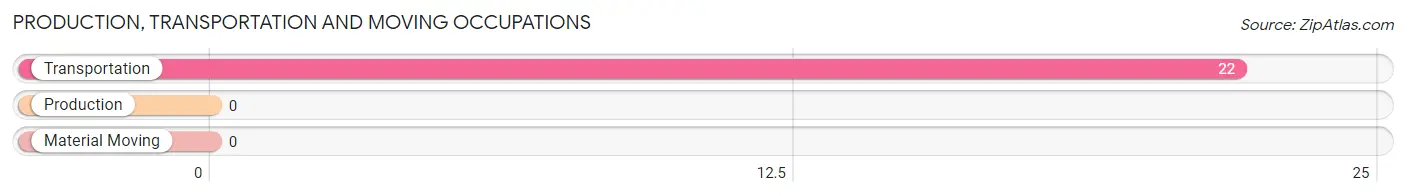
Production, Transportation and Moving Occupations by Sex
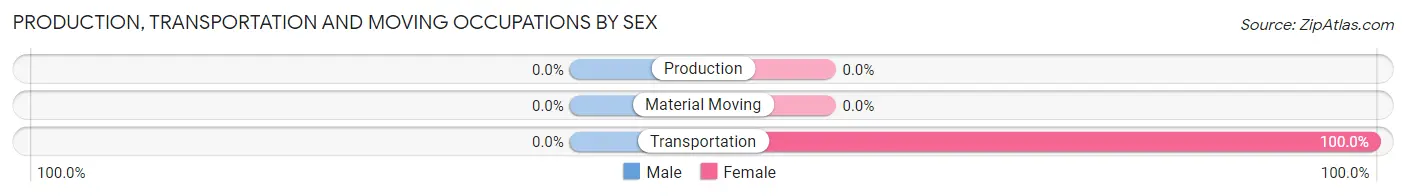
| Occupation | Male | Female |
| Production | 0 (0.0%) | 0 (0.0%) |
| Transportation | 0 (0.0%) | 22 (100.0%) |
| Material Moving | 0 (0.0%) | 0 (0.0%) |
| Total (Category) | 0 (0.0%) | 22 (100.0%) |
| Total (Overall) | 35 (34.3%) | 67 (65.7%) |
Employment Industries by Sex in Boykin
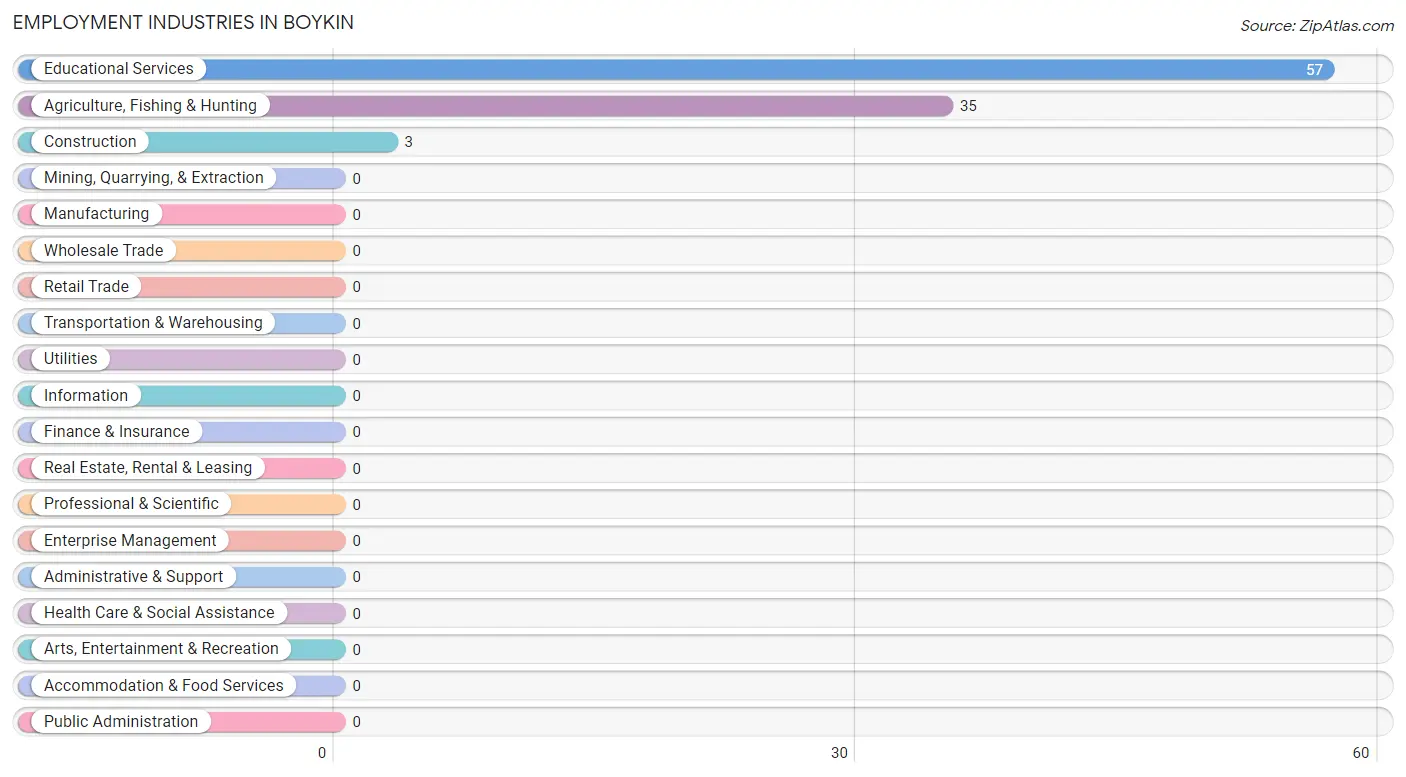
Employment Industries in Boykin
The major employment industries in Boykin include Educational Services (57 | 55.9%), Agriculture, Fishing & Hunting (35 | 34.3%), and Construction (3 | 2.9%).
Employment Industries by Sex in Boykin
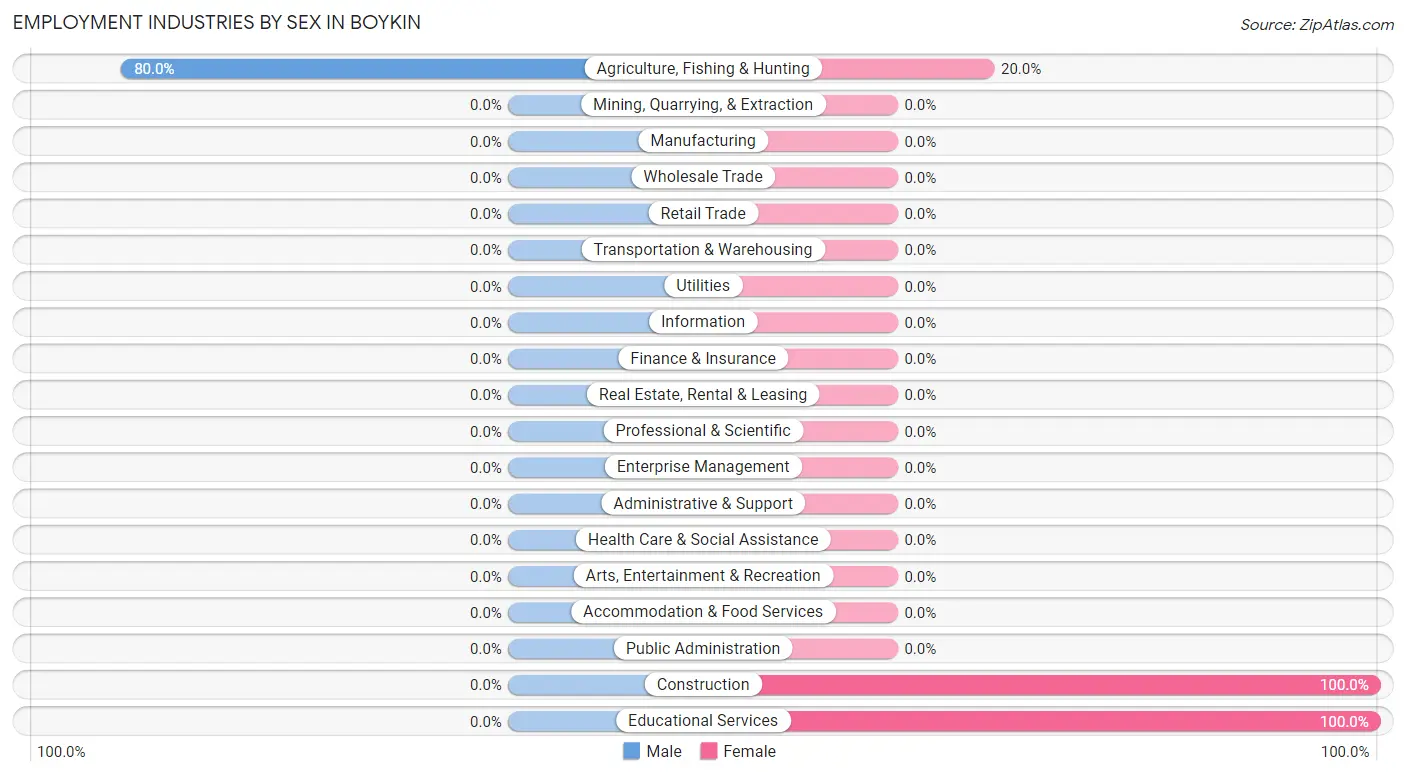
| Industry | Male | Female |
| Agriculture, Fishing & Hunting | 28 (80.0%) | 7 (20.0%) |
| Mining, Quarrying, & Extraction | 0 (0.0%) | 0 (0.0%) |
| Construction | 0 (0.0%) | 3 (100.0%) |
| Manufacturing | 0 (0.0%) | 0 (0.0%) |
| Wholesale Trade | 0 (0.0%) | 0 (0.0%) |
| Retail Trade | 0 (0.0%) | 0 (0.0%) |
| Transportation & Warehousing | 0 (0.0%) | 0 (0.0%) |
| Utilities | 0 (0.0%) | 0 (0.0%) |
| Information | 0 (0.0%) | 0 (0.0%) |
| Finance & Insurance | 0 (0.0%) | 0 (0.0%) |
| Real Estate, Rental & Leasing | 0 (0.0%) | 0 (0.0%) |
| Professional & Scientific | 0 (0.0%) | 0 (0.0%) |
| Enterprise Management | 0 (0.0%) | 0 (0.0%) |
| Administrative & Support | 0 (0.0%) | 0 (0.0%) |
| Educational Services | 0 (0.0%) | 57 (100.0%) |
| Health Care & Social Assistance | 0 (0.0%) | 0 (0.0%) |
| Arts, Entertainment & Recreation | 0 (0.0%) | 0 (0.0%) |
| Accommodation & Food Services | 0 (0.0%) | 0 (0.0%) |
| Public Administration | 0 (0.0%) | 0 (0.0%) |
| Total | 35 (34.3%) | 67 (65.7%) |
Education in Boykin
School Enrollment in Boykin
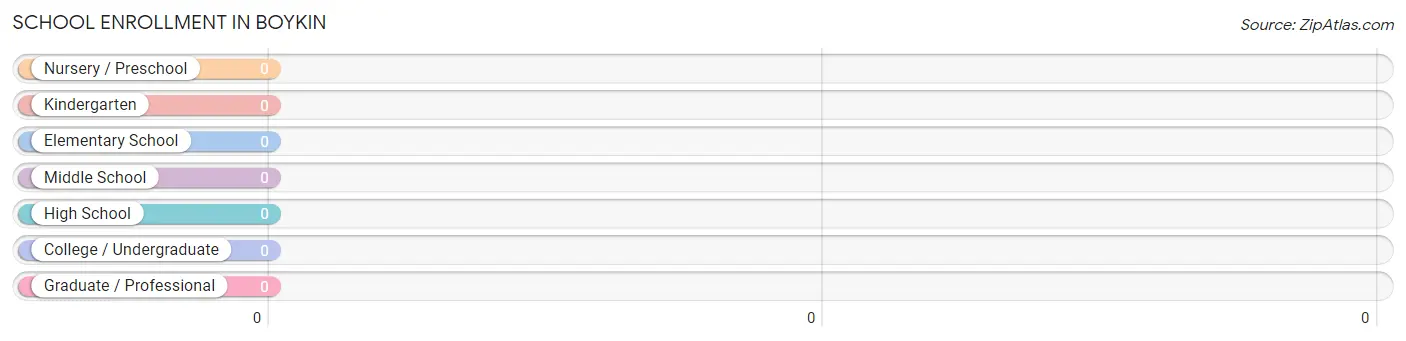
| School Level | # Students | % Students |
| Nursery / Preschool | 0 | 0.0% |
| Kindergarten | 0 | 0.0% |
| Elementary School | 0 | 0.0% |
| Middle School | 0 | 0.0% |
| High School | 0 | 0.0% |
| College / Undergraduate | 0 | 0.0% |
| Graduate / Professional | 0 | 0.0% |
| Total | 0 | 0.0% |
School Enrollment by Age by Funding Source in Boykin
| Age Bracket | Public School | Private School |
| 3 to 4 Year Olds | 0 (0.0%) | 0 (0.0%) |
| 5 to 9 Year Old | 0 (0.0%) | 0 (0.0%) |
| 10 to 14 Year Olds | 0 (0.0%) | 0 (0.0%) |
| 15 to 17 Year Olds | 0 (0.0%) | 0 (0.0%) |
| 18 to 19 Year Olds | 0 (0.0%) | 0 (0.0%) |
| 20 to 24 Year Olds | 0 (0.0%) | 0 (0.0%) |
| 25 to 34 Year Olds | 0 (0.0%) | 0 (0.0%) |
| 35 Years and over | 0 (0.0%) | 0 (0.0%) |
| Total | 0 (0.0%) | 0 (0.0%) |
Educational Attainment by Field of Study in Boykin
, and social sciences (7 | 100.0%) are the most common fields of study among 7 individuals in Boykin who have obtained a bachelor's degree or higher.
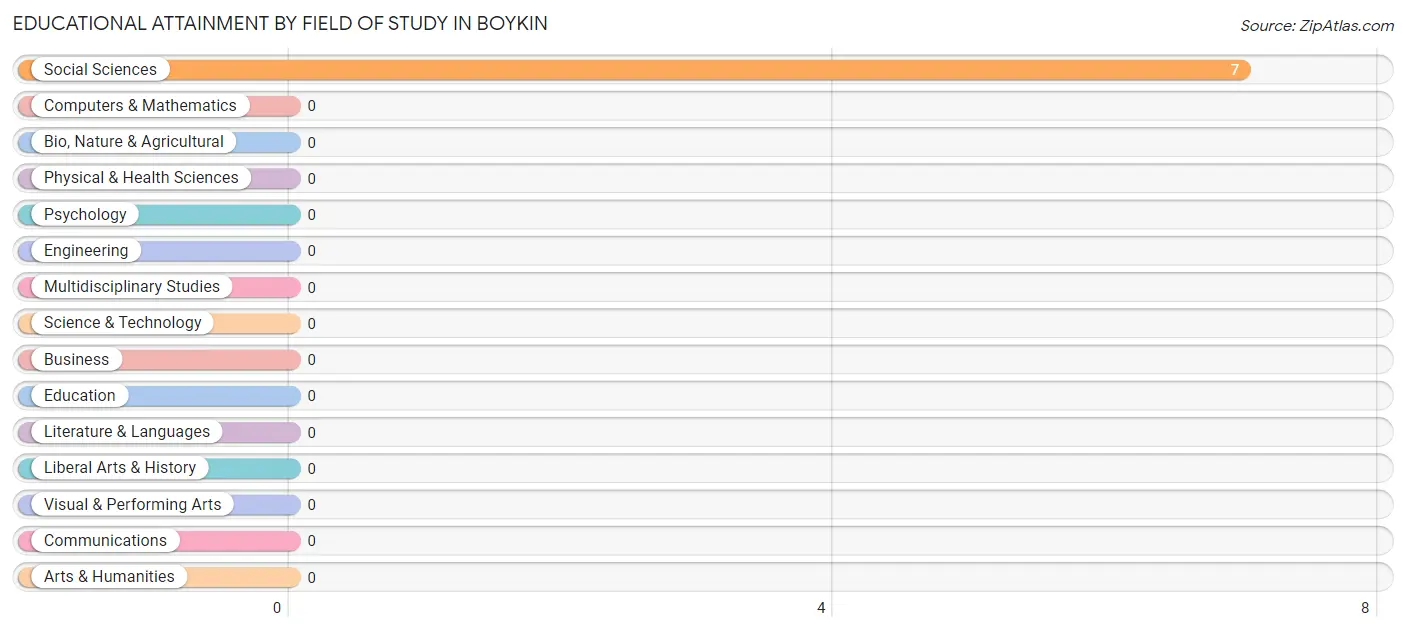
| Field of Study | # Graduates | % Graduates |
| Computers & Mathematics | 0 | 0.0% |
| Bio, Nature & Agricultural | 0 | 0.0% |
| Physical & Health Sciences | 0 | 0.0% |
| Psychology | 0 | 0.0% |
| Social Sciences | 7 | 100.0% |
| Engineering | 0 | 0.0% |
| Multidisciplinary Studies | 0 | 0.0% |
| Science & Technology | 0 | 0.0% |
| Business | 0 | 0.0% |
| Education | 0 | 0.0% |
| Literature & Languages | 0 | 0.0% |
| Liberal Arts & History | 0 | 0.0% |
| Visual & Performing Arts | 0 | 0.0% |
| Communications | 0 | 0.0% |
| Arts & Humanities | 0 | 0.0% |
| Total | 7 | 100.0% |
Transportation & Commute in Boykin
Vehicle Availability by Sex in Boykin
The most prevalent vehicle ownership categories in Boykin are males with 3 vehicles (28, accounting for 80.0%) and females with 3 vehicles (60, making up 41.8%).
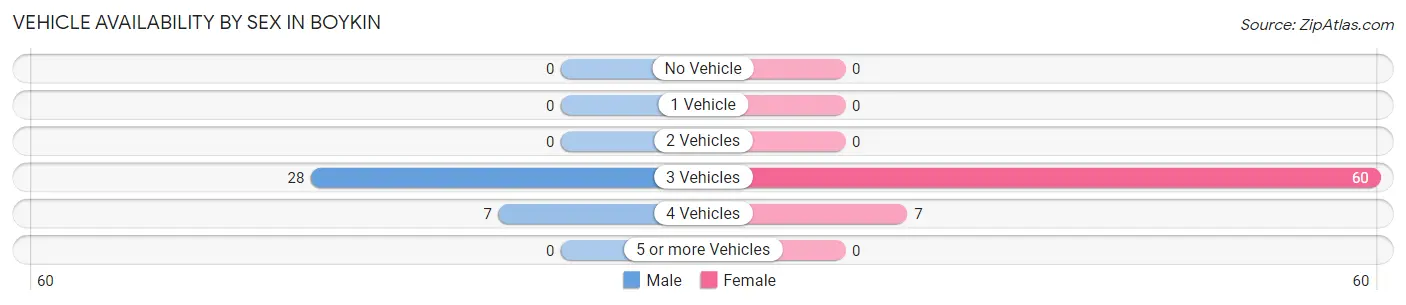
| Vehicles Available | Male | Female |
| No Vehicle | 0 (0.0%) | 0 (0.0%) |
| 1 Vehicle | 0 (0.0%) | 0 (0.0%) |
| 2 Vehicles | 0 (0.0%) | 0 (0.0%) |
| 3 Vehicles | 28 (80.0%) | 60 (89.5%) |
| 4 Vehicles | 7 (20.0%) | 7 (10.4%) |
| 5 or more Vehicles | 0 (0.0%) | 0 (0.0%) |
| Total | 35 (100.0%) | 67 (100.0%) |
Commute Time in Boykin
The most frequently occuring commute durations in Boykin are 20 to 24 minutes (35 commuters, 34.3%), 15 to 19 minutes (25 commuters, 24.5%), and 60 to 89 minutes (25 commuters, 24.5%).
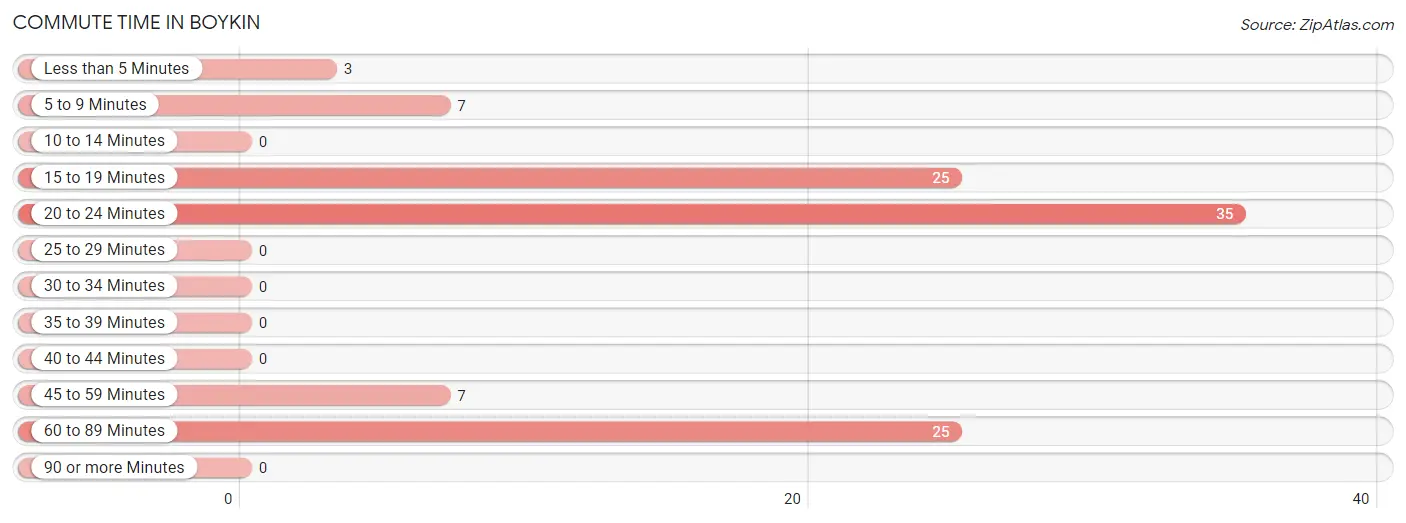
| Commute Time | # Commuters | % Commuters |
| Less than 5 Minutes | 3 | 2.9% |
| 5 to 9 Minutes | 7 | 6.9% |
| 10 to 14 Minutes | 0 | 0.0% |
| 15 to 19 Minutes | 25 | 24.5% |
| 20 to 24 Minutes | 35 | 34.3% |
| 25 to 29 Minutes | 0 | 0.0% |
| 30 to 34 Minutes | 0 | 0.0% |
| 35 to 39 Minutes | 0 | 0.0% |
| 40 to 44 Minutes | 0 | 0.0% |
| 45 to 59 Minutes | 7 | 6.9% |
| 60 to 89 Minutes | 25 | 24.5% |
| 90 or more Minutes | 0 | 0.0% |
Commute Time by Sex in Boykin
The most common commute times in Boykin are 60 to 89 minutes (25 commuters, 71.4%) for males and 20 to 24 minutes (35 commuters, 52.2%) for females.
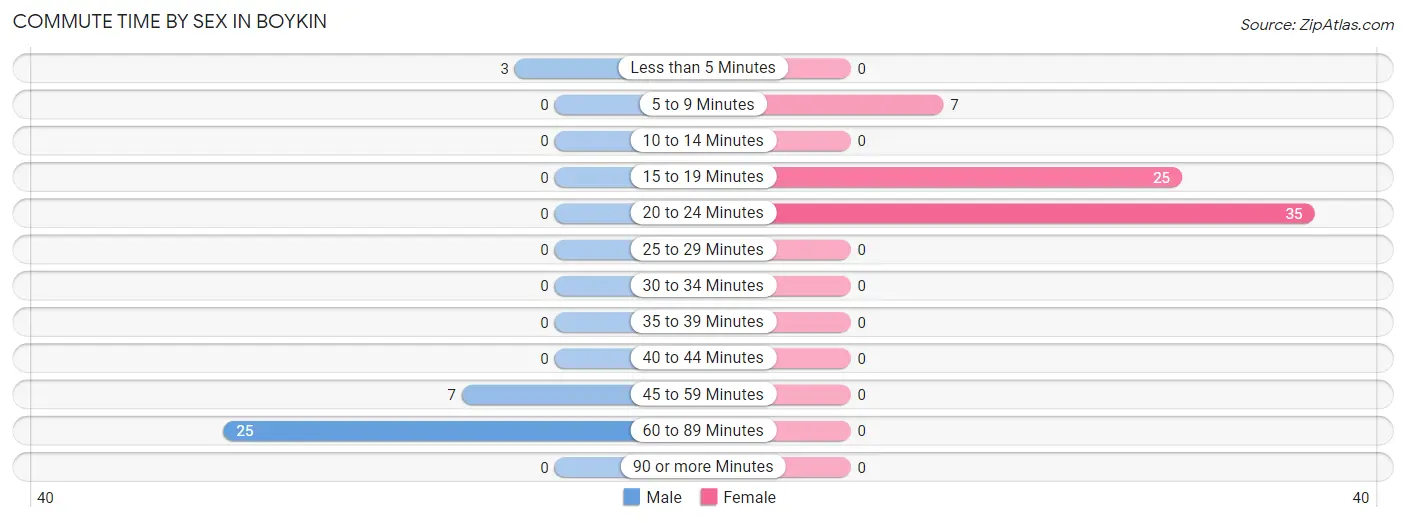
| Commute Time | Male | Female |
| Less than 5 Minutes | 3 (8.6%) | 0 (0.0%) |
| 5 to 9 Minutes | 0 (0.0%) | 7 (10.4%) |
| 10 to 14 Minutes | 0 (0.0%) | 0 (0.0%) |
| 15 to 19 Minutes | 0 (0.0%) | 25 (37.3%) |
| 20 to 24 Minutes | 0 (0.0%) | 35 (52.2%) |
| 25 to 29 Minutes | 0 (0.0%) | 0 (0.0%) |
| 30 to 34 Minutes | 0 (0.0%) | 0 (0.0%) |
| 35 to 39 Minutes | 0 (0.0%) | 0 (0.0%) |
| 40 to 44 Minutes | 0 (0.0%) | 0 (0.0%) |
| 45 to 59 Minutes | 7 (20.0%) | 0 (0.0%) |
| 60 to 89 Minutes | 25 (71.4%) | 0 (0.0%) |
| 90 or more Minutes | 0 (0.0%) | 0 (0.0%) |
Time of Departure to Work by Sex in Boykin
The most frequent times of departure to work in Boykin are 12:00 AM to 4:59 AM (25, 71.4%) for males and 9:00 AM to 9:59 AM (35, 52.2%) for females.
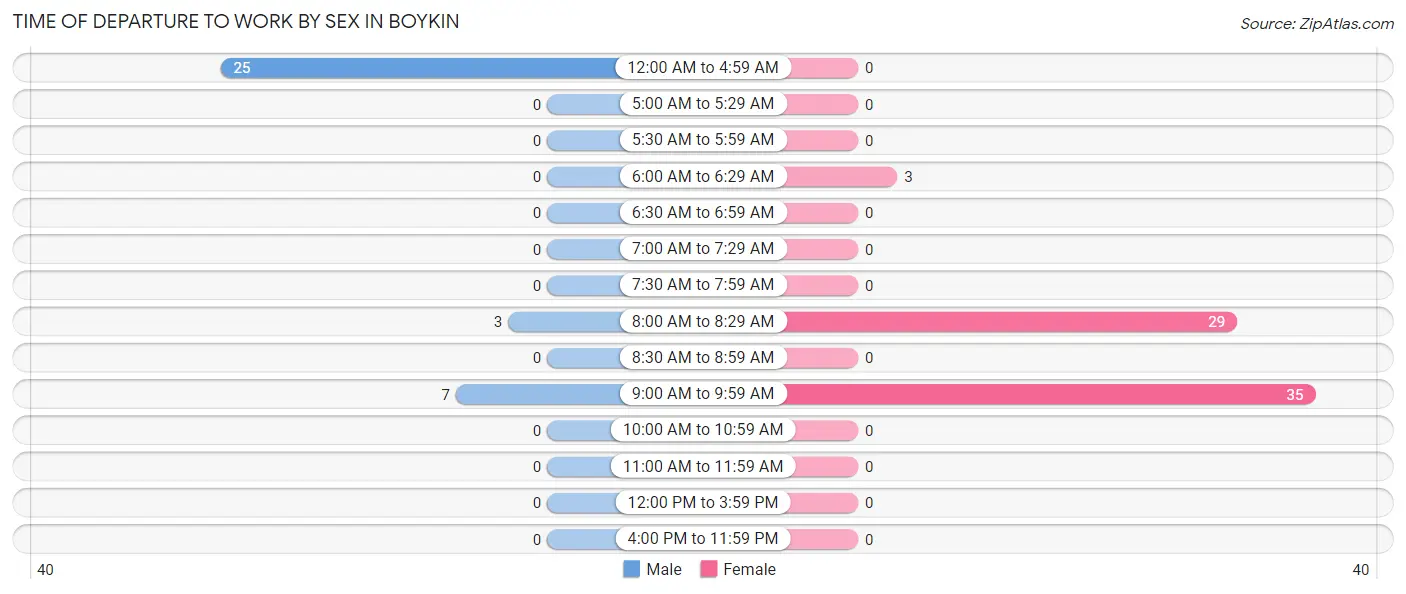
| Time of Departure | Male | Female |
| 12:00 AM to 4:59 AM | 25 (71.4%) | 0 (0.0%) |
| 5:00 AM to 5:29 AM | 0 (0.0%) | 0 (0.0%) |
| 5:30 AM to 5:59 AM | 0 (0.0%) | 0 (0.0%) |
| 6:00 AM to 6:29 AM | 0 (0.0%) | 3 (4.5%) |
| 6:30 AM to 6:59 AM | 0 (0.0%) | 0 (0.0%) |
| 7:00 AM to 7:29 AM | 0 (0.0%) | 0 (0.0%) |
| 7:30 AM to 7:59 AM | 0 (0.0%) | 0 (0.0%) |
| 8:00 AM to 8:29 AM | 3 (8.6%) | 29 (43.3%) |
| 8:30 AM to 8:59 AM | 0 (0.0%) | 0 (0.0%) |
| 9:00 AM to 9:59 AM | 7 (20.0%) | 35 (52.2%) |
| 10:00 AM to 10:59 AM | 0 (0.0%) | 0 (0.0%) |
| 11:00 AM to 11:59 AM | 0 (0.0%) | 0 (0.0%) |
| 12:00 PM to 3:59 PM | 0 (0.0%) | 0 (0.0%) |
| 4:00 PM to 11:59 PM | 0 (0.0%) | 0 (0.0%) |
| Total | 35 (100.0%) | 67 (100.0%) |
Housing Occupancy in Boykin
Occupancy by Ownership in Boykin
Of the total 39 dwellings in Boykin, owner-occupied units account for 29 (74.4%), while renter-occupied units make up 10 (25.6%).
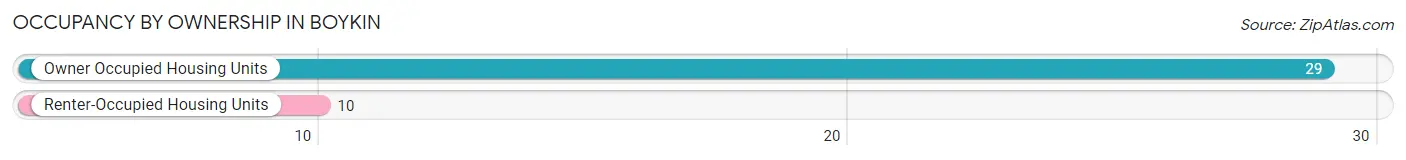
| Occupancy | # Housing Units | % Housing Units |
| Owner Occupied Housing Units | 29 | 74.4% |
| Renter-Occupied Housing Units | 10 | 25.6% |
| Total Occupied Housing Units | 39 | 100.0% |
Occupancy by Household Size in Boykin
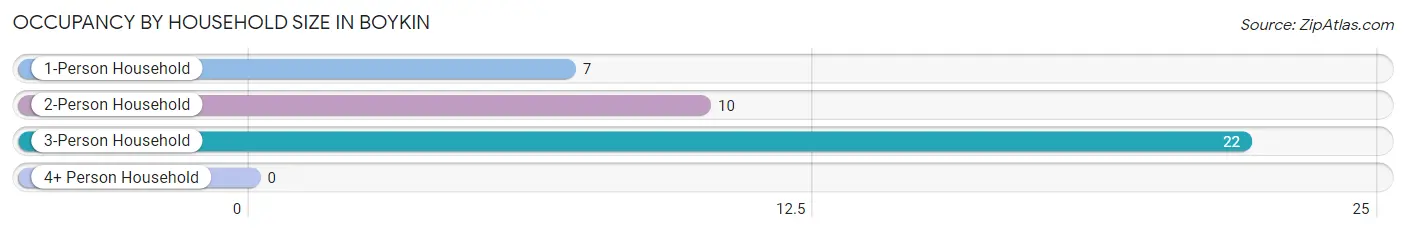
| Household Size | # Housing Units | % Housing Units |
| 1-Person Household | 7 | 17.9% |
| 2-Person Household | 10 | 25.6% |
| 3-Person Household | 22 | 56.4% |
| 4+ Person Household | 0 | 0.0% |
| Total Housing Units | 39 | 100.0% |
Occupancy by Ownership by Household Size in Boykin
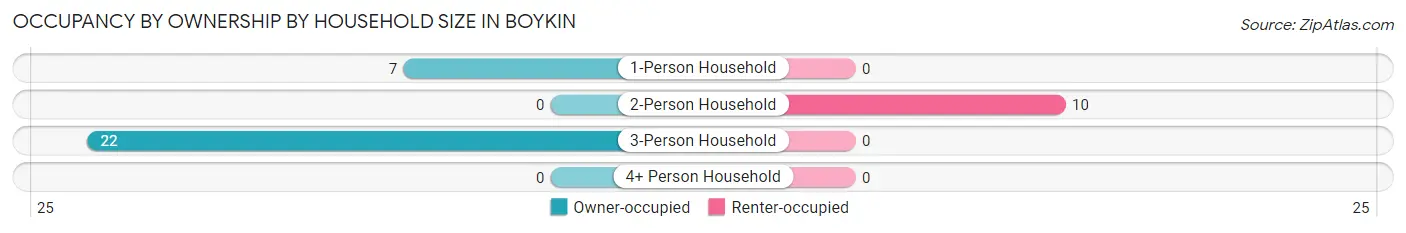
| Household Size | Owner-occupied | Renter-occupied |
| 1-Person Household | 7 (100.0%) | 0 (0.0%) |
| 2-Person Household | 0 (0.0%) | 10 (100.0%) |
| 3-Person Household | 22 (100.0%) | 0 (0.0%) |
| 4+ Person Household | 0 (0.0%) | 0 (0.0%) |
| Total Housing Units | 29 (74.4%) | 10 (25.6%) |
Occupancy by Educational Attainment in Boykin
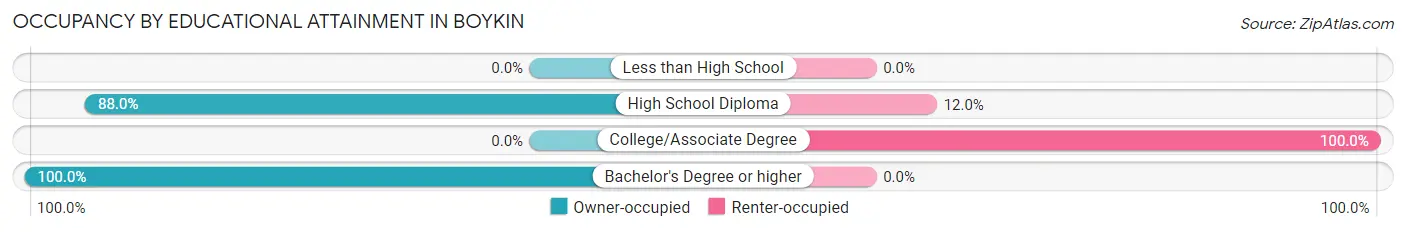
| Household Size | Owner-occupied | Renter-occupied |
| Less than High School | 0 (0.0%) | 0 (0.0%) |
| High School Diploma | 22 (88.0%) | 3 (12.0%) |
| College/Associate Degree | 0 (0.0%) | 7 (100.0%) |
| Bachelor's Degree or higher | 7 (100.0%) | 0 (0.0%) |
Occupancy by Age of Householder in Boykin
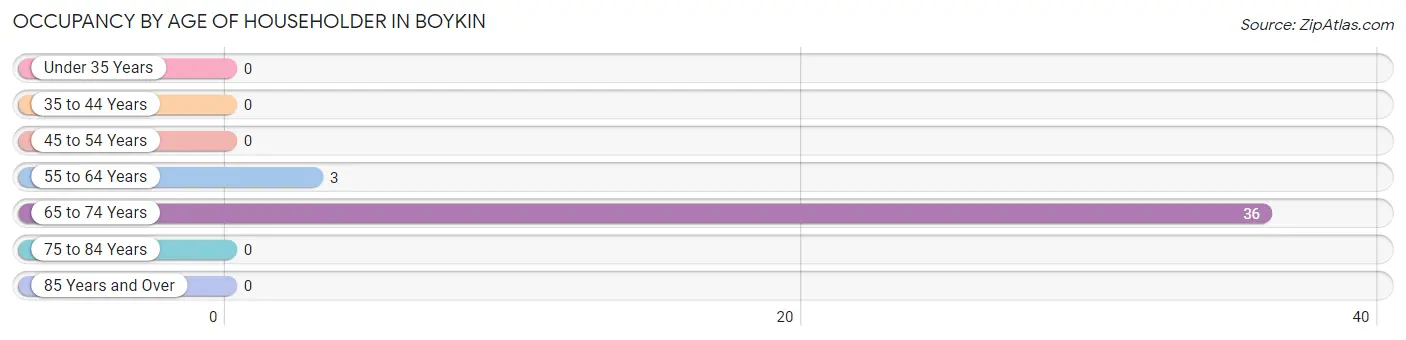
| Age Bracket | # Households | % Households |
| Under 35 Years | 0 | 0.0% |
| 35 to 44 Years | 0 | 0.0% |
| 45 to 54 Years | 0 | 0.0% |
| 55 to 64 Years | 3 | 7.7% |
| 65 to 74 Years | 36 | 92.3% |
| 75 to 84 Years | 0 | 0.0% |
| 85 Years and Over | 0 | 0.0% |
| Total | 39 | 100.0% |
Housing Finances in Boykin
Median Income by Occupancy in Boykin
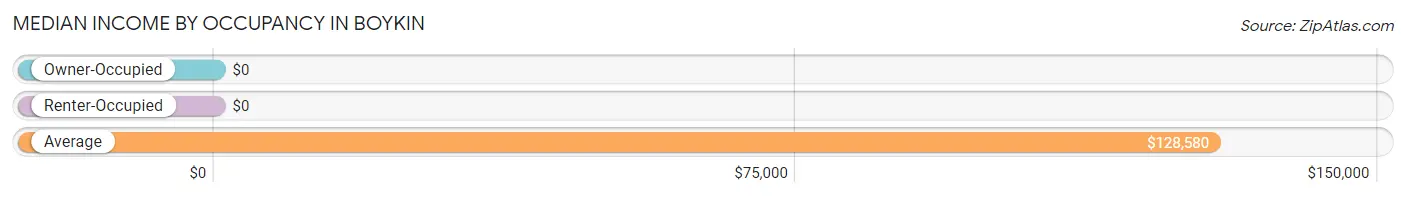
| Occupancy Type | # Households | Median Income |
| Owner-Occupied | 29 (74.4%) | $0 |
| Renter-Occupied | 10 (25.6%) | $0 |
| Average | 39 (100.0%) | $128,580 |
Occupancy by Householder Income Bracket in Boykin
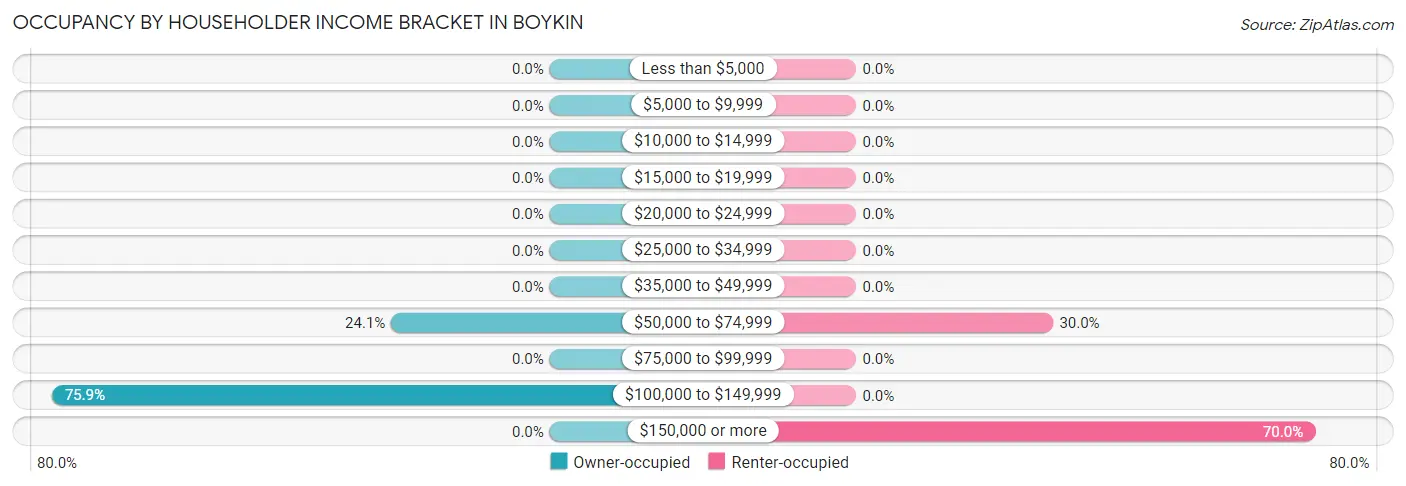
| Income Bracket | Owner-occupied | Renter-occupied |
| Less than $5,000 | 0 (0.0%) | 0 (0.0%) |
| $5,000 to $9,999 | 0 (0.0%) | 0 (0.0%) |
| $10,000 to $14,999 | 0 (0.0%) | 0 (0.0%) |
| $15,000 to $19,999 | 0 (0.0%) | 0 (0.0%) |
| $20,000 to $24,999 | 0 (0.0%) | 0 (0.0%) |
| $25,000 to $34,999 | 0 (0.0%) | 0 (0.0%) |
| $35,000 to $49,999 | 0 (0.0%) | 0 (0.0%) |
| $50,000 to $74,999 | 7 (24.1%) | 3 (30.0%) |
| $75,000 to $99,999 | 0 (0.0%) | 0 (0.0%) |
| $100,000 to $149,999 | 22 (75.9%) | 0 (0.0%) |
| $150,000 or more | 0 (0.0%) | 7 (70.0%) |
| Total | 29 (100.0%) | 10 (100.0%) |
Monthly Housing Cost Tiers in Boykin
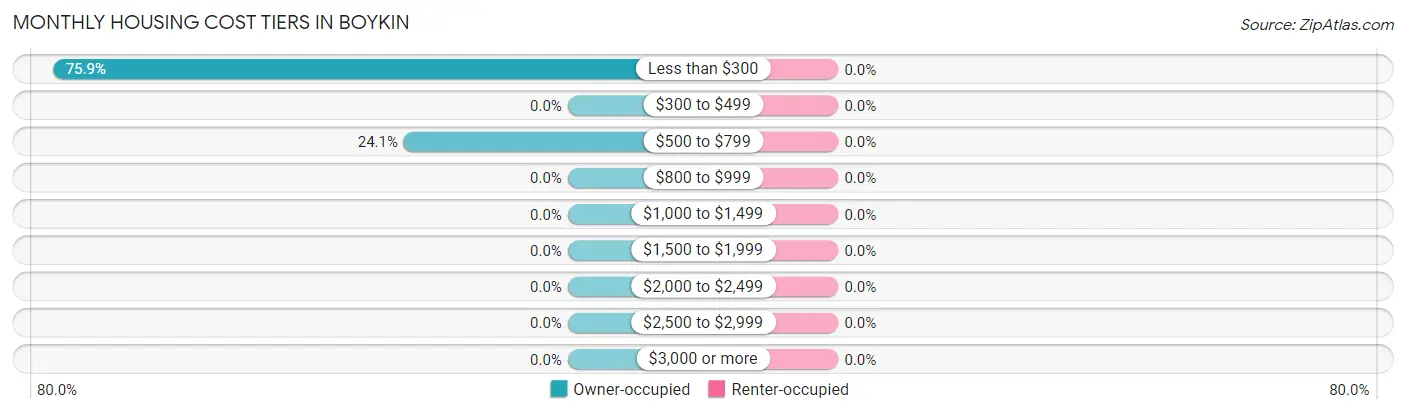
| Monthly Cost | Owner-occupied | Renter-occupied |
| Less than $300 | 22 (75.9%) | 0 (0.0%) |
| $300 to $499 | 0 (0.0%) | 0 (0.0%) |
| $500 to $799 | 7 (24.1%) | 0 (0.0%) |
| $800 to $999 | 0 (0.0%) | 0 (0.0%) |
| $1,000 to $1,499 | 0 (0.0%) | 0 (0.0%) |
| $1,500 to $1,999 | 0 (0.0%) | 0 (0.0%) |
| $2,000 to $2,499 | 0 (0.0%) | 0 (0.0%) |
| $2,500 to $2,999 | 0 (0.0%) | 0 (0.0%) |
| $3,000 or more | 0 (0.0%) | 0 (0.0%) |
| Total | 29 (100.0%) | 10 (100.0%) |
Physical Housing Characteristics in Boykin
Housing Structures in Boykin
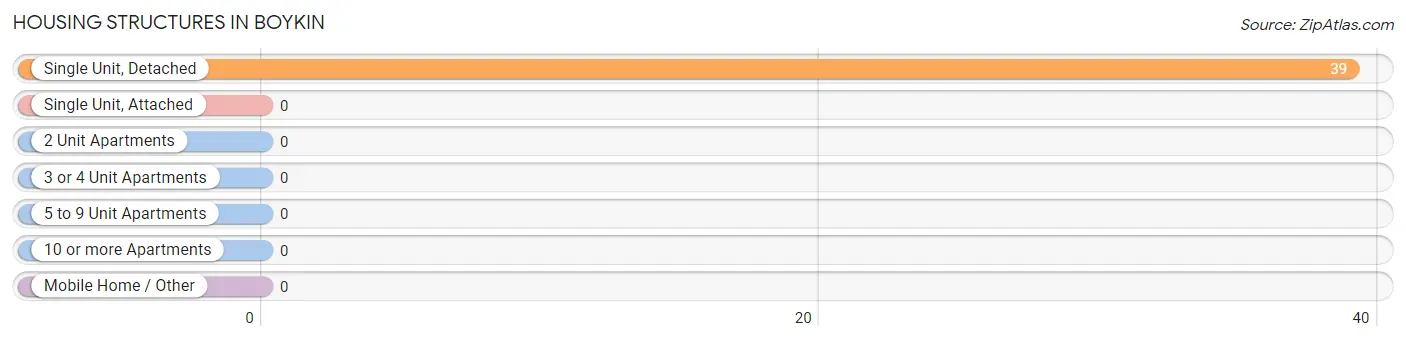
| Structure Type | # Housing Units | % Housing Units |
| Single Unit, Detached | 39 | 100.0% |
| Single Unit, Attached | 0 | 0.0% |
| 2 Unit Apartments | 0 | 0.0% |
| 3 or 4 Unit Apartments | 0 | 0.0% |
| 5 to 9 Unit Apartments | 0 | 0.0% |
| 10 or more Apartments | 0 | 0.0% |
| Mobile Home / Other | 0 | 0.0% |
| Total | 39 | 100.0% |
Housing Structures by Occupancy in Boykin
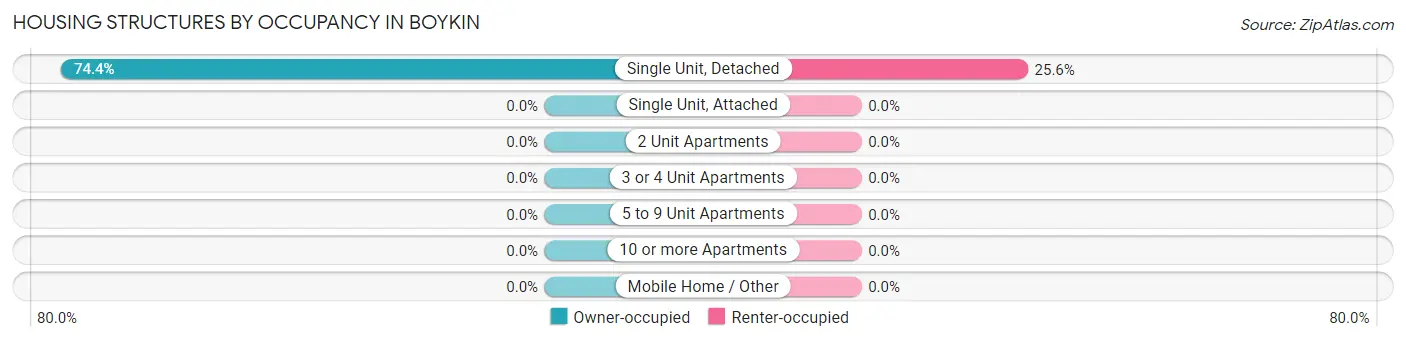
| Structure Type | Owner-occupied | Renter-occupied |
| Single Unit, Detached | 29 (74.4%) | 10 (25.6%) |
| Single Unit, Attached | 0 (0.0%) | 0 (0.0%) |
| 2 Unit Apartments | 0 (0.0%) | 0 (0.0%) |
| 3 or 4 Unit Apartments | 0 (0.0%) | 0 (0.0%) |
| 5 to 9 Unit Apartments | 0 (0.0%) | 0 (0.0%) |
| 10 or more Apartments | 0 (0.0%) | 0 (0.0%) |
| Mobile Home / Other | 0 (0.0%) | 0 (0.0%) |
| Total | 29 (74.4%) | 10 (25.6%) |
Housing Structures by Number of Rooms in Boykin
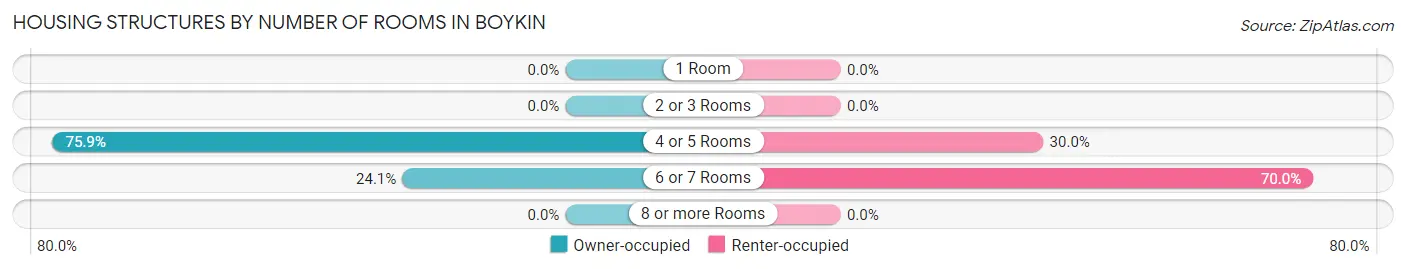
| Number of Rooms | Owner-occupied | Renter-occupied |
| 1 Room | 0 (0.0%) | 0 (0.0%) |
| 2 or 3 Rooms | 0 (0.0%) | 0 (0.0%) |
| 4 or 5 Rooms | 22 (75.9%) | 3 (30.0%) |
| 6 or 7 Rooms | 7 (24.1%) | 7 (70.0%) |
| 8 or more Rooms | 0 (0.0%) | 0 (0.0%) |
| Total | 29 (100.0%) | 10 (100.0%) |
Housing Structure by Heating Type in Boykin
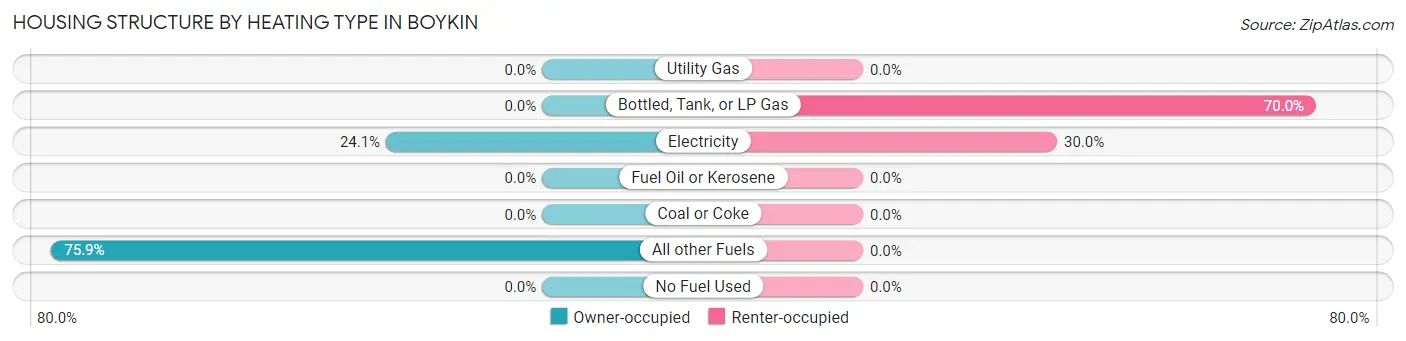
| Heating Type | Owner-occupied | Renter-occupied |
| Utility Gas | 0 (0.0%) | 0 (0.0%) |
| Bottled, Tank, or LP Gas | 0 (0.0%) | 7 (70.0%) |
| Electricity | 7 (24.1%) | 3 (30.0%) |
| Fuel Oil or Kerosene | 0 (0.0%) | 0 (0.0%) |
| Coal or Coke | 0 (0.0%) | 0 (0.0%) |
| All other Fuels | 22 (75.9%) | 0 (0.0%) |
| No Fuel Used | 0 (0.0%) | 0 (0.0%) |
| Total | 29 (100.0%) | 10 (100.0%) |
Household Vehicle Usage in Boykin
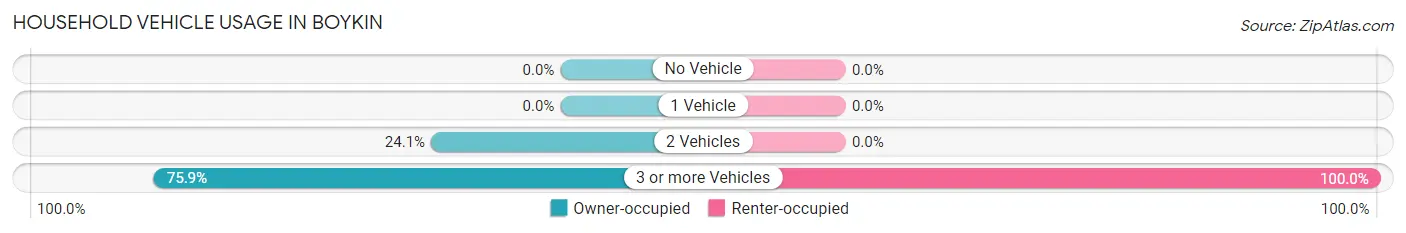
| Vehicles per Household | Owner-occupied | Renter-occupied |
| No Vehicle | 0 (0.0%) | 0 (0.0%) |
| 1 Vehicle | 0 (0.0%) | 0 (0.0%) |
| 2 Vehicles | 7 (24.1%) | 0 (0.0%) |
| 3 or more Vehicles | 22 (75.9%) | 10 (100.0%) |
| Total | 29 (100.0%) | 10 (100.0%) |
Real Estate & Mortgages in Boykin
Real Estate and Mortgage Overview in Boykin
| Characteristic | Without Mortgage | With Mortgage |
| Housing Units | 22 | 7 |
| Median Property Value | - | - |
| Median Household Income | - | - |
| Monthly Housing Costs | - | - |
| Real Estate Taxes | - | - |
Property Value by Mortgage Status in Boykin
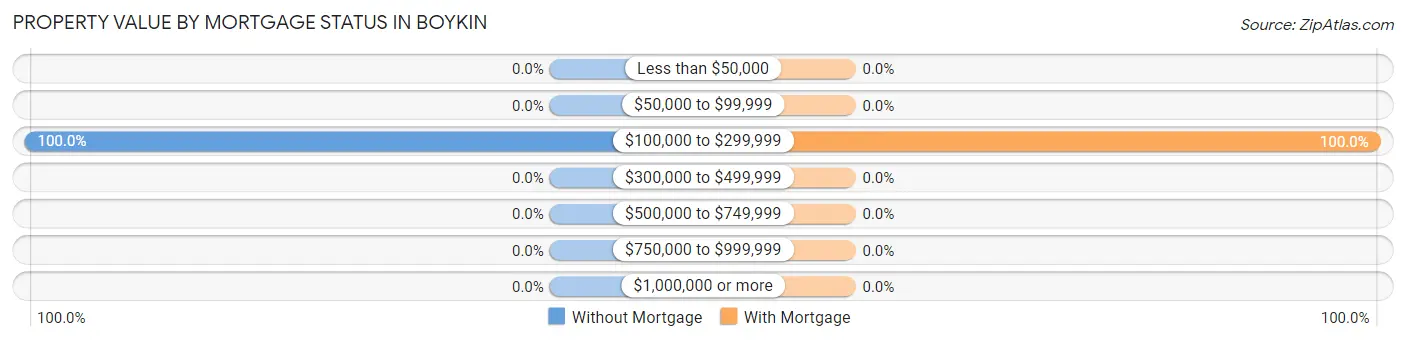
| Property Value | Without Mortgage | With Mortgage |
| Less than $50,000 | 0 (0.0%) | 0 (0.0%) |
| $50,000 to $99,999 | 0 (0.0%) | 0 (0.0%) |
| $100,000 to $299,999 | 22 (100.0%) | 7 (100.0%) |
| $300,000 to $499,999 | 0 (0.0%) | 0 (0.0%) |
| $500,000 to $749,999 | 0 (0.0%) | 0 (0.0%) |
| $750,000 to $999,999 | 0 (0.0%) | 0 (0.0%) |
| $1,000,000 or more | 0 (0.0%) | 0 (0.0%) |
| Total | 22 (100.0%) | 7 (100.0%) |
Household Income by Mortgage Status in Boykin
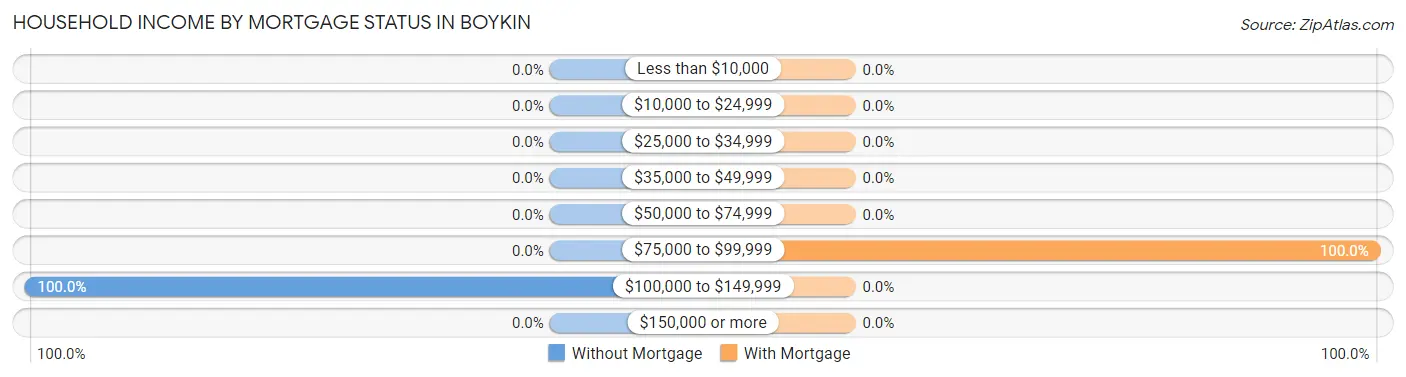
| Household Income | Without Mortgage | With Mortgage |
| Less than $10,000 | 0 (0.0%) | 0 (0.0%) |
| $10,000 to $24,999 | 0 (0.0%) | 0 (0.0%) |
| $25,000 to $34,999 | 0 (0.0%) | 0 (0.0%) |
| $35,000 to $49,999 | 0 (0.0%) | 0 (0.0%) |
| $50,000 to $74,999 | 0 (0.0%) | 0 (0.0%) |
| $75,000 to $99,999 | 0 (0.0%) | 7 (100.0%) |
| $100,000 to $149,999 | 22 (100.0%) | 0 (0.0%) |
| $150,000 or more | 0 (0.0%) | 0 (0.0%) |
| Total | 22 (100.0%) | 7 (100.0%) |
Property Value to Household Income Ratio in Boykin
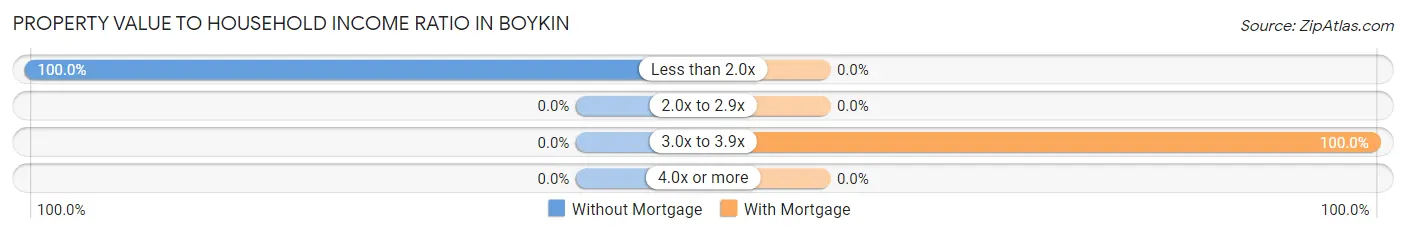
| Value-to-Income Ratio | Without Mortgage | With Mortgage |
| Less than 2.0x | 22 (100.0%) | 0 (0.0%) |
| 2.0x to 2.9x | 0 (0.0%) | 0 (0.0%) |
| 3.0x to 3.9x | 0 (0.0%) | 7 (100.0%) |
| 4.0x or more | 0 (0.0%) | 0 (0.0%) |
| Total | 22 (100.0%) | 7 (100.0%) |
Real Estate Taxes by Mortgage Status in Boykin
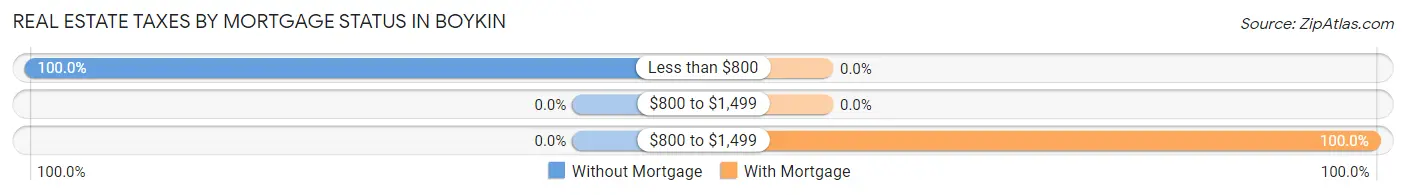
| Property Taxes | Without Mortgage | With Mortgage |
| Less than $800 | 22 (100.0%) | 0 (0.0%) |
| $800 to $1,499 | 0 (0.0%) | 0 (0.0%) |
| $800 to $1,499 | 0 (0.0%) | 7 (100.0%) |
| Total | 22 (100.0%) | 7 (100.0%) |
Health & Disability in Boykin
Health Insurance Coverage by Age in Boykin
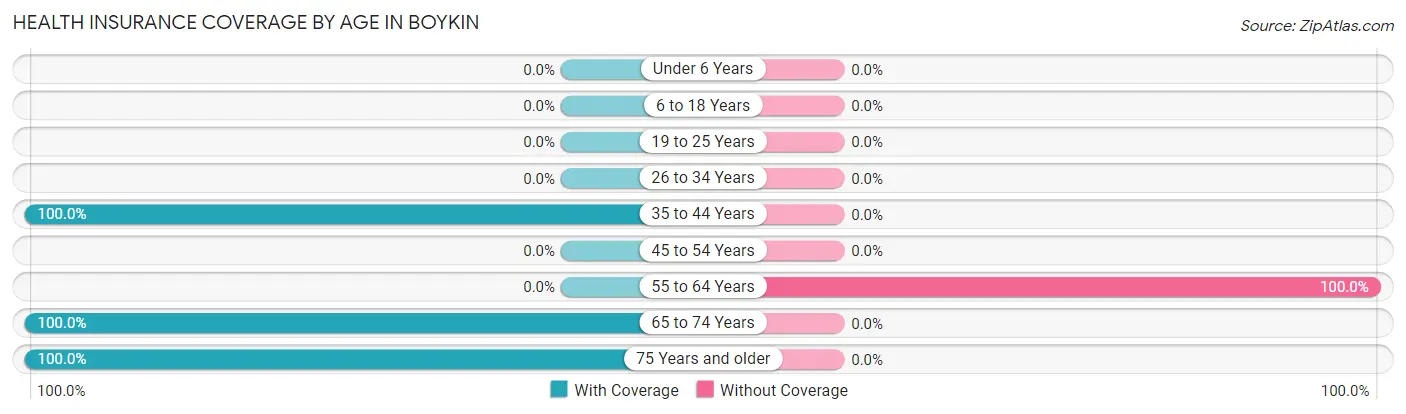
| Age Bracket | With Coverage | Without Coverage |
| Under 6 Years | 0 (0.0%) | 0 (0.0%) |
| 6 to 18 Years | 0 (0.0%) | 0 (0.0%) |
| 19 to 25 Years | 0 (0.0%) | 0 (0.0%) |
| 26 to 34 Years | 0 (0.0%) | 0 (0.0%) |
| 35 to 44 Years | 35 (100.0%) | 0 (0.0%) |
| 45 to 54 Years | 0 (0.0%) | 0 (0.0%) |
| 55 to 64 Years | 0 (0.0%) | 3 (100.0%) |
| 65 to 74 Years | 64 (100.0%) | 0 (0.0%) |
| 75 Years and older | 7 (100.0%) | 0 (0.0%) |
| Total | 106 (97.3%) | 3 (2.8%) |
Health Insurance Coverage by Citizenship Status in Boykin
| Citizenship Status | With Coverage | Without Coverage |
| Native Born | 0 (0.0%) | 0 (0.0%) |
| Foreign Born, Citizen | 0 (0.0%) | 0 (0.0%) |
| Foreign Born, not a Citizen | 0 (0.0%) | 0 (0.0%) |
Health Insurance Coverage by Household Income in Boykin
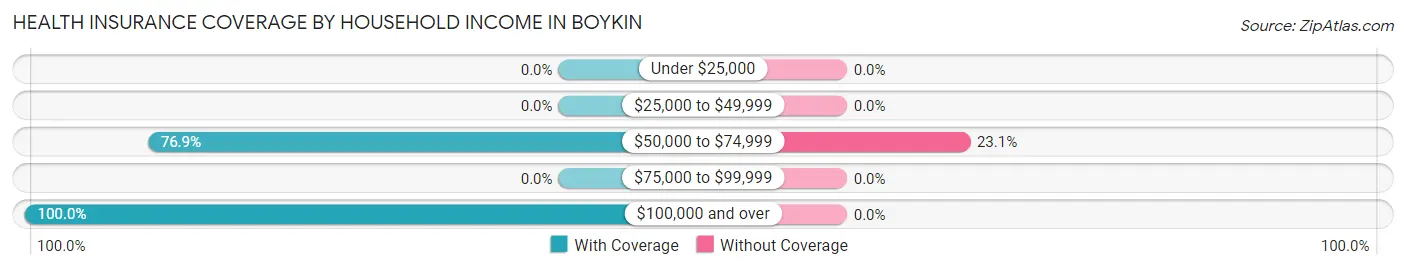
| Household Income | With Coverage | Without Coverage |
| Under $25,000 | 0 (0.0%) | 0 (0.0%) |
| $25,000 to $49,999 | 0 (0.0%) | 0 (0.0%) |
| $50,000 to $74,999 | 10 (76.9%) | 3 (23.1%) |
| $75,000 to $99,999 | 0 (0.0%) | 0 (0.0%) |
| $100,000 and over | 96 (100.0%) | 0 (0.0%) |
Public vs Private Health Insurance Coverage by Age in Boykin
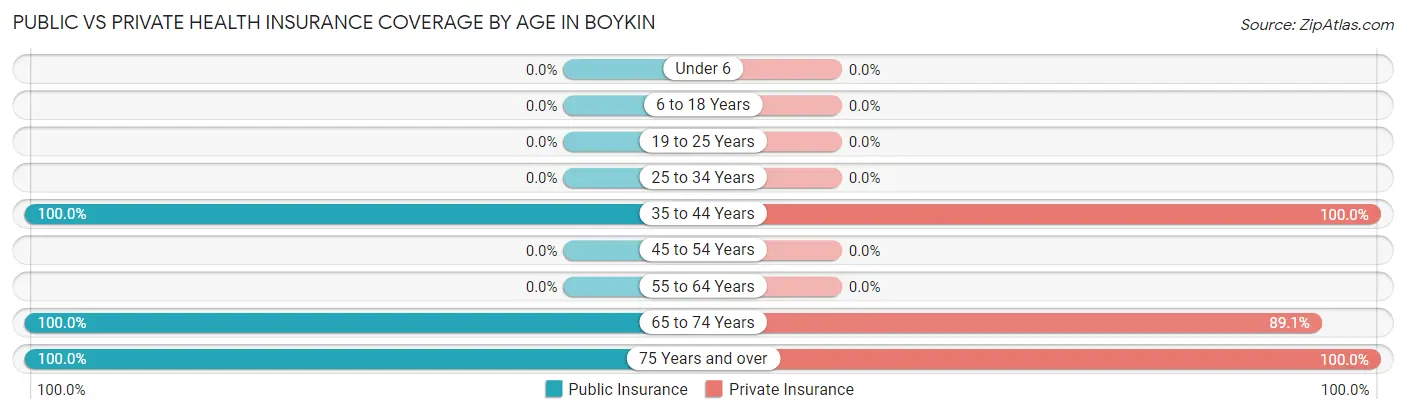
| Age Bracket | Public Insurance | Private Insurance |
| Under 6 | 0 (0.0%) | 0 (0.0%) |
| 6 to 18 Years | 0 (0.0%) | 0 (0.0%) |
| 19 to 25 Years | 0 (0.0%) | 0 (0.0%) |
| 25 to 34 Years | 0 (0.0%) | 0 (0.0%) |
| 35 to 44 Years | 35 (100.0%) | 35 (100.0%) |
| 45 to 54 Years | 0 (0.0%) | 0 (0.0%) |
| 55 to 64 Years | 0 (0.0%) | 0 (0.0%) |
| 65 to 74 Years | 64 (100.0%) | 57 (89.1%) |
| 75 Years and over | 7 (100.0%) | 7 (100.0%) |
| Total | 106 (97.3%) | 99 (90.8%) |
Disability Status by Sex by Age in Boykin
| Age Bracket | Male | Female |
| Under 5 Years | 0 (0.0%) | 0 (0.0%) |
| 5 to 17 Years | 0 (0.0%) | 0 (0.0%) |
| 18 to 34 Years | 0 (0.0%) | 0 (0.0%) |
| 35 to 64 Years | 0 (0.0%) | 0 (0.0%) |
| 65 to 74 Years | 0 (0.0%) | 0 (0.0%) |
| 75 Years and over | 0 (0.0%) | 0 (0.0%) |
Disability Class by Sex by Age in Boykin
Disability Class: Hearing Difficulty
| Age Bracket | Male | Female |
| Under 5 Years | 0 (0.0%) | 0 (0.0%) |
| 5 to 17 Years | 0 (0.0%) | 0 (0.0%) |
| 18 to 34 Years | 0 (0.0%) | 0 (0.0%) |
| 35 to 64 Years | 0 (0.0%) | 0 (0.0%) |
| 65 to 74 Years | 0 (0.0%) | 0 (0.0%) |
| 75 Years and over | 0 (0.0%) | 0 (0.0%) |
Disability Class: Vision Difficulty
| Age Bracket | Male | Female |
| Under 5 Years | 0 (0.0%) | 0 (0.0%) |
| 5 to 17 Years | 0 (0.0%) | 0 (0.0%) |
| 18 to 34 Years | 0 (0.0%) | 0 (0.0%) |
| 35 to 64 Years | 0 (0.0%) | 0 (0.0%) |
| 65 to 74 Years | 0 (0.0%) | 0 (0.0%) |
| 75 Years and over | 0 (0.0%) | 0 (0.0%) |
Disability Class: Cognitive Difficulty
| Age Bracket | Male | Female |
| 5 to 17 Years | 0 (0.0%) | 0 (0.0%) |
| 18 to 34 Years | 0 (0.0%) | 0 (0.0%) |
| 35 to 64 Years | 0 (0.0%) | 0 (0.0%) |
| 65 to 74 Years | 0 (0.0%) | 0 (0.0%) |
| 75 Years and over | 0 (0.0%) | 0 (0.0%) |
Disability Class: Ambulatory Difficulty
| Age Bracket | Male | Female |
| 5 to 17 Years | 0 (0.0%) | 0 (0.0%) |
| 18 to 34 Years | 0 (0.0%) | 0 (0.0%) |
| 35 to 64 Years | 0 (0.0%) | 0 (0.0%) |
| 65 to 74 Years | 0 (0.0%) | 0 (0.0%) |
| 75 Years and over | 0 (0.0%) | 0 (0.0%) |
Disability Class: Self-Care Difficulty
| Age Bracket | Male | Female |
| 5 to 17 Years | 0 (0.0%) | 0 (0.0%) |
| 18 to 34 Years | 0 (0.0%) | 0 (0.0%) |
| 35 to 64 Years | 0 (0.0%) | 0 (0.0%) |
| 65 to 74 Years | 0 (0.0%) | 0 (0.0%) |
| 75 Years and over | 0 (0.0%) | 0 (0.0%) |
Technology Access in Boykin
Computing Device Access in Boykin
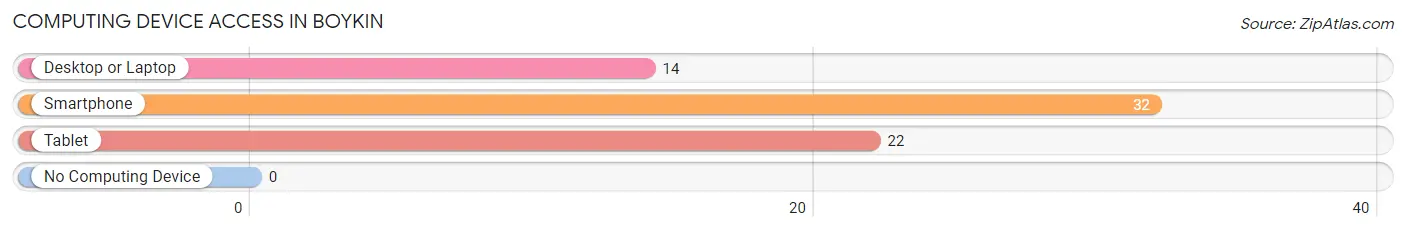
| Device Type | # Households | % Households |
| Desktop or Laptop | 14 | 35.9% |
| Smartphone | 32 | 82.1% |
| Tablet | 22 | 56.4% |
| No Computing Device | 0 | 0.0% |
| Total | 39 | 100.0% |
Internet Access in Boykin
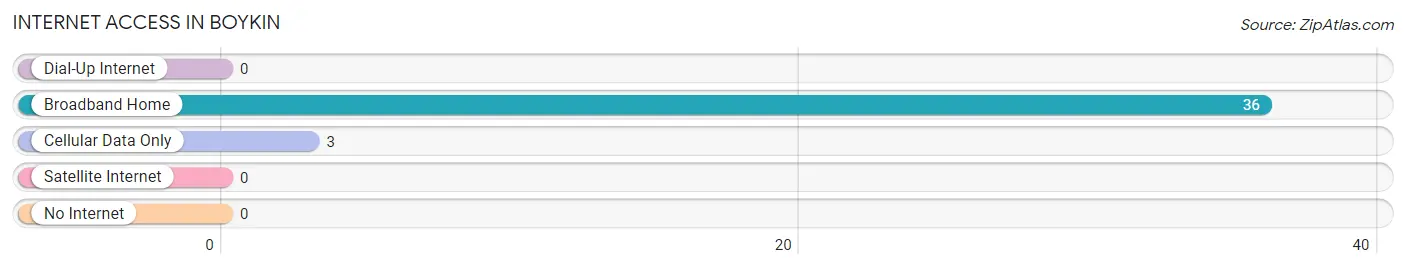
| Internet Type | # Households | % Households |
| Dial-Up Internet | 0 | 0.0% |
| Broadband Home | 36 | 92.3% |
| Cellular Data Only | 3 | 7.7% |
| Satellite Internet | 0 | 0.0% |
| No Internet | 0 | 0.0% |
| Total | 39 | 100.0% |
Boykin Summary
The town of Boykin, South Carolina is located in Kershaw County, approximately 25 miles east of Columbia, the state capital. It is a small, rural community with a population of just over 500 people. The town was founded in 1820 and named after the Boykin family, who were among the first settlers in the area.
Geographically, Boykin is located in the Piedmont region of South Carolina, which is characterized by rolling hills and flat plains. The town is situated on the banks of the Wateree River, which provides a source of recreation for the locals. The climate in Boykin is mild, with temperatures ranging from the mid-50s in the winter to the mid-80s in the summer.
The economy of Boykin is largely based on agriculture. The town is home to several farms, which produce a variety of crops, including cotton, soybeans, corn, and wheat. In addition, there are several small businesses in the area, including a grocery store, a hardware store, and a few restaurants.
The demographics of Boykin are largely white, with a small African American population. The median household income is approximately $30,000, and the median age is around 40 years old. The town is served by the Kershaw County School District, which includes two elementary schools, a middle school, and a high school.
Boykin is a small, rural town with a rich history and a strong sense of community. It is a great place to live and raise a family, and its residents take pride in their town and its traditions. The town is a great example of the beauty and charm of rural South Carolina.
Common Questions
What is Per Capita Income in Boykin?
Per Capita income in Boykin is $46,057.
What is the Median Household income in Boykin?
Median Household Income in Boykin is $128,580.
What is Inequality or Gini Index in Boykin?
Inequality or Gini Index in Boykin is 0.15.
What is the Total Population of Boykin?
Total Population of Boykin is 109.
What is the Total Male Population of Boykin?
Total Male Population of Boykin is 42.
What is the Total Female Population of Boykin?
Total Female Population of Boykin is 67.
What is the Ratio of Males per 100 Females in Boykin?
There are 62.69 Males per 100 Females in Boykin.
What is the Ratio of Females per 100 Males in Boykin?
There are 159.52 Females per 100 Males in Boykin.
What is the Median Population Age in Boykin?
Median Population Age in Boykin is 66.7 Years.
What is the Average Family Size in Boykin
Average Family Size in Boykin is 3.3 People.
What is the Average Household Size in Boykin
Average Household Size in Boykin is 2.8 People.
How Large is the Labor Force in Boykin?
There are 102 People in the Labor Forcein in Boykin.
What is the Percentage of People in the Labor Force in Boykin?
93.6% of People are in the Labor Force in Boykin.