Zip Codes with the Highest Percentage of Population Employed in Installation, Maintenance & Repair in Seneca, SC
RELATED REPORTS & OPTIONS
Installation, Maintenance & Repair
Seneca
Compare Zip Codes
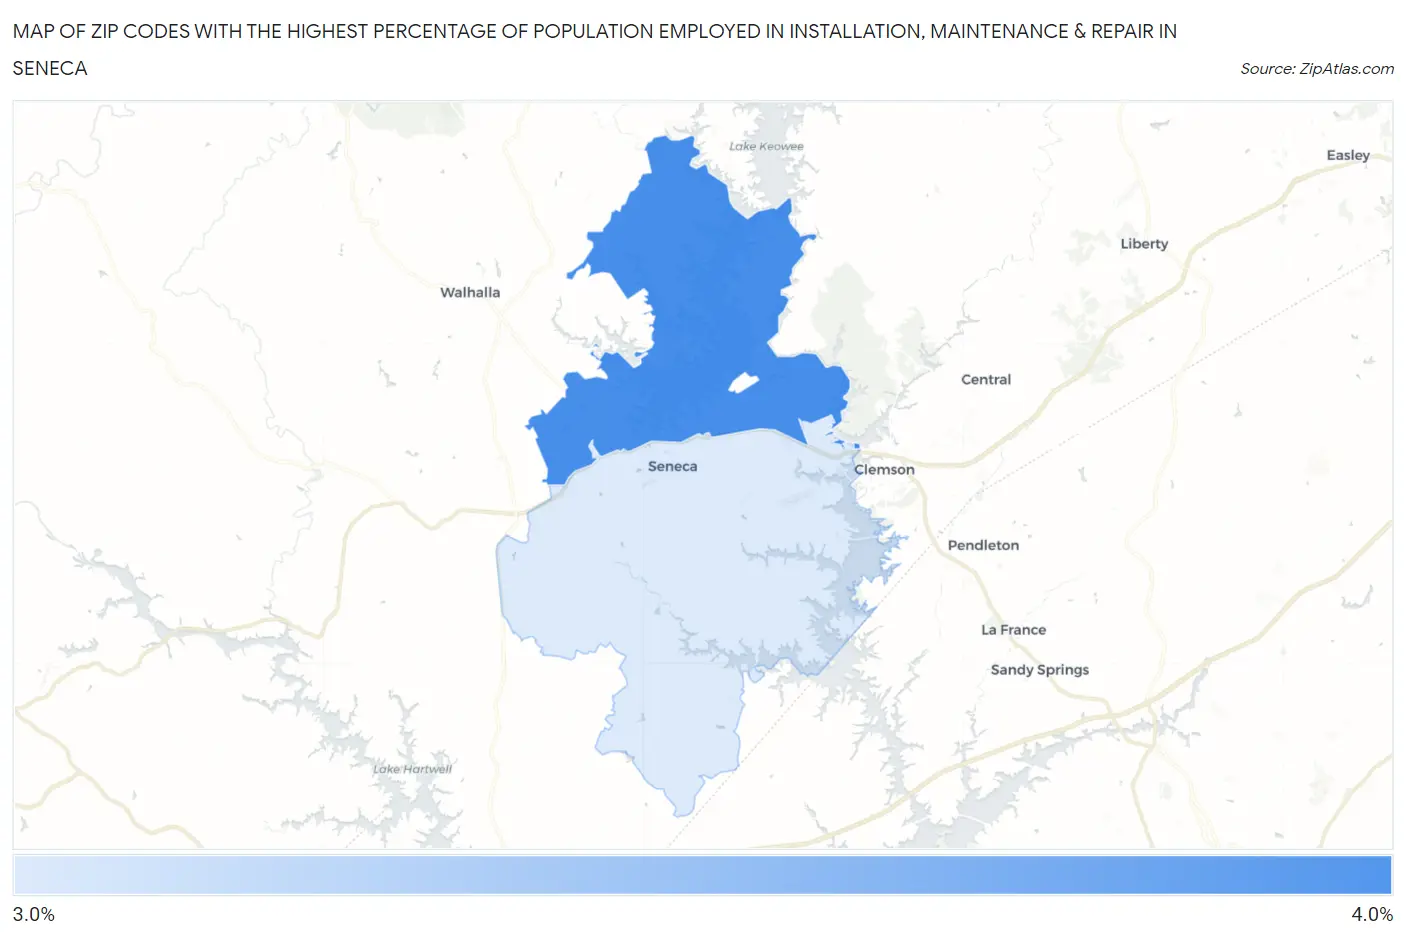
Map of Zip Codes with the Highest Percentage of Population Employed in Installation, Maintenance & Repair in Seneca
3.3%
3.3%
Zip Codes with the Highest Percentage of Population Employed in Installation, Maintenance & Repair in Seneca, SC
| Zip Code | % Employed | vs State | vs National | |
| 1. | 29672 | 3.3% | 3.8%(-0.481)#220 | 3.1%(+0.256)#15,439 |
| 2. | 29678 | 3.3% | 3.8%(-0.548)#226 | 3.1%(+0.190)#15,763 |
1
Common Questions
What are the Top Zip Codes with the Highest Percentage of Population Employed in Installation, Maintenance & Repair in Seneca, SC?
Top Zip Codes with the Highest Percentage of Population Employed in Installation, Maintenance & Repair in Seneca, SC are:
What zip code has the Highest Percentage of Population Employed in Installation, Maintenance & Repair in Seneca, SC?
29672 has the Highest Percentage of Population Employed in Installation, Maintenance & Repair in Seneca, SC with 3.3%.
What is the Percentage of Population Employed in Installation, Maintenance & Repair in Seneca, SC?
Percentage of Population Employed in Installation, Maintenance & Repair in Seneca is 3.0%.
What is the Percentage of Population Employed in Installation, Maintenance & Repair in South Carolina?
Percentage of Population Employed in Installation, Maintenance & Repair in South Carolina is 3.8%.
What is the Percentage of Population Employed in Installation, Maintenance & Repair in the United States?
Percentage of Population Employed in Installation, Maintenance & Repair in the United States is 3.1%.