Zip Codes with the Highest Percentage of Population Employed in Installation, Maintenance & Repair in Orangeburg, SC
RELATED REPORTS & OPTIONS
Installation, Maintenance & Repair
Orangeburg
Compare Zip Codes
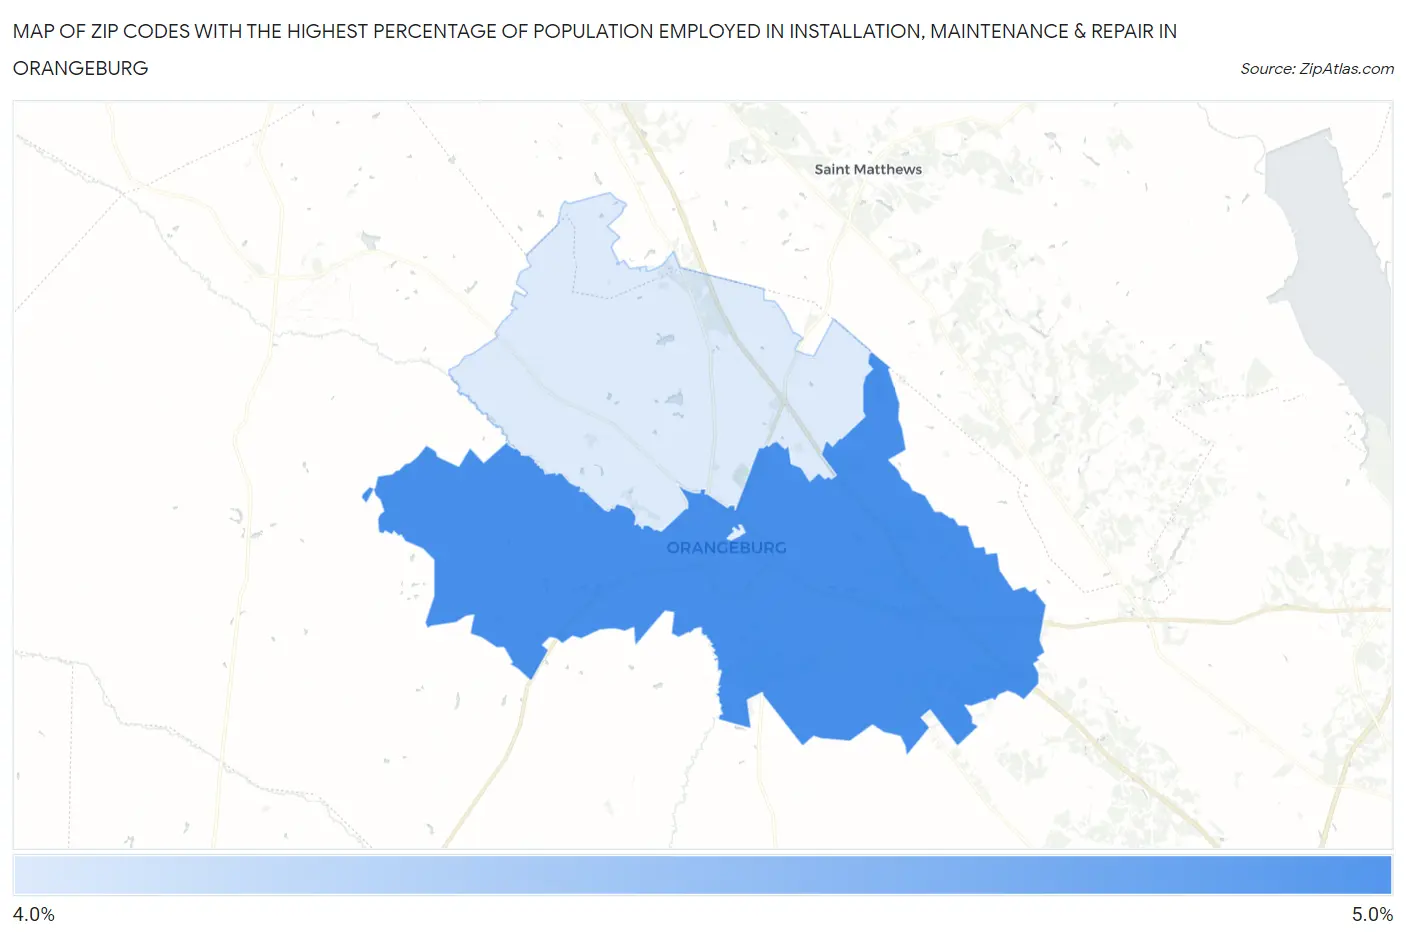
Map of Zip Codes with the Highest Percentage of Population Employed in Installation, Maintenance & Repair in Orangeburg
4.1%
4.4%
Zip Codes with the Highest Percentage of Population Employed in Installation, Maintenance & Repair in Orangeburg, SC
| Zip Code | % Employed | vs State | vs National | |
| 1. | 29115 | 4.4% | 3.8%(+0.605)#157 | 3.1%(+1.34)#10,733 |
| 2. | 29118 | 4.1% | 3.8%(+0.279)#177 | 3.1%(+1.02)#11,987 |
1
Common Questions
What are the Top Zip Codes with the Highest Percentage of Population Employed in Installation, Maintenance & Repair in Orangeburg, SC?
Top Zip Codes with the Highest Percentage of Population Employed in Installation, Maintenance & Repair in Orangeburg, SC are:
What zip code has the Highest Percentage of Population Employed in Installation, Maintenance & Repair in Orangeburg, SC?
29115 has the Highest Percentage of Population Employed in Installation, Maintenance & Repair in Orangeburg, SC with 4.4%.
What is the Percentage of Population Employed in Installation, Maintenance & Repair in Orangeburg, SC?
Percentage of Population Employed in Installation, Maintenance & Repair in Orangeburg is 5.6%.
What is the Percentage of Population Employed in Installation, Maintenance & Repair in South Carolina?
Percentage of Population Employed in Installation, Maintenance & Repair in South Carolina is 3.8%.
What is the Percentage of Population Employed in Installation, Maintenance & Repair in the United States?
Percentage of Population Employed in Installation, Maintenance & Repair in the United States is 3.1%.