Zip Codes with the Highest Percentage of Population Employed in Accommodation & Food Services in Oregon
RELATED REPORTS & OPTIONS
Accommodation & Food Services
Oregon
Compare Zip Codes
Map of Zip Codes with the Highest Percentage of Population Employed in Accommodation & Food Services in Oregon
0.0%
100.0%
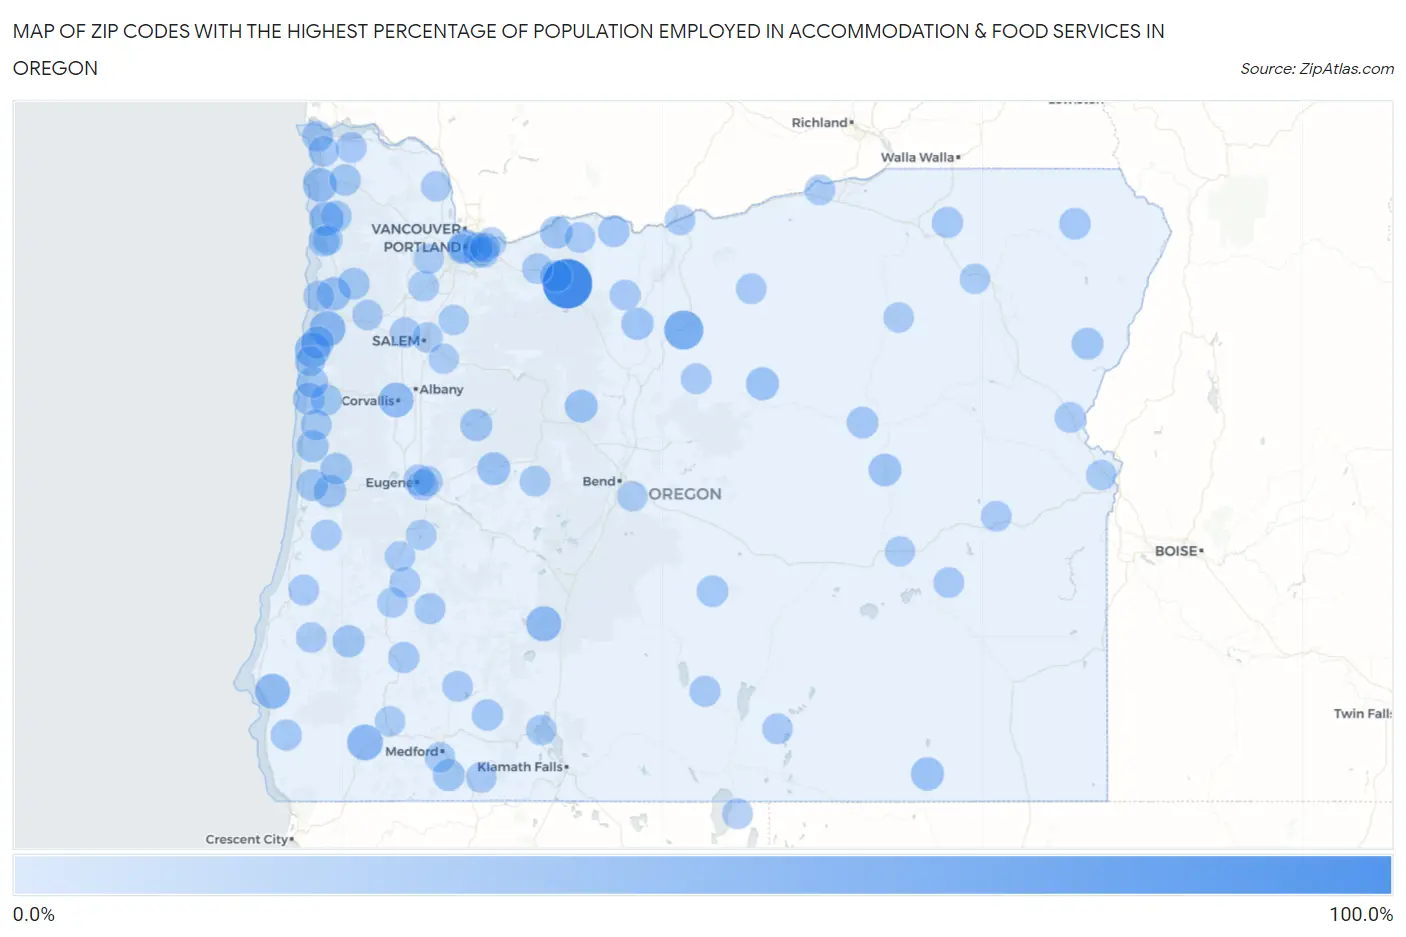
Zip Codes with the Highest Percentage of Population Employed in Accommodation & Food Services in Oregon
| Zip Code | % Employed | vs State | vs National | |
| 1. | 97028 | 100.0% | 7.2%(+92.8)#1 | 6.9%(+93.1)#6 |
| 2. | 97057 | 50.0% | 7.2%(+42.8)#2 | 6.9%(+43.1)#101 |
| 3. | 97368 | 34.5% | 7.2%(+27.3)#3 | 6.9%(+27.6)#231 |
| 4. | 97543 | 34.3% | 7.2%(+27.0)#4 | 6.9%(+27.4)#241 |
| 5. | 97388 | 31.7% | 7.2%(+24.5)#5 | 6.9%(+24.8)#287 |
| 6. | 97731 | 31.2% | 7.2%(+23.9)#6 | 6.9%(+24.3)#295 |
| 7. | 97465 | 30.9% | 7.2%(+23.7)#7 | 6.9%(+24.0)#307 |
| 8. | 97331 | 29.5% | 7.2%(+22.3)#8 | 6.9%(+22.6)#343 |
| 9. | 97147 | 27.4% | 7.2%(+20.2)#9 | 6.9%(+20.5)#408 |
| 10. | 97110 | 25.9% | 7.2%(+18.7)#10 | 6.9%(+19.0)#468 |
| 11. | 97112 | 24.0% | 7.2%(+16.8)#11 | 6.9%(+17.1)#559 |
| 12. | 97204 | 22.6% | 7.2%(+15.4)#12 | 6.9%(+15.7)#642 |
| 13. | 97750 | 21.8% | 7.2%(+14.6)#13 | 6.9%(+14.9)#686 |
| 14. | 97488 | 21.6% | 7.2%(+14.4)#14 | 6.9%(+14.7)#703 |
| 15. | 97710 | 21.4% | 7.2%(+14.2)#15 | 6.9%(+14.5)#717 |
| 16. | 97730 | 20.8% | 7.2%(+13.6)#16 | 6.9%(+13.9)#763 |
| 17. | 97367 | 20.3% | 7.2%(+13.0)#17 | 6.9%(+13.4)#811 |
| 18. | 97873 | 19.5% | 7.2%(+12.3)#18 | 6.9%(+12.7)#878 |
| 19. | 97014 | 19.1% | 7.2%(+11.8)#19 | 6.9%(+12.2)#943 |
| 20. | 97453 | 18.9% | 7.2%(+11.6)#20 | 6.9%(+12.0)#962 |
| 21. | 97037 | 18.2% | 7.2%(+11.0)#21 | 6.9%(+11.3)#1,061 |
| 22. | 97345 | 17.9% | 7.2%(+10.7)#22 | 6.9%(+11.0)#1,110 |
| 23. | 97416 | 17.8% | 7.2%(+10.5)#23 | 6.9%(+10.9)#1,134 |
| 24. | 97498 | 17.0% | 7.2%(+9.76)#24 | 6.9%(+10.1)#1,270 |
| 25. | 97540 | 16.7% | 7.2%(+9.47)#25 | 6.9%(+9.81)#1,308 |
| 26. | 97834 | 16.2% | 7.2%(+9.01)#26 | 6.9%(+9.36)#1,405 |
| 27. | 97439 | 16.2% | 7.2%(+8.95)#27 | 6.9%(+9.30)#1,411 |
| 28. | 97366 | 16.1% | 7.2%(+8.91)#28 | 6.9%(+9.25)#1,420 |
| 29. | 97108 | 15.9% | 7.2%(+8.66)#29 | 6.9%(+9.00)#1,476 |
| 30. | 97049 | 15.8% | 7.2%(+8.54)#30 | 6.9%(+8.89)#1,503 |
| 31. | 97480 | 15.7% | 7.2%(+8.44)#31 | 6.9%(+8.78)#1,524 |
| 32. | 97865 | 15.4% | 7.2%(+8.18)#32 | 6.9%(+8.52)#1,574 |
| 33. | 97040 | 15.1% | 7.2%(+7.84)#33 | 6.9%(+8.19)#1,656 |
| 34. | 97391 | 15.0% | 7.2%(+7.79)#34 | 6.9%(+8.13)#1,668 |
| 35. | 97828 | 14.9% | 7.2%(+7.70)#35 | 6.9%(+8.05)#1,686 |
| 36. | 97641 | 14.9% | 7.2%(+7.66)#36 | 6.9%(+8.00)#1,706 |
| 37. | 97522 | 14.3% | 7.2%(+7.06)#37 | 6.9%(+7.40)#1,877 |
| 38. | 97138 | 14.1% | 7.2%(+6.90)#38 | 6.9%(+7.25)#1,927 |
| 39. | 97365 | 14.0% | 7.2%(+6.78)#39 | 6.9%(+7.12)#1,968 |
| 40. | 97417 | 13.4% | 7.2%(+6.20)#40 | 6.9%(+6.54)#2,165 |
| 41. | 97810 | 13.1% | 7.2%(+5.88)#41 | 6.9%(+6.23)#2,302 |
| 42. | 97443 | 12.8% | 7.2%(+5.57)#42 | 6.9%(+5.91)#2,439 |
| 43. | 97131 | 12.8% | 7.2%(+5.55)#43 | 6.9%(+5.89)#2,445 |
| 44. | 97444 | 12.7% | 7.2%(+5.46)#44 | 6.9%(+5.81)#2,483 |
| 45. | 97636 | 12.5% | 7.2%(+5.27)#45 | 6.9%(+5.62)#2,594 |
| 46. | 97401 | 12.4% | 7.2%(+5.13)#46 | 6.9%(+5.47)#2,654 |
| 47. | 97394 | 12.2% | 7.2%(+4.96)#47 | 6.9%(+5.31)#2,722 |
| 48. | 97121 | 12.0% | 7.2%(+4.78)#48 | 6.9%(+5.13)#2,824 |
| 49. | 97135 | 11.9% | 7.2%(+4.69)#49 | 6.9%(+5.04)#2,886 |
| 50. | 97403 | 11.8% | 7.2%(+4.54)#50 | 6.9%(+4.89)#2,977 |
| 51. | 97479 | 11.5% | 7.2%(+4.30)#51 | 6.9%(+4.64)#3,145 |
| 52. | 97413 | 11.5% | 7.2%(+4.27)#52 | 6.9%(+4.62)#3,159 |
| 53. | 97011 | 11.4% | 7.2%(+4.22)#53 | 6.9%(+4.56)#3,199 |
| 54. | 97103 | 11.4% | 7.2%(+4.18)#54 | 6.9%(+4.53)#3,225 |
| 55. | 97541 | 11.4% | 7.2%(+4.16)#55 | 6.9%(+4.51)#3,241 |
| 56. | 97420 | 11.4% | 7.2%(+4.12)#56 | 6.9%(+4.47)#3,281 |
| 57. | 97635 | 11.3% | 7.2%(+4.11)#57 | 6.9%(+4.46)#3,288 |
| 58. | 97732 | 11.3% | 7.2%(+4.02)#58 | 6.9%(+4.37)#3,361 |
| 59. | 97063 | 11.1% | 7.2%(+3.89)#59 | 6.9%(+4.23)#3,458 |
| 60. | 97711 | 11.1% | 7.2%(+3.89)#60 | 6.9%(+4.23)#3,474 |
| 61. | 97467 | 11.1% | 7.2%(+3.85)#61 | 6.9%(+4.20)#3,494 |
| 62. | 97907 | 11.0% | 7.2%(+3.75)#62 | 6.9%(+4.10)#3,569 |
| 63. | 97146 | 10.9% | 7.2%(+3.63)#63 | 6.9%(+3.97)#3,672 |
| 64. | 97520 | 10.8% | 7.2%(+3.56)#64 | 6.9%(+3.90)#3,734 |
| 65. | 97031 | 10.8% | 7.2%(+3.54)#65 | 6.9%(+3.89)#3,741 |
| 66. | 97458 | 10.7% | 7.2%(+3.52)#66 | 6.9%(+3.86)#3,767 |
| 67. | 97911 | 10.7% | 7.2%(+3.49)#67 | 6.9%(+3.83)#3,791 |
| 68. | 97823 | 10.6% | 7.2%(+3.42)#68 | 6.9%(+3.76)#3,841 |
| 69. | 97371 | 10.5% | 7.2%(+3.32)#69 | 6.9%(+3.67)#3,942 |
| 70. | 97396 | 10.5% | 7.2%(+3.31)#70 | 6.9%(+3.65)#3,956 |
| 71. | 97266 | 10.5% | 7.2%(+3.29)#71 | 6.9%(+3.63)#3,981 |
| 72. | 97115 | 10.4% | 7.2%(+3.20)#72 | 6.9%(+3.55)#4,073 |
| 73. | 97050 | 10.4% | 7.2%(+3.16)#73 | 6.9%(+3.51)#4,104 |
| 74. | 97495 | 10.3% | 7.2%(+3.04)#74 | 6.9%(+3.38)#4,238 |
| 75. | 97637 | 10.1% | 7.2%(+2.92)#75 | 6.9%(+3.26)#4,363 |
| 76. | 97844 | 10.1% | 7.2%(+2.83)#76 | 6.9%(+3.17)#4,460 |
| 77. | 97201 | 10.0% | 7.2%(+2.81)#77 | 6.9%(+3.16)#4,479 |
| 78. | 97914 | 10.0% | 7.2%(+2.81)#78 | 6.9%(+3.15)#4,494 |
| 79. | 97501 | 10.0% | 7.2%(+2.77)#79 | 6.9%(+3.12)#4,554 |
| 80. | 97051 | 10.0% | 7.2%(+2.77)#80 | 6.9%(+3.11)#4,555 |
| 81. | 97601 | 9.9% | 7.2%(+2.72)#81 | 6.9%(+3.06)#4,611 |
| 82. | 97123 | 9.9% | 7.2%(+2.68)#82 | 6.9%(+3.02)#4,661 |
| 83. | 97720 | 9.9% | 7.2%(+2.67)#83 | 6.9%(+3.01)#4,669 |
| 84. | 97301 | 9.9% | 7.2%(+2.64)#84 | 6.9%(+2.99)#4,706 |
| 85. | 97880 | 9.8% | 7.2%(+2.61)#85 | 6.9%(+2.96)#4,736 |
| 86. | 97236 | 9.8% | 7.2%(+2.58)#86 | 6.9%(+2.93)#4,785 |
| 87. | 97118 | 9.8% | 7.2%(+2.54)#87 | 6.9%(+2.88)#4,840 |
| 88. | 97107 | 9.7% | 7.2%(+2.47)#88 | 6.9%(+2.81)#4,933 |
| 89. | 97499 | 9.7% | 7.2%(+2.44)#89 | 6.9%(+2.79)#4,969 |
| 90. | 97424 | 9.6% | 7.2%(+2.37)#90 | 6.9%(+2.71)#5,079 |
| 91. | 97024 | 9.6% | 7.2%(+2.36)#91 | 6.9%(+2.70)#5,094 |
| 92. | 97702 | 9.5% | 7.2%(+2.28)#92 | 6.9%(+2.62)#5,206 |
| 93. | 97477 | 9.4% | 7.2%(+2.20)#93 | 6.9%(+2.55)#5,304 |
| 94. | 97850 | 9.4% | 7.2%(+2.15)#94 | 6.9%(+2.50)#5,381 |
| 95. | 97362 | 9.4% | 7.2%(+2.14)#95 | 6.9%(+2.49)#5,393 |
| 96. | 97216 | 9.3% | 7.2%(+2.11)#96 | 6.9%(+2.46)#5,444 |
| 97. | 97233 | 9.3% | 7.2%(+2.10)#97 | 6.9%(+2.45)#5,459 |
| 98. | 97325 | 9.3% | 7.2%(+2.09)#98 | 6.9%(+2.43)#5,478 |
| 99. | 97341 | 9.3% | 7.2%(+2.04)#99 | 6.9%(+2.38)#5,557 |
| 100. | 97526 | 9.2% | 7.2%(+2.00)#100 | 6.9%(+2.34)#5,623 |
Common Questions
What are the Top 10 Zip Codes with the Highest Percentage of Population Employed in Accommodation & Food Services in Oregon?
Top 10 Zip Codes with the Highest Percentage of Population Employed in Accommodation & Food Services in Oregon are:
What zip code has the Highest Percentage of Population Employed in Accommodation & Food Services in Oregon?
97028 has the Highest Percentage of Population Employed in Accommodation & Food Services in Oregon with 100.0%.
What is the Percentage of Population Employed in Accommodation & Food Services in the State of Oregon?
Percentage of Population Employed in Accommodation & Food Services in Oregon is 7.2%.
What is the Percentage of Population Employed in Accommodation & Food Services in the United States?
Percentage of Population Employed in Accommodation & Food Services in the United States is 6.9%.