Zip Codes with the Highest Percentage of Population Employed in Accommodation & Food Services in Springfield, OR
RELATED REPORTS & OPTIONS
Accommodation & Food Services
Springfield
Compare Zip Codes
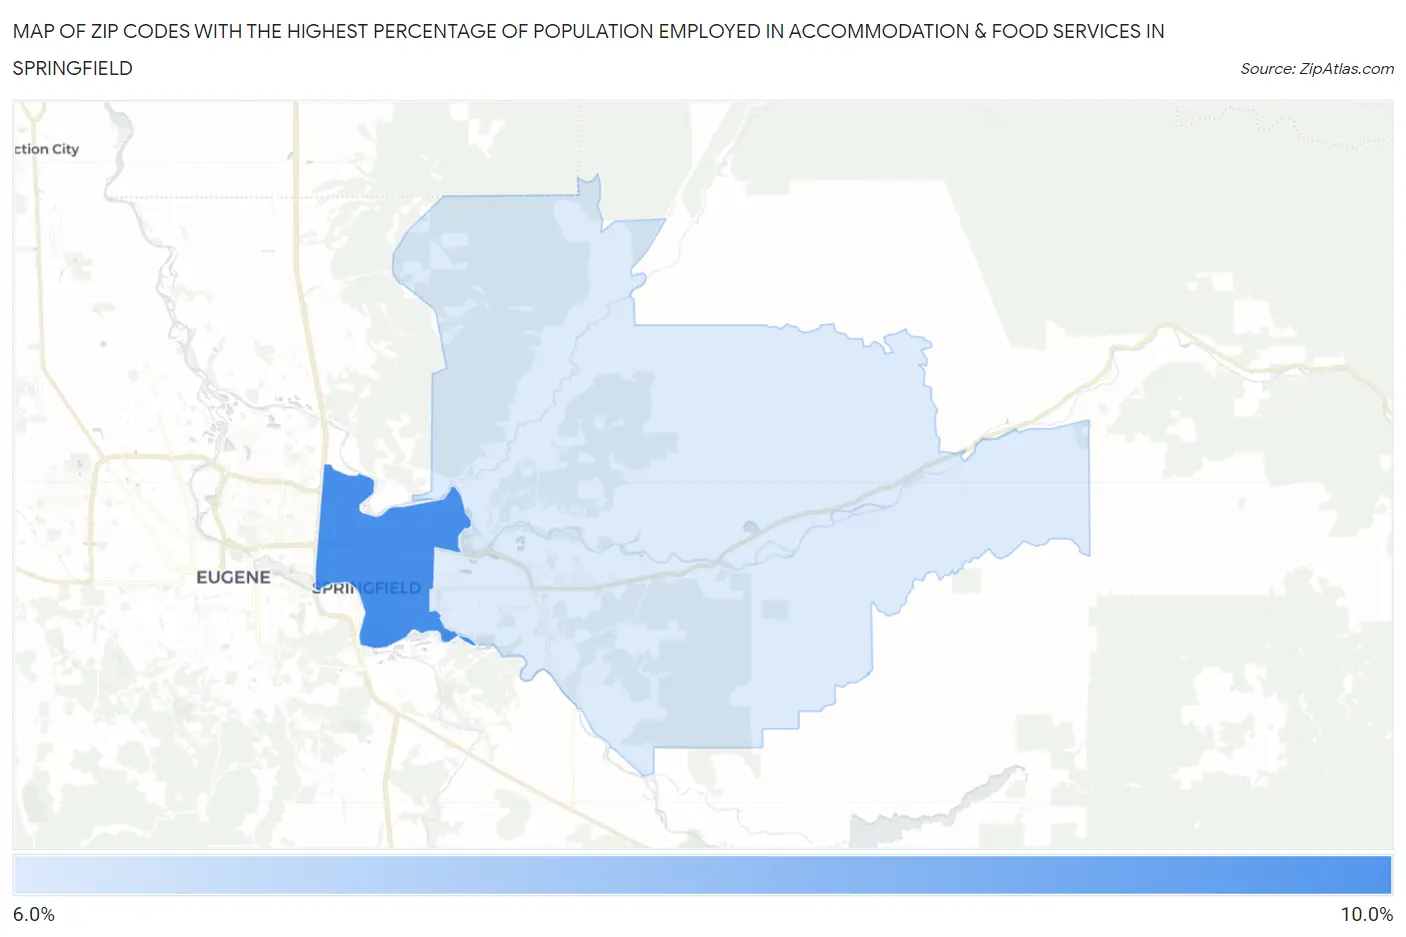
Map of Zip Codes with the Highest Percentage of Population Employed in Accommodation & Food Services in Springfield
6.6%
9.4%
Zip Codes with the Highest Percentage of Population Employed in Accommodation & Food Services in Springfield, OR
| Zip Code | % Employed | vs State | vs National | |
| 1. | 97477 | 9.4% | 7.2%(+2.20)#93 | 6.9%(+2.55)#5,304 |
| 2. | 97478 | 6.6% | 7.2%(-0.657)#186 | 6.9%(-0.312)#11,618 |
1
Common Questions
What are the Top Zip Codes with the Highest Percentage of Population Employed in Accommodation & Food Services in Springfield, OR?
Top Zip Codes with the Highest Percentage of Population Employed in Accommodation & Food Services in Springfield, OR are:
What zip code has the Highest Percentage of Population Employed in Accommodation & Food Services in Springfield, OR?
97477 has the Highest Percentage of Population Employed in Accommodation & Food Services in Springfield, OR with 9.4%.
What is the Percentage of Population Employed in Accommodation & Food Services in Springfield, OR?
Percentage of Population Employed in Accommodation & Food Services in Springfield is 8.9%.
What is the Percentage of Population Employed in Accommodation & Food Services in Oregon?
Percentage of Population Employed in Accommodation & Food Services in Oregon is 7.2%.
What is the Percentage of Population Employed in Accommodation & Food Services in the United States?
Percentage of Population Employed in Accommodation & Food Services in the United States is 6.9%.