Tumalo, OR Map & Demographics
Tumalo Map
Tumalo Overview
$34,332
PER CAPITA INCOME
$62,379
AVG HOUSEHOLD INCOME
0.42
INEQUALITY / GINI INDEX
687
TOTAL POPULATION
256
MALE POPULATION
431
FEMALE POPULATION
59.40
MALES / 100 FEMALES
168.36
FEMALES / 100 MALES
42.8
MEDIAN AGE
3.2
AVG FAMILY SIZE
3.3
AVG HOUSEHOLD SIZE
345
LABOR FORCE [ PEOPLE ]
61.0%
PERCENT IN LABOR FORCE
Income in Tumalo
Income Overview in Tumalo
| Characteristic | Number | Measure |
| Per Capita Income | 687 | $34,332 |
| Median Family Income | 189 | $0 |
| Mean Family Income | 189 | $109,101 |
| Median Household Income | 206 | $62,379 |
| Mean Household Income | 206 | $112,774 |
| Income Deficit | 189 | $0 |
| Wage / Income Gap (%) | 687 | 0.00% |
| Wage / Income Gap ($) | 687 | 100.00¢ per $1 |
| Gini / Inequality Index | 687 | 0.42 |
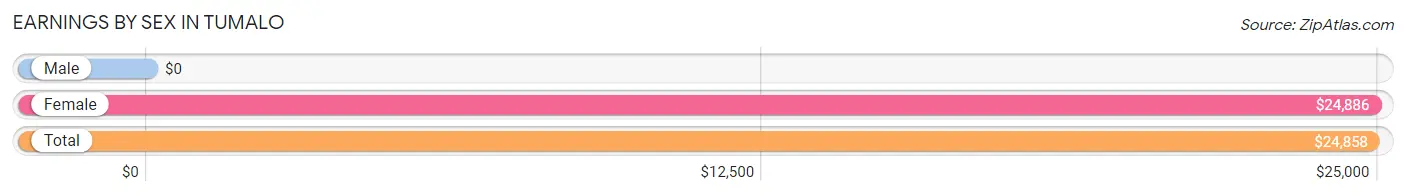
Earnings by Sex in Tumalo
| Sex | Number | Average Earnings |
| Male | 168 (48.7%) | $0 |
| Female | 177 (51.3%) | $24,886 |
| Total | 345 (100.0%) | $24,858 |
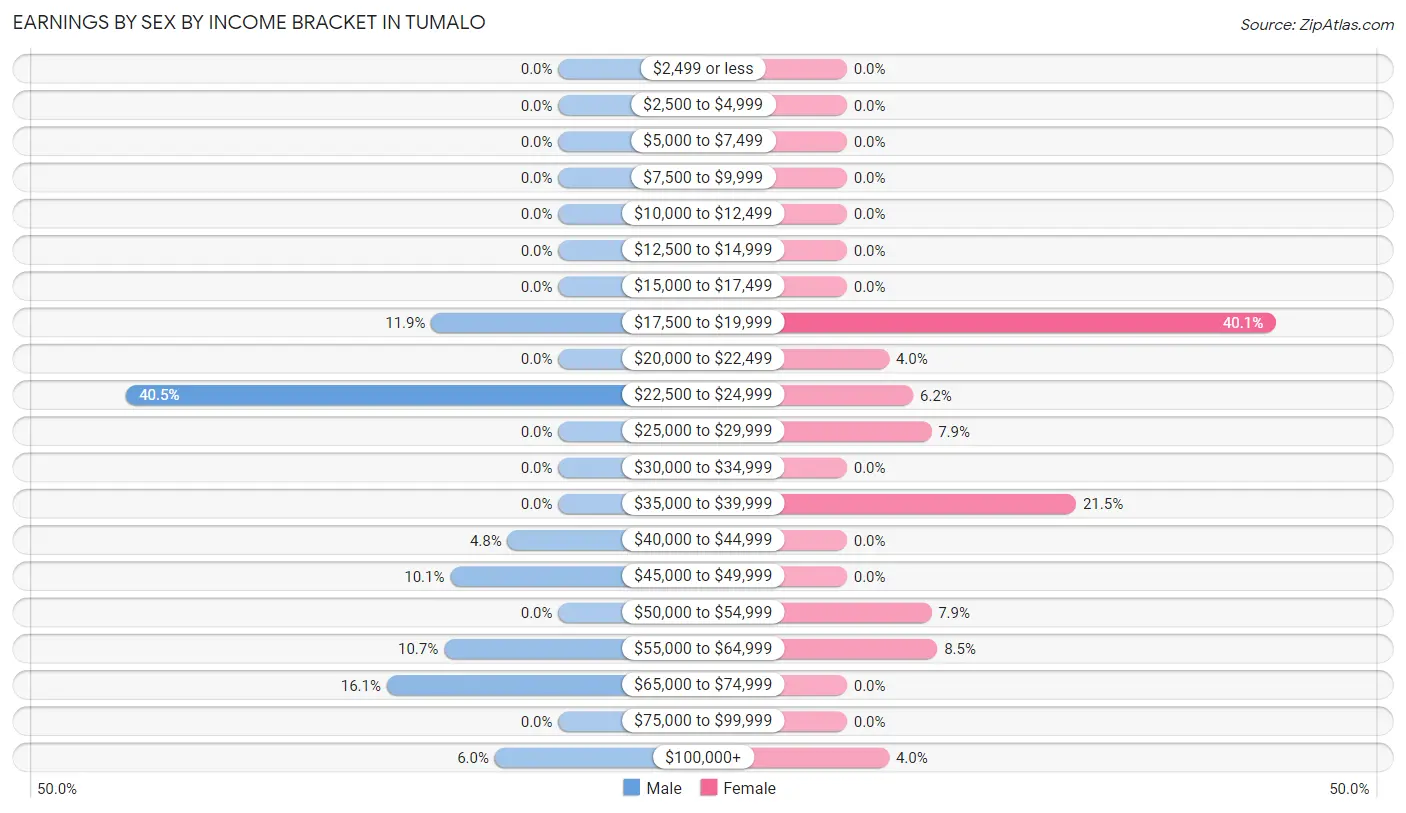
Earnings by Sex by Income Bracket in Tumalo
The most common earnings brackets in Tumalo are $22,500 to $24,999 for men (68 | 40.5%) and $17,500 to $19,999 for women (71 | 40.1%).
| Income | Male | Female |
| $2,499 or less | 0 (0.0%) | 0 (0.0%) |
| $2,500 to $4,999 | 0 (0.0%) | 0 (0.0%) |
| $5,000 to $7,499 | 0 (0.0%) | 0 (0.0%) |
| $7,500 to $9,999 | 0 (0.0%) | 0 (0.0%) |
| $10,000 to $12,499 | 0 (0.0%) | 0 (0.0%) |
| $12,500 to $14,999 | 0 (0.0%) | 0 (0.0%) |
| $15,000 to $17,499 | 0 (0.0%) | 0 (0.0%) |
| $17,500 to $19,999 | 20 (11.9%) | 71 (40.1%) |
| $20,000 to $22,499 | 0 (0.0%) | 7 (4.0%) |
| $22,500 to $24,999 | 68 (40.5%) | 11 (6.2%) |
| $25,000 to $29,999 | 0 (0.0%) | 14 (7.9%) |
| $30,000 to $34,999 | 0 (0.0%) | 0 (0.0%) |
| $35,000 to $39,999 | 0 (0.0%) | 38 (21.5%) |
| $40,000 to $44,999 | 8 (4.8%) | 0 (0.0%) |
| $45,000 to $49,999 | 17 (10.1%) | 0 (0.0%) |
| $50,000 to $54,999 | 0 (0.0%) | 14 (7.9%) |
| $55,000 to $64,999 | 18 (10.7%) | 15 (8.5%) |
| $65,000 to $74,999 | 27 (16.1%) | 0 (0.0%) |
| $75,000 to $99,999 | 0 (0.0%) | 0 (0.0%) |
| $100,000+ | 10 (5.9%) | 7 (4.0%) |
| Total | 168 (100.0%) | 177 (100.0%) |
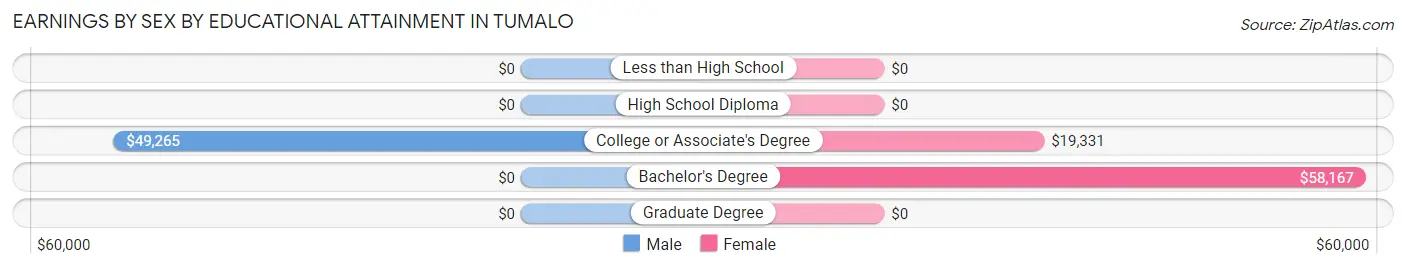
Earnings by Sex by Educational Attainment in Tumalo
| Educational Attainment | Male Income | Female Income |
| Less than High School | - | - |
| High School Diploma | - | - |
| College or Associate's Degree | $49,265 | $19,331 |
| Bachelor's Degree | - | - |
| Graduate Degree | - | - |
| Total | - | - |
Family Income in Tumalo
Family Income Brackets in Tumalo
According to the Tumalo family income data, there are 76 families falling into the $35,000 to $49,999 income range, which is the most common income bracket and makes up 40.2% of all families.
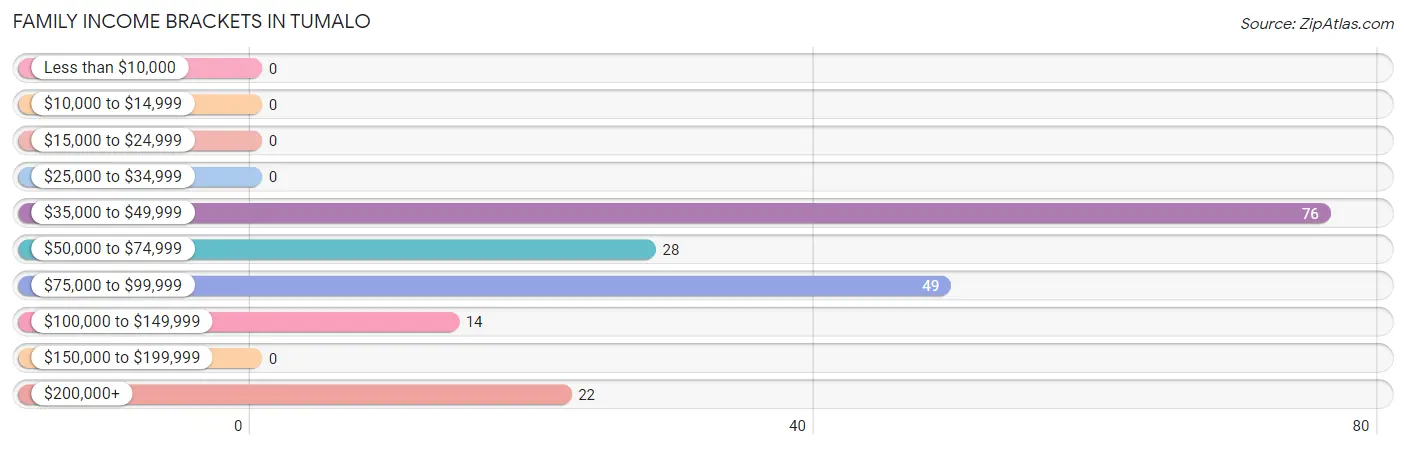
| Income Bracket | # Families | % Families |
| Less than $10,000 | 0 | 0.0% |
| $10,000 to $14,999 | 0 | 0.0% |
| $15,000 to $24,999 | 0 | 0.0% |
| $25,000 to $34,999 | 0 | 0.0% |
| $35,000 to $49,999 | 76 | 40.2% |
| $50,000 to $74,999 | 28 | 14.8% |
| $75,000 to $99,999 | 49 | 25.9% |
| $100,000 to $149,999 | 14 | 7.4% |
| $150,000 to $199,999 | 0 | 0.0% |
| $200,000+ | 22 | 11.6% |
Family Income by Famaliy Size in Tumalo
3-person families (80 | 42.3%) account for the highest median family income in Tumalo with $44,113 per family, while 3-person families (80 | 42.3%) have the highest median income of $14,704 per family member.
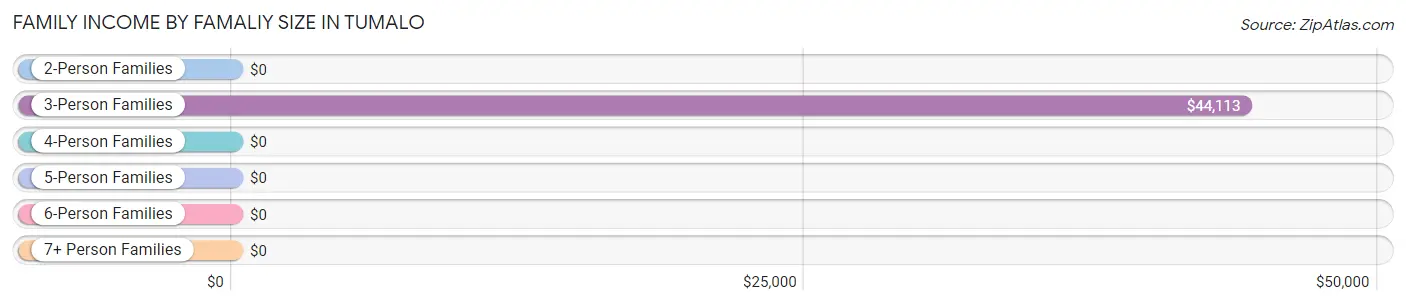
| Income Bracket | # Families | Median Income |
| 2-Person Families | 56 (29.6%) | $0 |
| 3-Person Families | 80 (42.3%) | $44,113 |
| 4-Person Families | 34 (18.0%) | $0 |
| 5-Person Families | 19 (10.1%) | $0 |
| 6-Person Families | 0 (0.0%) | $0 |
| 7+ Person Families | 0 (0.0%) | $0 |
| Total | 189 (100.0%) | $0 |
Family Income by Number of Earners in Tumalo
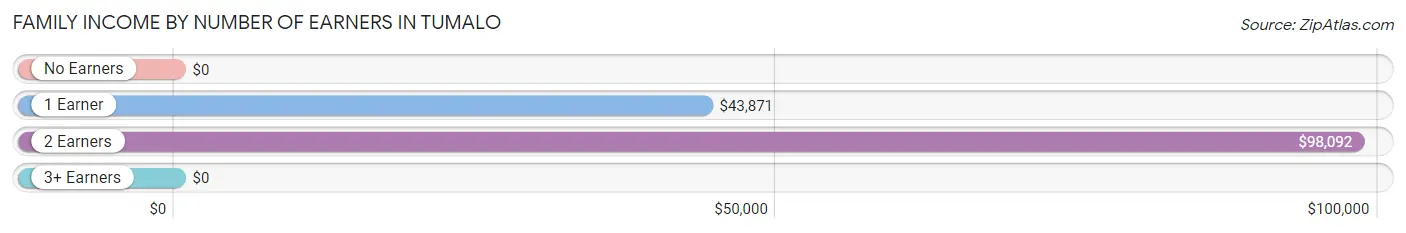
| Number of Earners | # Families | Median Income |
| No Earners | 12 (6.4%) | $0 |
| 1 Earner | 96 (50.8%) | $43,871 |
| 2 Earners | 81 (42.9%) | $98,092 |
| 3+ Earners | 0 (0.0%) | $0 |
| Total | 189 (100.0%) | $0 |
Household Income in Tumalo
Household Income Brackets in Tumalo
With 90 households falling in the category, the $50,000 to $74,999 income range is the most frequent in Tumalo, accounting for 43.7% of all households.
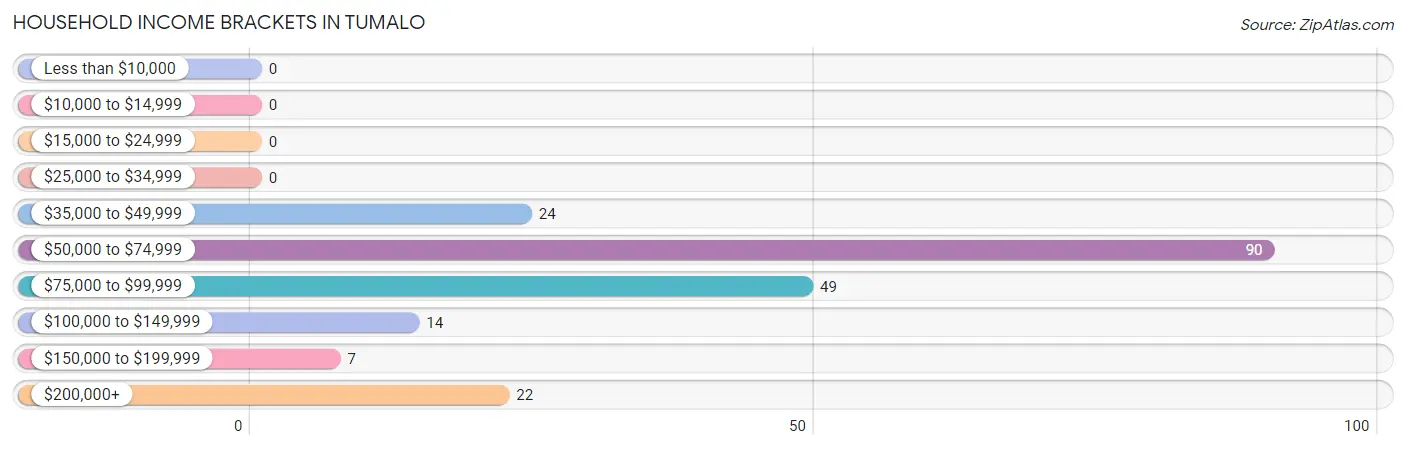
| Income Bracket | # Households | % Households |
| Less than $10,000 | 0 | 0.0% |
| $10,000 to $14,999 | 0 | 0.0% |
| $15,000 to $24,999 | 0 | 0.0% |
| $25,000 to $34,999 | 0 | 0.0% |
| $35,000 to $49,999 | 24 | 11.7% |
| $50,000 to $74,999 | 90 | 43.7% |
| $75,000 to $99,999 | 49 | 23.8% |
| $100,000 to $149,999 | 14 | 6.8% |
| $150,000 to $199,999 | 7 | 3.4% |
| $200,000+ | 22 | 10.7% |
Household Income by Householder Age in Tumalo
The median household income in Tumalo is $62,379, with the highest median household income of $98,750 found in the 25 to 44 years age bracket for the primary householder. A total of 71 households (34.5%) fall into this category.
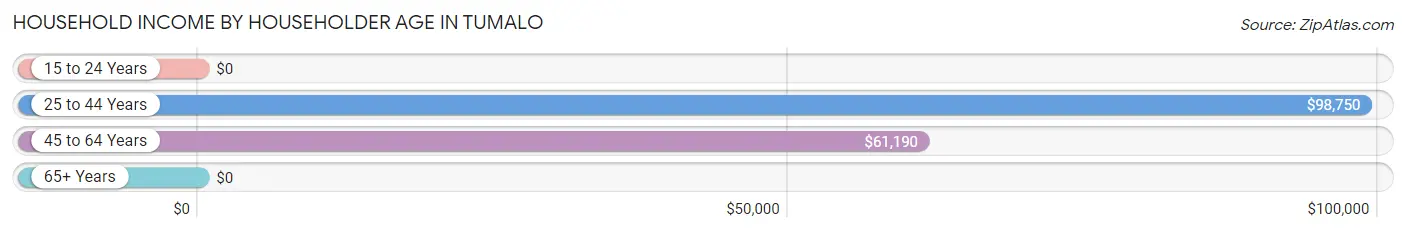
| Income Bracket | # Households | Median Income |
| 15 to 24 Years | 0 (0.0%) | $0 |
| 25 to 44 Years | 71 (34.5%) | $98,750 |
| 45 to 64 Years | 99 (48.1%) | $61,190 |
| 65+ Years | 36 (17.5%) | $0 |
| Total | 206 (100.0%) | $62,379 |
Poverty in Tumalo
Income Below Poverty by Sex and Age in Tumalo
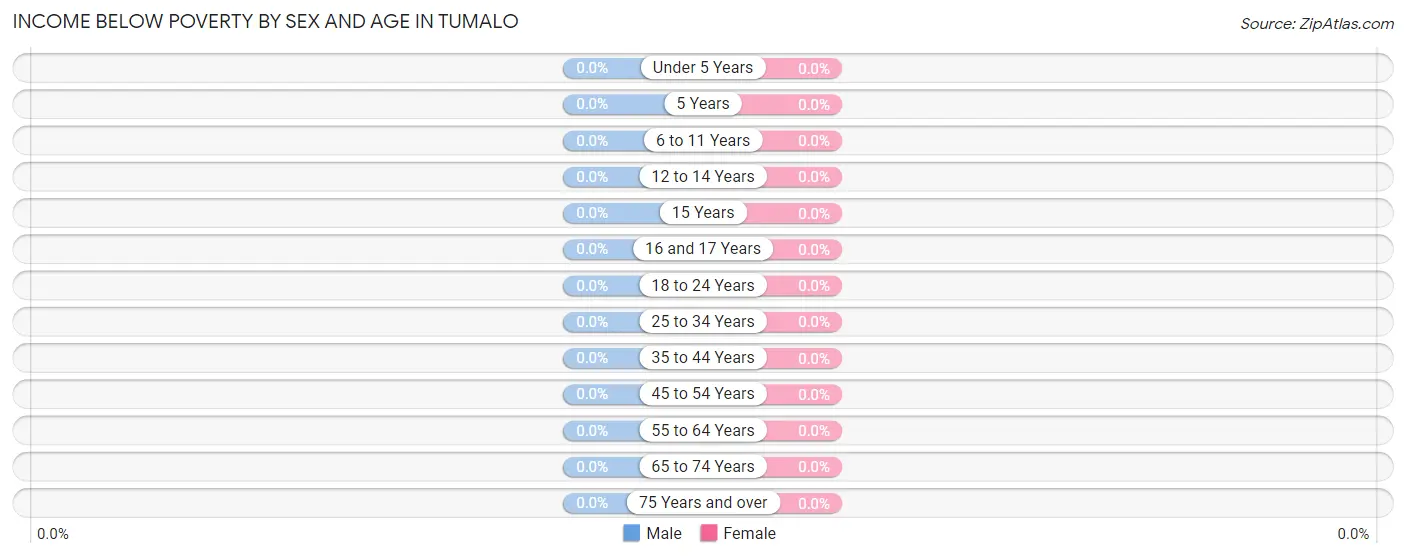
| Age Bracket | Male | Female |
| Under 5 Years | 0 (0.0%) | 0 (0.0%) |
| 5 Years | 0 (0.0%) | 0 (0.0%) |
| 6 to 11 Years | 0 (0.0%) | 0 (0.0%) |
| 12 to 14 Years | 0 (0.0%) | 0 (0.0%) |
| 15 Years | 0 (0.0%) | 0 (0.0%) |
| 16 and 17 Years | 0 (0.0%) | 0 (0.0%) |
| 18 to 24 Years | 0 (0.0%) | 0 (0.0%) |
| 25 to 34 Years | 0 (0.0%) | 0 (0.0%) |
| 35 to 44 Years | 0 (0.0%) | 0 (0.0%) |
| 45 to 54 Years | 0 (0.0%) | 0 (0.0%) |
| 55 to 64 Years | 0 (0.0%) | 0 (0.0%) |
| 65 to 74 Years | 0 (0.0%) | 0 (0.0%) |
| 75 Years and over | 0 (0.0%) | 0 (0.0%) |
| Total | 0 (0.0%) | 0 (0.0%) |
Income Above Poverty by Sex and Age in Tumalo
According to the poverty statistics in Tumalo, males aged under 5 years and females aged under 5 years are the age groups that are most secure financially, with 100.0% of males and 100.0% of females in these age groups living above the poverty line.
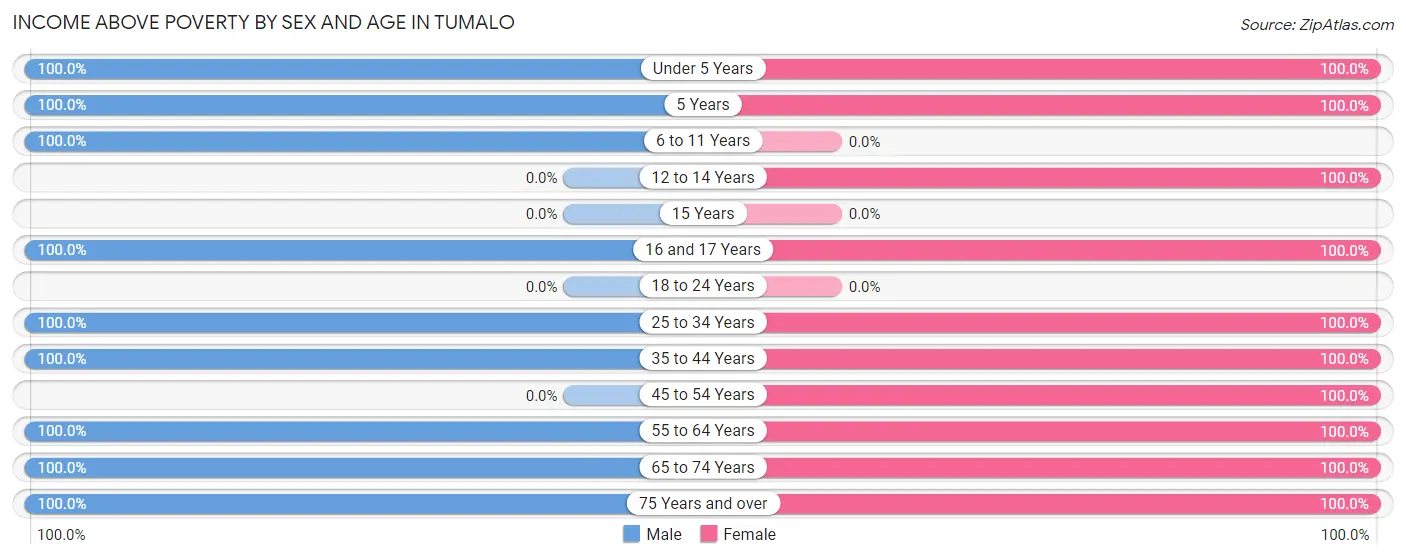
| Age Bracket | Male | Female |
| Under 5 Years | 14 (100.0%) | 31 (100.0%) |
| 5 Years | 16 (100.0%) | 30 (100.0%) |
| 6 to 11 Years | 13 (100.0%) | 0 (0.0%) |
| 12 to 14 Years | 0 (0.0%) | 17 (100.0%) |
| 15 Years | 0 (0.0%) | 0 (0.0%) |
| 16 and 17 Years | 9 (100.0%) | 16 (100.0%) |
| 18 to 24 Years | 0 (0.0%) | 0 (0.0%) |
| 25 to 34 Years | 23 (100.0%) | 81 (100.0%) |
| 35 to 44 Years | 47 (100.0%) | 64 (100.0%) |
| 45 to 54 Years | 0 (0.0%) | 140 (100.0%) |
| 55 to 64 Years | 98 (100.0%) | 31 (100.0%) |
| 65 to 74 Years | 10 (100.0%) | 11 (100.0%) |
| 75 Years and over | 26 (100.0%) | 10 (100.0%) |
| Total | 256 (100.0%) | 431 (100.0%) |
Income Below Poverty Among Married-Couple Families in Tumalo
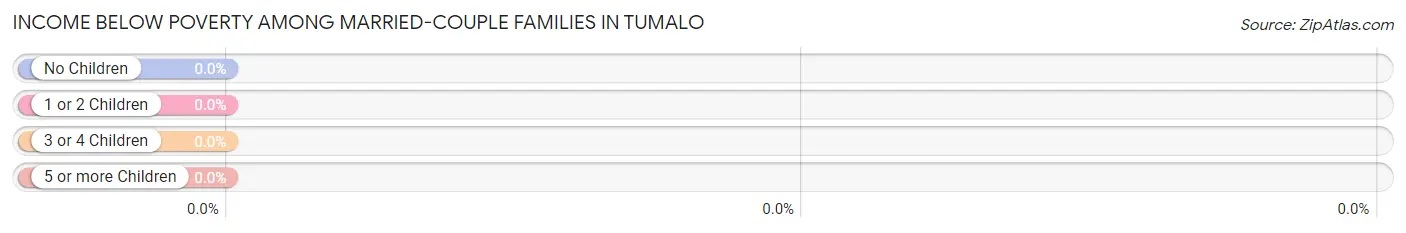
| Children | Above Poverty | Below Poverty |
| No Children | 118 (100.0%) | 0 (0.0%) |
| 1 or 2 Children | 52 (100.0%) | 0 (0.0%) |
| 3 or 4 Children | 19 (100.0%) | 0 (0.0%) |
| 5 or more Children | 0 (0.0%) | 0 (0.0%) |
| Total | 189 (100.0%) | 0 (0.0%) |
Income Below Poverty Among Single-Parent Households in Tumalo
| Children | Single Father | Single Mother |
| No Children | 0 (0.0%) | 0 (0.0%) |
| 1 or 2 Children | 0 (0.0%) | 0 (0.0%) |
| 3 or 4 Children | 0 (0.0%) | 0 (0.0%) |
| 5 or more Children | 0 (0.0%) | 0 (0.0%) |
| Total | 0 (0.0%) | 0 (0.0%) |
Income Below Poverty Among Married-Couple vs Single-Parent Households in Tumalo
| Children | Married-Couple Families | Single-Parent Households |
| No Children | 0 (0.0%) | 0 (0.0%) |
| 1 or 2 Children | 0 (0.0%) | 0 (0.0%) |
| 3 or 4 Children | 0 (0.0%) | 0 (0.0%) |
| 5 or more Children | 0 (0.0%) | 0 (0.0%) |
| Total | 0 (0.0%) | 0 (0.0%) |
Race in Tumalo
The most populous races in Tumalo are White / Caucasian (636 | 92.6%), Two or more Races (51 | 7.4%), and Hispanic or Latino (41 | 6.0%).
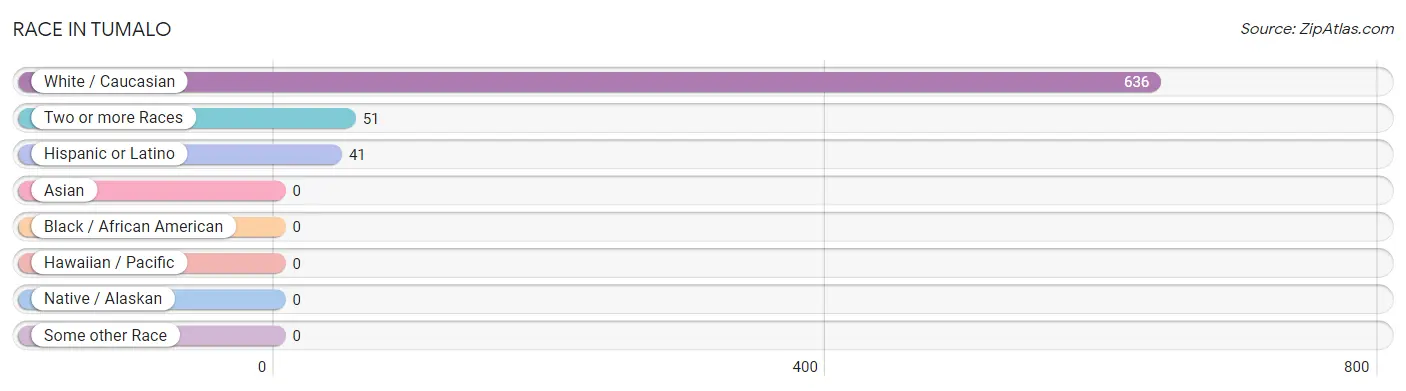
| Race | # Population | % Population |
| Asian | 0 | 0.0% |
| Black / African American | 0 | 0.0% |
| Hawaiian / Pacific | 0 | 0.0% |
| Hispanic or Latino | 41 | 6.0% |
| Native / Alaskan | 0 | 0.0% |
| White / Caucasian | 636 | 92.6% |
| Two or more Races | 51 | 7.4% |
| Some other Race | 0 | 0.0% |
| Total | 687 | 100.0% |
Ancestry in Tumalo
The most populous ancestries reported in Tumalo are German (241 | 35.1%), Dutch (78 | 11.4%), Norwegian (62 | 9.0%), American (59 | 8.6%), and Irish (54 | 7.9%), together accounting for 71.9% of all Tumalo residents.
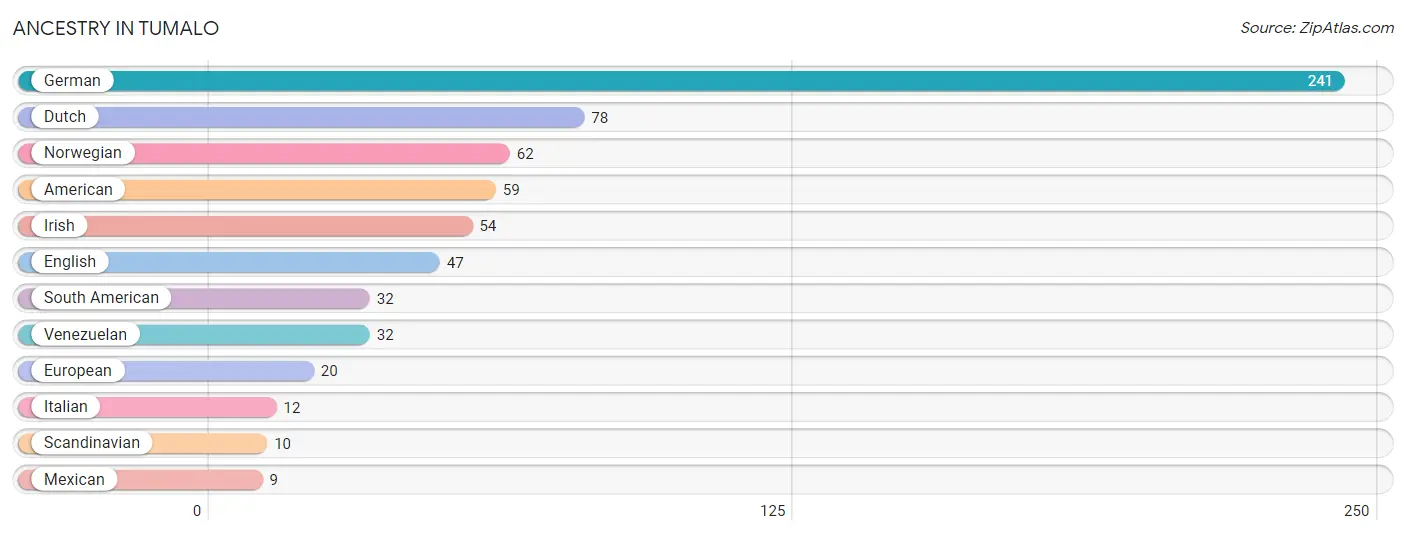
| Ancestry | # Population | % Population |
| American | 59 | 8.6% |
| Dutch | 78 | 11.4% |
| English | 47 | 6.8% |
| European | 20 | 2.9% |
| German | 241 | 35.1% |
| Irish | 54 | 7.9% |
| Italian | 12 | 1.8% |
| Mexican | 9 | 1.3% |
| Norwegian | 62 | 9.0% |
| Scandinavian | 10 | 1.5% |
| South American | 32 | 4.7% |
| Venezuelan | 32 | 4.7% | View All 12 Rows |
Immigrants in Tumalo
The most numerous immigrant groups reported in Tumalo came from Latin America (29 | 4.2%), South America (29 | 4.2%), Venezuela (20 | 2.9%), Argentina (9 | 1.3%), and Europe (7 | 1.0%), together accounting for 13.7% of all Tumalo residents.
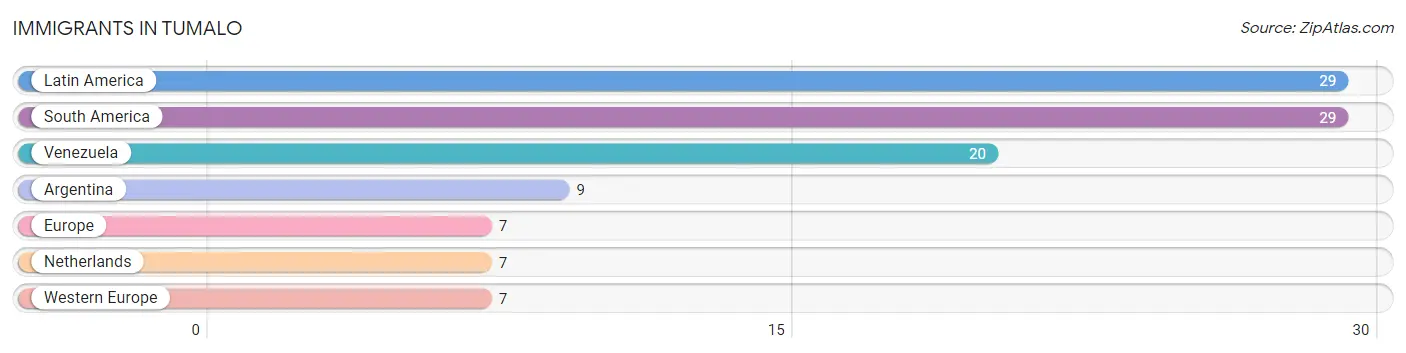
| Immigration Origin | # Population | % Population |
| Argentina | 9 | 1.3% |
| Europe | 7 | 1.0% |
| Latin America | 29 | 4.2% |
| Netherlands | 7 | 1.0% |
| South America | 29 | 4.2% |
| Venezuela | 20 | 2.9% |
| Western Europe | 7 | 1.0% | View All 7 Rows |
Sex and Age in Tumalo
Sex and Age in Tumalo
The most populous age groups in Tumalo are 60 to 64 Years (98 | 38.3%) for men and 50 to 54 Years (140 | 32.5%) for women.
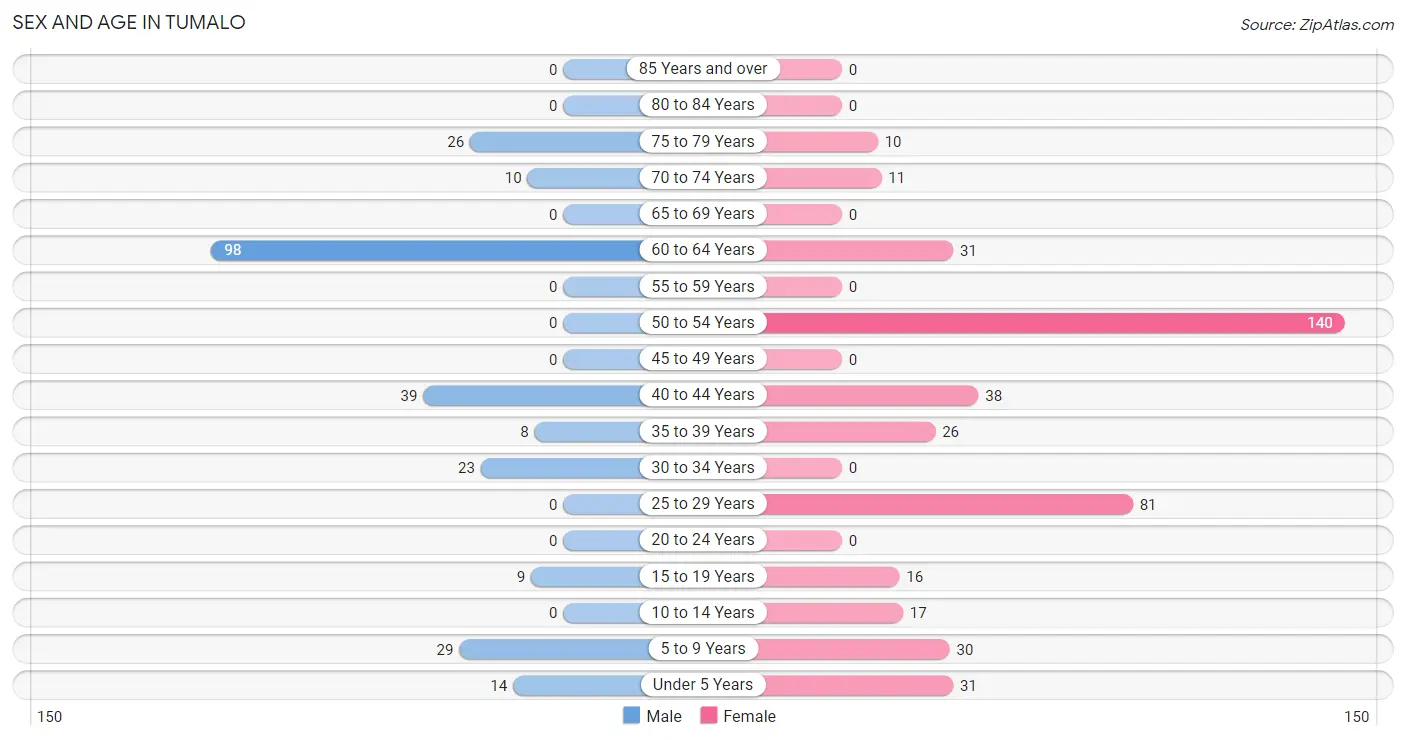
| Age Bracket | Male | Female |
| Under 5 Years | 14 (5.5%) | 31 (7.2%) |
| 5 to 9 Years | 29 (11.3%) | 30 (7.0%) |
| 10 to 14 Years | 0 (0.0%) | 17 (3.9%) |
| 15 to 19 Years | 9 (3.5%) | 16 (3.7%) |
| 20 to 24 Years | 0 (0.0%) | 0 (0.0%) |
| 25 to 29 Years | 0 (0.0%) | 81 (18.8%) |
| 30 to 34 Years | 23 (9.0%) | 0 (0.0%) |
| 35 to 39 Years | 8 (3.1%) | 26 (6.0%) |
| 40 to 44 Years | 39 (15.2%) | 38 (8.8%) |
| 45 to 49 Years | 0 (0.0%) | 0 (0.0%) |
| 50 to 54 Years | 0 (0.0%) | 140 (32.5%) |
| 55 to 59 Years | 0 (0.0%) | 0 (0.0%) |
| 60 to 64 Years | 98 (38.3%) | 31 (7.2%) |
| 65 to 69 Years | 0 (0.0%) | 0 (0.0%) |
| 70 to 74 Years | 10 (3.9%) | 11 (2.5%) |
| 75 to 79 Years | 26 (10.2%) | 10 (2.3%) |
| 80 to 84 Years | 0 (0.0%) | 0 (0.0%) |
| 85 Years and over | 0 (0.0%) | 0 (0.0%) |
| Total | 256 (100.0%) | 431 (100.0%) |
Families and Households in Tumalo
Median Family Size in Tumalo
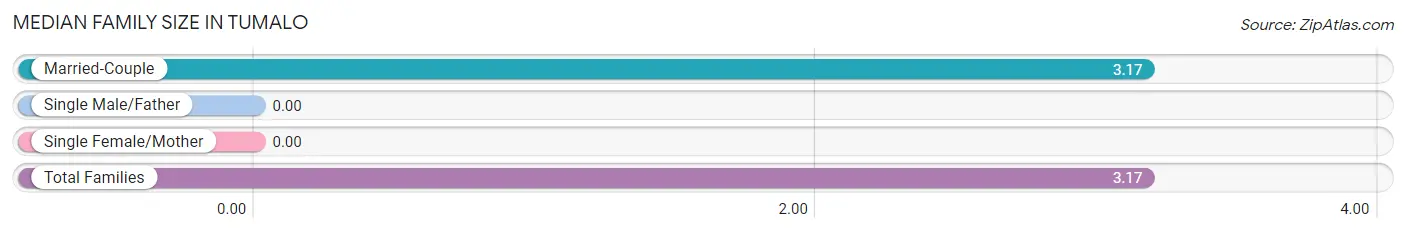
| Family Type | # Families | Family Size |
| Married-Couple | 189 (100.0%) | 3.17 |
| Single Male/Father | 0 (0.0%) | - |
| Single Female/Mother | 0 (0.0%) | - |
| Total Families | 189 (100.0%) | 3.17 |
Median Household Size in Tumalo
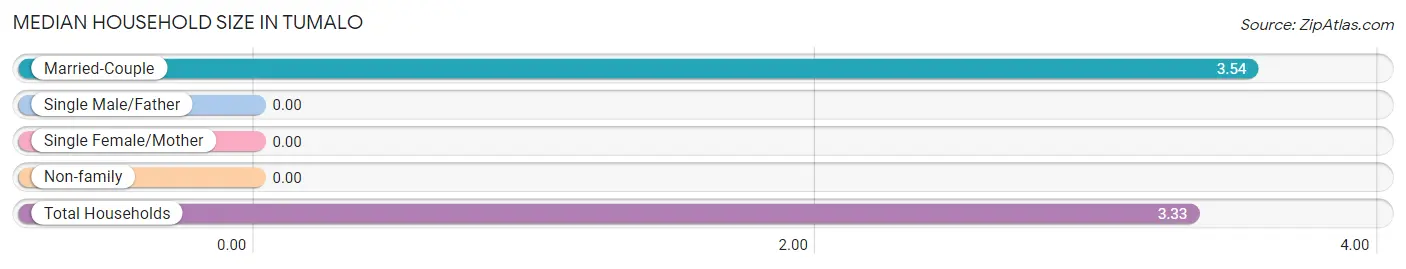
| Household Type | # Households | Household Size |
| Married-Couple | 189 (91.7%) | 3.54 |
| Single Male/Father | 0 (0.0%) | - |
| Single Female/Mother | 0 (0.0%) | - |
| Non-family | 17 (8.3%) | - |
| Total Households | 206 (100.0%) | 3.33 |
Household Size by Marriage Status in Tumalo
Out of a total of 206 households in Tumalo, 189 (91.7%) are family households, while 17 (8.3%) are nonfamily households. The most numerous type of family households are 4-person households, comprising 96, and the most common type of nonfamily households are 1-person households, comprising 17.
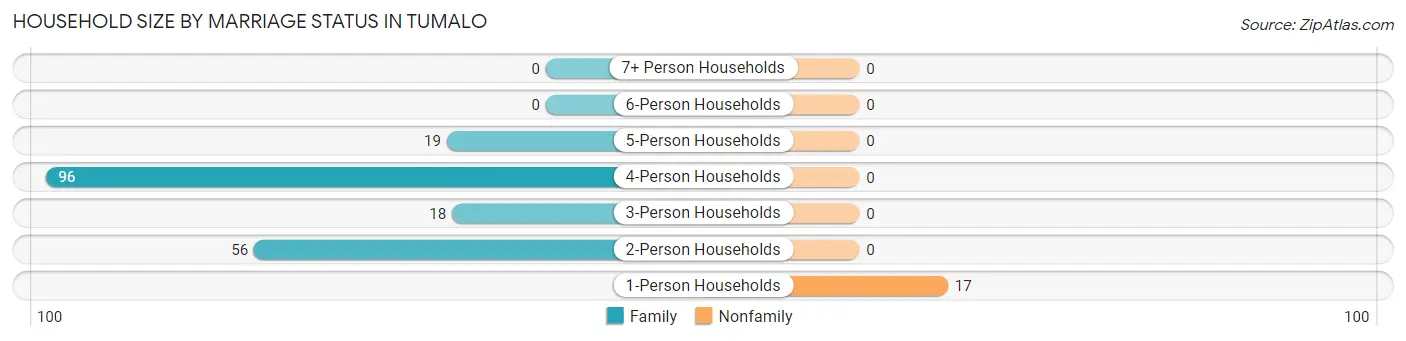
| Household Size | Family Households | Nonfamily Households |
| 1-Person Households | - | 17 (8.3%) |
| 2-Person Households | 56 (27.2%) | 0 (0.0%) |
| 3-Person Households | 18 (8.7%) | 0 (0.0%) |
| 4-Person Households | 96 (46.6%) | 0 (0.0%) |
| 5-Person Households | 19 (9.2%) | 0 (0.0%) |
| 6-Person Households | 0 (0.0%) | 0 (0.0%) |
| 7+ Person Households | 0 (0.0%) | 0 (0.0%) |
| Total | 189 (91.7%) | 17 (8.3%) |
Female Fertility in Tumalo
Fertility by Age in Tumalo
Average fertility rate in Tumalo is 174.0 births per 1,000 women. Women in the age bracket of 35 to 50 years have the highest fertility rate with 219.0 births per 1,000 women. Women in the age bracket of 20 to 34 years acount for 50.0% of all women with births.
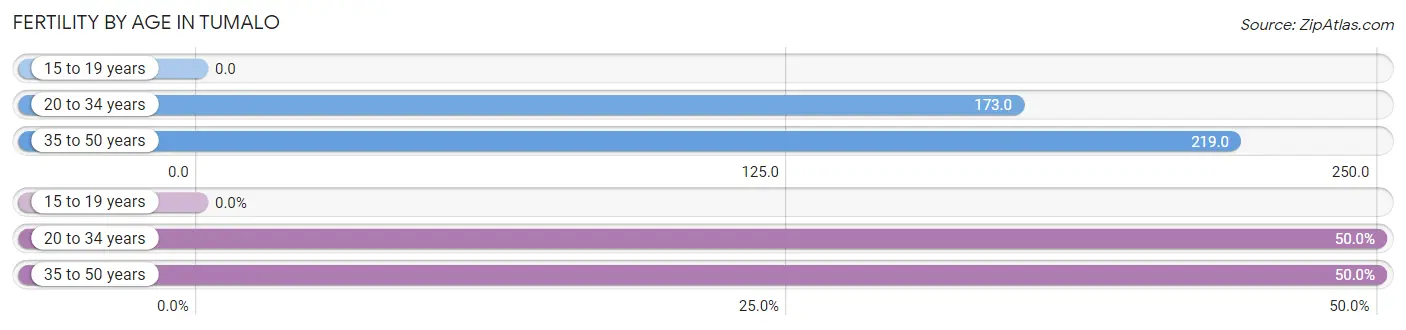
| Age Bracket | Women with Births | Births / 1,000 Women |
| 15 to 19 years | 0 (0.0%) | 0.0 |
| 20 to 34 years | 14 (50.0%) | 173.0 |
| 35 to 50 years | 14 (50.0%) | 219.0 |
| Total | 28 (100.0%) | 174.0 |
Fertility by Age by Marriage Status in Tumalo
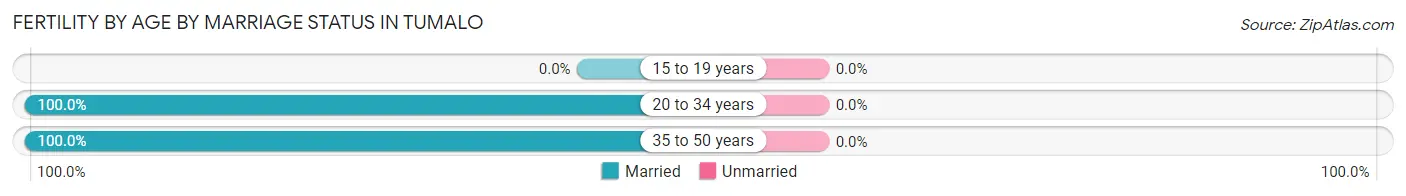
| Age Bracket | Married | Unmarried |
| 15 to 19 years | 0 (0.0%) | 0 (0.0%) |
| 20 to 34 years | 14 (100.0%) | 0 (0.0%) |
| 35 to 50 years | 14 (100.0%) | 0 (0.0%) |
| Total | 28 (100.0%) | 0 (0.0%) |
Fertility by Education in Tumalo
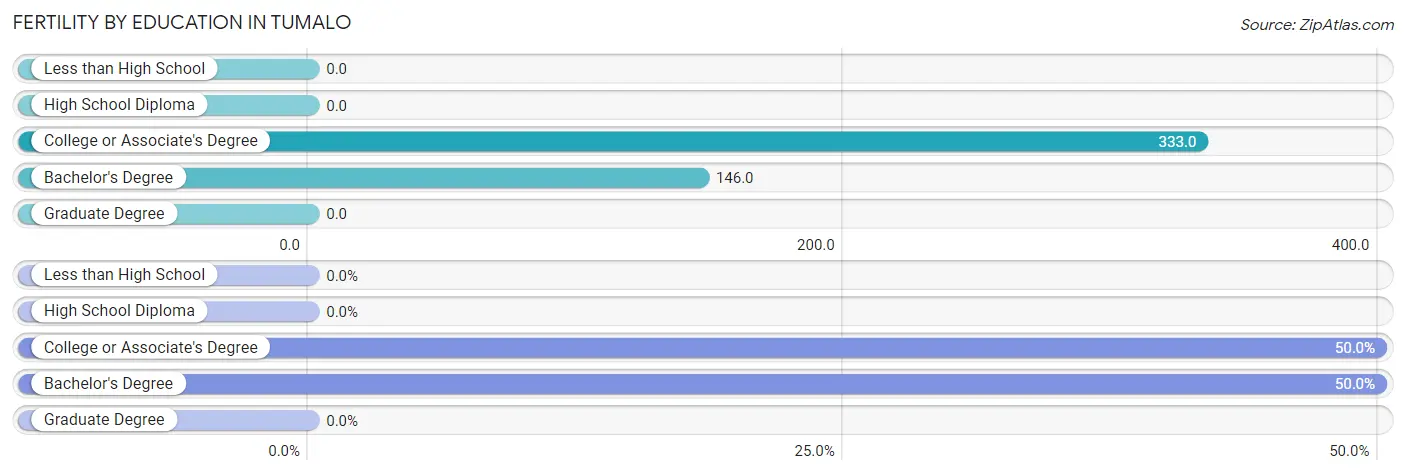
| Educational Attainment | Women with Births | Births / 1,000 Women |
| Less than High School | 0 (0.0%) | 0.0 |
| High School Diploma | 0 (0.0%) | 0.0 |
| College or Associate's Degree | 14 (50.0%) | 333.0 |
| Bachelor's Degree | 14 (50.0%) | 146.0 |
| Graduate Degree | 0 (0.0%) | 0.0 |
| Total | 28 (100.0%) | 174.0 |
Fertility by Education by Marriage Status in Tumalo
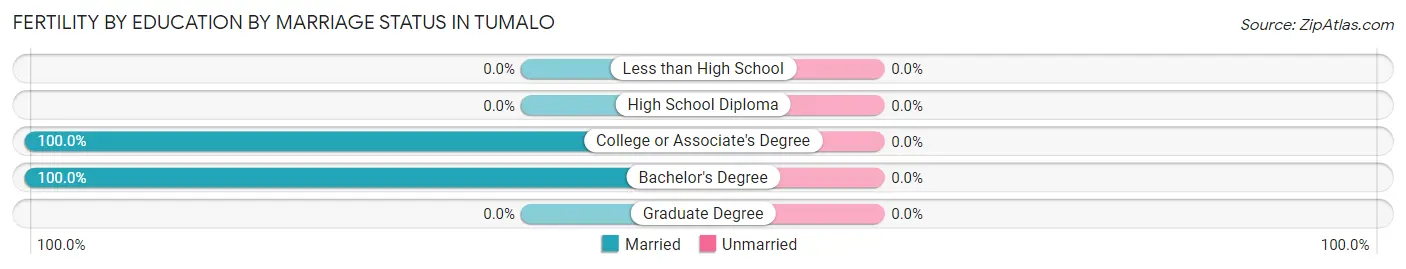
| Educational Attainment | Married | Unmarried |
| Less than High School | 0 (0.0%) | 0 (0.0%) |
| High School Diploma | 0 (0.0%) | 0 (0.0%) |
| College or Associate's Degree | 14 (100.0%) | 0 (0.0%) |
| Bachelor's Degree | 14 (100.0%) | 0 (0.0%) |
| Graduate Degree | 0 (0.0%) | 0 (0.0%) |
| Total | 28 (100.0%) | 0 (0.0%) |
Employment Characteristics in Tumalo
Employment by Class of Employer in Tumalo
Among the 331 employed individuals in Tumalo, private company employees (240 | 72.5%), not-for-profit organizations (39 | 11.8%), and state government employees (25 | 7.5%) make up the most common classes of employment.
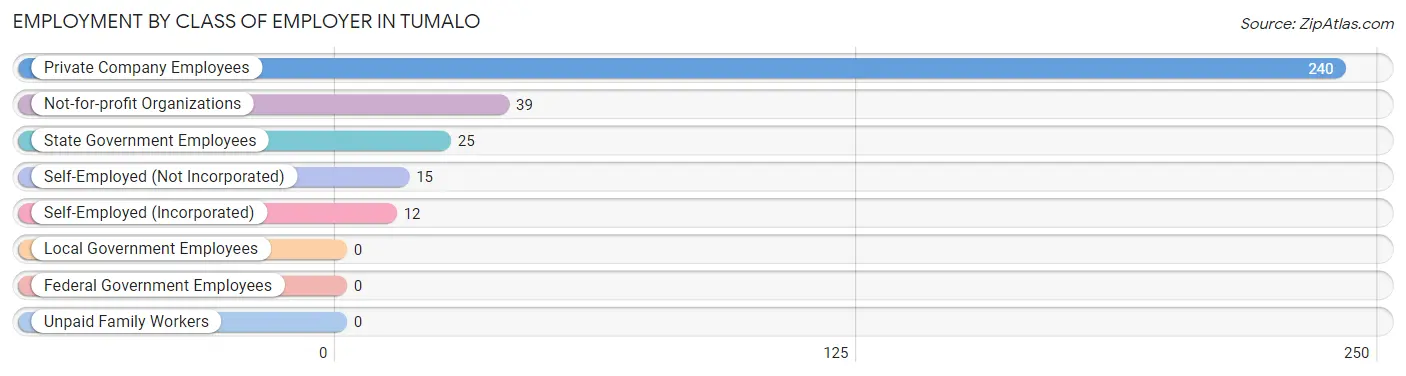
| Employer Class | # Employees | % Employees |
| Private Company Employees | 240 | 72.5% |
| Self-Employed (Incorporated) | 12 | 3.6% |
| Self-Employed (Not Incorporated) | 15 | 4.5% |
| Not-for-profit Organizations | 39 | 11.8% |
| Local Government Employees | 0 | 0.0% |
| State Government Employees | 25 | 7.5% |
| Federal Government Employees | 0 | 0.0% |
| Unpaid Family Workers | 0 | 0.0% |
| Total | 331 | 100.0% |
Employment Status by Age in Tumalo
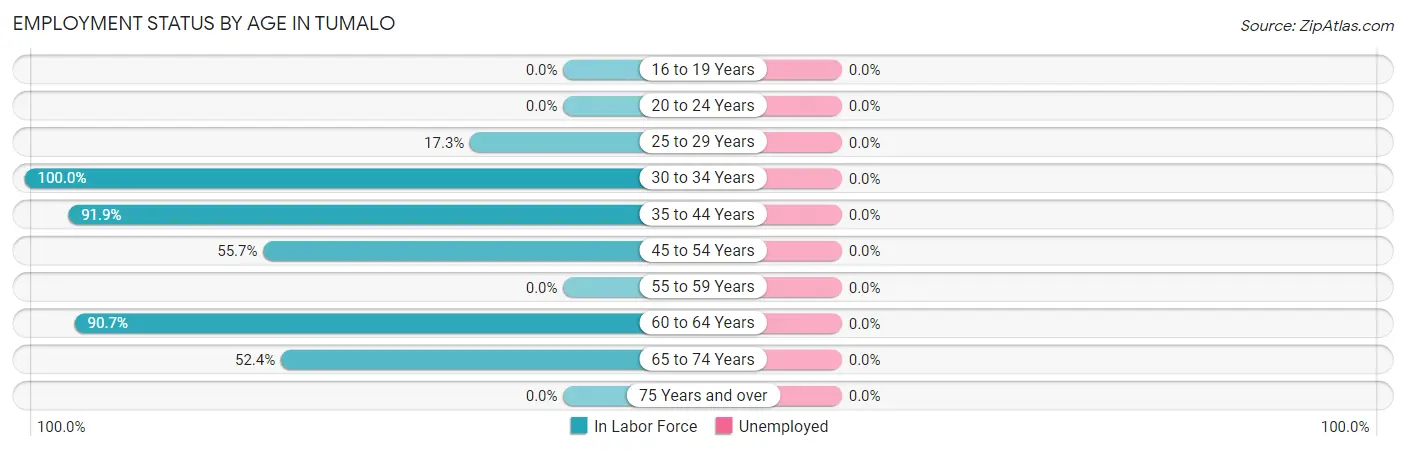
| Age Bracket | In Labor Force | Unemployed |
| 16 to 19 Years | 0 (0.0%) | 0 (0.0%) |
| 20 to 24 Years | 0 (0.0%) | 0 (0.0%) |
| 25 to 29 Years | 14 (17.3%) | 0 (0.0%) |
| 30 to 34 Years | 23 (100.0%) | 0 (0.0%) |
| 35 to 44 Years | 102 (91.9%) | 0 (0.0%) |
| 45 to 54 Years | 78 (55.7%) | 0 (0.0%) |
| 55 to 59 Years | 0 (0.0%) | 0 (0.0%) |
| 60 to 64 Years | 117 (90.7%) | 0 (0.0%) |
| 65 to 74 Years | 11 (52.4%) | 0 (0.0%) |
| 75 Years and over | 0 (0.0%) | 0 (0.0%) |
| Total | 345 (61.0%) | 0 (0.0%) |
Employment Status by Educational Attainment in Tumalo
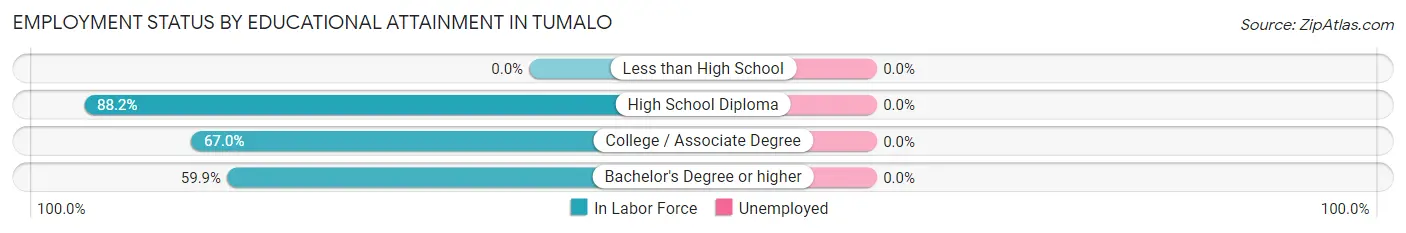
| Educational Attainment | In Labor Force | Unemployed |
| Less than High School | 0 (0.0%) | 0 (0.0%) |
| High School Diploma | 90 (88.2%) | 0 (0.0%) |
| College / Associate Degree | 144 (67.0%) | 0 (0.0%) |
| Bachelor's Degree or higher | 100 (59.9%) | 0 (0.0%) |
| Total | 334 (69.0%) | 0 (0.0%) |
Employment Occupations by Sex in Tumalo
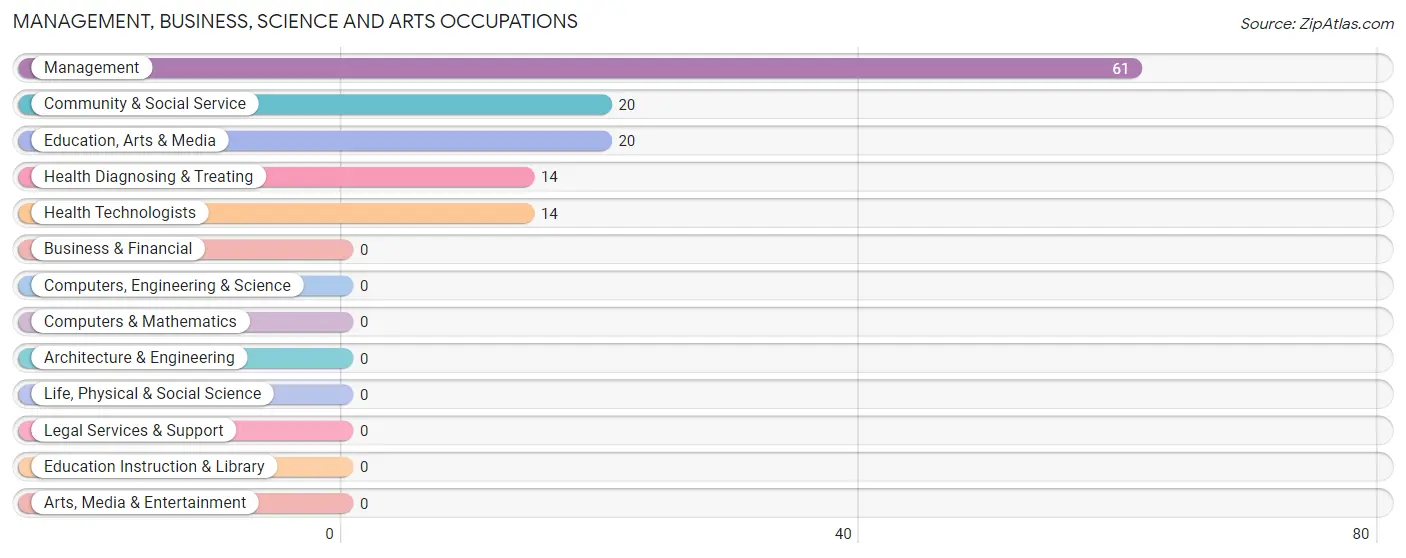
Management, Business, Science and Arts Occupations
The most common Management, Business, Science and Arts occupations in Tumalo are Management (61 | 17.7%), Community & Social Service (20 | 5.8%), Education, Arts & Media (20 | 5.8%), Health Diagnosing & Treating (14 | 4.1%), and Health Technologists (14 | 4.1%).
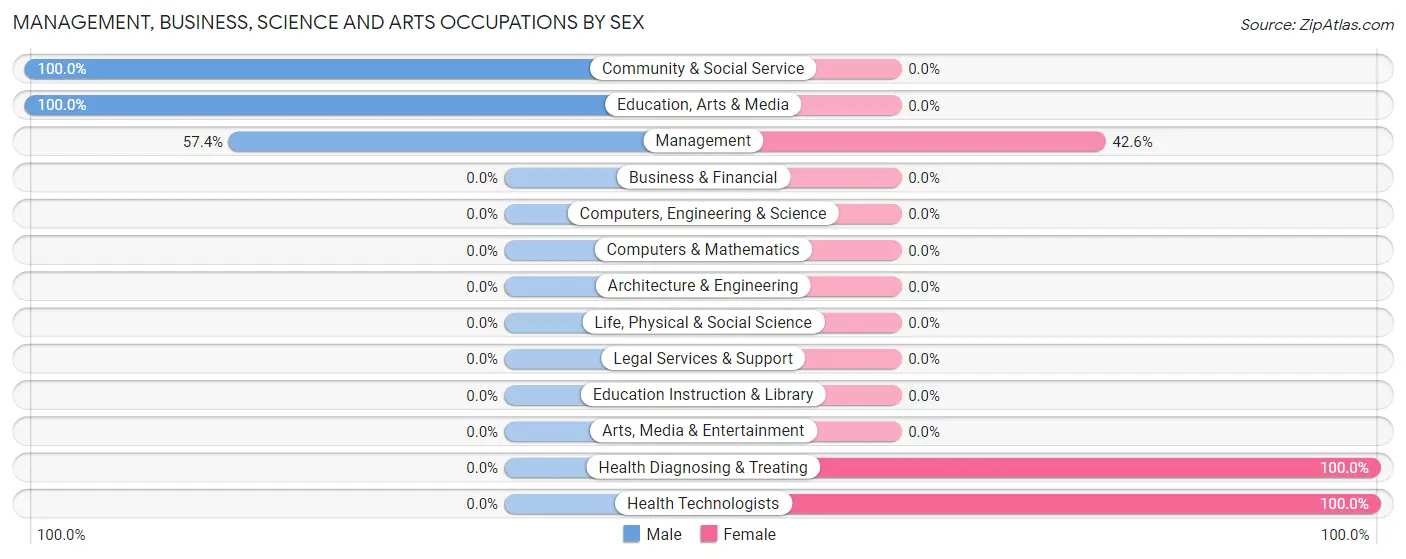
Management, Business, Science and Arts Occupations by Sex
Within the Management, Business, Science and Arts occupations in Tumalo, the most male-oriented occupations are Community & Social Service (100.0%), Education, Arts & Media (100.0%), and Management (57.4%), while the most female-oriented occupations are Health Diagnosing & Treating (100.0%), Health Technologists (100.0%), and Management (42.6%).
| Occupation | Male | Female |
| Management | 35 (57.4%) | 26 (42.6%) |
| Business & Financial | 0 (0.0%) | 0 (0.0%) |
| Computers, Engineering & Science | 0 (0.0%) | 0 (0.0%) |
| Computers & Mathematics | 0 (0.0%) | 0 (0.0%) |
| Architecture & Engineering | 0 (0.0%) | 0 (0.0%) |
| Life, Physical & Social Science | 0 (0.0%) | 0 (0.0%) |
| Community & Social Service | 20 (100.0%) | 0 (0.0%) |
| Education, Arts & Media | 20 (100.0%) | 0 (0.0%) |
| Legal Services & Support | 0 (0.0%) | 0 (0.0%) |
| Education Instruction & Library | 0 (0.0%) | 0 (0.0%) |
| Arts, Media & Entertainment | 0 (0.0%) | 0 (0.0%) |
| Health Diagnosing & Treating | 0 (0.0%) | 14 (100.0%) |
| Health Technologists | 0 (0.0%) | 14 (100.0%) |
| Total (Category) | 55 (57.9%) | 40 (42.1%) |
| Total (Overall) | 168 (48.7%) | 177 (51.3%) |
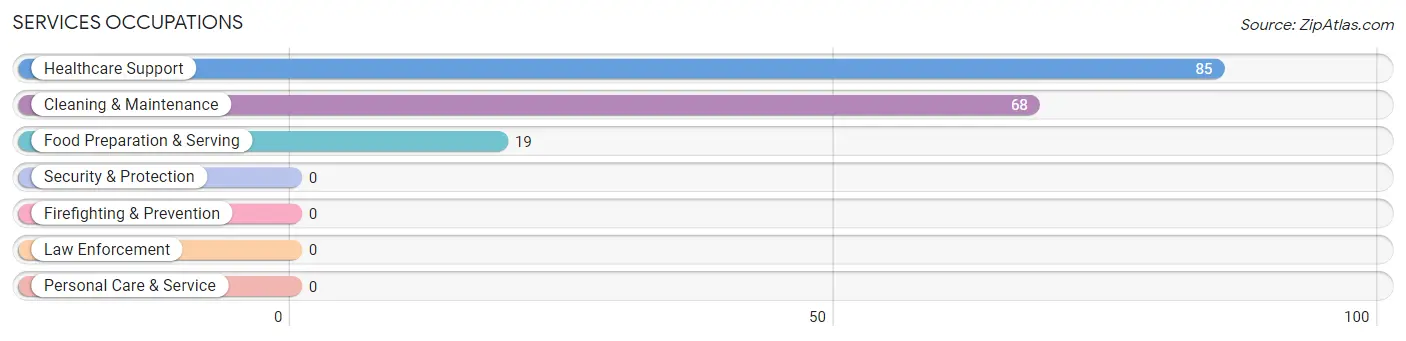
Services Occupations
The most common Services occupations in Tumalo are Healthcare Support (85 | 24.6%), Cleaning & Maintenance (68 | 19.7%), and Food Preparation & Serving (19 | 5.5%).
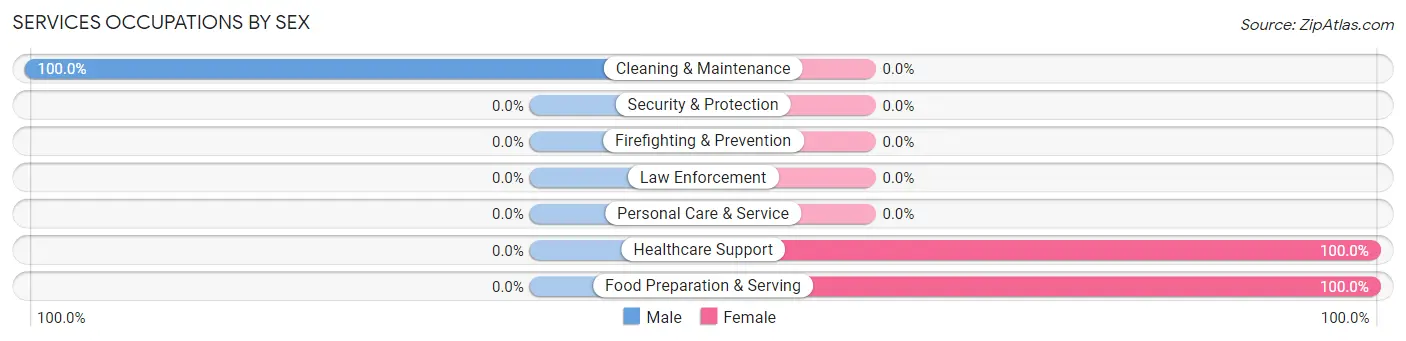
Services Occupations by Sex
| Occupation | Male | Female |
| Healthcare Support | 0 (0.0%) | 85 (100.0%) |
| Security & Protection | 0 (0.0%) | 0 (0.0%) |
| Firefighting & Prevention | 0 (0.0%) | 0 (0.0%) |
| Law Enforcement | 0 (0.0%) | 0 (0.0%) |
| Food Preparation & Serving | 0 (0.0%) | 19 (100.0%) |
| Cleaning & Maintenance | 68 (100.0%) | 0 (0.0%) |
| Personal Care & Service | 0 (0.0%) | 0 (0.0%) |
| Total (Category) | 68 (39.5%) | 104 (60.5%) |
| Total (Overall) | 168 (48.7%) | 177 (51.3%) |
Sales and Office Occupations
The most common Sales and Office occupations in Tumalo are Sales & Related (22 | 6.4%), and Office & Administration (11 | 3.2%).
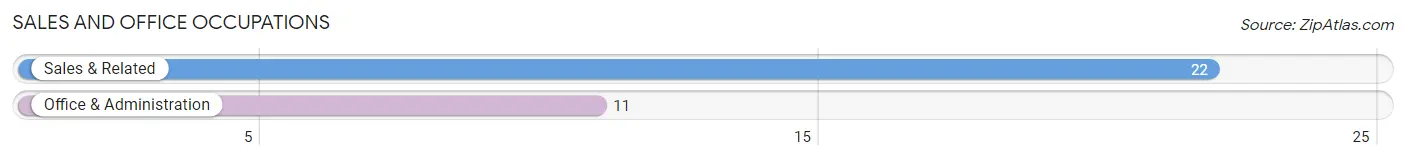
Sales and Office Occupations by Sex
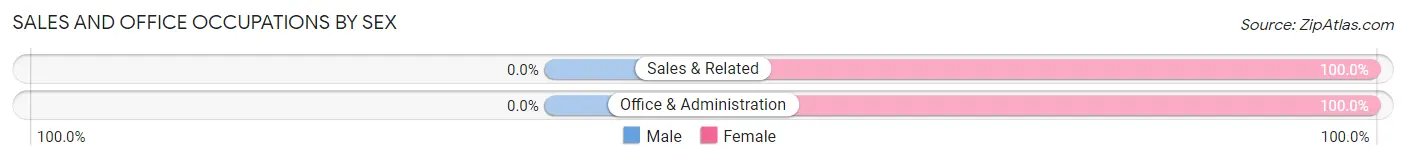
| Occupation | Male | Female |
| Sales & Related | 0 (0.0%) | 22 (100.0%) |
| Office & Administration | 0 (0.0%) | 11 (100.0%) |
| Total (Category) | 0 (0.0%) | 33 (100.0%) |
| Total (Overall) | 168 (48.7%) | 177 (51.3%) |
Natural Resources, Construction and Maintenance Occupations
The most common Natural Resources, Construction and Maintenance occupations in Tumalo are Construction & Extraction (20 | 5.8%), and Farming, Fishing & Forestry (10 | 2.9%).
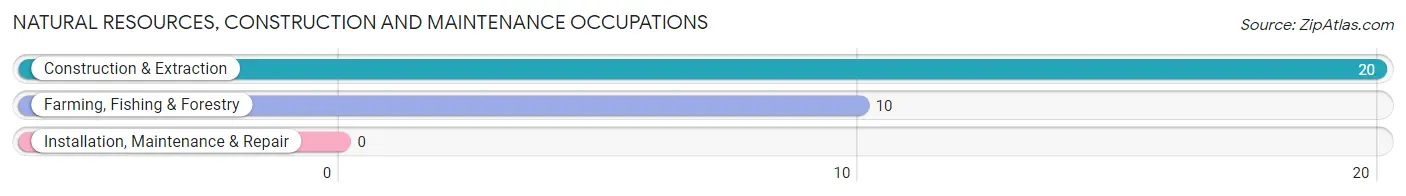
Natural Resources, Construction and Maintenance Occupations by Sex
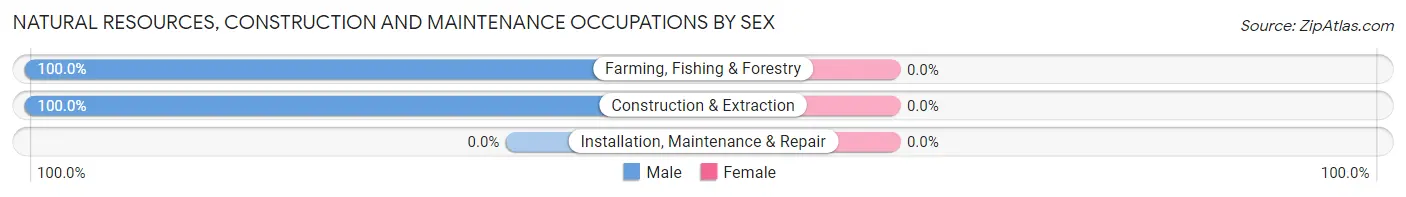
| Occupation | Male | Female |
| Farming, Fishing & Forestry | 10 (100.0%) | 0 (0.0%) |
| Construction & Extraction | 20 (100.0%) | 0 (0.0%) |
| Installation, Maintenance & Repair | 0 (0.0%) | 0 (0.0%) |
| Total (Category) | 30 (100.0%) | 0 (0.0%) |
| Total (Overall) | 168 (48.7%) | 177 (51.3%) |
Production, Transportation and Moving Occupations
The most common Production, Transportation and Moving occupations in Tumalo are , and Production (15 | 4.3%).
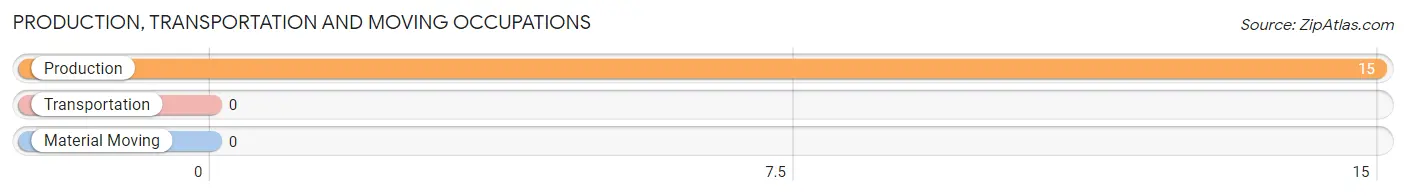
Production, Transportation and Moving Occupations by Sex
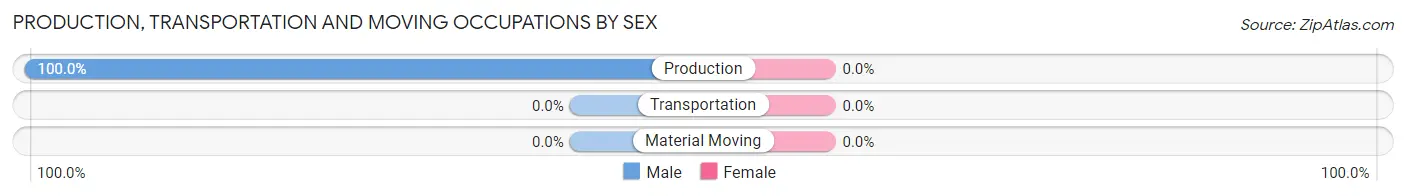
| Occupation | Male | Female |
| Production | 15 (100.0%) | 0 (0.0%) |
| Transportation | 0 (0.0%) | 0 (0.0%) |
| Material Moving | 0 (0.0%) | 0 (0.0%) |
| Total (Category) | 15 (100.0%) | 0 (0.0%) |
| Total (Overall) | 168 (48.7%) | 177 (51.3%) |
Employment Industries by Sex in Tumalo
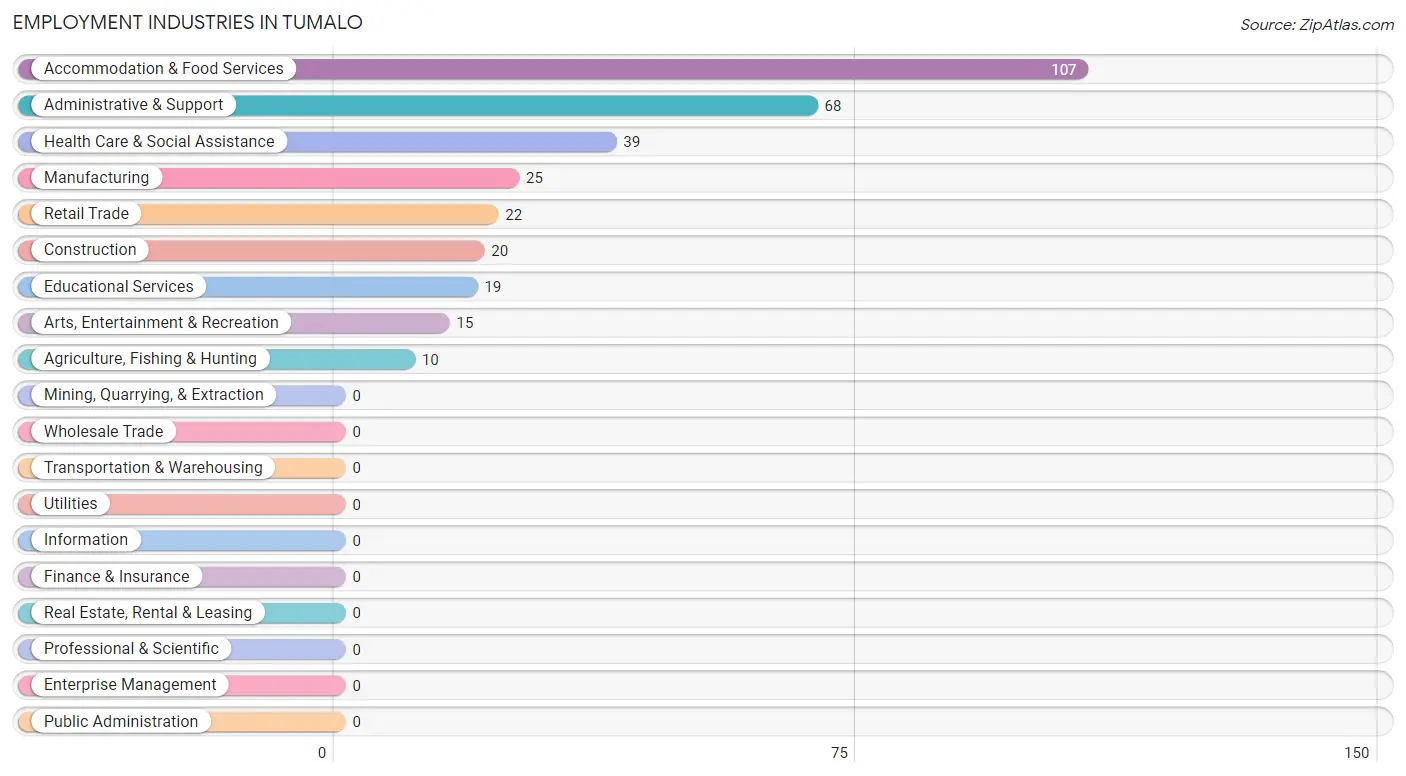
Employment Industries in Tumalo
The major employment industries in Tumalo include Accommodation & Food Services (107 | 31.0%), Administrative & Support (68 | 19.7%), Health Care & Social Assistance (39 | 11.3%), Manufacturing (25 | 7.2%), and Retail Trade (22 | 6.4%).
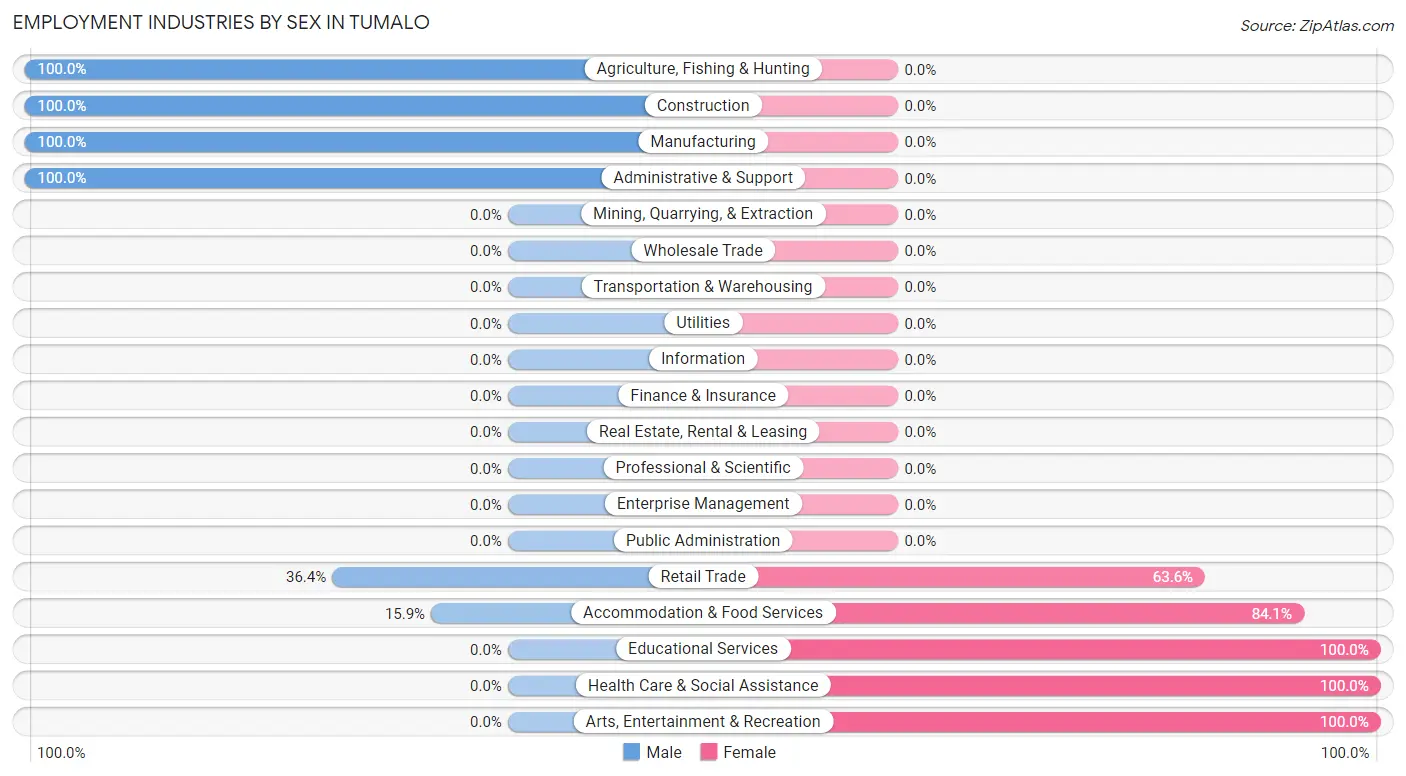
Employment Industries by Sex in Tumalo
The Tumalo industries that see more men than women are Agriculture, Fishing & Hunting (100.0%), Construction (100.0%), and Manufacturing (100.0%), whereas the industries that tend to have a higher number of women are Educational Services (100.0%), Health Care & Social Assistance (100.0%), and Arts, Entertainment & Recreation (100.0%).
| Industry | Male | Female |
| Agriculture, Fishing & Hunting | 10 (100.0%) | 0 (0.0%) |
| Mining, Quarrying, & Extraction | 0 (0.0%) | 0 (0.0%) |
| Construction | 20 (100.0%) | 0 (0.0%) |
| Manufacturing | 25 (100.0%) | 0 (0.0%) |
| Wholesale Trade | 0 (0.0%) | 0 (0.0%) |
| Retail Trade | 8 (36.4%) | 14 (63.6%) |
| Transportation & Warehousing | 0 (0.0%) | 0 (0.0%) |
| Utilities | 0 (0.0%) | 0 (0.0%) |
| Information | 0 (0.0%) | 0 (0.0%) |
| Finance & Insurance | 0 (0.0%) | 0 (0.0%) |
| Real Estate, Rental & Leasing | 0 (0.0%) | 0 (0.0%) |
| Professional & Scientific | 0 (0.0%) | 0 (0.0%) |
| Enterprise Management | 0 (0.0%) | 0 (0.0%) |
| Administrative & Support | 68 (100.0%) | 0 (0.0%) |
| Educational Services | 0 (0.0%) | 19 (100.0%) |
| Health Care & Social Assistance | 0 (0.0%) | 39 (100.0%) |
| Arts, Entertainment & Recreation | 0 (0.0%) | 15 (100.0%) |
| Accommodation & Food Services | 17 (15.9%) | 90 (84.1%) |
| Public Administration | 0 (0.0%) | 0 (0.0%) |
| Total | 168 (48.7%) | 177 (51.3%) |
Education in Tumalo
School Enrollment in Tumalo
The most common levels of schooling among the 112 students in Tumalo are high school (42 | 37.5%), college / undergraduate (28 | 25.0%), and kindergarten (16 | 14.3%).
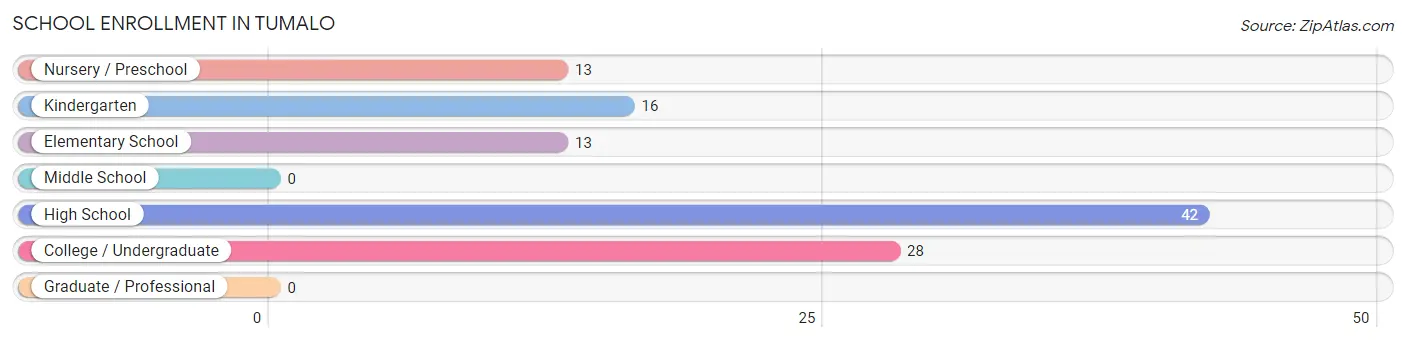
| School Level | # Students | % Students |
| Nursery / Preschool | 13 | 11.6% |
| Kindergarten | 16 | 14.3% |
| Elementary School | 13 | 11.6% |
| Middle School | 0 | 0.0% |
| High School | 42 | 37.5% |
| College / Undergraduate | 28 | 25.0% |
| Graduate / Professional | 0 | 0.0% |
| Total | 112 | 100.0% |
School Enrollment by Age by Funding Source in Tumalo
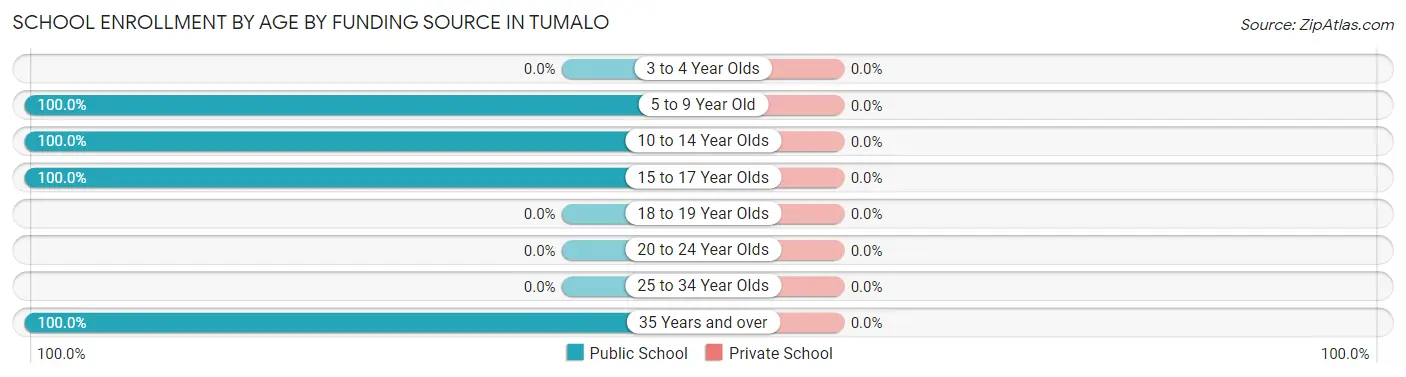
| Age Bracket | Public School | Private School |
| 3 to 4 Year Olds | 0 (0.0%) | 0 (0.0%) |
| 5 to 9 Year Old | 42 (100.0%) | 0 (0.0%) |
| 10 to 14 Year Olds | 17 (100.0%) | 0 (0.0%) |
| 15 to 17 Year Olds | 25 (100.0%) | 0 (0.0%) |
| 18 to 19 Year Olds | 0 (0.0%) | 0 (0.0%) |
| 20 to 24 Year Olds | 0 (0.0%) | 0 (0.0%) |
| 25 to 34 Year Olds | 0 (0.0%) | 0 (0.0%) |
| 35 Years and over | 28 (100.0%) | 0 (0.0%) |
| Total | 112 (100.0%) | 0 (0.0%) |
Educational Attainment by Field of Study in Tumalo
Literature & languages (67 | 35.1%), science & technology (21 | 11.0%), liberal arts & history (20 | 10.5%), education (19 | 10.0%), and social sciences (15 | 7.9%) are the most common fields of study among 191 individuals in Tumalo who have obtained a bachelor's degree or higher.
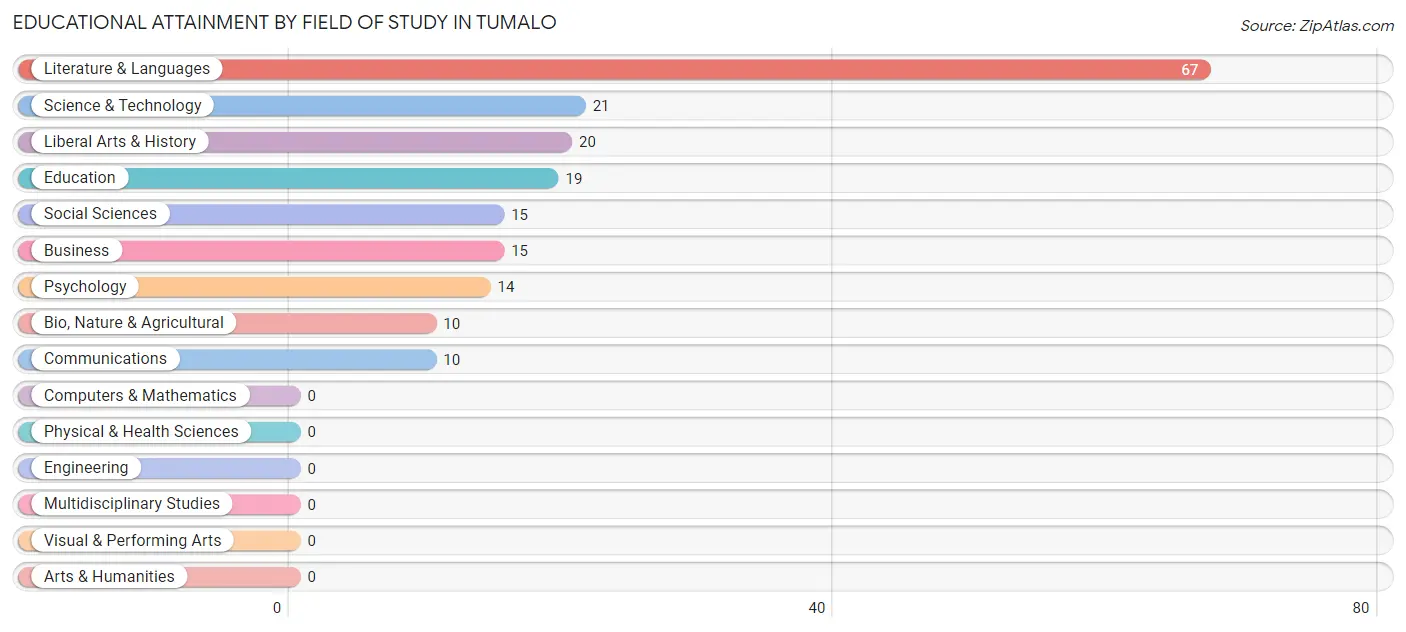
| Field of Study | # Graduates | % Graduates |
| Computers & Mathematics | 0 | 0.0% |
| Bio, Nature & Agricultural | 10 | 5.2% |
| Physical & Health Sciences | 0 | 0.0% |
| Psychology | 14 | 7.3% |
| Social Sciences | 15 | 7.9% |
| Engineering | 0 | 0.0% |
| Multidisciplinary Studies | 0 | 0.0% |
| Science & Technology | 21 | 11.0% |
| Business | 15 | 7.9% |
| Education | 19 | 10.0% |
| Literature & Languages | 67 | 35.1% |
| Liberal Arts & History | 20 | 10.5% |
| Visual & Performing Arts | 0 | 0.0% |
| Communications | 10 | 5.2% |
| Arts & Humanities | 0 | 0.0% |
| Total | 191 | 100.0% |
Transportation & Commute in Tumalo
Vehicle Availability by Sex in Tumalo
The most prevalent vehicle ownership categories in Tumalo are males with 3 vehicles (77, accounting for 45.8%) and females with 3 vehicles (60, making up 47.2%).
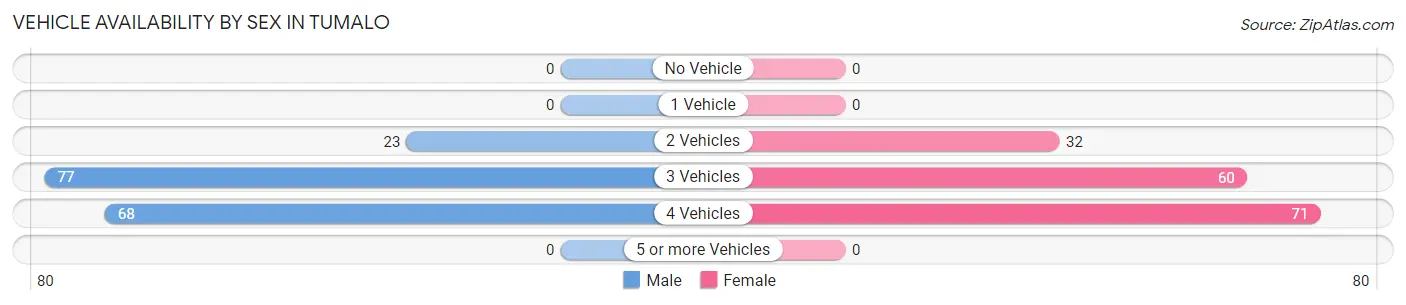
| Vehicles Available | Male | Female |
| No Vehicle | 0 (0.0%) | 0 (0.0%) |
| 1 Vehicle | 0 (0.0%) | 0 (0.0%) |
| 2 Vehicles | 23 (13.7%) | 32 (19.6%) |
| 3 Vehicles | 77 (45.8%) | 60 (36.8%) |
| 4 Vehicles | 68 (40.5%) | 71 (43.6%) |
| 5 or more Vehicles | 0 (0.0%) | 0 (0.0%) |
| Total | 168 (100.0%) | 163 (100.0%) |
Commute Time in Tumalo
The most frequently occuring commute durations in Tumalo are 30 to 34 minutes (97 commuters, 30.2%), 60 to 89 minutes (71 commuters, 22.1%), and 20 to 24 minutes (57 commuters, 17.8%).
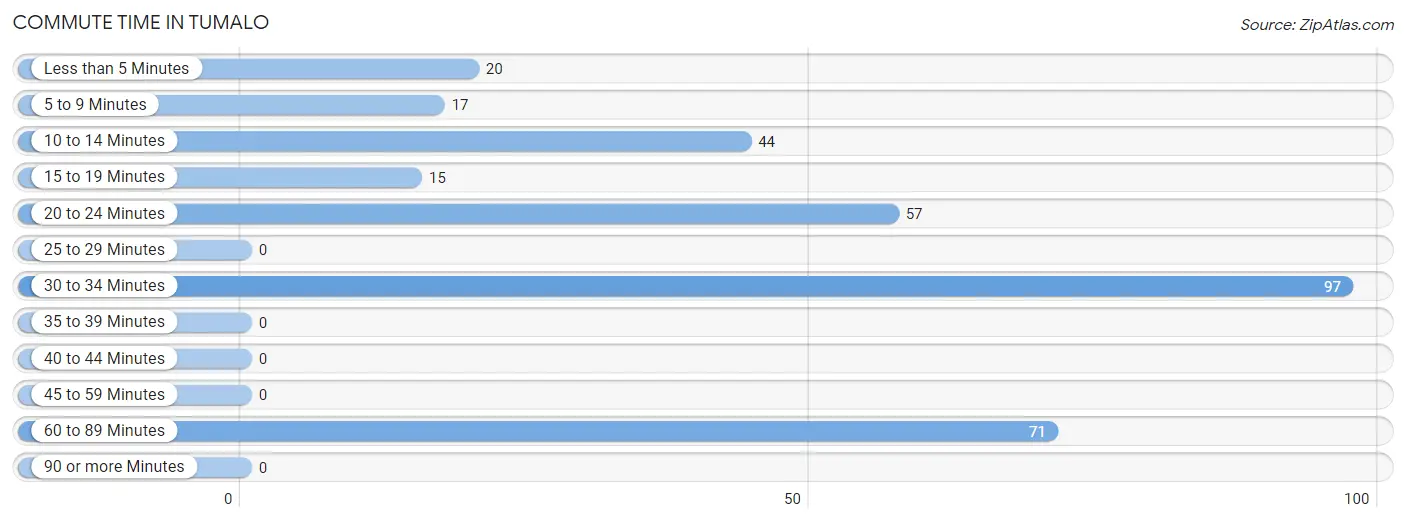
| Commute Time | # Commuters | % Commuters |
| Less than 5 Minutes | 20 | 6.2% |
| 5 to 9 Minutes | 17 | 5.3% |
| 10 to 14 Minutes | 44 | 13.7% |
| 15 to 19 Minutes | 15 | 4.7% |
| 20 to 24 Minutes | 57 | 17.8% |
| 25 to 29 Minutes | 0 | 0.0% |
| 30 to 34 Minutes | 97 | 30.2% |
| 35 to 39 Minutes | 0 | 0.0% |
| 40 to 44 Minutes | 0 | 0.0% |
| 45 to 59 Minutes | 0 | 0.0% |
| 60 to 89 Minutes | 71 | 22.1% |
| 90 or more Minutes | 0 | 0.0% |
Commute Time by Sex in Tumalo
The most common commute times in Tumalo are 30 to 34 minutes (76 commuters, 48.1%) for males and 60 to 89 minutes (71 commuters, 43.6%) for females.
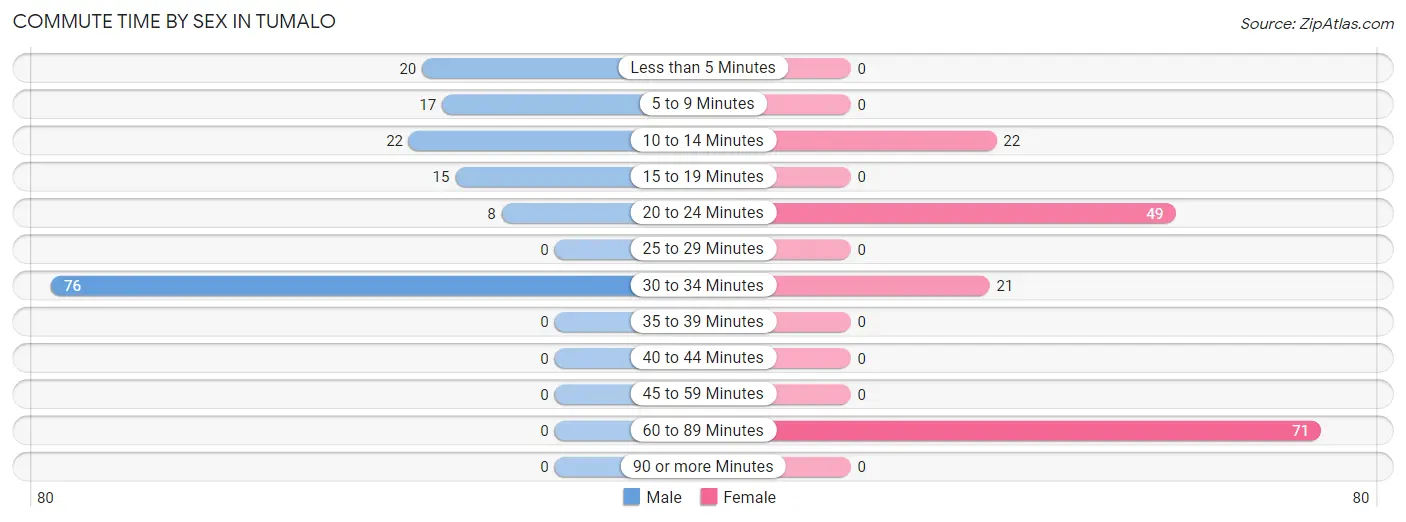
| Commute Time | Male | Female |
| Less than 5 Minutes | 20 (12.7%) | 0 (0.0%) |
| 5 to 9 Minutes | 17 (10.8%) | 0 (0.0%) |
| 10 to 14 Minutes | 22 (13.9%) | 22 (13.5%) |
| 15 to 19 Minutes | 15 (9.5%) | 0 (0.0%) |
| 20 to 24 Minutes | 8 (5.1%) | 49 (30.1%) |
| 25 to 29 Minutes | 0 (0.0%) | 0 (0.0%) |
| 30 to 34 Minutes | 76 (48.1%) | 21 (12.9%) |
| 35 to 39 Minutes | 0 (0.0%) | 0 (0.0%) |
| 40 to 44 Minutes | 0 (0.0%) | 0 (0.0%) |
| 45 to 59 Minutes | 0 (0.0%) | 0 (0.0%) |
| 60 to 89 Minutes | 0 (0.0%) | 71 (43.6%) |
| 90 or more Minutes | 0 (0.0%) | 0 (0.0%) |
Time of Departure to Work by Sex in Tumalo
The most frequent times of departure to work in Tumalo are 6:30 AM to 6:59 AM (105, 66.5%) for males and 11:00 AM to 11:59 AM (71, 43.6%) for females.
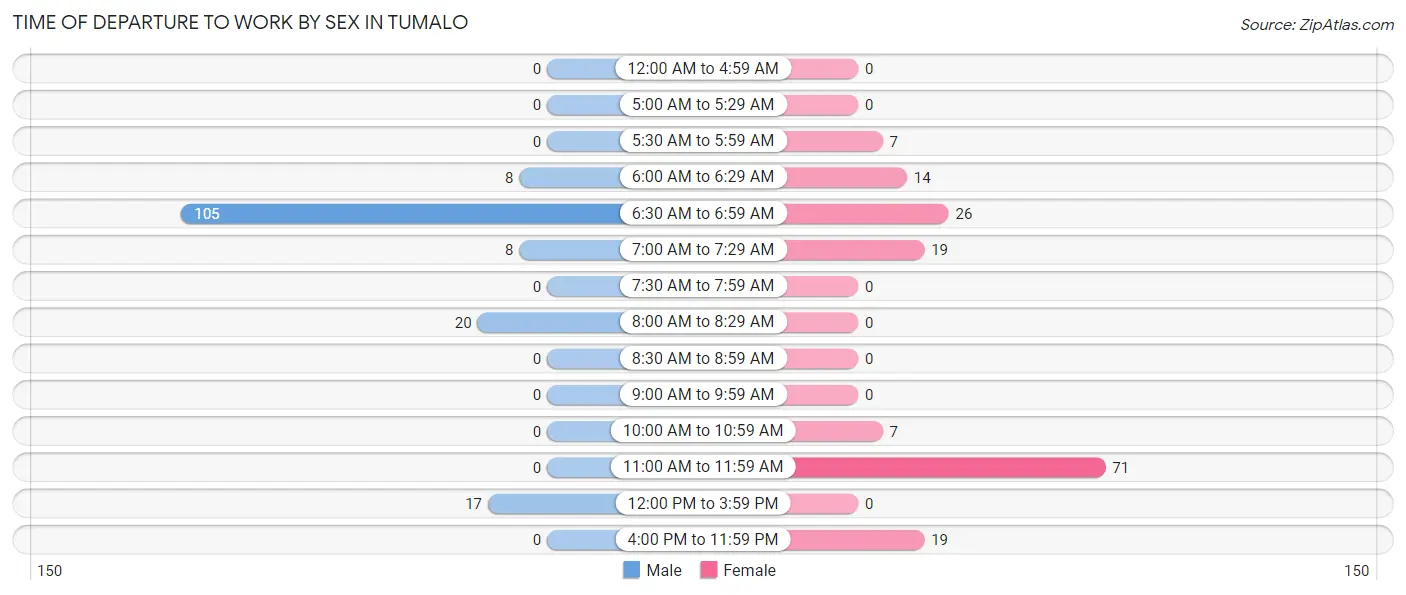
| Time of Departure | Male | Female |
| 12:00 AM to 4:59 AM | 0 (0.0%) | 0 (0.0%) |
| 5:00 AM to 5:29 AM | 0 (0.0%) | 0 (0.0%) |
| 5:30 AM to 5:59 AM | 0 (0.0%) | 7 (4.3%) |
| 6:00 AM to 6:29 AM | 8 (5.1%) | 14 (8.6%) |
| 6:30 AM to 6:59 AM | 105 (66.5%) | 26 (16.0%) |
| 7:00 AM to 7:29 AM | 8 (5.1%) | 19 (11.7%) |
| 7:30 AM to 7:59 AM | 0 (0.0%) | 0 (0.0%) |
| 8:00 AM to 8:29 AM | 20 (12.7%) | 0 (0.0%) |
| 8:30 AM to 8:59 AM | 0 (0.0%) | 0 (0.0%) |
| 9:00 AM to 9:59 AM | 0 (0.0%) | 0 (0.0%) |
| 10:00 AM to 10:59 AM | 0 (0.0%) | 7 (4.3%) |
| 11:00 AM to 11:59 AM | 0 (0.0%) | 71 (43.6%) |
| 12:00 PM to 3:59 PM | 17 (10.8%) | 0 (0.0%) |
| 4:00 PM to 11:59 PM | 0 (0.0%) | 19 (11.7%) |
| Total | 158 (100.0%) | 163 (100.0%) |
Housing Occupancy in Tumalo
Occupancy by Ownership in Tumalo
Of the total 206 dwellings in Tumalo, owner-occupied units account for 98 (47.6%), while renter-occupied units make up 108 (52.4%).
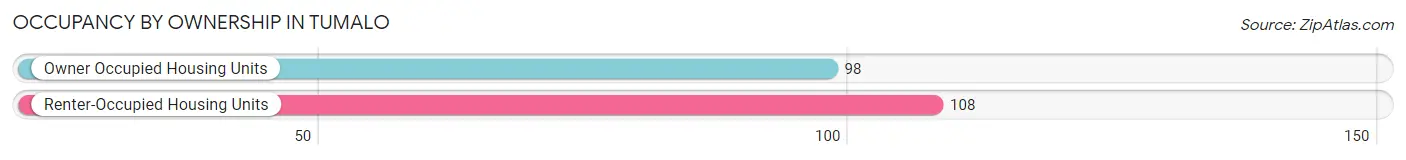
| Occupancy | # Housing Units | % Housing Units |
| Owner Occupied Housing Units | 98 | 47.6% |
| Renter-Occupied Housing Units | 108 | 52.4% |
| Total Occupied Housing Units | 206 | 100.0% |
Occupancy by Household Size in Tumalo
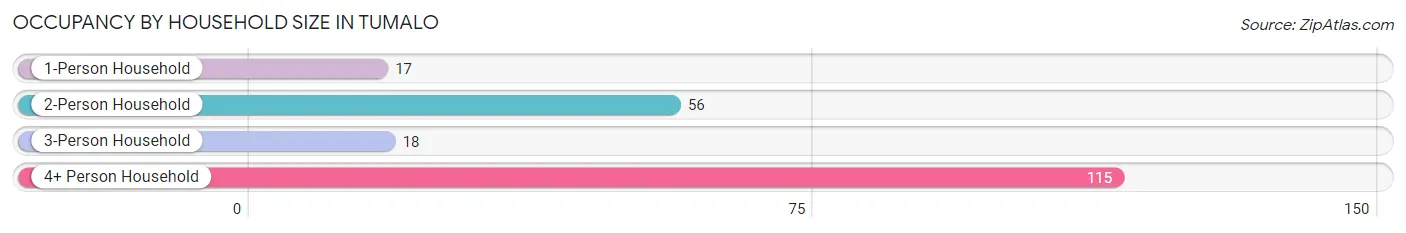
| Household Size | # Housing Units | % Housing Units |
| 1-Person Household | 17 | 8.3% |
| 2-Person Household | 56 | 27.2% |
| 3-Person Household | 18 | 8.7% |
| 4+ Person Household | 115 | 55.8% |
| Total Housing Units | 206 | 100.0% |
Occupancy by Ownership by Household Size in Tumalo
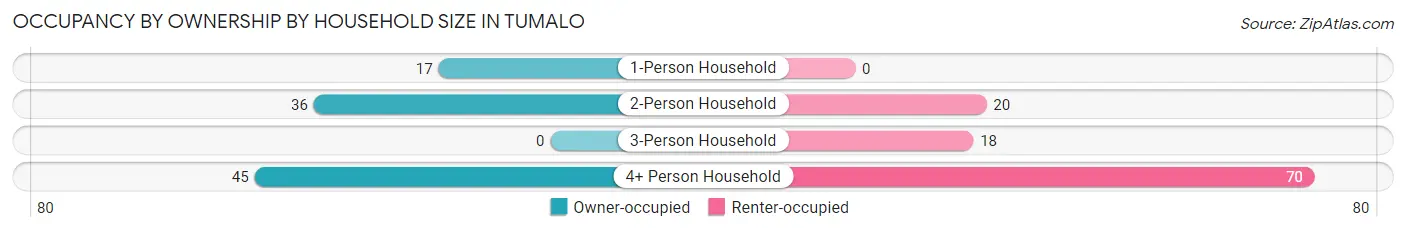
| Household Size | Owner-occupied | Renter-occupied |
| 1-Person Household | 17 (100.0%) | 0 (0.0%) |
| 2-Person Household | 36 (64.3%) | 20 (35.7%) |
| 3-Person Household | 0 (0.0%) | 18 (100.0%) |
| 4+ Person Household | 45 (39.1%) | 70 (60.9%) |
| Total Housing Units | 98 (47.6%) | 108 (52.4%) |
Occupancy by Educational Attainment in Tumalo
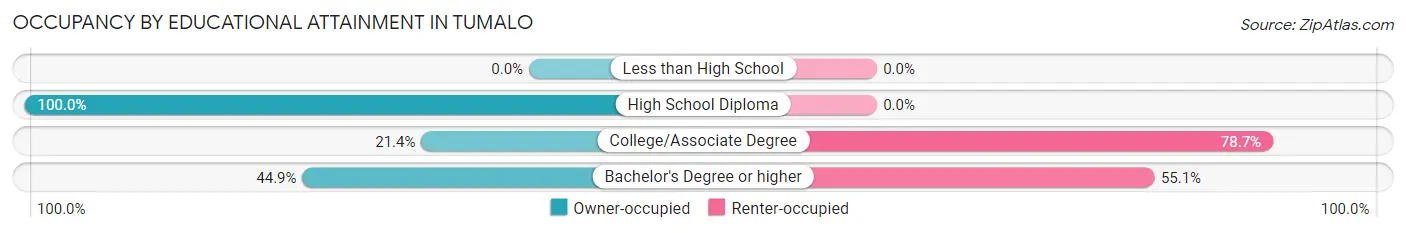
| Household Size | Owner-occupied | Renter-occupied |
| Less than High School | 0 (0.0%) | 0 (0.0%) |
| High School Diploma | 48 (100.0%) | 0 (0.0%) |
| College/Associate Degree | 19 (21.3%) | 70 (78.6%) |
| Bachelor's Degree or higher | 31 (44.9%) | 38 (55.1%) |
Occupancy by Age of Householder in Tumalo
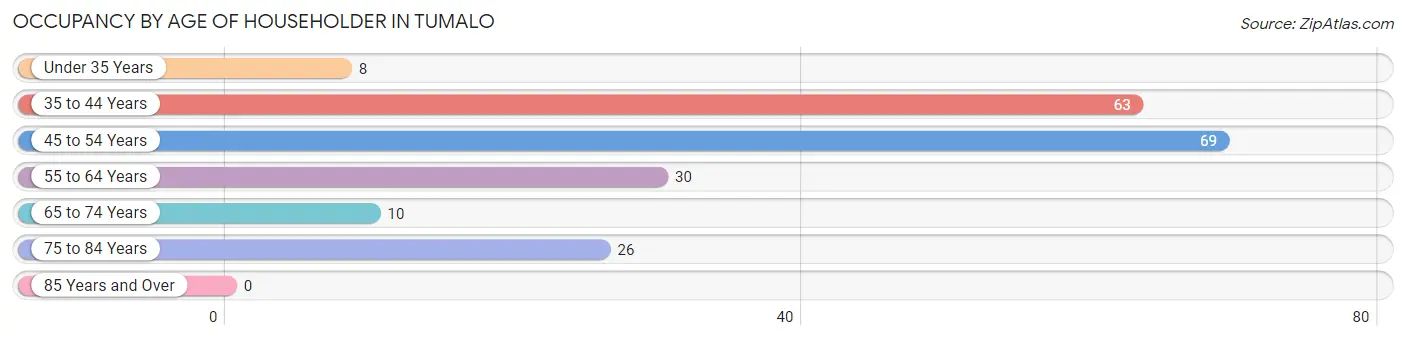
| Age Bracket | # Households | % Households |
| Under 35 Years | 8 | 3.9% |
| 35 to 44 Years | 63 | 30.6% |
| 45 to 54 Years | 69 | 33.5% |
| 55 to 64 Years | 30 | 14.6% |
| 65 to 74 Years | 10 | 4.9% |
| 75 to 84 Years | 26 | 12.6% |
| 85 Years and Over | 0 | 0.0% |
| Total | 206 | 100.0% |
Housing Finances in Tumalo
Median Income by Occupancy in Tumalo
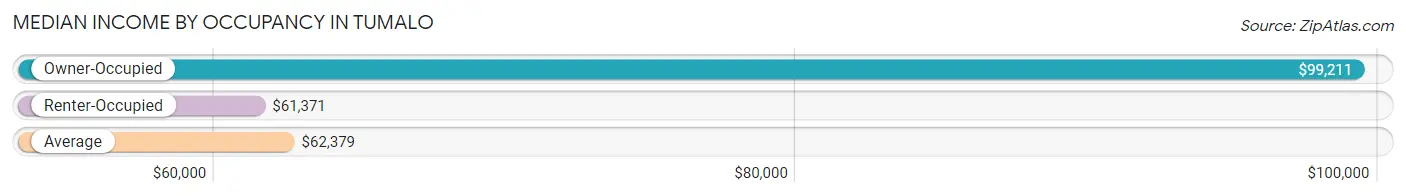
| Occupancy Type | # Households | Median Income |
| Owner-Occupied | 98 (47.6%) | $99,211 |
| Renter-Occupied | 108 (52.4%) | $61,371 |
| Average | 206 (100.0%) | $62,379 |
Occupancy by Householder Income Bracket in Tumalo
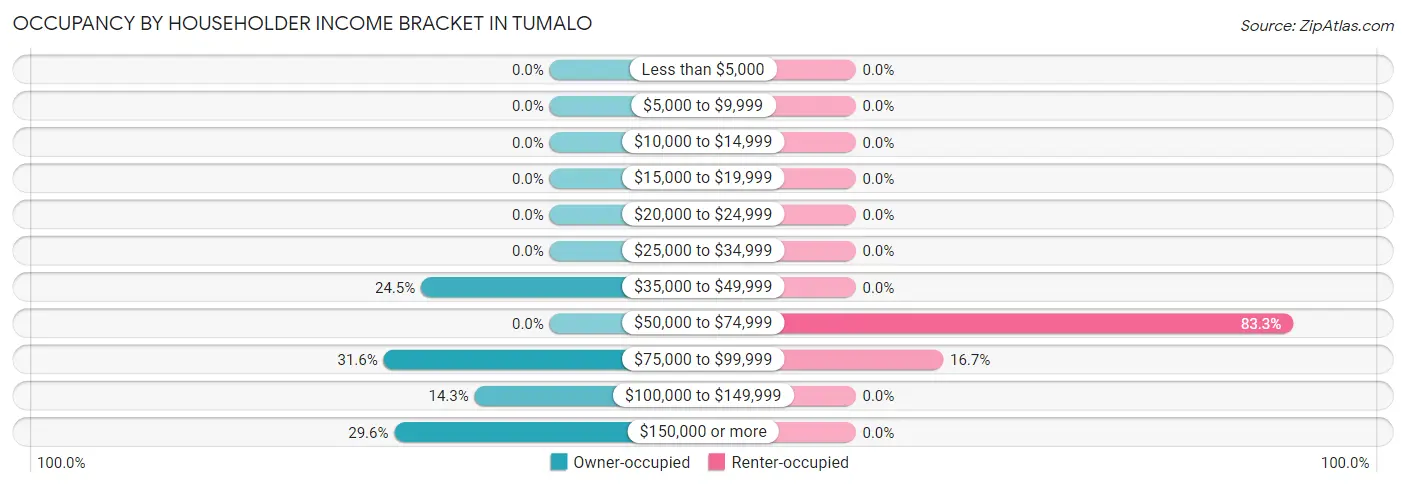
| Income Bracket | Owner-occupied | Renter-occupied |
| Less than $5,000 | 0 (0.0%) | 0 (0.0%) |
| $5,000 to $9,999 | 0 (0.0%) | 0 (0.0%) |
| $10,000 to $14,999 | 0 (0.0%) | 0 (0.0%) |
| $15,000 to $19,999 | 0 (0.0%) | 0 (0.0%) |
| $20,000 to $24,999 | 0 (0.0%) | 0 (0.0%) |
| $25,000 to $34,999 | 0 (0.0%) | 0 (0.0%) |
| $35,000 to $49,999 | 24 (24.5%) | 0 (0.0%) |
| $50,000 to $74,999 | 0 (0.0%) | 90 (83.3%) |
| $75,000 to $99,999 | 31 (31.6%) | 18 (16.7%) |
| $100,000 to $149,999 | 14 (14.3%) | 0 (0.0%) |
| $150,000 or more | 29 (29.6%) | 0 (0.0%) |
| Total | 98 (100.0%) | 108 (100.0%) |
Monthly Housing Cost Tiers in Tumalo
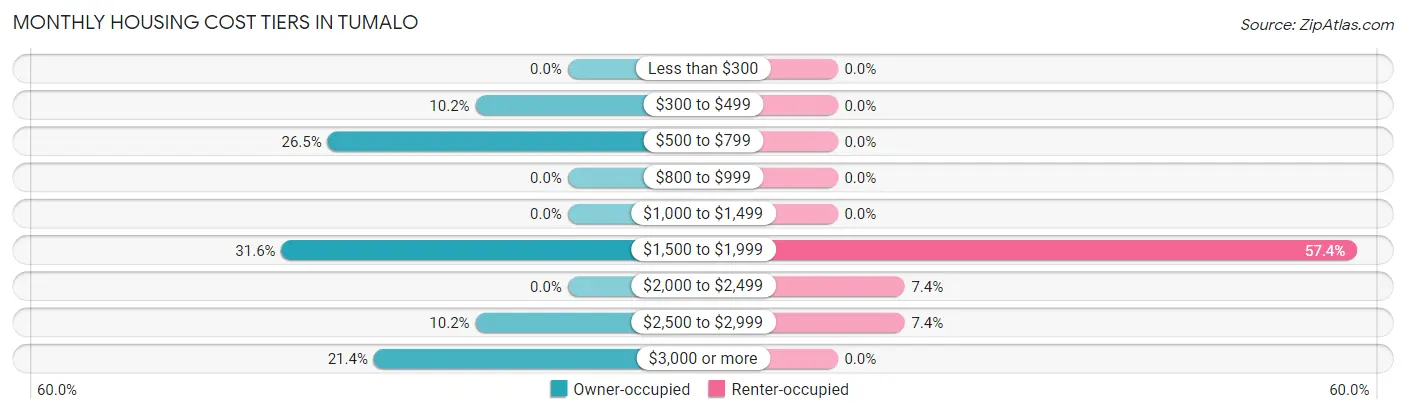
| Monthly Cost | Owner-occupied | Renter-occupied |
| Less than $300 | 0 (0.0%) | 0 (0.0%) |
| $300 to $499 | 10 (10.2%) | 0 (0.0%) |
| $500 to $799 | 26 (26.5%) | 0 (0.0%) |
| $800 to $999 | 0 (0.0%) | 0 (0.0%) |
| $1,000 to $1,499 | 0 (0.0%) | 0 (0.0%) |
| $1,500 to $1,999 | 31 (31.6%) | 62 (57.4%) |
| $2,000 to $2,499 | 0 (0.0%) | 8 (7.4%) |
| $2,500 to $2,999 | 10 (10.2%) | 8 (7.4%) |
| $3,000 or more | 21 (21.4%) | 0 (0.0%) |
| Total | 98 (100.0%) | 108 (100.0%) |
Physical Housing Characteristics in Tumalo
Housing Structures in Tumalo
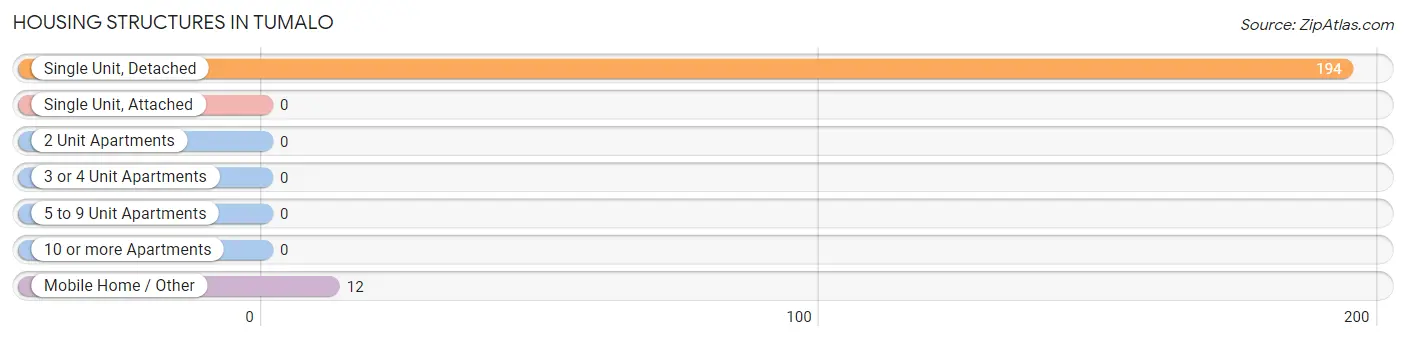
| Structure Type | # Housing Units | % Housing Units |
| Single Unit, Detached | 194 | 94.2% |
| Single Unit, Attached | 0 | 0.0% |
| 2 Unit Apartments | 0 | 0.0% |
| 3 or 4 Unit Apartments | 0 | 0.0% |
| 5 to 9 Unit Apartments | 0 | 0.0% |
| 10 or more Apartments | 0 | 0.0% |
| Mobile Home / Other | 12 | 5.8% |
| Total | 206 | 100.0% |
Housing Structures by Occupancy in Tumalo
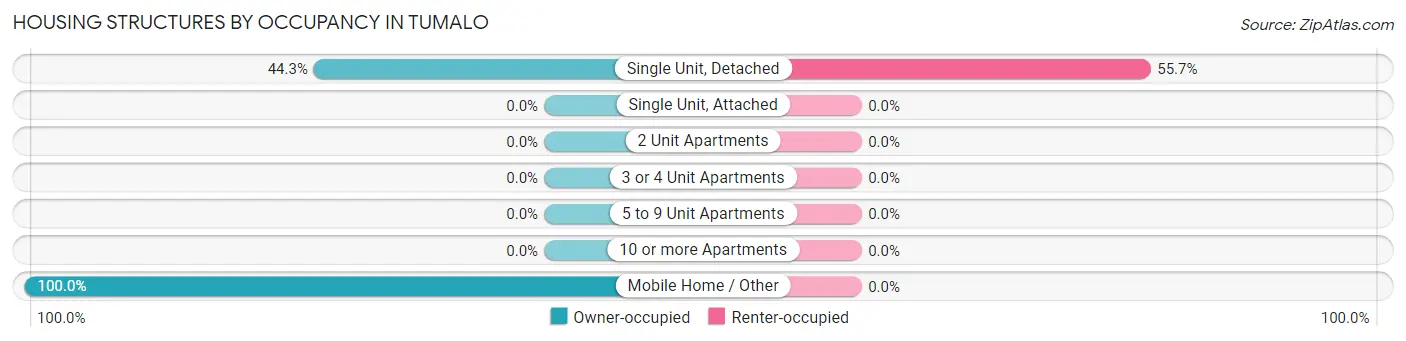
| Structure Type | Owner-occupied | Renter-occupied |
| Single Unit, Detached | 86 (44.3%) | 108 (55.7%) |
| Single Unit, Attached | 0 (0.0%) | 0 (0.0%) |
| 2 Unit Apartments | 0 (0.0%) | 0 (0.0%) |
| 3 or 4 Unit Apartments | 0 (0.0%) | 0 (0.0%) |
| 5 to 9 Unit Apartments | 0 (0.0%) | 0 (0.0%) |
| 10 or more Apartments | 0 (0.0%) | 0 (0.0%) |
| Mobile Home / Other | 12 (100.0%) | 0 (0.0%) |
| Total | 98 (47.6%) | 108 (52.4%) |
Housing Structures by Number of Rooms in Tumalo
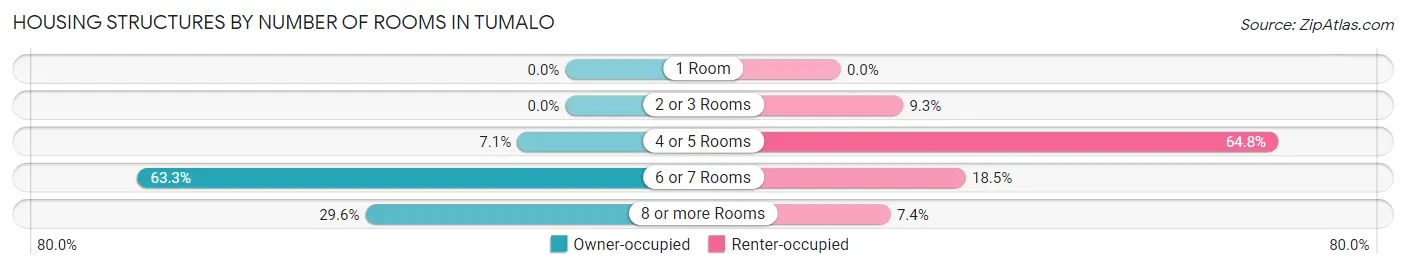
| Number of Rooms | Owner-occupied | Renter-occupied |
| 1 Room | 0 (0.0%) | 0 (0.0%) |
| 2 or 3 Rooms | 0 (0.0%) | 10 (9.3%) |
| 4 or 5 Rooms | 7 (7.1%) | 70 (64.8%) |
| 6 or 7 Rooms | 62 (63.3%) | 20 (18.5%) |
| 8 or more Rooms | 29 (29.6%) | 8 (7.4%) |
| Total | 98 (100.0%) | 108 (100.0%) |
Housing Structure by Heating Type in Tumalo
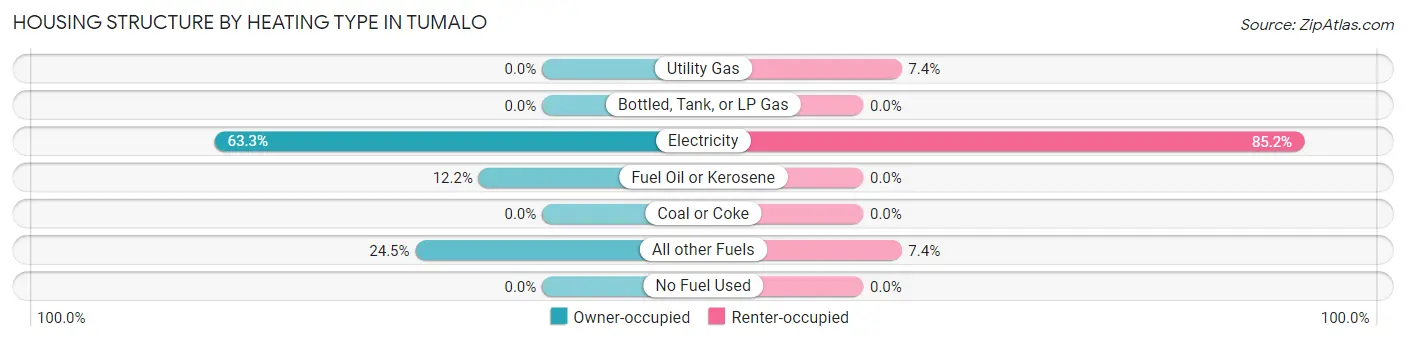
| Heating Type | Owner-occupied | Renter-occupied |
| Utility Gas | 0 (0.0%) | 8 (7.4%) |
| Bottled, Tank, or LP Gas | 0 (0.0%) | 0 (0.0%) |
| Electricity | 62 (63.3%) | 92 (85.2%) |
| Fuel Oil or Kerosene | 12 (12.2%) | 0 (0.0%) |
| Coal or Coke | 0 (0.0%) | 0 (0.0%) |
| All other Fuels | 24 (24.5%) | 8 (7.4%) |
| No Fuel Used | 0 (0.0%) | 0 (0.0%) |
| Total | 98 (100.0%) | 108 (100.0%) |
Household Vehicle Usage in Tumalo
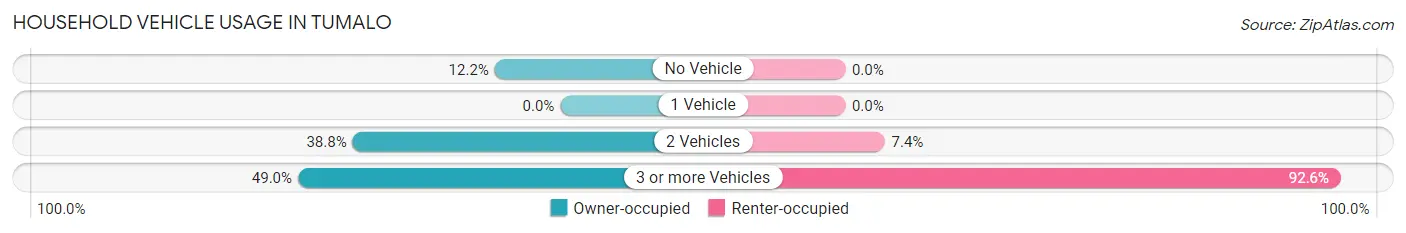
| Vehicles per Household | Owner-occupied | Renter-occupied |
| No Vehicle | 12 (12.2%) | 0 (0.0%) |
| 1 Vehicle | 0 (0.0%) | 0 (0.0%) |
| 2 Vehicles | 38 (38.8%) | 8 (7.4%) |
| 3 or more Vehicles | 48 (49.0%) | 100 (92.6%) |
| Total | 98 (100.0%) | 108 (100.0%) |
Real Estate & Mortgages in Tumalo
Real Estate and Mortgage Overview in Tumalo
| Characteristic | Without Mortgage | With Mortgage |
| Housing Units | 22 | 76 |
| Median Property Value | - | - |
| Median Household Income | - | - |
| Monthly Housing Costs | - | - |
| Real Estate Taxes | - | - |
Property Value by Mortgage Status in Tumalo
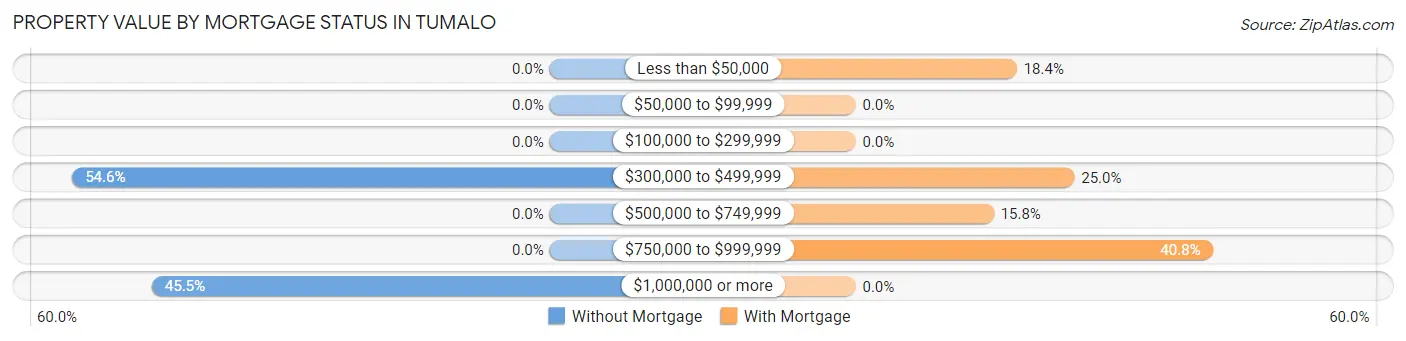
| Property Value | Without Mortgage | With Mortgage |
| Less than $50,000 | 0 (0.0%) | 14 (18.4%) |
| $50,000 to $99,999 | 0 (0.0%) | 0 (0.0%) |
| $100,000 to $299,999 | 0 (0.0%) | 0 (0.0%) |
| $300,000 to $499,999 | 12 (54.5%) | 19 (25.0%) |
| $500,000 to $749,999 | 0 (0.0%) | 12 (15.8%) |
| $750,000 to $999,999 | 0 (0.0%) | 31 (40.8%) |
| $1,000,000 or more | 10 (45.5%) | 0 (0.0%) |
| Total | 22 (100.0%) | 76 (100.0%) |
Household Income by Mortgage Status in Tumalo
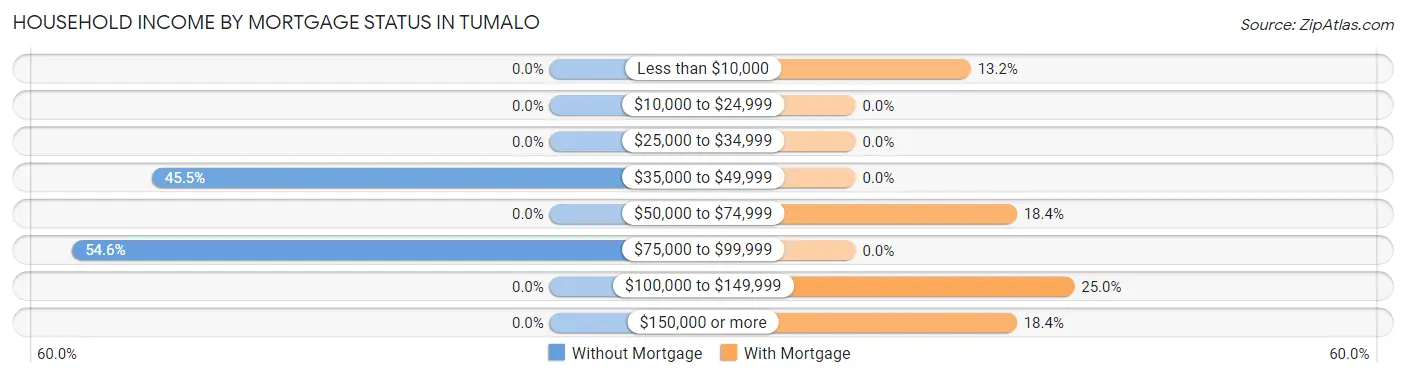
| Household Income | Without Mortgage | With Mortgage |
| Less than $10,000 | 0 (0.0%) | 10 (13.2%) |
| $10,000 to $24,999 | 0 (0.0%) | 0 (0.0%) |
| $25,000 to $34,999 | 0 (0.0%) | 0 (0.0%) |
| $35,000 to $49,999 | 10 (45.5%) | 0 (0.0%) |
| $50,000 to $74,999 | 0 (0.0%) | 14 (18.4%) |
| $75,000 to $99,999 | 12 (54.5%) | 0 (0.0%) |
| $100,000 to $149,999 | 0 (0.0%) | 19 (25.0%) |
| $150,000 or more | 0 (0.0%) | 14 (18.4%) |
| Total | 22 (100.0%) | 76 (100.0%) |
Property Value to Household Income Ratio in Tumalo
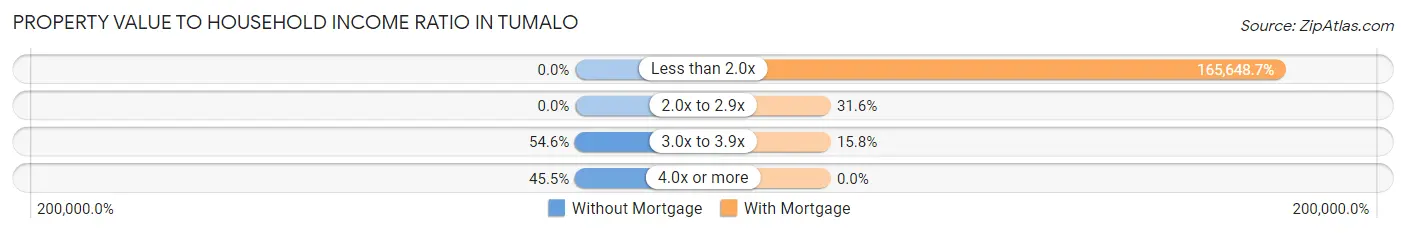
| Value-to-Income Ratio | Without Mortgage | With Mortgage |
| Less than 2.0x | 0 (0.0%) | 125,893 (165,648.7%) |
| 2.0x to 2.9x | 0 (0.0%) | 24 (31.6%) |
| 3.0x to 3.9x | 12 (54.5%) | 12 (15.8%) |
| 4.0x or more | 10 (45.5%) | 0 (0.0%) |
| Total | 22 (100.0%) | 76 (100.0%) |
Real Estate Taxes by Mortgage Status in Tumalo
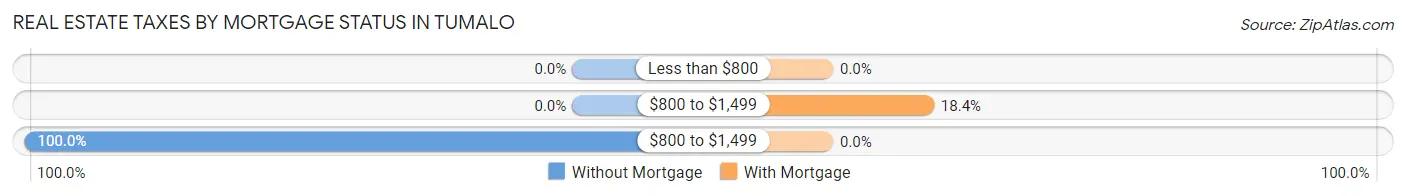
| Property Taxes | Without Mortgage | With Mortgage |
| Less than $800 | 0 (0.0%) | 0 (0.0%) |
| $800 to $1,499 | 0 (0.0%) | 14 (18.4%) |
| $800 to $1,499 | 22 (100.0%) | 0 (0.0%) |
| Total | 22 (100.0%) | 76 (100.0%) |
Health & Disability in Tumalo
Health Insurance Coverage by Age in Tumalo
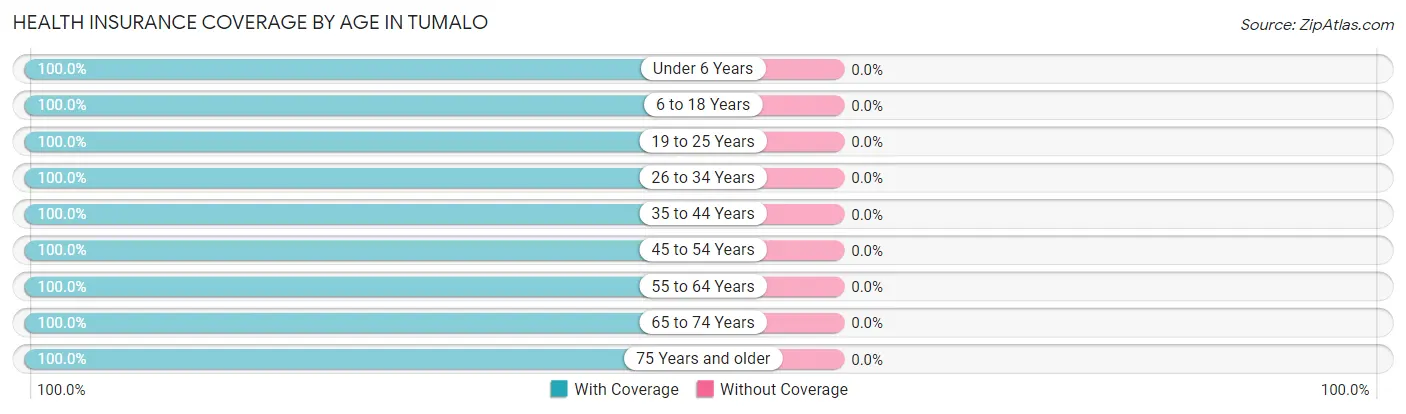
| Age Bracket | With Coverage | Without Coverage |
| Under 6 Years | 91 (100.0%) | 0 (0.0%) |
| 6 to 18 Years | 55 (100.0%) | 0 (0.0%) |
| 19 to 25 Years | 67 (100.0%) | 0 (0.0%) |
| 26 to 34 Years | 37 (100.0%) | 0 (0.0%) |
| 35 to 44 Years | 111 (100.0%) | 0 (0.0%) |
| 45 to 54 Years | 140 (100.0%) | 0 (0.0%) |
| 55 to 64 Years | 129 (100.0%) | 0 (0.0%) |
| 65 to 74 Years | 21 (100.0%) | 0 (0.0%) |
| 75 Years and older | 36 (100.0%) | 0 (0.0%) |
| Total | 687 (100.0%) | 0 (0.0%) |
Health Insurance Coverage by Citizenship Status in Tumalo
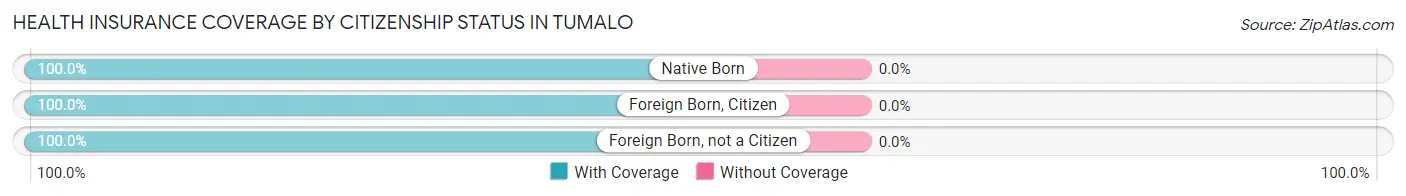
| Citizenship Status | With Coverage | Without Coverage |
| Native Born | 91 (100.0%) | 0 (0.0%) |
| Foreign Born, Citizen | 55 (100.0%) | 0 (0.0%) |
| Foreign Born, not a Citizen | 67 (100.0%) | 0 (0.0%) |
Health Insurance Coverage by Household Income in Tumalo
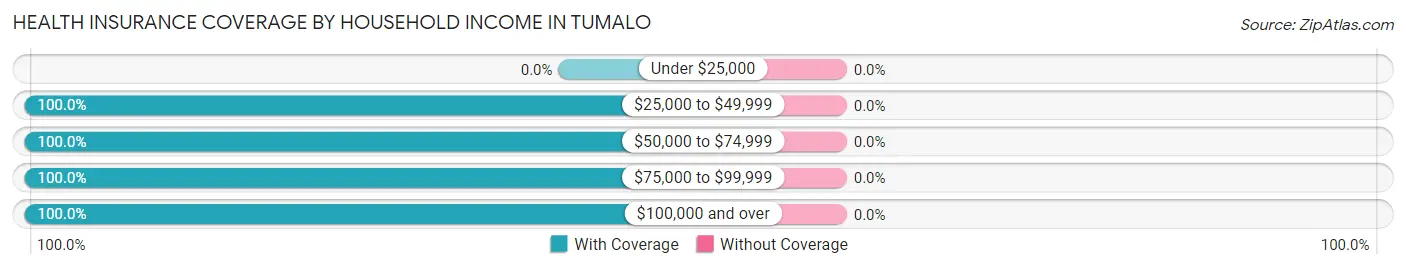
| Household Income | With Coverage | Without Coverage |
| Under $25,000 | 0 (0.0%) | 0 (0.0%) |
| $25,000 to $49,999 | 35 (100.0%) | 0 (0.0%) |
| $50,000 to $74,999 | 334 (100.0%) | 0 (0.0%) |
| $75,000 to $99,999 | 176 (100.0%) | 0 (0.0%) |
| $100,000 and over | 142 (100.0%) | 0 (0.0%) |
Public vs Private Health Insurance Coverage by Age in Tumalo
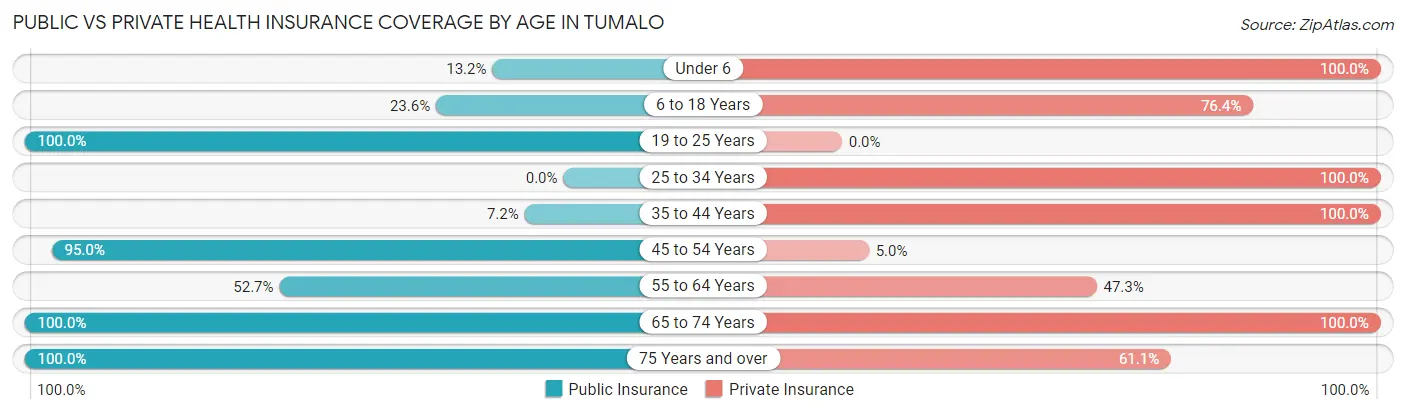
| Age Bracket | Public Insurance | Private Insurance |
| Under 6 | 12 (13.2%) | 91 (100.0%) |
| 6 to 18 Years | 13 (23.6%) | 42 (76.4%) |
| 19 to 25 Years | 67 (100.0%) | 0 (0.0%) |
| 25 to 34 Years | 0 (0.0%) | 37 (100.0%) |
| 35 to 44 Years | 8 (7.2%) | 111 (100.0%) |
| 45 to 54 Years | 133 (95.0%) | 7 (5.0%) |
| 55 to 64 Years | 68 (52.7%) | 61 (47.3%) |
| 65 to 74 Years | 21 (100.0%) | 21 (100.0%) |
| 75 Years and over | 36 (100.0%) | 22 (61.1%) |
| Total | 358 (52.1%) | 392 (57.1%) |
Disability Status by Sex by Age in Tumalo
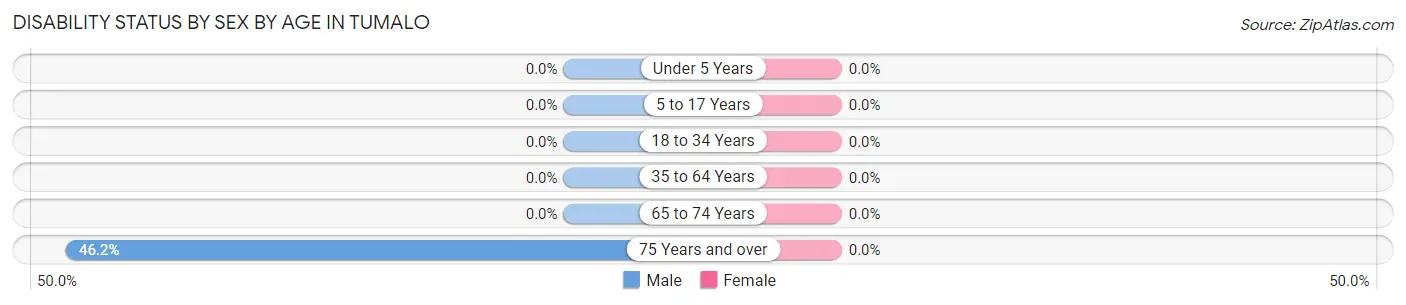
| Age Bracket | Male | Female |
| Under 5 Years | 0 (0.0%) | 0 (0.0%) |
| 5 to 17 Years | 0 (0.0%) | 0 (0.0%) |
| 18 to 34 Years | 0 (0.0%) | 0 (0.0%) |
| 35 to 64 Years | 0 (0.0%) | 0 (0.0%) |
| 65 to 74 Years | 0 (0.0%) | 0 (0.0%) |
| 75 Years and over | 12 (46.2%) | 0 (0.0%) |
Disability Class by Sex by Age in Tumalo
Disability Class: Hearing Difficulty
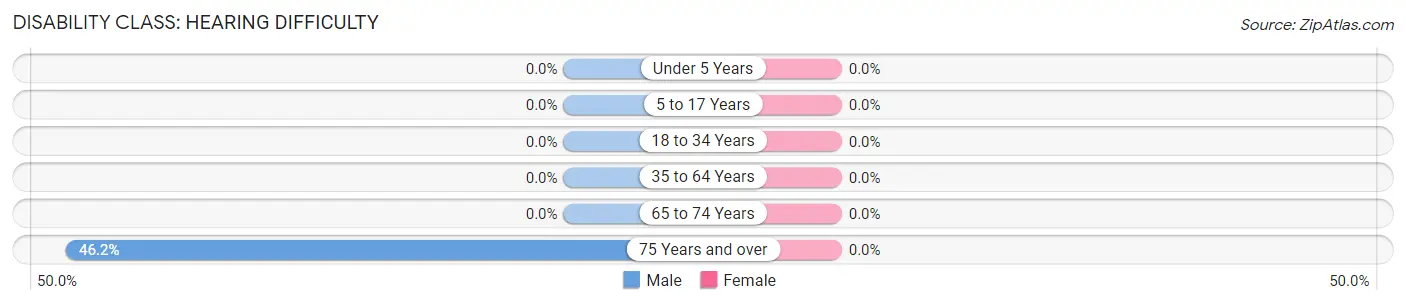
| Age Bracket | Male | Female |
| Under 5 Years | 0 (0.0%) | 0 (0.0%) |
| 5 to 17 Years | 0 (0.0%) | 0 (0.0%) |
| 18 to 34 Years | 0 (0.0%) | 0 (0.0%) |
| 35 to 64 Years | 0 (0.0%) | 0 (0.0%) |
| 65 to 74 Years | 0 (0.0%) | 0 (0.0%) |
| 75 Years and over | 12 (46.2%) | 0 (0.0%) |
Disability Class: Vision Difficulty
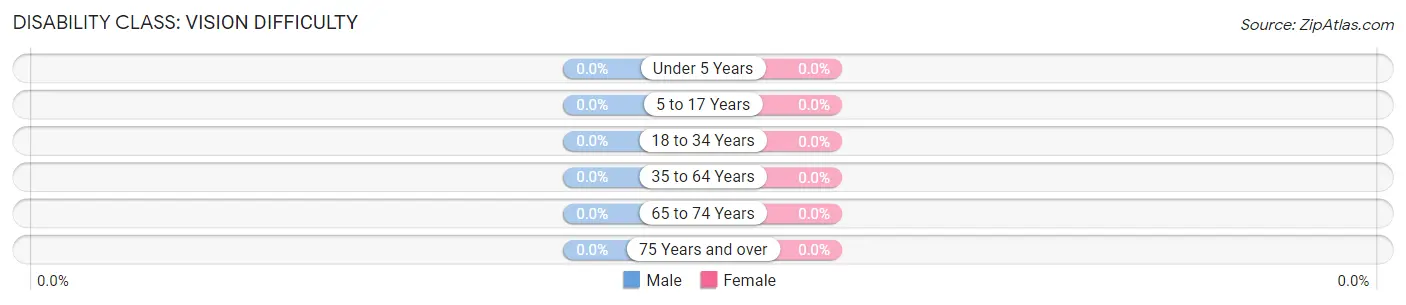
| Age Bracket | Male | Female |
| Under 5 Years | 0 (0.0%) | 0 (0.0%) |
| 5 to 17 Years | 0 (0.0%) | 0 (0.0%) |
| 18 to 34 Years | 0 (0.0%) | 0 (0.0%) |
| 35 to 64 Years | 0 (0.0%) | 0 (0.0%) |
| 65 to 74 Years | 0 (0.0%) | 0 (0.0%) |
| 75 Years and over | 0 (0.0%) | 0 (0.0%) |
Disability Class: Cognitive Difficulty
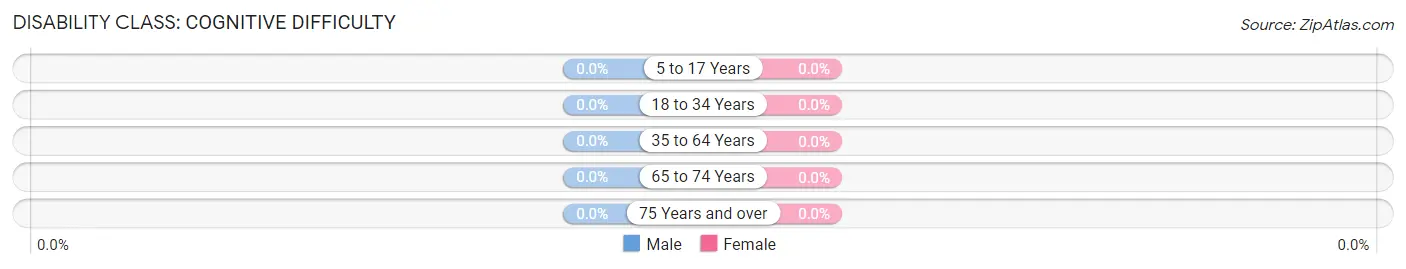
| Age Bracket | Male | Female |
| 5 to 17 Years | 0 (0.0%) | 0 (0.0%) |
| 18 to 34 Years | 0 (0.0%) | 0 (0.0%) |
| 35 to 64 Years | 0 (0.0%) | 0 (0.0%) |
| 65 to 74 Years | 0 (0.0%) | 0 (0.0%) |
| 75 Years and over | 0 (0.0%) | 0 (0.0%) |
Disability Class: Ambulatory Difficulty
| Age Bracket | Male | Female |
| 5 to 17 Years | 0 (0.0%) | 0 (0.0%) |
| 18 to 34 Years | 0 (0.0%) | 0 (0.0%) |
| 35 to 64 Years | 0 (0.0%) | 0 (0.0%) |
| 65 to 74 Years | 0 (0.0%) | 0 (0.0%) |
| 75 Years and over | 0 (0.0%) | 0 (0.0%) |
Disability Class: Self-Care Difficulty
| Age Bracket | Male | Female |
| 5 to 17 Years | 0 (0.0%) | 0 (0.0%) |
| 18 to 34 Years | 0 (0.0%) | 0 (0.0%) |
| 35 to 64 Years | 0 (0.0%) | 0 (0.0%) |
| 65 to 74 Years | 0 (0.0%) | 0 (0.0%) |
| 75 Years and over | 0 (0.0%) | 0 (0.0%) |
Technology Access in Tumalo
Computing Device Access in Tumalo
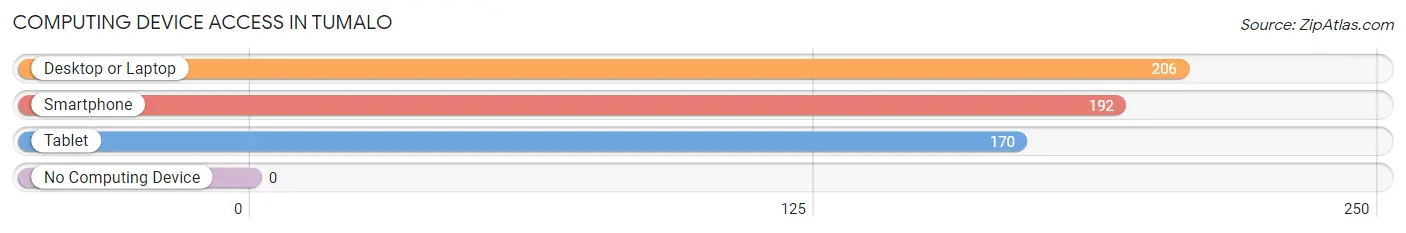
| Device Type | # Households | % Households |
| Desktop or Laptop | 206 | 100.0% |
| Smartphone | 192 | 93.2% |
| Tablet | 170 | 82.5% |
| No Computing Device | 0 | 0.0% |
| Total | 206 | 100.0% |
Internet Access in Tumalo
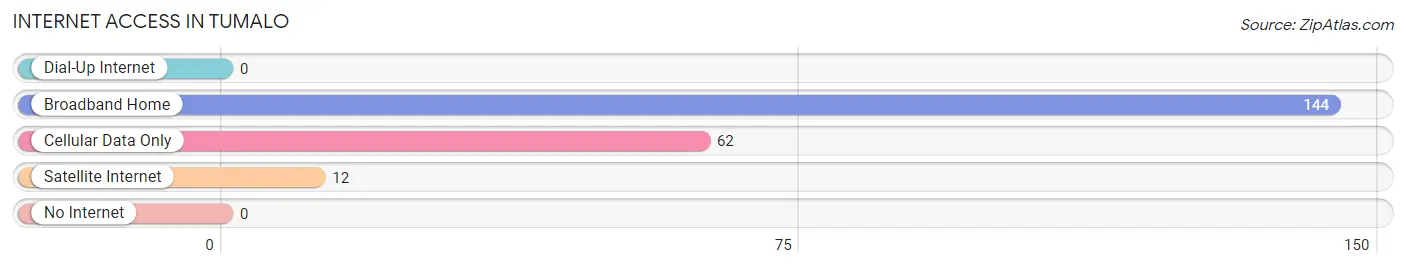
| Internet Type | # Households | % Households |
| Dial-Up Internet | 0 | 0.0% |
| Broadband Home | 144 | 69.9% |
| Cellular Data Only | 62 | 30.1% |
| Satellite Internet | 12 | 5.8% |
| No Internet | 0 | 0.0% |
| Total | 206 | 100.0% |
Tumalo Summary
Tumalo is an unincorporated community located in Deschutes County, Oregon, United States. It is situated in the foothills of the Cascade Mountains, approximately 10 miles northwest of Bend. The community is located along the Deschutes River, and is home to a variety of businesses, including a winery, a brewery, and a distillery.
History
The area now known as Tumalo was originally inhabited by the Northern Paiute people. The first non-native settlers arrived in the area in the late 1800s, and the community was officially established in 1891. The name “Tumalo” is derived from the Northern Paiute word for “meeting place”.
In the early 1900s, the area was primarily used for ranching and farming. The first post office was established in 1910, and the first school was built in 1912. The community continued to grow throughout the 20th century, and in the 1950s, the area began to attract tourists and outdoor enthusiasts.
Geography
Tumalo is located in the foothills of the Cascade Mountains, approximately 10 miles northwest of Bend. The community is situated along the Deschutes River, and is surrounded by the Deschutes National Forest. The area is characterized by rolling hills, pine forests, and open meadows.
The climate in Tumalo is generally mild, with hot summers and cold winters. The average annual temperature is around 50°F, and the average annual precipitation is around 20 inches.
Economy
Tumalo’s economy is primarily driven by tourism and outdoor recreation. The area is home to a variety of businesses, including a winery, a brewery, and a distillery. The community is also home to several restaurants, cafes, and shops.
In addition to tourism, the area is also home to several small businesses, including a lumber mill, a sawmill, and a woodworking shop. The area is also home to several farms, which produce a variety of fruits and vegetables.
Demographics
As of the 2010 census, the population of Tumalo was 1,845. The racial makeup of the community was 94.3% White, 0.7% Native American, 0.3% Asian, 0.2% African American, and 4.5% from other races. The median household income was $50,000, and the median age was 44.
Tumalo is a small, rural community with a strong sense of community and a commitment to preserving its natural beauty. The area is home to a variety of businesses, and is a popular destination for outdoor enthusiasts. The community is also home to a variety of cultural and recreational activities, including festivals, concerts, and outdoor activities.
Common Questions
What is Per Capita Income in Tumalo?
Per Capita income in Tumalo is $34,332.
What is the Median Household income in Tumalo?
Median Household Income in Tumalo is $62,379.
What is Inequality or Gini Index in Tumalo?
Inequality or Gini Index in Tumalo is 0.42.
What is the Total Population of Tumalo?
Total Population of Tumalo is 687.
What is the Total Male Population of Tumalo?
Total Male Population of Tumalo is 256.
What is the Total Female Population of Tumalo?
Total Female Population of Tumalo is 431.
What is the Ratio of Males per 100 Females in Tumalo?
There are 59.40 Males per 100 Females in Tumalo.
What is the Ratio of Females per 100 Males in Tumalo?
There are 168.36 Females per 100 Males in Tumalo.
What is the Median Population Age in Tumalo?
Median Population Age in Tumalo is 42.8 Years.
What is the Average Family Size in Tumalo
Average Family Size in Tumalo is 3.2 People.
What is the Average Household Size in Tumalo
Average Household Size in Tumalo is 3.3 People.
How Large is the Labor Force in Tumalo?
There are 345 People in the Labor Forcein in Tumalo.
What is the Percentage of People in the Labor Force in Tumalo?
61.0% of People are in the Labor Force in Tumalo.