Mount Angel, OR Map & Demographics
Mount Angel Map
Mount Angel Overview
$28,738
PER CAPITA INCOME
$77,250
AVG FAMILY INCOME
$54,583
AVG HOUSEHOLD INCOME
50.8%
WAGE / INCOME GAP [ % ]
49.2¢/ $1
WAGE / INCOME GAP [ $ ]
0.45
INEQUALITY / GINI INDEX
3,413
TOTAL POPULATION
1,422
MALE POPULATION
1,991
FEMALE POPULATION
71.42
MALES / 100 FEMALES
140.01
FEMALES / 100 MALES
38.5
MEDIAN AGE
3.4
AVG FAMILY SIZE
2.5
AVG HOUSEHOLD SIZE
1,417
LABOR FORCE [ PEOPLE ]
54.3%
PERCENT IN LABOR FORCE
11.2%
UNEMPLOYMENT RATE
Mount Angel Zip Codes
Income in Mount Angel
Income Overview in Mount Angel
Per Capita Income in Mount Angel is $28,738, while median incomes of families and households are $77,250 and $54,583 respectively.
| Characteristic | Number | Measure |
| Per Capita Income | 3,413 | $28,738 |
| Median Family Income | 754 | $77,250 |
| Mean Family Income | 754 | $89,910 |
| Median Household Income | 1,275 | $54,583 |
| Mean Household Income | 1,275 | $70,854 |
| Income Deficit | 754 | $0 |
| Wage / Income Gap (%) | 3,413 | 50.81% |
| Wage / Income Gap ($) | 3,413 | 49.19¢ per $1 |
| Gini / Inequality Index | 3,413 | 0.45 |
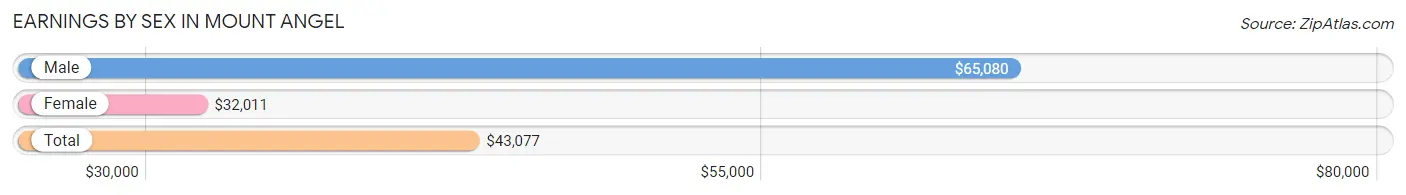
Earnings by Sex in Mount Angel
Average Earnings in Mount Angel are $43,077, $65,080 for men and $32,011 for women, a difference of 50.8%.
| Sex | Number | Average Earnings |
| Male | 713 (50.3%) | $65,080 |
| Female | 705 (49.7%) | $32,011 |
| Total | 1,418 (100.0%) | $43,077 |
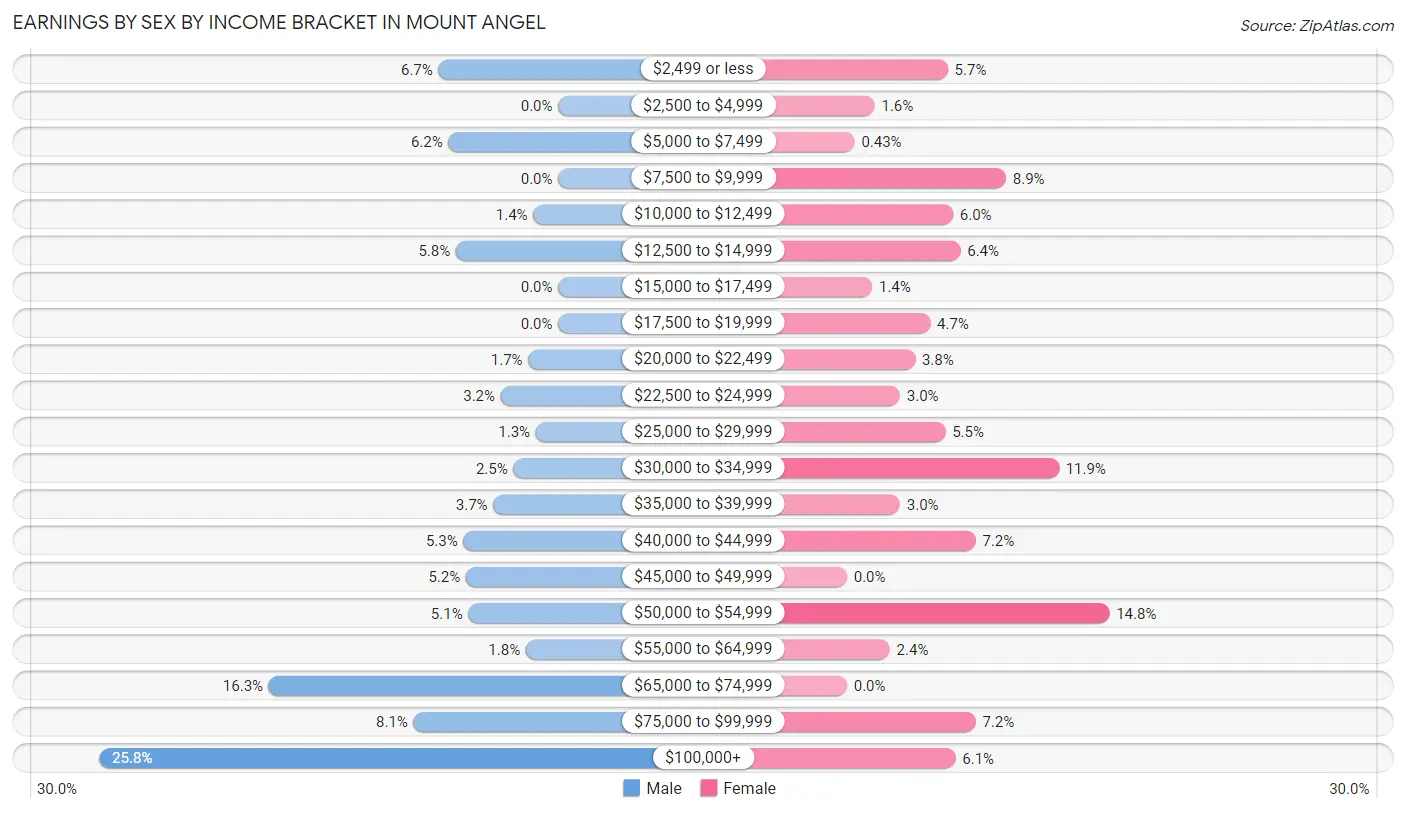
Earnings by Sex by Income Bracket in Mount Angel
The most common earnings brackets in Mount Angel are $100,000+ for men (184 | 25.8%) and $50,000 to $54,999 for women (104 | 14.7%).
| Income | Male | Female |
| $2,499 or less | 48 (6.7%) | 40 (5.7%) |
| $2,500 to $4,999 | 0 (0.0%) | 11 (1.6%) |
| $5,000 to $7,499 | 44 (6.2%) | 3 (0.4%) |
| $7,500 to $9,999 | 0 (0.0%) | 63 (8.9%) |
| $10,000 to $12,499 | 10 (1.4%) | 42 (6.0%) |
| $12,500 to $14,999 | 41 (5.8%) | 45 (6.4%) |
| $15,000 to $17,499 | 0 (0.0%) | 10 (1.4%) |
| $17,500 to $19,999 | 0 (0.0%) | 33 (4.7%) |
| $20,000 to $22,499 | 12 (1.7%) | 27 (3.8%) |
| $22,500 to $24,999 | 23 (3.2%) | 21 (3.0%) |
| $25,000 to $29,999 | 9 (1.3%) | 39 (5.5%) |
| $30,000 to $34,999 | 18 (2.5%) | 84 (11.9%) |
| $35,000 to $39,999 | 26 (3.6%) | 21 (3.0%) |
| $40,000 to $44,999 | 38 (5.3%) | 51 (7.2%) |
| $45,000 to $49,999 | 37 (5.2%) | 0 (0.0%) |
| $50,000 to $54,999 | 36 (5.1%) | 104 (14.7%) |
| $55,000 to $64,999 | 13 (1.8%) | 17 (2.4%) |
| $65,000 to $74,999 | 116 (16.3%) | 0 (0.0%) |
| $75,000 to $99,999 | 58 (8.1%) | 51 (7.2%) |
| $100,000+ | 184 (25.8%) | 43 (6.1%) |
| Total | 713 (100.0%) | 705 (100.0%) |
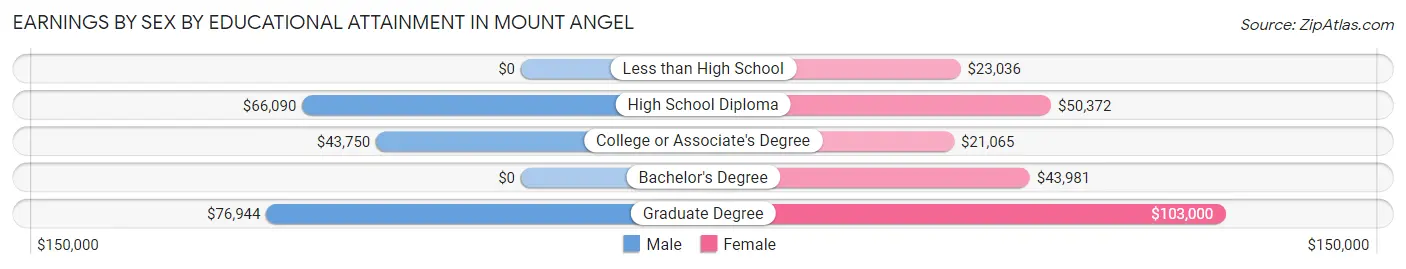
Earnings by Sex by Educational Attainment in Mount Angel
Average earnings in Mount Angel are $66,250 for men and $34,611 for women, a difference of 47.8%. Men with an educational attainment of graduate degree enjoy the highest average annual earnings of $76,944, while those with college or associate's degree education earn the least with $43,750. Women with an educational attainment of graduate degree earn the most with the average annual earnings of $103,000, while those with college or associate's degree education have the smallest earnings of $21,065.
| Educational Attainment | Male Income | Female Income |
| Less than High School | - | - |
| High School Diploma | $66,090 | $50,372 |
| College or Associate's Degree | $43,750 | $21,065 |
| Bachelor's Degree | - | - |
| Graduate Degree | $76,944 | $103,000 |
| Total | $66,250 | $34,611 |
Family Income in Mount Angel
Family Income Brackets in Mount Angel
According to the Mount Angel family income data, there are 146 families falling into the $75,000 to $99,999 income range, which is the most common income bracket and makes up 19.4% of all families.
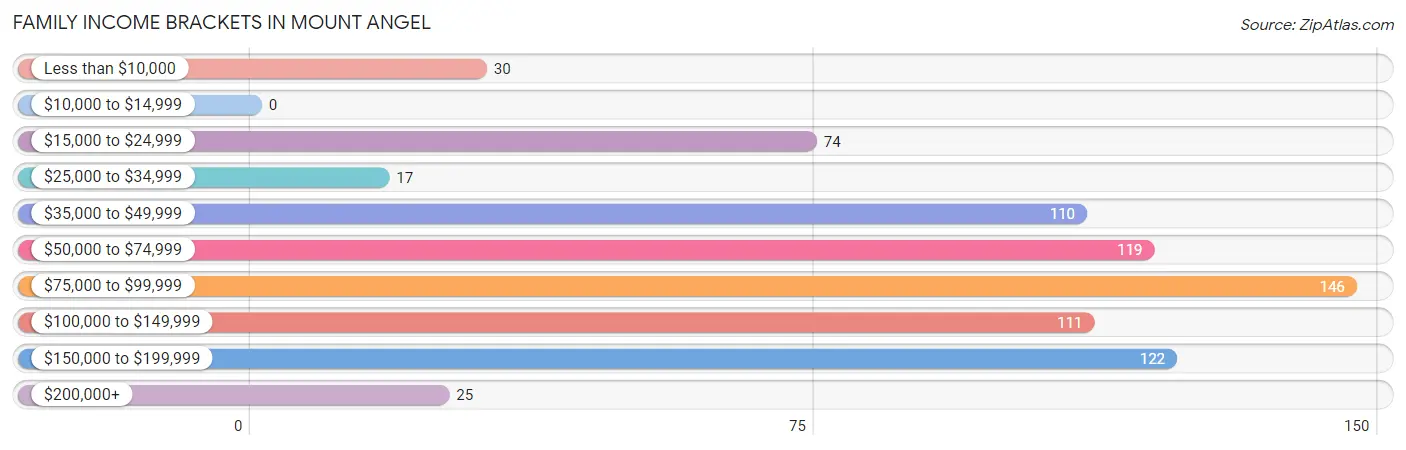
| Income Bracket | # Families | % Families |
| Less than $10,000 | 30 | 4.0% |
| $10,000 to $14,999 | 0 | 0.0% |
| $15,000 to $24,999 | 74 | 9.8% |
| $25,000 to $34,999 | 17 | 2.3% |
| $35,000 to $49,999 | 110 | 14.6% |
| $50,000 to $74,999 | 119 | 15.8% |
| $75,000 to $99,999 | 146 | 19.4% |
| $100,000 to $149,999 | 111 | 14.7% |
| $150,000 to $199,999 | 122 | 16.2% |
| $200,000+ | 25 | 3.3% |
Family Income by Famaliy Size in Mount Angel
5-person families (176 | 23.3%) account for the highest median family income in Mount Angel with $172,627 per family, while 5-person families (176 | 23.3%) have the highest median income of $34,525 per family member.
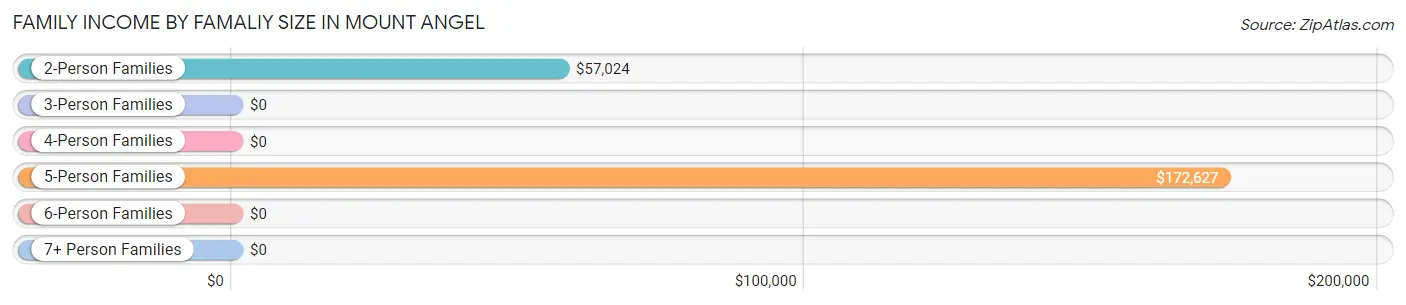
| Income Bracket | # Families | Median Income |
| 2-Person Families | 396 (52.5%) | $57,024 |
| 3-Person Families | 60 (8.0%) | $0 |
| 4-Person Families | 39 (5.2%) | $0 |
| 5-Person Families | 176 (23.3%) | $172,627 |
| 6-Person Families | 30 (4.0%) | $0 |
| 7+ Person Families | 53 (7.0%) | $0 |
| Total | 754 (100.0%) | $77,250 |
Family Income by Number of Earners in Mount Angel
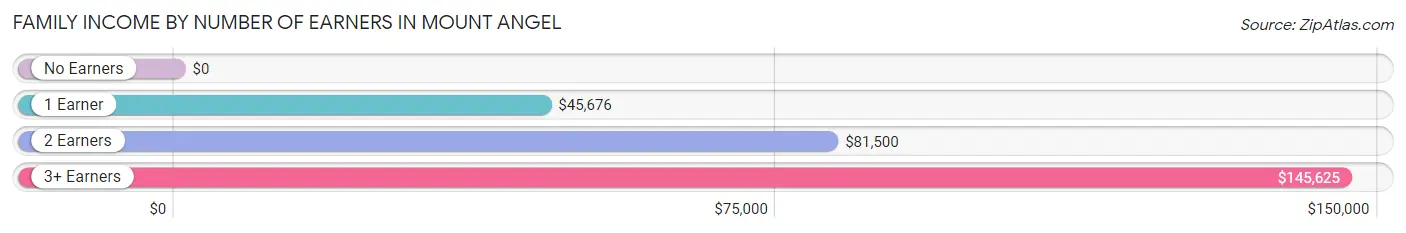
| Number of Earners | # Families | Median Income |
| No Earners | 88 (11.7%) | $0 |
| 1 Earner | 208 (27.6%) | $45,676 |
| 2 Earners | 404 (53.6%) | $81,500 |
| 3+ Earners | 54 (7.2%) | $145,625 |
| Total | 754 (100.0%) | $77,250 |
Household Income in Mount Angel
Household Income Brackets in Mount Angel
With 198 households falling in the category, the $50,000 to $74,999 income range is the most frequent in Mount Angel, accounting for 15.5% of all households. In contrast, only 26 households (2.0%) fall into the $200,000+ income bracket, making it the least populous group.
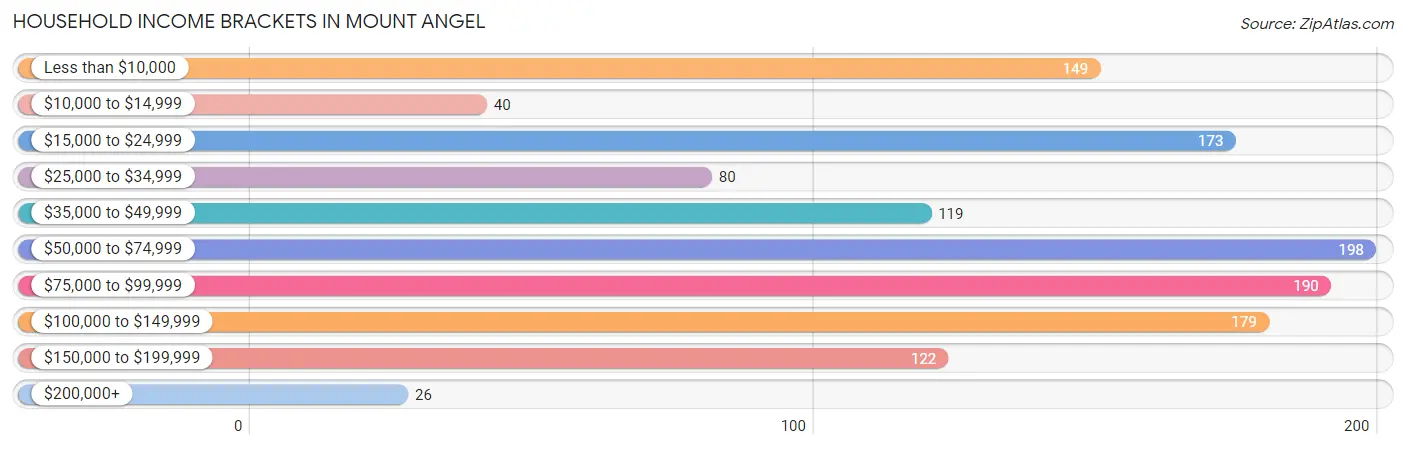
| Income Bracket | # Households | % Households |
| Less than $10,000 | 149 | 11.7% |
| $10,000 to $14,999 | 40 | 3.1% |
| $15,000 to $24,999 | 173 | 13.6% |
| $25,000 to $34,999 | 80 | 6.3% |
| $35,000 to $49,999 | 119 | 9.3% |
| $50,000 to $74,999 | 198 | 15.5% |
| $75,000 to $99,999 | 190 | 14.9% |
| $100,000 to $149,999 | 179 | 14.0% |
| $150,000 to $199,999 | 122 | 9.6% |
| $200,000+ | 26 | 2.0% |
Household Income by Householder Age in Mount Angel
The median household income in Mount Angel is $54,583, with the highest median household income of $78,378 found in the 45 to 64 years age bracket for the primary householder. A total of 443 households (34.7%) fall into this category. Meanwhile, the 15 to 24 years age bracket for the primary householder has the lowest median household income of $0, with 34 households (2.7%) in this group.
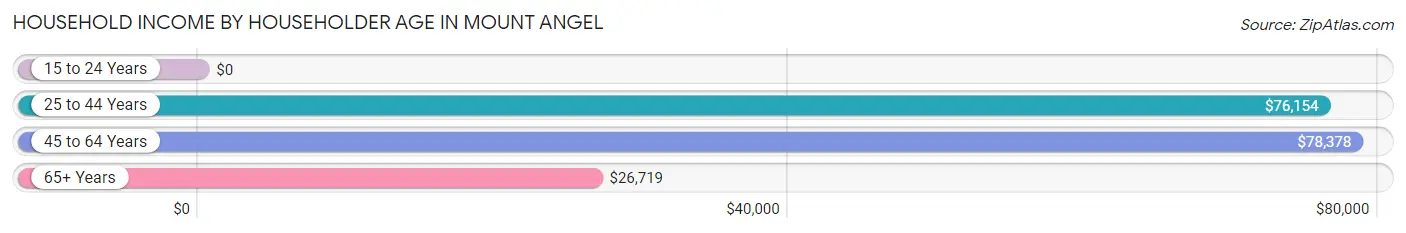
| Income Bracket | # Households | Median Income |
| 15 to 24 Years | 34 (2.7%) | $0 |
| 25 to 44 Years | 344 (27.0%) | $76,154 |
| 45 to 64 Years | 443 (34.7%) | $78,378 |
| 65+ Years | 454 (35.6%) | $26,719 |
| Total | 1,275 (100.0%) | $54,583 |
Poverty in Mount Angel
Income Below Poverty by Sex and Age in Mount Angel
With 11.2% poverty level for males and 16.3% for females among the residents of Mount Angel, 15 year old males and 75 year old and over females are the most vulnerable to poverty, with 24 males (100.0%) and 128 females (44.6%) in their respective age groups living below the poverty level.
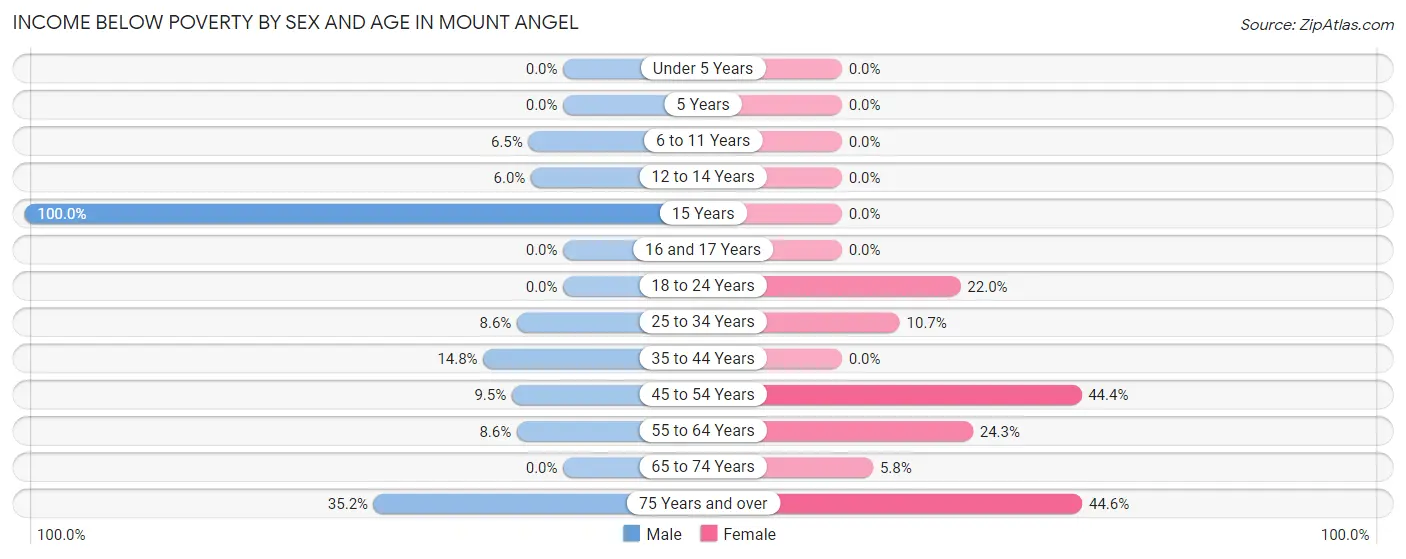
| Age Bracket | Male | Female |
| Under 5 Years | 0 (0.0%) | 0 (0.0%) |
| 5 Years | 0 (0.0%) | 0 (0.0%) |
| 6 to 11 Years | 10 (6.5%) | 0 (0.0%) |
| 12 to 14 Years | 8 (6.0%) | 0 (0.0%) |
| 15 Years | 24 (100.0%) | 0 (0.0%) |
| 16 and 17 Years | 0 (0.0%) | 0 (0.0%) |
| 18 to 24 Years | 0 (0.0%) | 24 (22.0%) |
| 25 to 34 Years | 12 (8.6%) | 19 (10.7%) |
| 35 to 44 Years | 47 (14.8%) | 0 (0.0%) |
| 45 to 54 Years | 12 (9.5%) | 64 (44.4%) |
| 55 to 64 Years | 11 (8.6%) | 63 (24.3%) |
| 65 to 74 Years | 0 (0.0%) | 7 (5.8%) |
| 75 Years and over | 32 (35.2%) | 128 (44.6%) |
| Total | 156 (11.2%) | 305 (16.3%) |
Income Above Poverty by Sex and Age in Mount Angel
According to the poverty statistics in Mount Angel, males aged under 5 years and females aged under 5 years are the age groups that are most secure financially, with 100.0% of males and 100.0% of females in these age groups living above the poverty line.
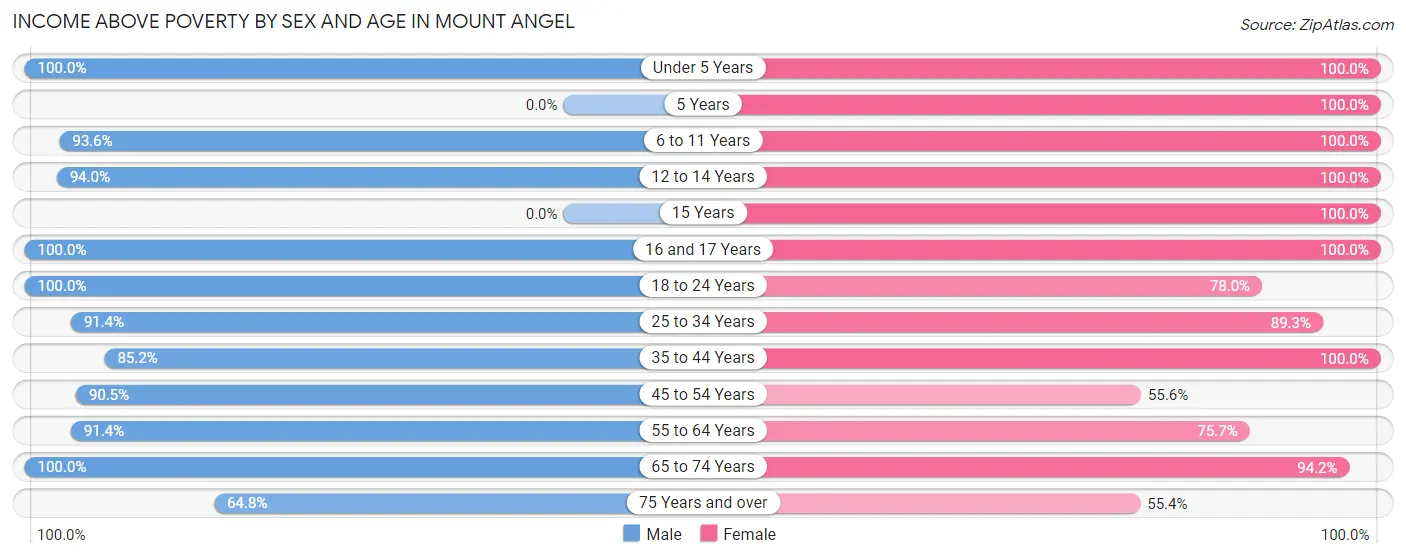
| Age Bracket | Male | Female |
| Under 5 Years | 47 (100.0%) | 116 (100.0%) |
| 5 Years | 0 (0.0%) | 6 (100.0%) |
| 6 to 11 Years | 145 (93.5%) | 171 (100.0%) |
| 12 to 14 Years | 126 (94.0%) | 115 (100.0%) |
| 15 Years | 0 (0.0%) | 30 (100.0%) |
| 16 and 17 Years | 75 (100.0%) | 45 (100.0%) |
| 18 to 24 Years | 46 (100.0%) | 85 (78.0%) |
| 25 to 34 Years | 128 (91.4%) | 158 (89.3%) |
| 35 to 44 Years | 270 (85.2%) | 291 (100.0%) |
| 45 to 54 Years | 114 (90.5%) | 80 (55.6%) |
| 55 to 64 Years | 117 (91.4%) | 196 (75.7%) |
| 65 to 74 Years | 108 (100.0%) | 114 (94.2%) |
| 75 Years and over | 59 (64.8%) | 159 (55.4%) |
| Total | 1,235 (88.8%) | 1,566 (83.7%) |
Income Below Poverty Among Married-Couple Families in Mount Angel
The poverty statistics for married-couple families in Mount Angel show that 2.0% or 11 of the total 553 families live below the poverty line. Families with no children have the highest poverty rate of 4.5%, comprising of 11 families. On the other hand, families with 1 or 2 children have the lowest poverty rate of 0.0%, which includes 0 families.
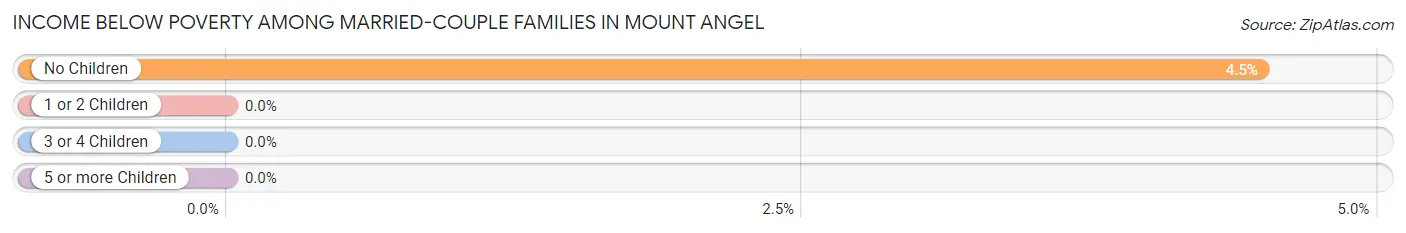
| Children | Above Poverty | Below Poverty |
| No Children | 234 (95.5%) | 11 (4.5%) |
| 1 or 2 Children | 141 (100.0%) | 0 (0.0%) |
| 3 or 4 Children | 114 (100.0%) | 0 (0.0%) |
| 5 or more Children | 53 (100.0%) | 0 (0.0%) |
| Total | 542 (98.0%) | 11 (2.0%) |
Income Below Poverty Among Single-Parent Households in Mount Angel
According to the poverty data in Mount Angel, 55.0% or 11 single-father households and 30.4% or 55 single-mother households are living below the poverty line. Among single-father households, those with 1 or 2 children have the highest poverty rate, with 11 households (55.0%) experiencing poverty. Likewise, among single-mother households, those with 1 or 2 children have the highest poverty rate, with 38 households (40.9%) falling below the poverty line.
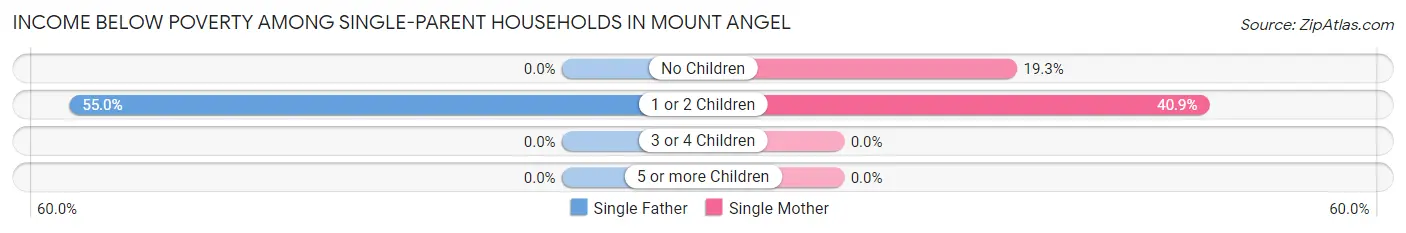
| Children | Single Father | Single Mother |
| No Children | 0 (0.0%) | 17 (19.3%) |
| 1 or 2 Children | 11 (55.0%) | 38 (40.9%) |
| 3 or 4 Children | 0 (0.0%) | 0 (0.0%) |
| 5 or more Children | 0 (0.0%) | 0 (0.0%) |
| Total | 11 (55.0%) | 55 (30.4%) |
Income Below Poverty Among Married-Couple vs Single-Parent Households in Mount Angel
The poverty data for Mount Angel shows that 11 of the married-couple family households (2.0%) and 66 of the single-parent households (32.8%) are living below the poverty level. Within the married-couple family households, those with no children have the highest poverty rate, with 11 households (4.5%) falling below the poverty line. Among the single-parent households, those with 1 or 2 children have the highest poverty rate, with 49 household (43.4%) living below poverty.
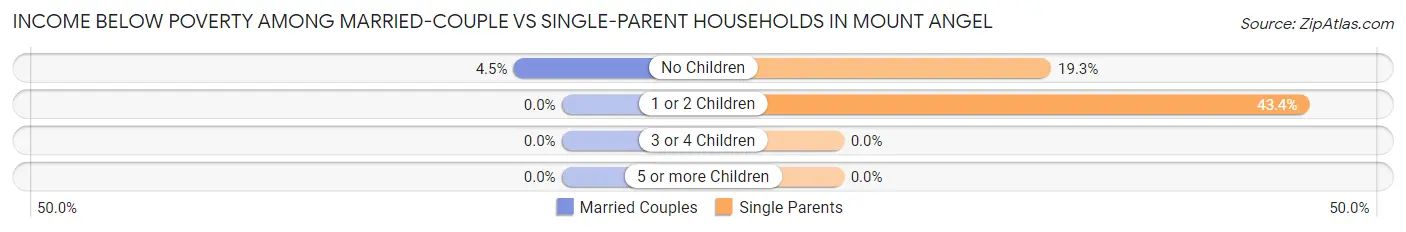
| Children | Married-Couple Families | Single-Parent Households |
| No Children | 11 (4.5%) | 17 (19.3%) |
| 1 or 2 Children | 0 (0.0%) | 49 (43.4%) |
| 3 or 4 Children | 0 (0.0%) | 0 (0.0%) |
| 5 or more Children | 0 (0.0%) | 0 (0.0%) |
| Total | 11 (2.0%) | 66 (32.8%) |
Race in Mount Angel
The most populous races in Mount Angel are White / Caucasian (2,310 | 67.7%), Hispanic or Latino (1,361 | 39.9%), and Two or more Races (622 | 18.2%).
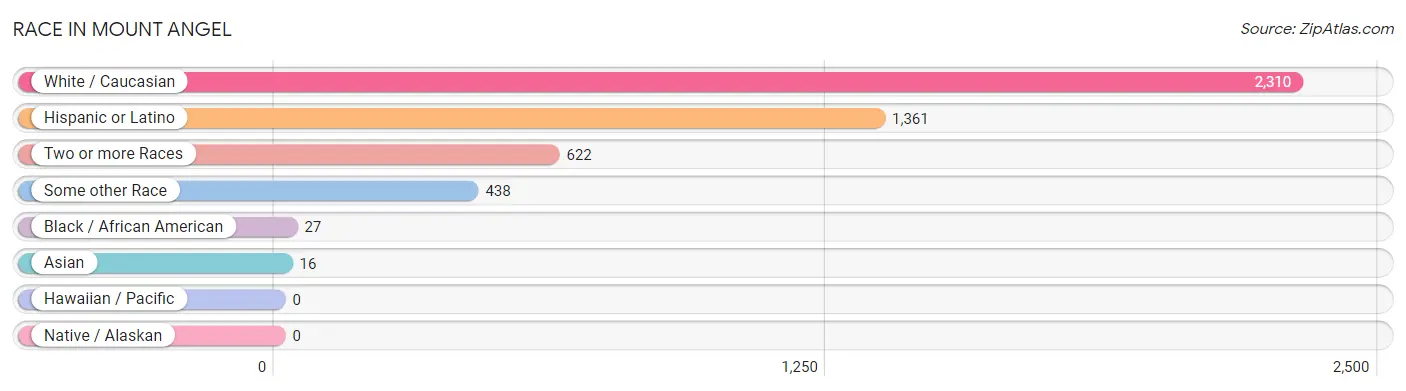
| Race | # Population | % Population |
| Asian | 16 | 0.5% |
| Black / African American | 27 | 0.8% |
| Hawaiian / Pacific | 0 | 0.0% |
| Hispanic or Latino | 1,361 | 39.9% |
| Native / Alaskan | 0 | 0.0% |
| White / Caucasian | 2,310 | 67.7% |
| Two or more Races | 622 | 18.2% |
| Some other Race | 438 | 12.8% |
| Total | 3,413 | 100.0% |
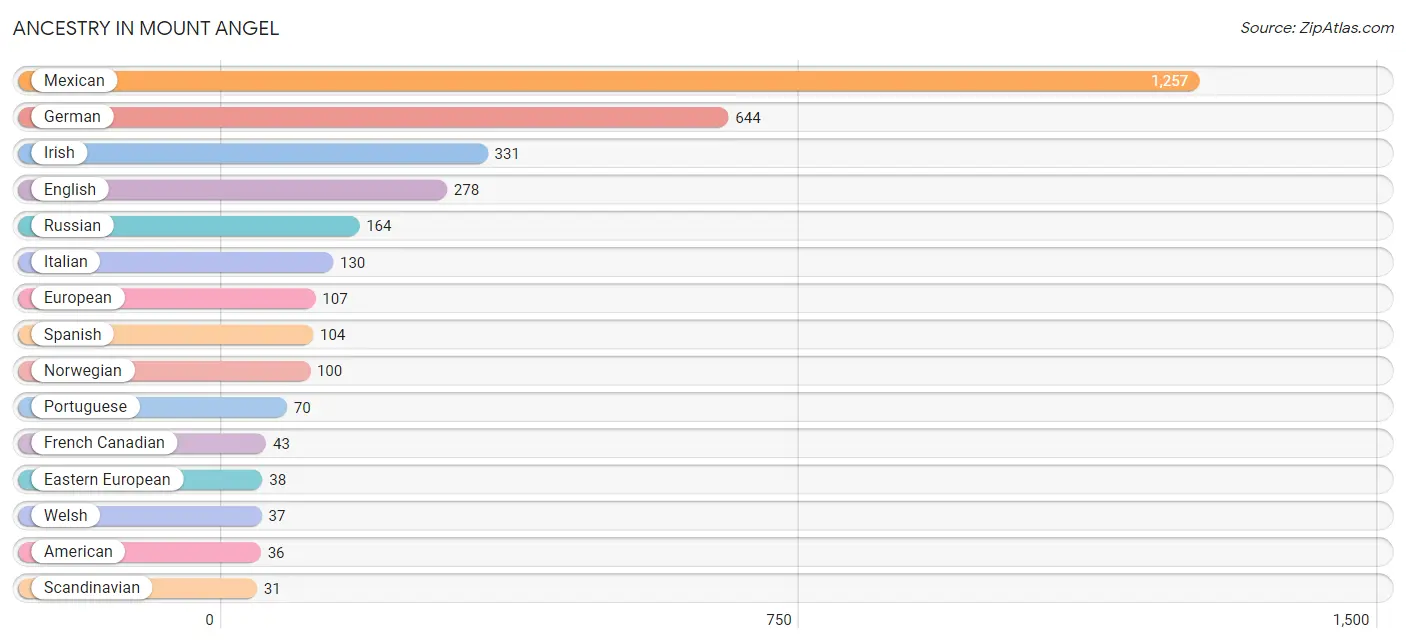
Ancestry in Mount Angel
The most populous ancestries reported in Mount Angel are Mexican (1,257 | 36.8%), German (644 | 18.9%), Irish (331 | 9.7%), English (278 | 8.2%), and Russian (164 | 4.8%), together accounting for 78.4% of all Mount Angel residents.
| Ancestry | # Population | % Population |
| African | 24 | 0.7% |
| American | 36 | 1.1% |
| Austrian | 6 | 0.2% |
| Bhutanese | 16 | 0.5% |
| Cherokee | 9 | 0.3% |
| Czech | 3 | 0.1% |
| Danish | 9 | 0.3% |
| Dutch | 6 | 0.2% |
| Eastern European | 38 | 1.1% |
| English | 278 | 8.2% |
| European | 107 | 3.1% |
| French | 12 | 0.4% |
| French Canadian | 43 | 1.3% |
| German | 644 | 18.9% |
| Hungarian | 3 | 0.1% |
| Iranian | 8 | 0.2% |
| Irish | 331 | 9.7% |
| Italian | 130 | 3.8% |
| Latvian | 10 | 0.3% |
| Mexican | 1,257 | 36.8% |
| Northern European | 6 | 0.2% |
| Norwegian | 100 | 2.9% |
| Polish | 21 | 0.6% |
| Portuguese | 70 | 2.1% |
| Russian | 164 | 4.8% |
| Scandinavian | 31 | 0.9% |
| Scottish | 26 | 0.8% |
| Slovak | 3 | 0.1% |
| Spanish | 104 | 3.0% |
| Subsaharan African | 24 | 0.7% |
| Swedish | 12 | 0.4% |
| Swiss | 2 | 0.1% |
| Ukrainian | 3 | 0.1% |
| Welsh | 37 | 1.1% | View All 34 Rows |
Immigrants in Mount Angel
The most numerous immigrant groups reported in Mount Angel came from Central America (395 | 11.6%), Latin America (395 | 11.6%), Mexico (395 | 11.6%), Europe (27 | 0.8%), and Western Europe (27 | 0.8%), together accounting for 36.3% of all Mount Angel residents.
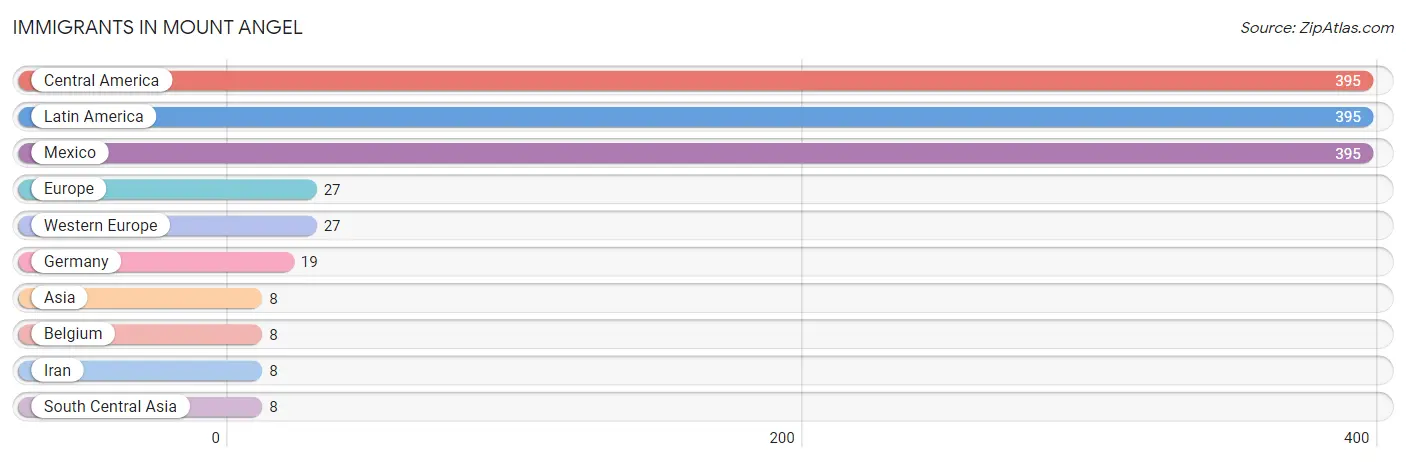
| Immigration Origin | # Population | % Population |
| Asia | 8 | 0.2% |
| Belgium | 8 | 0.2% |
| Central America | 395 | 11.6% |
| Europe | 27 | 0.8% |
| Germany | 19 | 0.6% |
| Iran | 8 | 0.2% |
| Latin America | 395 | 11.6% |
| Mexico | 395 | 11.6% |
| South Central Asia | 8 | 0.2% |
| Western Europe | 27 | 0.8% | View All 10 Rows |
Sex and Age in Mount Angel
Sex and Age in Mount Angel
The most populous age groups in Mount Angel are 35 to 39 Years (227 | 16.0%) for men and 60 to 64 Years (210 | 10.5%) for women.
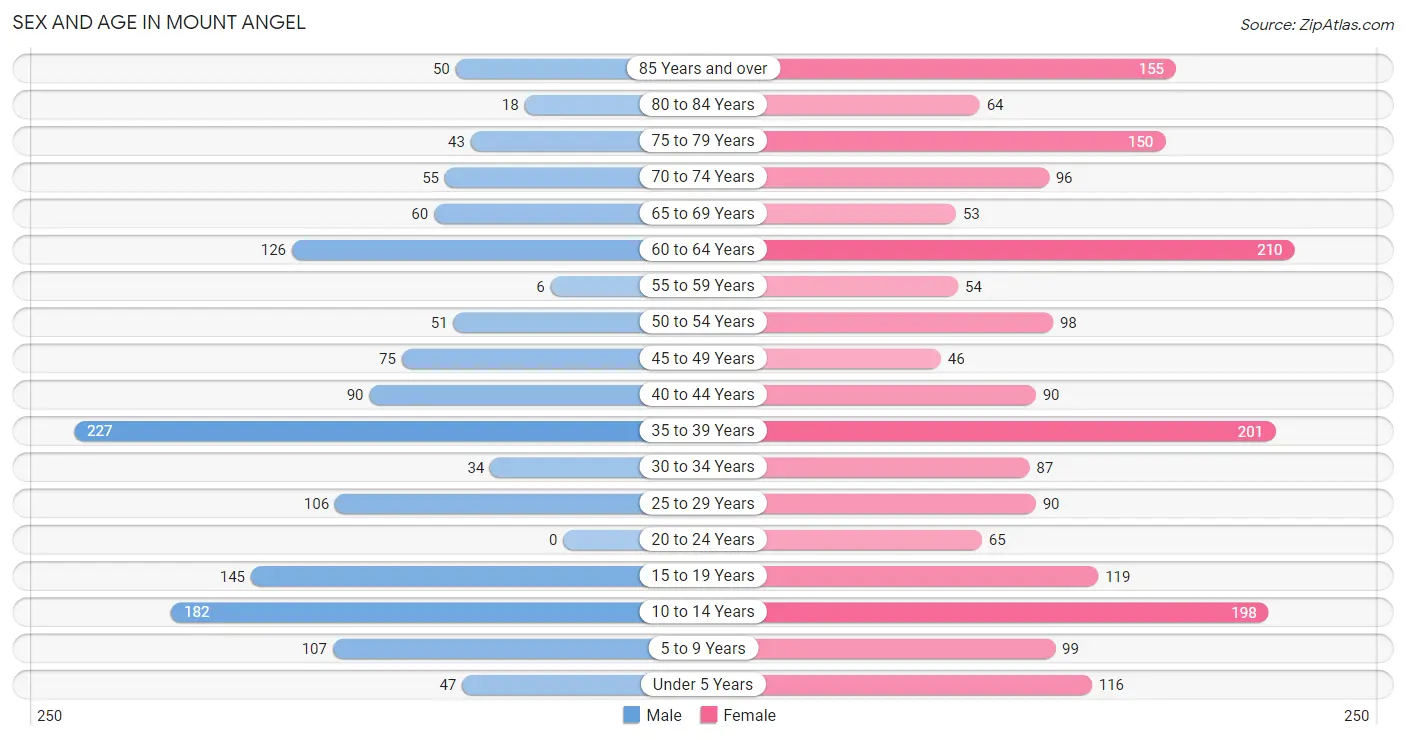
| Age Bracket | Male | Female |
| Under 5 Years | 47 (3.3%) | 116 (5.8%) |
| 5 to 9 Years | 107 (7.5%) | 99 (5.0%) |
| 10 to 14 Years | 182 (12.8%) | 198 (9.9%) |
| 15 to 19 Years | 145 (10.2%) | 119 (6.0%) |
| 20 to 24 Years | 0 (0.0%) | 65 (3.3%) |
| 25 to 29 Years | 106 (7.4%) | 90 (4.5%) |
| 30 to 34 Years | 34 (2.4%) | 87 (4.4%) |
| 35 to 39 Years | 227 (16.0%) | 201 (10.1%) |
| 40 to 44 Years | 90 (6.3%) | 90 (4.5%) |
| 45 to 49 Years | 75 (5.3%) | 46 (2.3%) |
| 50 to 54 Years | 51 (3.6%) | 98 (4.9%) |
| 55 to 59 Years | 6 (0.4%) | 54 (2.7%) |
| 60 to 64 Years | 126 (8.9%) | 210 (10.5%) |
| 65 to 69 Years | 60 (4.2%) | 53 (2.7%) |
| 70 to 74 Years | 55 (3.9%) | 96 (4.8%) |
| 75 to 79 Years | 43 (3.0%) | 150 (7.5%) |
| 80 to 84 Years | 18 (1.3%) | 64 (3.2%) |
| 85 Years and over | 50 (3.5%) | 155 (7.8%) |
| Total | 1,422 (100.0%) | 1,991 (100.0%) |
Families and Households in Mount Angel
Median Family Size in Mount Angel
The median family size in Mount Angel is 3.42 persons per family, with married-couple families (553 | 73.3%) accounting for the largest median family size of 3.89 persons per family. On the other hand, single female/mother families (181 | 24.0%) represent the smallest median family size with 2.12 persons per family.
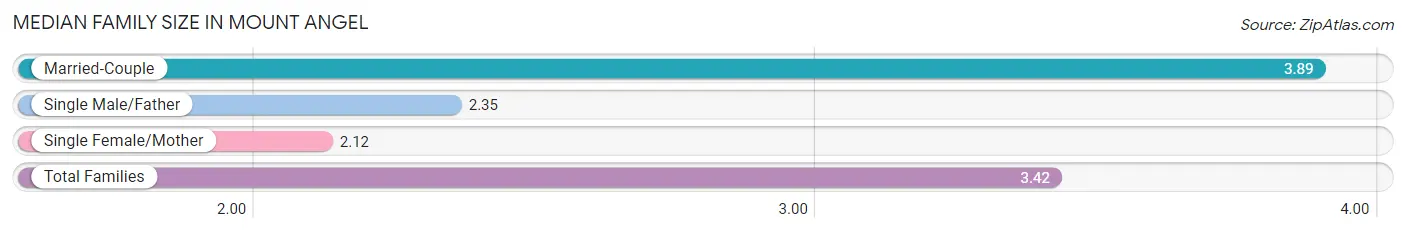
| Family Type | # Families | Family Size |
| Married-Couple | 553 (73.3%) | 3.89 |
| Single Male/Father | 20 (2.6%) | 2.35 |
| Single Female/Mother | 181 (24.0%) | 2.12 |
| Total Families | 754 (100.0%) | 3.42 |
Median Household Size in Mount Angel
The median household size in Mount Angel is 2.50 persons per household, with married-couple households (553 | 43.4%) accounting for the largest median household size of 3.91 persons per household. non-family households (521 | 40.9%) represent the smallest median household size with 1.06 persons per household.
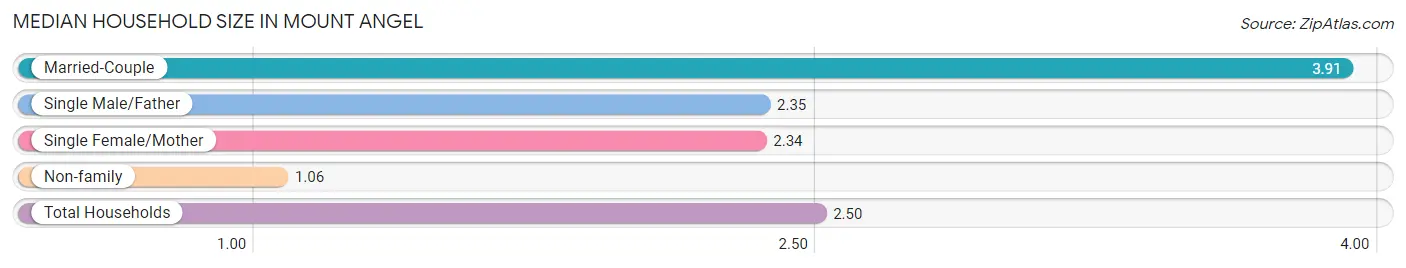
| Household Type | # Households | Household Size |
| Married-Couple | 553 (43.4%) | 3.91 |
| Single Male/Father | 20 (1.6%) | 2.35 |
| Single Female/Mother | 181 (14.2%) | 2.34 |
| Non-family | 521 (40.9%) | 1.06 |
| Total Households | 1,275 (100.0%) | 2.50 |
Household Size by Marriage Status in Mount Angel
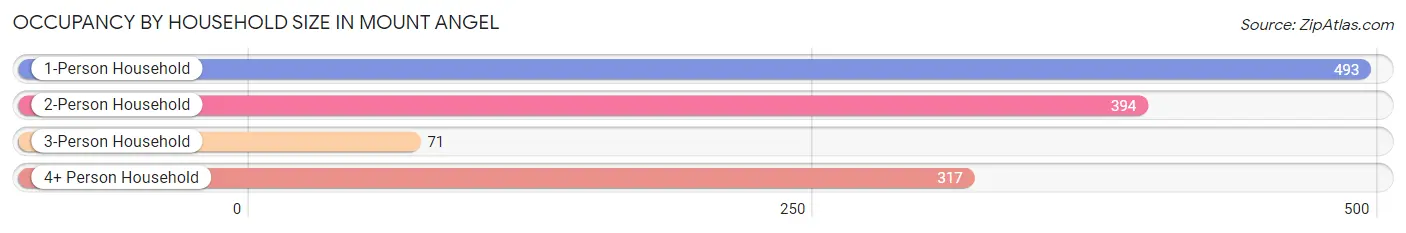
Out of a total of 1,275 households in Mount Angel, 754 (59.1%) are family households, while 521 (40.9%) are nonfamily households. The most numerous type of family households are 2-person households, comprising 366, and the most common type of nonfamily households are 1-person households, comprising 493.
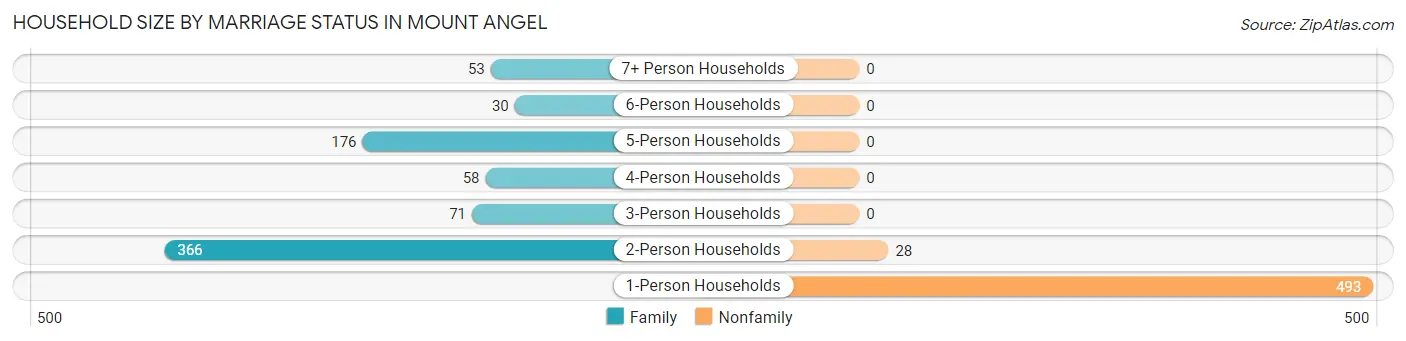
| Household Size | Family Households | Nonfamily Households |
| 1-Person Households | - | 493 (38.7%) |
| 2-Person Households | 366 (28.7%) | 28 (2.2%) |
| 3-Person Households | 71 (5.6%) | 0 (0.0%) |
| 4-Person Households | 58 (4.5%) | 0 (0.0%) |
| 5-Person Households | 176 (13.8%) | 0 (0.0%) |
| 6-Person Households | 30 (2.4%) | 0 (0.0%) |
| 7+ Person Households | 53 (4.2%) | 0 (0.0%) |
| Total | 754 (59.1%) | 521 (40.9%) |
Female Fertility in Mount Angel
Fertility by Age in Mount Angel
Average fertility rate in Mount Angel is 49.0 births per 1,000 women. Women in the age bracket of 20 to 34 years have the highest fertility rate with 149.0 births per 1,000 women. Women in the age bracket of 20 to 34 years acount for 100.0% of all women with births.
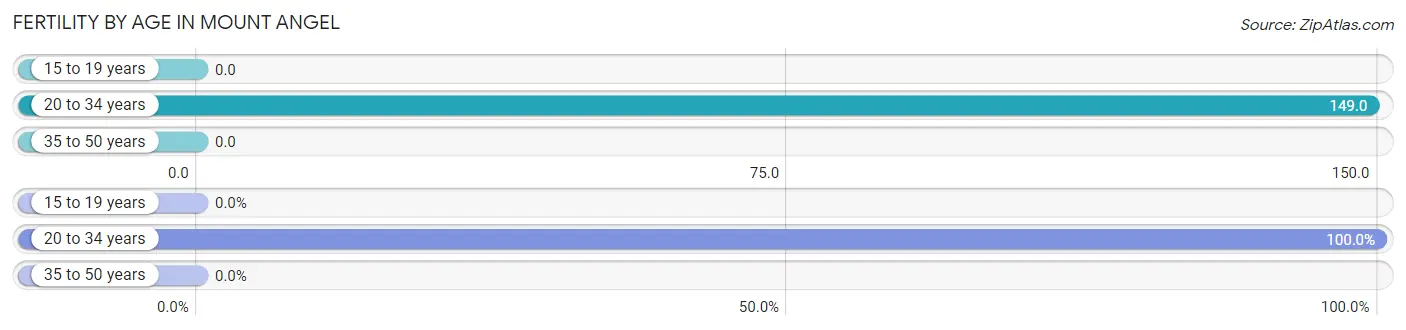
| Age Bracket | Women with Births | Births / 1,000 Women |
| 15 to 19 years | 0 (0.0%) | 0.0 |
| 20 to 34 years | 36 (100.0%) | 149.0 |
| 35 to 50 years | 0 (0.0%) | 0.0 |
| Total | 36 (100.0%) | 49.0 |
Fertility by Age by Marriage Status in Mount Angel
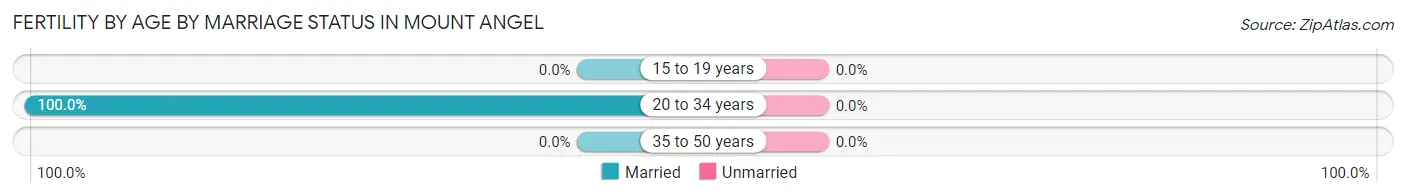
| Age Bracket | Married | Unmarried |
| 15 to 19 years | 0 (0.0%) | 0 (0.0%) |
| 20 to 34 years | 36 (100.0%) | 0 (0.0%) |
| 35 to 50 years | 0 (0.0%) | 0 (0.0%) |
| Total | 36 (100.0%) | 0 (0.0%) |
Fertility by Education in Mount Angel
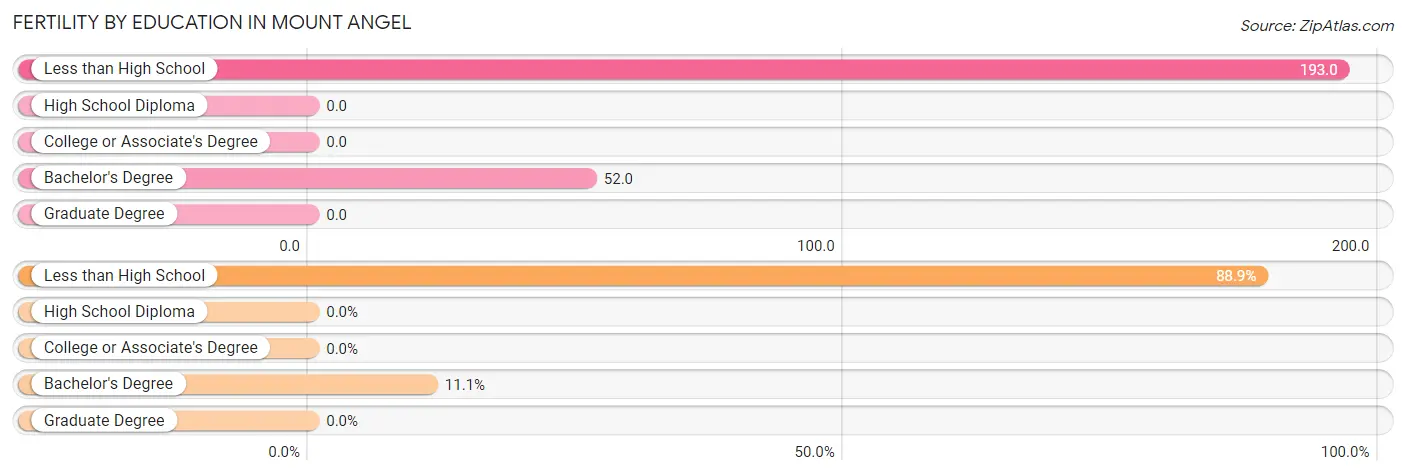
| Educational Attainment | Women with Births | Births / 1,000 Women |
| Less than High School | 32 (88.9%) | 193.0 |
| High School Diploma | 0 (0.0%) | 0.0 |
| College or Associate's Degree | 0 (0.0%) | 0.0 |
| Bachelor's Degree | 4 (11.1%) | 52.0 |
| Graduate Degree | 0 (0.0%) | 0.0 |
| Total | 36 (100.0%) | 49.0 |
Fertility by Education by Marriage Status in Mount Angel
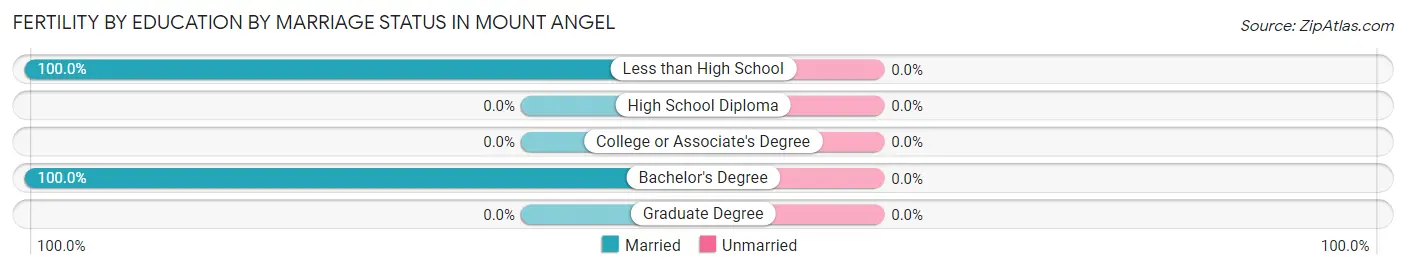
| Educational Attainment | Married | Unmarried |
| Less than High School | 32 (100.0%) | 0 (0.0%) |
| High School Diploma | 0 (0.0%) | 0 (0.0%) |
| College or Associate's Degree | 0 (0.0%) | 0 (0.0%) |
| Bachelor's Degree | 4 (100.0%) | 0 (0.0%) |
| Graduate Degree | 0 (0.0%) | 0 (0.0%) |
| Total | 36 (100.0%) | 0 (0.0%) |
Employment Characteristics in Mount Angel
Employment by Class of Employer in Mount Angel
Among the 1,208 employed individuals in Mount Angel, private company employees (669 | 55.4%), local government employees (221 | 18.3%), and not-for-profit organizations (107 | 8.9%) make up the most common classes of employment.
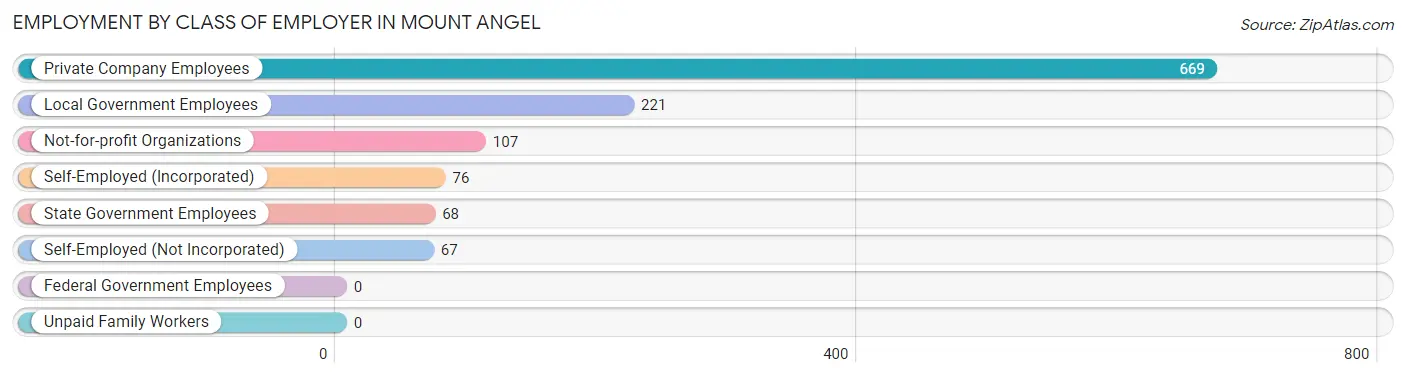
| Employer Class | # Employees | % Employees |
| Private Company Employees | 669 | 55.4% |
| Self-Employed (Incorporated) | 76 | 6.3% |
| Self-Employed (Not Incorporated) | 67 | 5.6% |
| Not-for-profit Organizations | 107 | 8.9% |
| Local Government Employees | 221 | 18.3% |
| State Government Employees | 68 | 5.6% |
| Federal Government Employees | 0 | 0.0% |
| Unpaid Family Workers | 0 | 0.0% |
| Total | 1,208 | 100.0% |
Employment Status by Age in Mount Angel
According to the labor force statistics for Mount Angel, out of the total population over 16 years of age (2,610), 54.3% or 1,417 individuals are in the labor force, with 11.2% or 159 of them unemployed. The age group with the highest labor force participation rate is 20 to 24 years, with 100.0% or 65 individuals in the labor force. Within the labor force, the 25 to 29 years age range has the highest percentage of unemployed individuals, with 36.0% or 49 of them being unemployed.
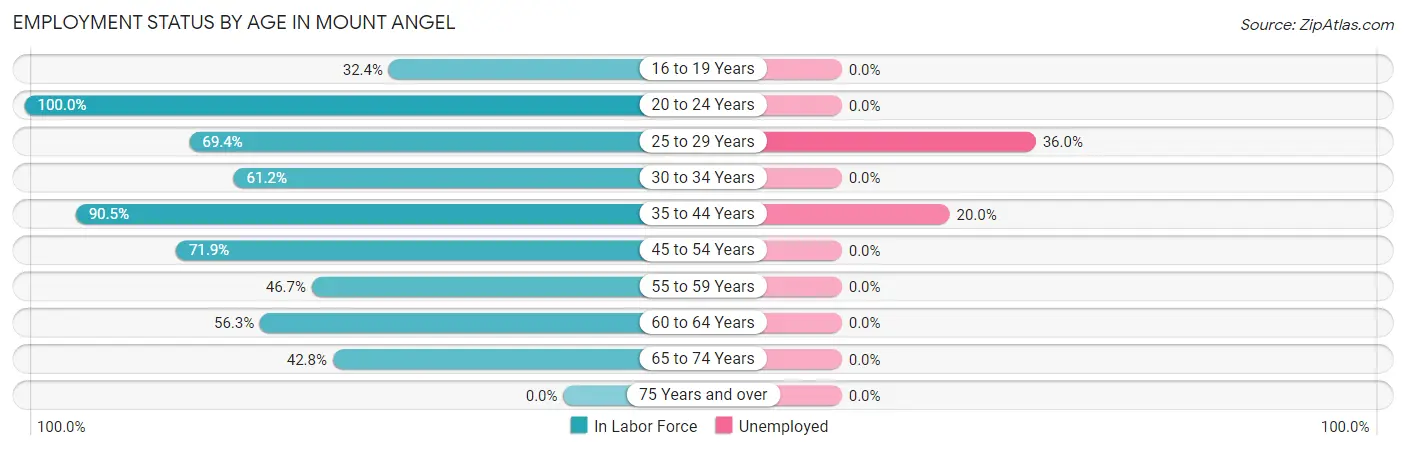
| Age Bracket | In Labor Force | Unemployed |
| 16 to 19 Years | 68 (32.4%) | 0 (0.0%) |
| 20 to 24 Years | 65 (100.0%) | 0 (0.0%) |
| 25 to 29 Years | 136 (69.4%) | 49 (36.0%) |
| 30 to 34 Years | 74 (61.2%) | 0 (0.0%) |
| 35 to 44 Years | 550 (90.5%) | 110 (20.0%) |
| 45 to 54 Years | 194 (71.9%) | 0 (0.0%) |
| 55 to 59 Years | 28 (46.7%) | 0 (0.0%) |
| 60 to 64 Years | 189 (56.3%) | 0 (0.0%) |
| 65 to 74 Years | 113 (42.8%) | 0 (0.0%) |
| 75 Years and over | 0 (0.0%) | 0 (0.0%) |
| Total | 1,417 (54.3%) | 159 (11.2%) |
Employment Status by Educational Attainment in Mount Angel
According to labor force statistics for Mount Angel, 73.6% of individuals (1,171) out of the total population between 25 and 64 years of age (1,591) are in the labor force, with 13.6% or 159 of them being unemployed. The group with the highest labor force participation rate are those with the educational attainment of college / associate degree, with 80.4% or 393 individuals in the labor force. Within the labor force, individuals with high school diploma education have the highest percentage of unemployment, with 24.9% or 83 of them being unemployed.
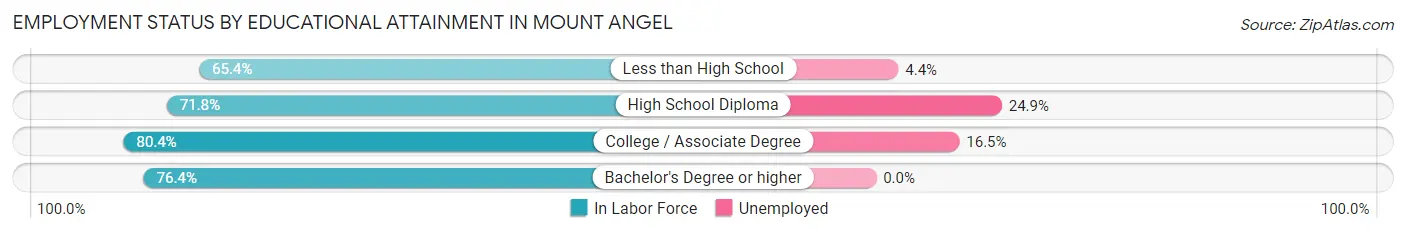
| Educational Attainment | In Labor Force | Unemployed |
| Less than High School | 251 (65.4%) | 17 (4.4%) |
| High School Diploma | 333 (71.8%) | 116 (24.9%) |
| College / Associate Degree | 393 (80.4%) | 81 (16.5%) |
| Bachelor's Degree or higher | 194 (76.4%) | 0 (0.0%) |
| Total | 1,171 (73.6%) | 216 (13.6%) |
Employment Occupations by Sex in Mount Angel
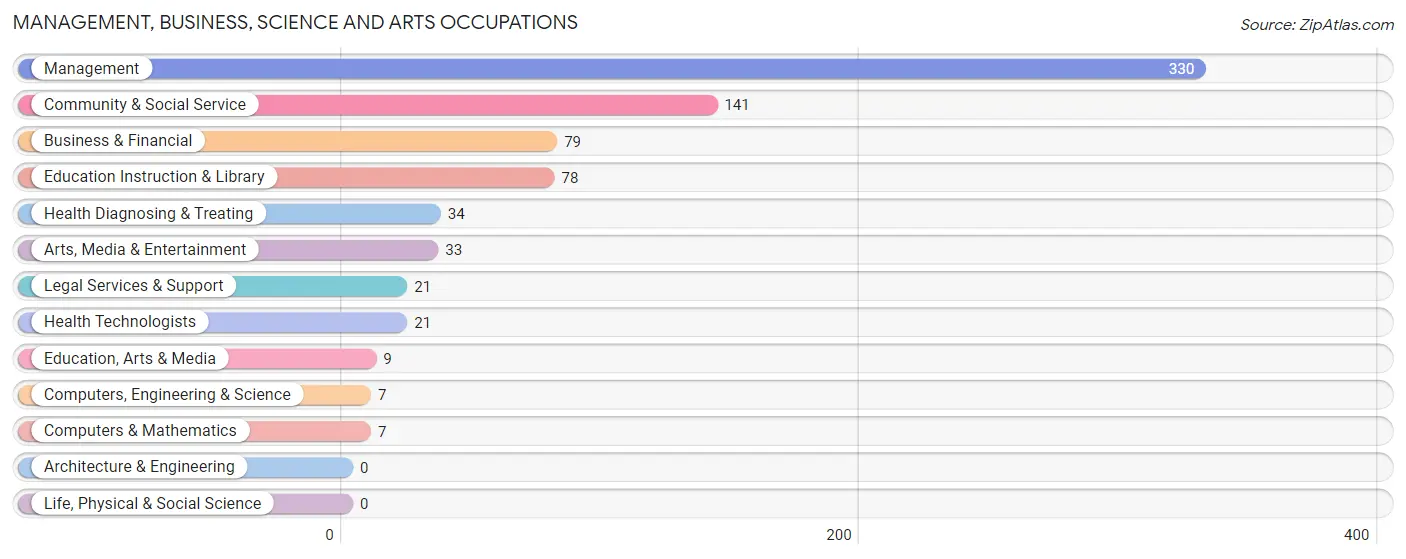
Management, Business, Science and Arts Occupations
The most common Management, Business, Science and Arts occupations in Mount Angel are Management (330 | 26.2%), Community & Social Service (141 | 11.2%), Business & Financial (79 | 6.3%), Education Instruction & Library (78 | 6.2%), and Health Diagnosing & Treating (34 | 2.7%).
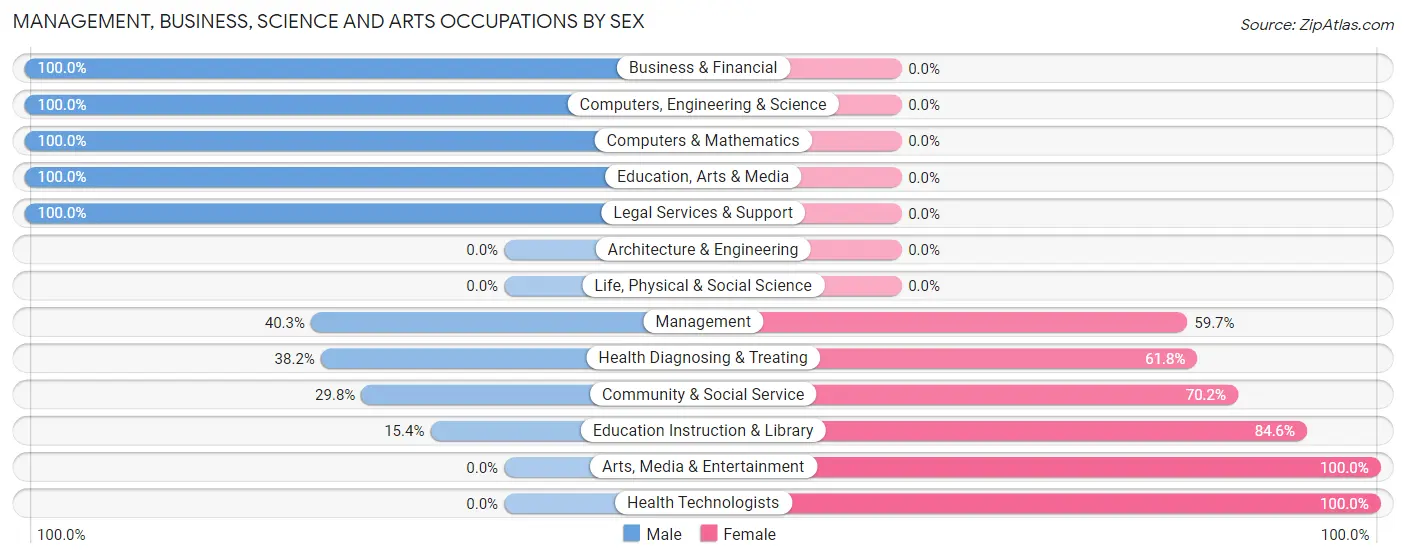
Management, Business, Science and Arts Occupations by Sex
Within the Management, Business, Science and Arts occupations in Mount Angel, the most male-oriented occupations are Business & Financial (100.0%), Computers, Engineering & Science (100.0%), and Computers & Mathematics (100.0%), while the most female-oriented occupations are Arts, Media & Entertainment (100.0%), Health Technologists (100.0%), and Education Instruction & Library (84.6%).
| Occupation | Male | Female |
| Management | 133 (40.3%) | 197 (59.7%) |
| Business & Financial | 79 (100.0%) | 0 (0.0%) |
| Computers, Engineering & Science | 7 (100.0%) | 0 (0.0%) |
| Computers & Mathematics | 7 (100.0%) | 0 (0.0%) |
| Architecture & Engineering | 0 (0.0%) | 0 (0.0%) |
| Life, Physical & Social Science | 0 (0.0%) | 0 (0.0%) |
| Community & Social Service | 42 (29.8%) | 99 (70.2%) |
| Education, Arts & Media | 9 (100.0%) | 0 (0.0%) |
| Legal Services & Support | 21 (100.0%) | 0 (0.0%) |
| Education Instruction & Library | 12 (15.4%) | 66 (84.6%) |
| Arts, Media & Entertainment | 0 (0.0%) | 33 (100.0%) |
| Health Diagnosing & Treating | 13 (38.2%) | 21 (61.8%) |
| Health Technologists | 0 (0.0%) | 21 (100.0%) |
| Total (Category) | 274 (46.4%) | 317 (53.6%) |
| Total (Overall) | 592 (47.1%) | 666 (52.9%) |
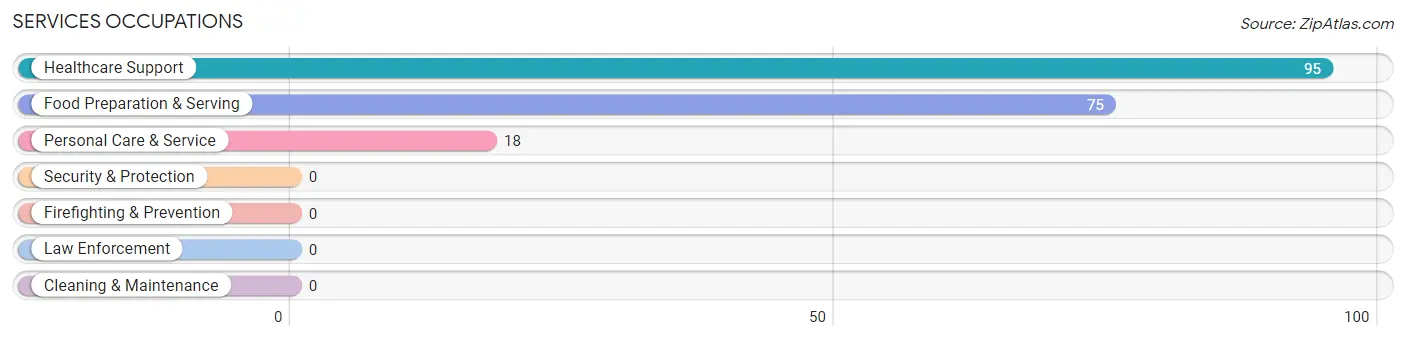
Services Occupations
The most common Services occupations in Mount Angel are Healthcare Support (95 | 7.5%), Food Preparation & Serving (75 | 6.0%), and Personal Care & Service (18 | 1.4%).
Services Occupations by Sex
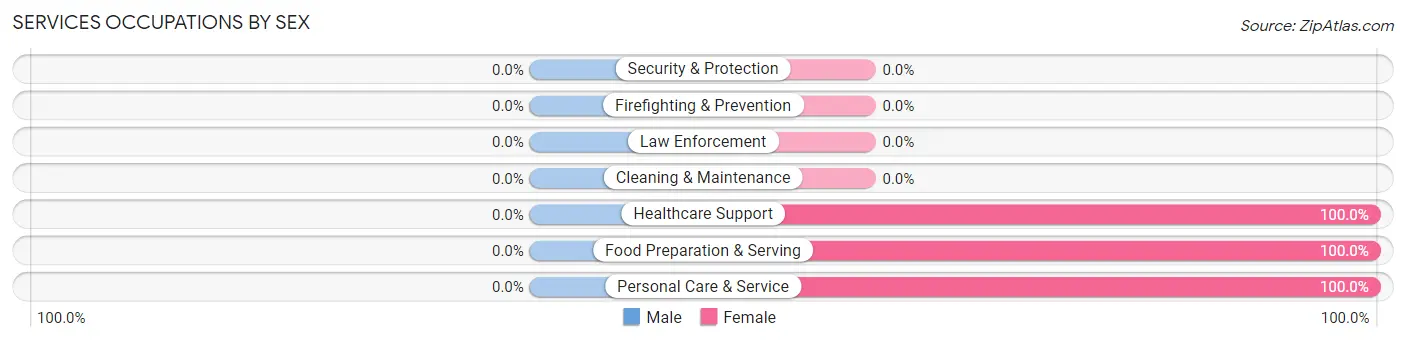
| Occupation | Male | Female |
| Healthcare Support | 0 (0.0%) | 95 (100.0%) |
| Security & Protection | 0 (0.0%) | 0 (0.0%) |
| Firefighting & Prevention | 0 (0.0%) | 0 (0.0%) |
| Law Enforcement | 0 (0.0%) | 0 (0.0%) |
| Food Preparation & Serving | 0 (0.0%) | 75 (100.0%) |
| Cleaning & Maintenance | 0 (0.0%) | 0 (0.0%) |
| Personal Care & Service | 0 (0.0%) | 18 (100.0%) |
| Total (Category) | 0 (0.0%) | 188 (100.0%) |
| Total (Overall) | 592 (47.1%) | 666 (52.9%) |
Sales and Office Occupations
The most common Sales and Office occupations in Mount Angel are Sales & Related (97 | 7.7%), and Office & Administration (79 | 6.3%).
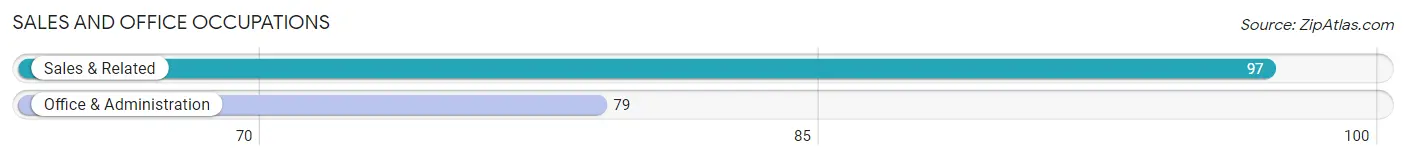
Sales and Office Occupations by Sex
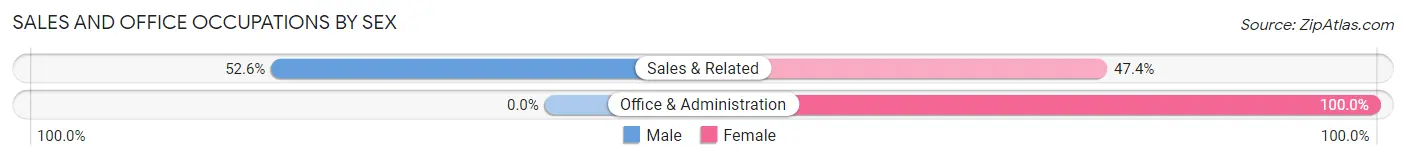
| Occupation | Male | Female |
| Sales & Related | 51 (52.6%) | 46 (47.4%) |
| Office & Administration | 0 (0.0%) | 79 (100.0%) |
| Total (Category) | 51 (29.0%) | 125 (71.0%) |
| Total (Overall) | 592 (47.1%) | 666 (52.9%) |
Natural Resources, Construction and Maintenance Occupations
The most common Natural Resources, Construction and Maintenance occupations in Mount Angel are Farming, Fishing & Forestry (114 | 9.1%), and Construction & Extraction (90 | 7.1%).
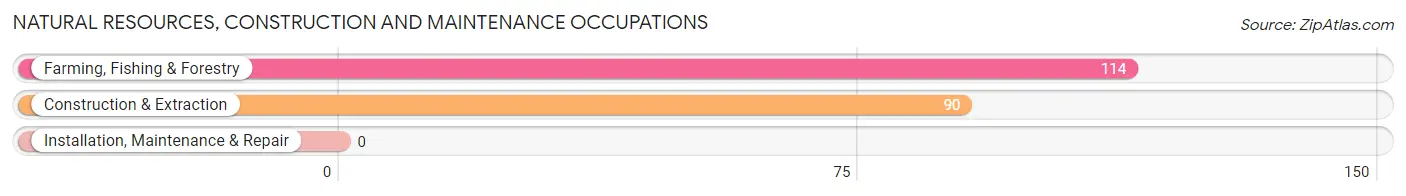
Natural Resources, Construction and Maintenance Occupations by Sex
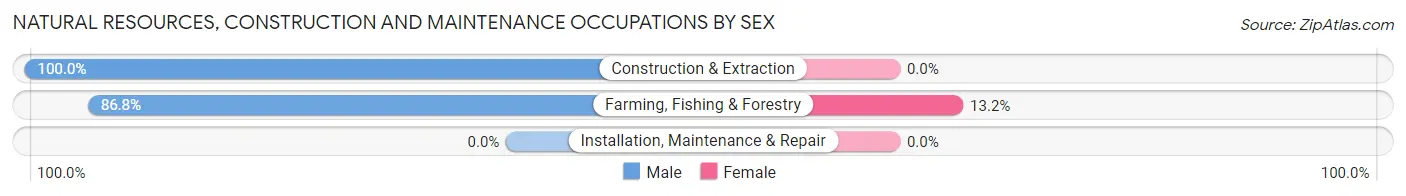
| Occupation | Male | Female |
| Farming, Fishing & Forestry | 99 (86.8%) | 15 (13.2%) |
| Construction & Extraction | 90 (100.0%) | 0 (0.0%) |
| Installation, Maintenance & Repair | 0 (0.0%) | 0 (0.0%) |
| Total (Category) | 189 (92.6%) | 15 (7.3%) |
| Total (Overall) | 592 (47.1%) | 666 (52.9%) |
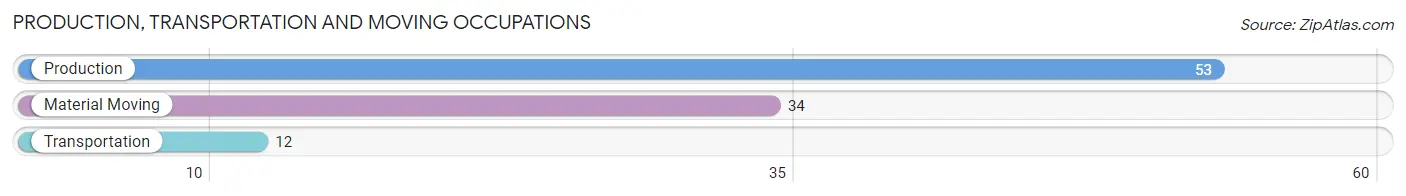
Production, Transportation and Moving Occupations
The most common Production, Transportation and Moving occupations in Mount Angel are Production (53 | 4.2%), Material Moving (34 | 2.7%), and Transportation (12 | 0.9%).
Production, Transportation and Moving Occupations by Sex
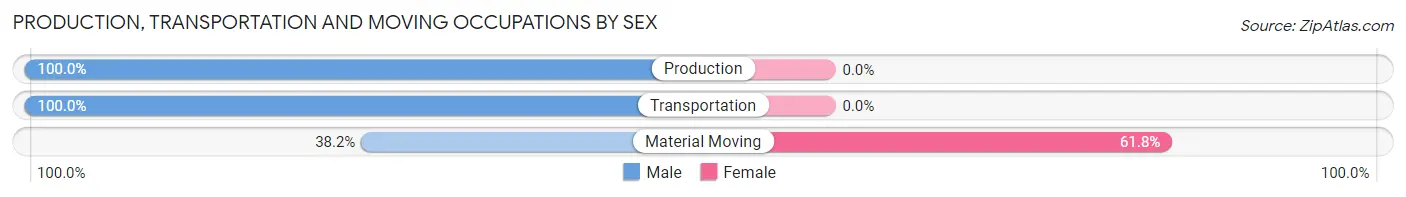
| Occupation | Male | Female |
| Production | 53 (100.0%) | 0 (0.0%) |
| Transportation | 12 (100.0%) | 0 (0.0%) |
| Material Moving | 13 (38.2%) | 21 (61.8%) |
| Total (Category) | 78 (78.8%) | 21 (21.2%) |
| Total (Overall) | 592 (47.1%) | 666 (52.9%) |
Employment Industries by Sex in Mount Angel
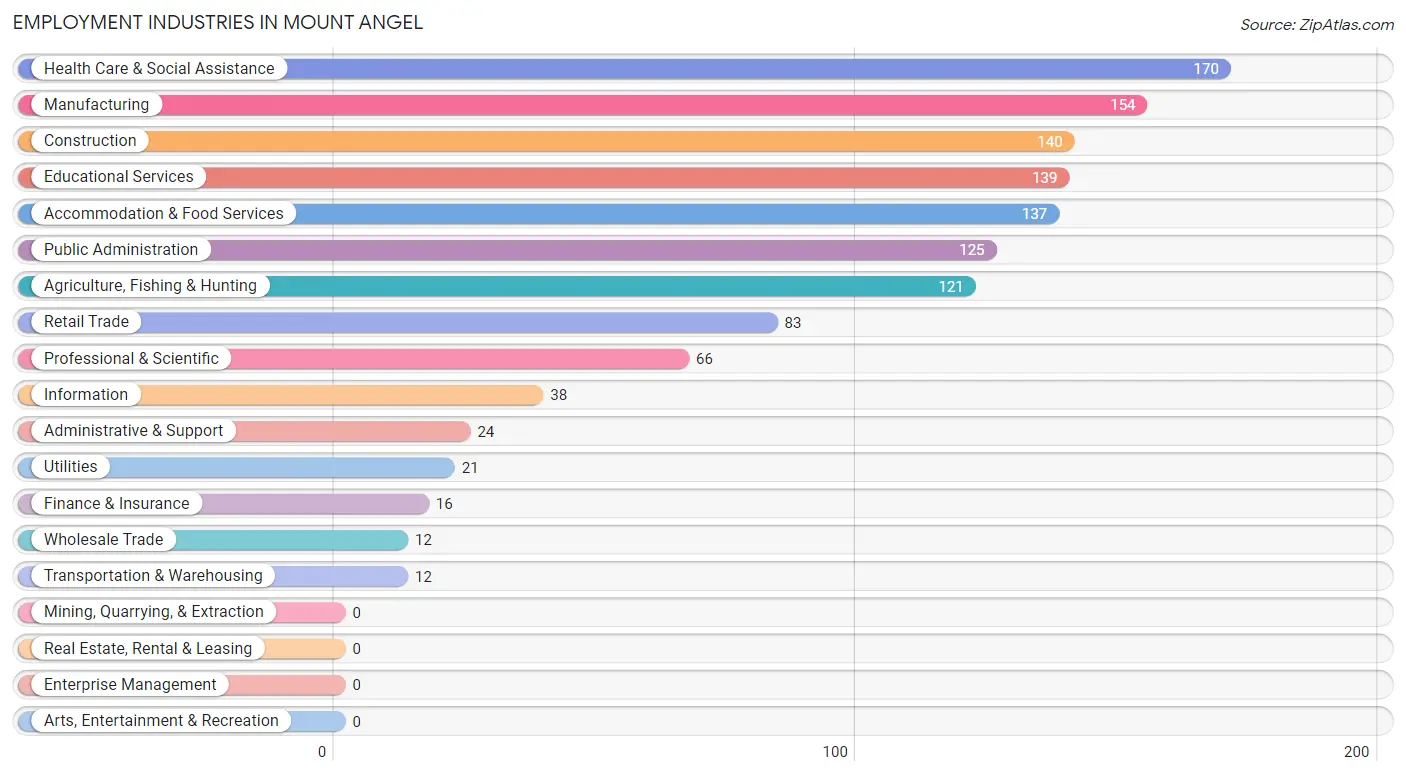
Employment Industries in Mount Angel
The major employment industries in Mount Angel include Health Care & Social Assistance (170 | 13.5%), Manufacturing (154 | 12.2%), Construction (140 | 11.1%), Educational Services (139 | 11.1%), and Accommodation & Food Services (137 | 10.9%).
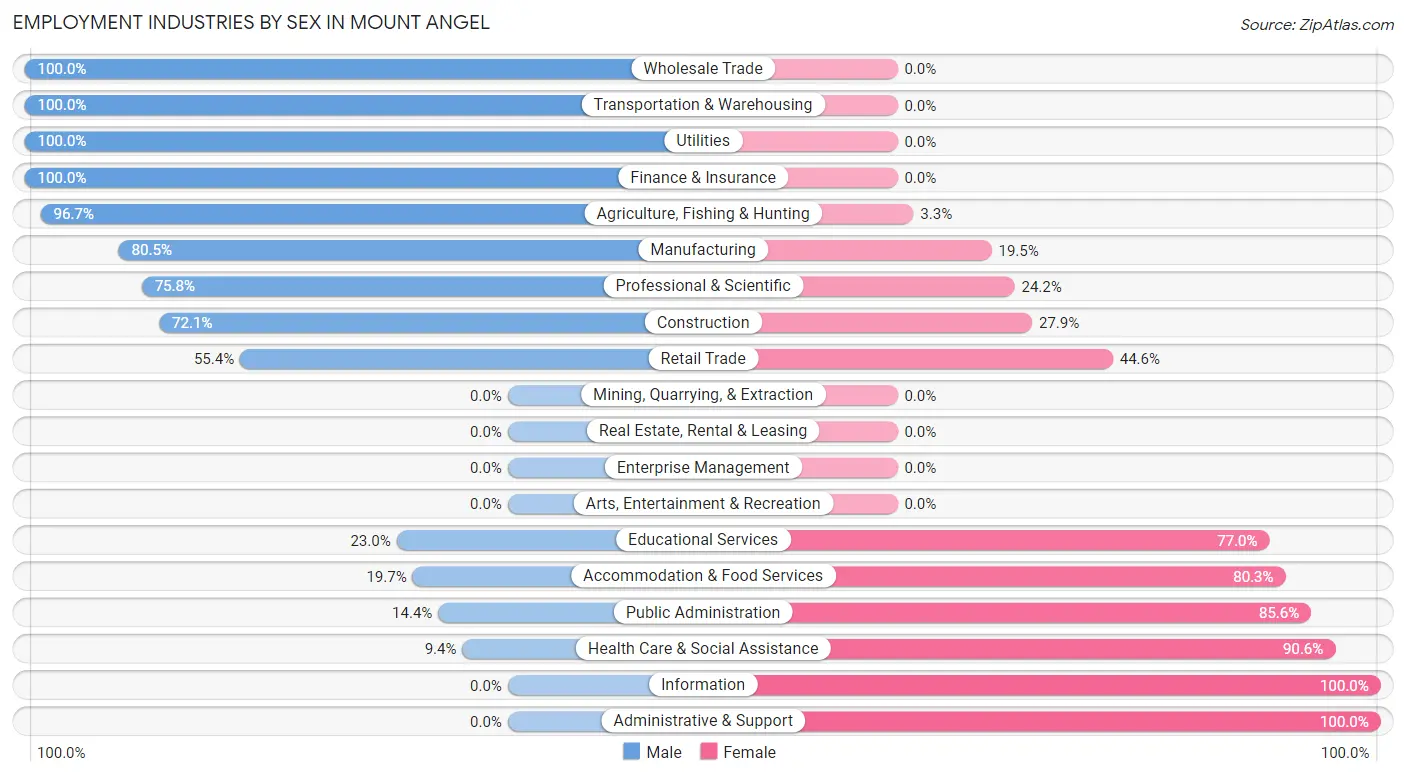
Employment Industries by Sex in Mount Angel
The Mount Angel industries that see more men than women are Wholesale Trade (100.0%), Transportation & Warehousing (100.0%), and Utilities (100.0%), whereas the industries that tend to have a higher number of women are Information (100.0%), Administrative & Support (100.0%), and Health Care & Social Assistance (90.6%).
| Industry | Male | Female |
| Agriculture, Fishing & Hunting | 117 (96.7%) | 4 (3.3%) |
| Mining, Quarrying, & Extraction | 0 (0.0%) | 0 (0.0%) |
| Construction | 101 (72.1%) | 39 (27.9%) |
| Manufacturing | 124 (80.5%) | 30 (19.5%) |
| Wholesale Trade | 12 (100.0%) | 0 (0.0%) |
| Retail Trade | 46 (55.4%) | 37 (44.6%) |
| Transportation & Warehousing | 12 (100.0%) | 0 (0.0%) |
| Utilities | 21 (100.0%) | 0 (0.0%) |
| Information | 0 (0.0%) | 38 (100.0%) |
| Finance & Insurance | 16 (100.0%) | 0 (0.0%) |
| Real Estate, Rental & Leasing | 0 (0.0%) | 0 (0.0%) |
| Professional & Scientific | 50 (75.8%) | 16 (24.2%) |
| Enterprise Management | 0 (0.0%) | 0 (0.0%) |
| Administrative & Support | 0 (0.0%) | 24 (100.0%) |
| Educational Services | 32 (23.0%) | 107 (77.0%) |
| Health Care & Social Assistance | 16 (9.4%) | 154 (90.6%) |
| Arts, Entertainment & Recreation | 0 (0.0%) | 0 (0.0%) |
| Accommodation & Food Services | 27 (19.7%) | 110 (80.3%) |
| Public Administration | 18 (14.4%) | 107 (85.6%) |
| Total | 592 (47.1%) | 666 (52.9%) |
Education in Mount Angel
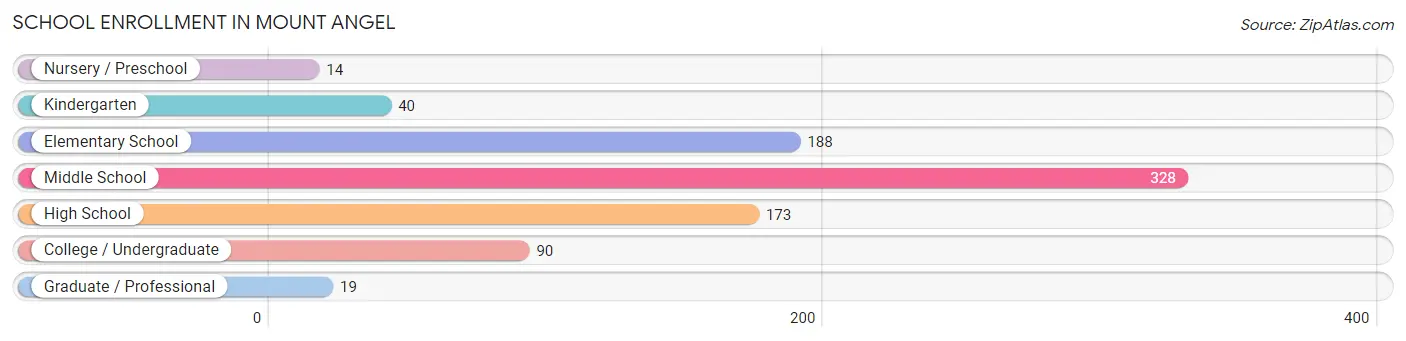
School Enrollment in Mount Angel
The most common levels of schooling among the 852 students in Mount Angel are middle school (328 | 38.5%), elementary school (188 | 22.1%), and high school (173 | 20.3%).
| School Level | # Students | % Students |
| Nursery / Preschool | 14 | 1.6% |
| Kindergarten | 40 | 4.7% |
| Elementary School | 188 | 22.1% |
| Middle School | 328 | 38.5% |
| High School | 173 | 20.3% |
| College / Undergraduate | 90 | 10.6% |
| Graduate / Professional | 19 | 2.2% |
| Total | 852 | 100.0% |
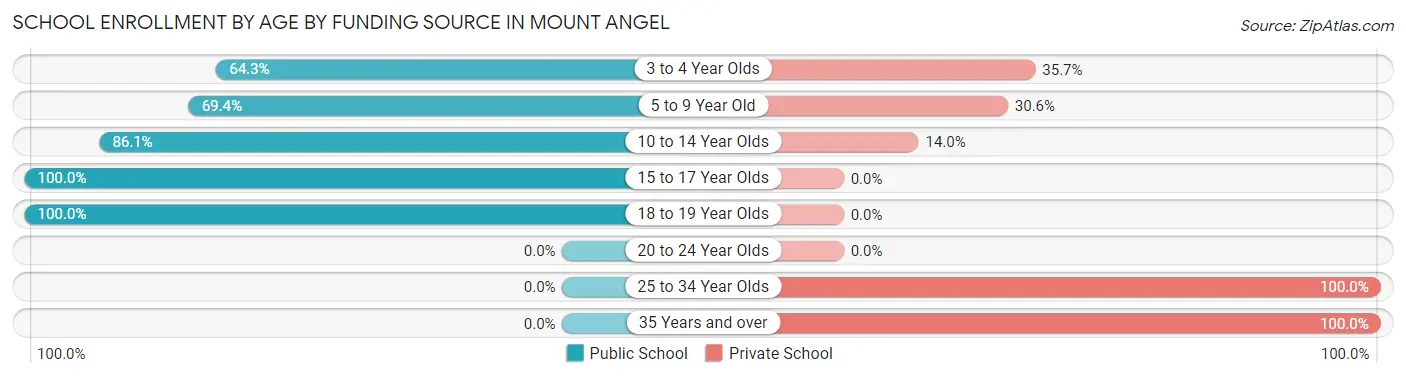
School Enrollment by Age by Funding Source in Mount Angel
Out of a total of 852 students who are enrolled in schools in Mount Angel, 140 (16.4%) attend a private institution, while the remaining 712 (83.6%) are enrolled in public schools. The age group of 25 to 34 year olds has the highest likelihood of being enrolled in private schools, with 13 (100.0% in the age bracket) enrolled. Conversely, the age group of 15 to 17 year olds has the lowest likelihood of being enrolled in a private school, with 143 (100.0% in the age bracket) attending a public institution.
| Age Bracket | Public School | Private School |
| 3 to 4 Year Olds | 9 (64.3%) | 5 (35.7%) |
| 5 to 9 Year Old | 143 (69.4%) | 63 (30.6%) |
| 10 to 14 Year Olds | 327 (86.1%) | 53 (14.0%) |
| 15 to 17 Year Olds | 143 (100.0%) | 0 (0.0%) |
| 18 to 19 Year Olds | 90 (100.0%) | 0 (0.0%) |
| 20 to 24 Year Olds | 0 (0.0%) | 0 (0.0%) |
| 25 to 34 Year Olds | 0 (0.0%) | 13 (100.0%) |
| 35 Years and over | 0 (0.0%) | 6 (100.0%) |
| Total | 712 (83.6%) | 140 (16.4%) |
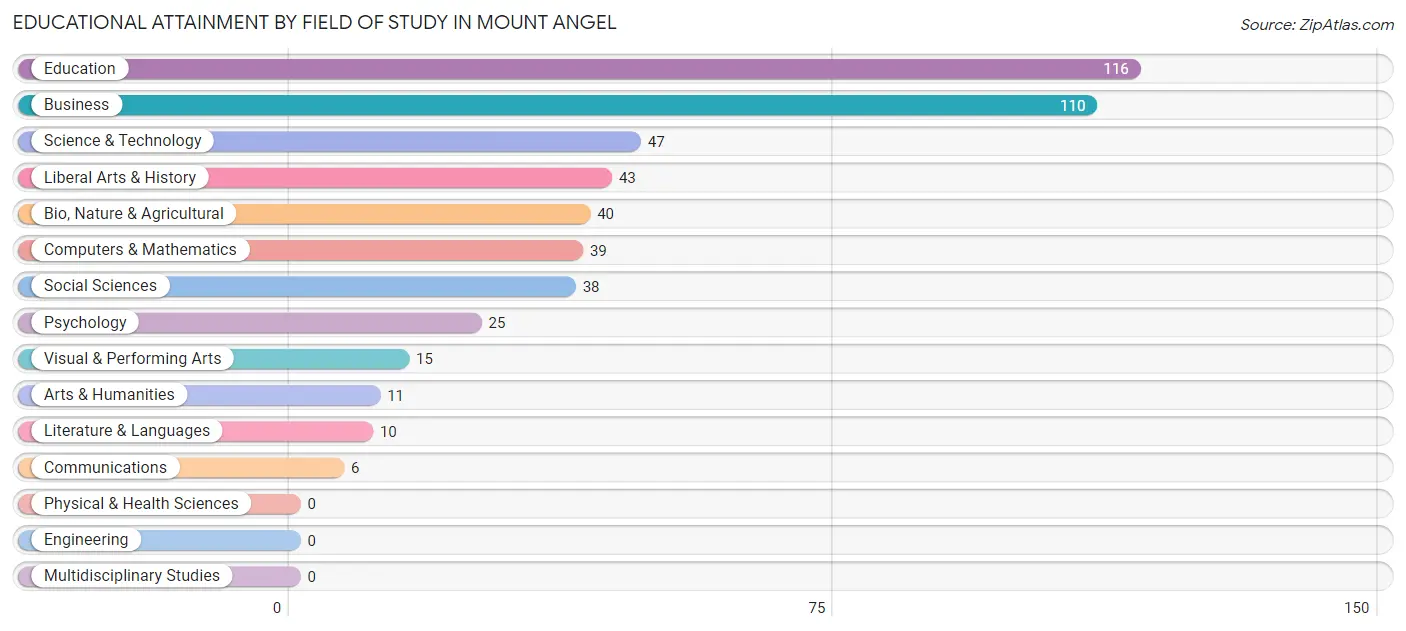
Educational Attainment by Field of Study in Mount Angel
Education (116 | 23.2%), business (110 | 22.0%), science & technology (47 | 9.4%), liberal arts & history (43 | 8.6%), and bio, nature & agricultural (40 | 8.0%) are the most common fields of study among 500 individuals in Mount Angel who have obtained a bachelor's degree or higher.
| Field of Study | # Graduates | % Graduates |
| Computers & Mathematics | 39 | 7.8% |
| Bio, Nature & Agricultural | 40 | 8.0% |
| Physical & Health Sciences | 0 | 0.0% |
| Psychology | 25 | 5.0% |
| Social Sciences | 38 | 7.6% |
| Engineering | 0 | 0.0% |
| Multidisciplinary Studies | 0 | 0.0% |
| Science & Technology | 47 | 9.4% |
| Business | 110 | 22.0% |
| Education | 116 | 23.2% |
| Literature & Languages | 10 | 2.0% |
| Liberal Arts & History | 43 | 8.6% |
| Visual & Performing Arts | 15 | 3.0% |
| Communications | 6 | 1.2% |
| Arts & Humanities | 11 | 2.2% |
| Total | 500 | 100.0% |
Transportation & Commute in Mount Angel
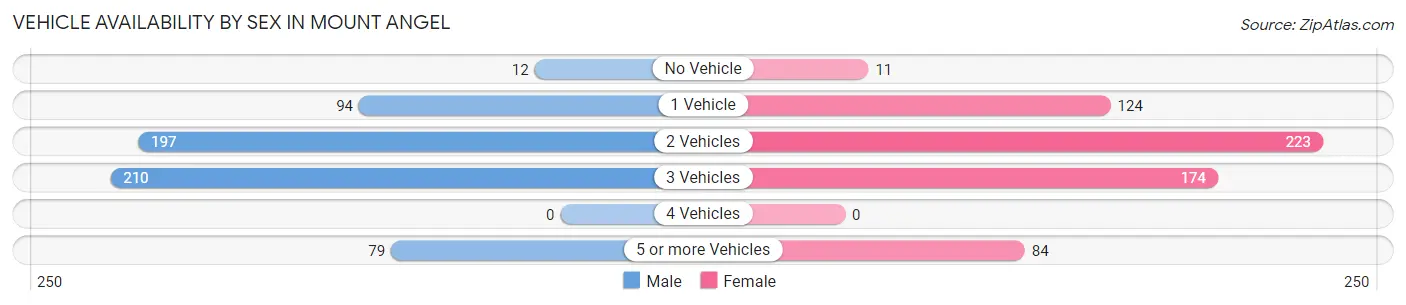
Vehicle Availability by Sex in Mount Angel
The most prevalent vehicle ownership categories in Mount Angel are males with 3 vehicles (210, accounting for 35.5%) and females with 3 vehicles (174, making up 34.1%).
| Vehicles Available | Male | Female |
| No Vehicle | 12 (2.0%) | 11 (1.8%) |
| 1 Vehicle | 94 (15.9%) | 124 (20.1%) |
| 2 Vehicles | 197 (33.3%) | 223 (36.2%) |
| 3 Vehicles | 210 (35.5%) | 174 (28.2%) |
| 4 Vehicles | 0 (0.0%) | 0 (0.0%) |
| 5 or more Vehicles | 79 (13.3%) | 84 (13.6%) |
| Total | 592 (100.0%) | 616 (100.0%) |
Commute Time in Mount Angel
The most frequently occuring commute durations in Mount Angel are 5 to 9 minutes (352 commuters, 29.6%), 30 to 34 minutes (201 commuters, 16.9%), and 15 to 19 minutes (172 commuters, 14.5%).
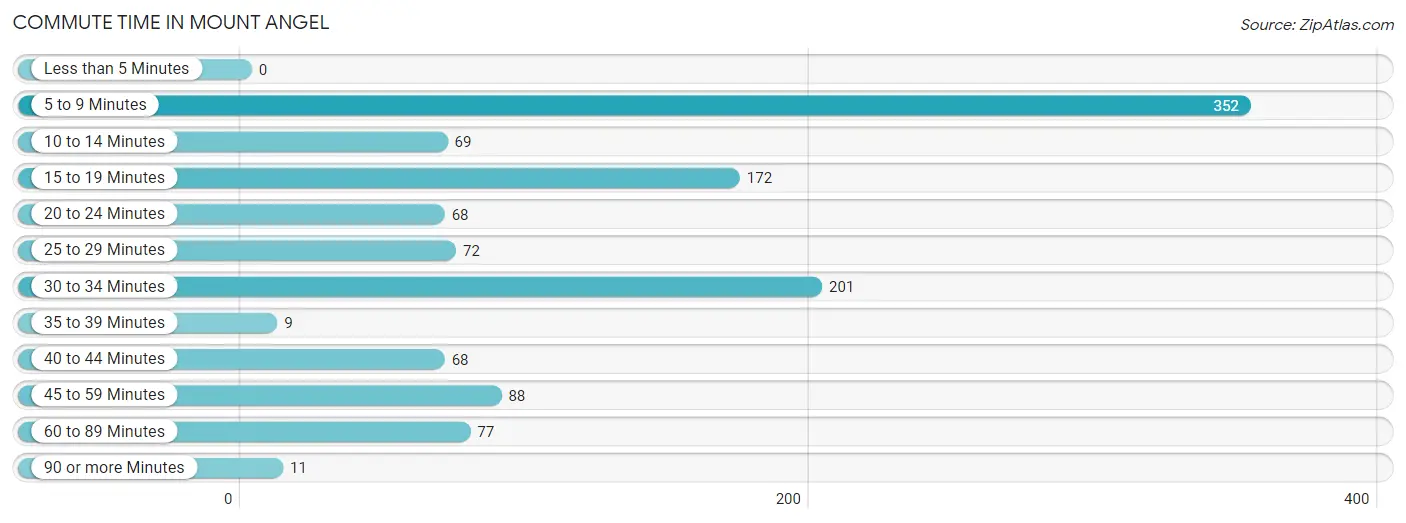
| Commute Time | # Commuters | % Commuters |
| Less than 5 Minutes | 0 | 0.0% |
| 5 to 9 Minutes | 352 | 29.6% |
| 10 to 14 Minutes | 69 | 5.8% |
| 15 to 19 Minutes | 172 | 14.5% |
| 20 to 24 Minutes | 68 | 5.7% |
| 25 to 29 Minutes | 72 | 6.1% |
| 30 to 34 Minutes | 201 | 16.9% |
| 35 to 39 Minutes | 9 | 0.8% |
| 40 to 44 Minutes | 68 | 5.7% |
| 45 to 59 Minutes | 88 | 7.4% |
| 60 to 89 Minutes | 77 | 6.5% |
| 90 or more Minutes | 11 | 0.9% |
Commute Time by Sex in Mount Angel
The most common commute times in Mount Angel are 5 to 9 minutes (173 commuters, 29.2%) for males and 5 to 9 minutes (179 commuters, 30.1%) for females.
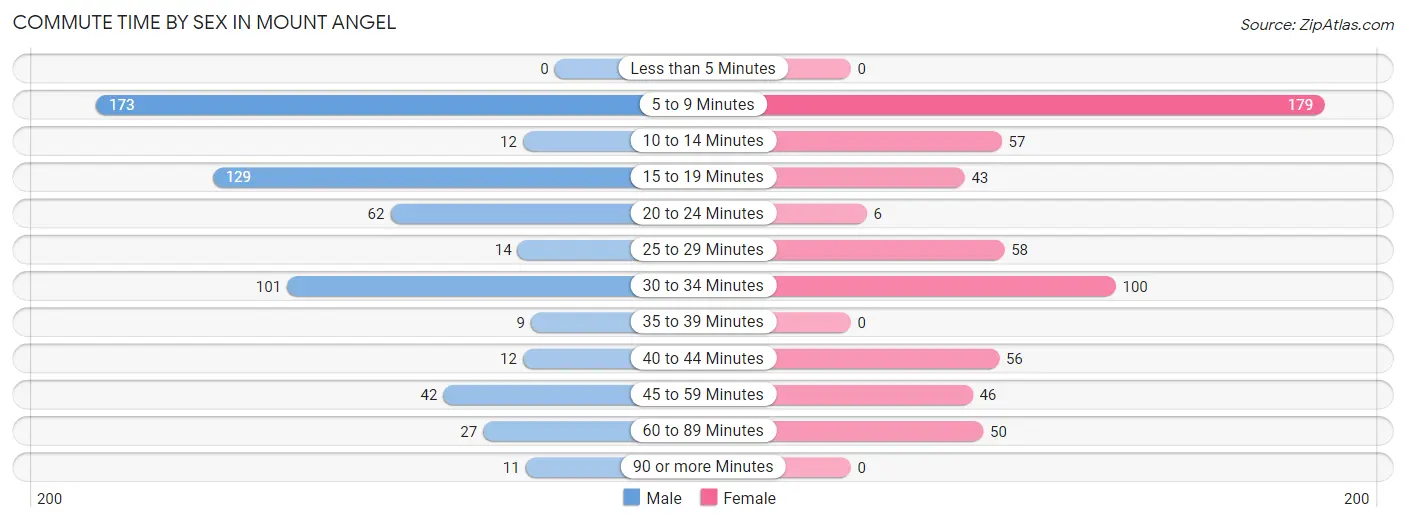
| Commute Time | Male | Female |
| Less than 5 Minutes | 0 (0.0%) | 0 (0.0%) |
| 5 to 9 Minutes | 173 (29.2%) | 179 (30.1%) |
| 10 to 14 Minutes | 12 (2.0%) | 57 (9.6%) |
| 15 to 19 Minutes | 129 (21.8%) | 43 (7.2%) |
| 20 to 24 Minutes | 62 (10.5%) | 6 (1.0%) |
| 25 to 29 Minutes | 14 (2.4%) | 58 (9.8%) |
| 30 to 34 Minutes | 101 (17.1%) | 100 (16.8%) |
| 35 to 39 Minutes | 9 (1.5%) | 0 (0.0%) |
| 40 to 44 Minutes | 12 (2.0%) | 56 (9.4%) |
| 45 to 59 Minutes | 42 (7.1%) | 46 (7.7%) |
| 60 to 89 Minutes | 27 (4.6%) | 50 (8.4%) |
| 90 or more Minutes | 11 (1.9%) | 0 (0.0%) |
Time of Departure to Work by Sex in Mount Angel
The most frequent times of departure to work in Mount Angel are 6:30 AM to 6:59 AM (137, 23.1%) for males and 6:30 AM to 6:59 AM (239, 40.2%) for females.
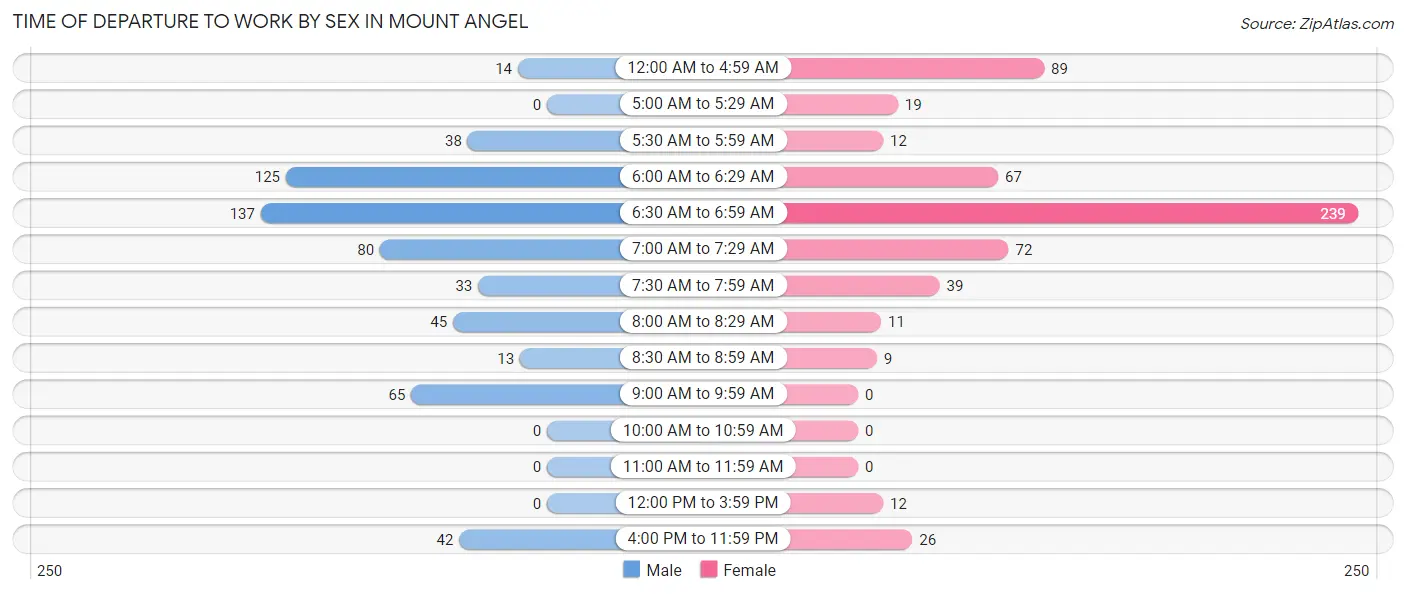
| Time of Departure | Male | Female |
| 12:00 AM to 4:59 AM | 14 (2.4%) | 89 (15.0%) |
| 5:00 AM to 5:29 AM | 0 (0.0%) | 19 (3.2%) |
| 5:30 AM to 5:59 AM | 38 (6.4%) | 12 (2.0%) |
| 6:00 AM to 6:29 AM | 125 (21.1%) | 67 (11.3%) |
| 6:30 AM to 6:59 AM | 137 (23.1%) | 239 (40.2%) |
| 7:00 AM to 7:29 AM | 80 (13.5%) | 72 (12.1%) |
| 7:30 AM to 7:59 AM | 33 (5.6%) | 39 (6.6%) |
| 8:00 AM to 8:29 AM | 45 (7.6%) | 11 (1.8%) |
| 8:30 AM to 8:59 AM | 13 (2.2%) | 9 (1.5%) |
| 9:00 AM to 9:59 AM | 65 (11.0%) | 0 (0.0%) |
| 10:00 AM to 10:59 AM | 0 (0.0%) | 0 (0.0%) |
| 11:00 AM to 11:59 AM | 0 (0.0%) | 0 (0.0%) |
| 12:00 PM to 3:59 PM | 0 (0.0%) | 12 (2.0%) |
| 4:00 PM to 11:59 PM | 42 (7.1%) | 26 (4.4%) |
| Total | 592 (100.0%) | 595 (100.0%) |
Housing Occupancy in Mount Angel
Occupancy by Ownership in Mount Angel
Of the total 1,275 dwellings in Mount Angel, owner-occupied units account for 710 (55.7%), while renter-occupied units make up 565 (44.3%).
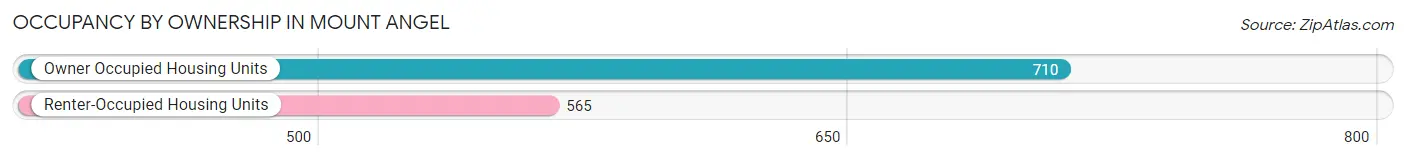
| Occupancy | # Housing Units | % Housing Units |
| Owner Occupied Housing Units | 710 | 55.7% |
| Renter-Occupied Housing Units | 565 | 44.3% |
| Total Occupied Housing Units | 1,275 | 100.0% |
Occupancy by Household Size in Mount Angel
| Household Size | # Housing Units | % Housing Units |
| 1-Person Household | 493 | 38.7% |
| 2-Person Household | 394 | 30.9% |
| 3-Person Household | 71 | 5.6% |
| 4+ Person Household | 317 | 24.9% |
| Total Housing Units | 1,275 | 100.0% |
Occupancy by Ownership by Household Size in Mount Angel
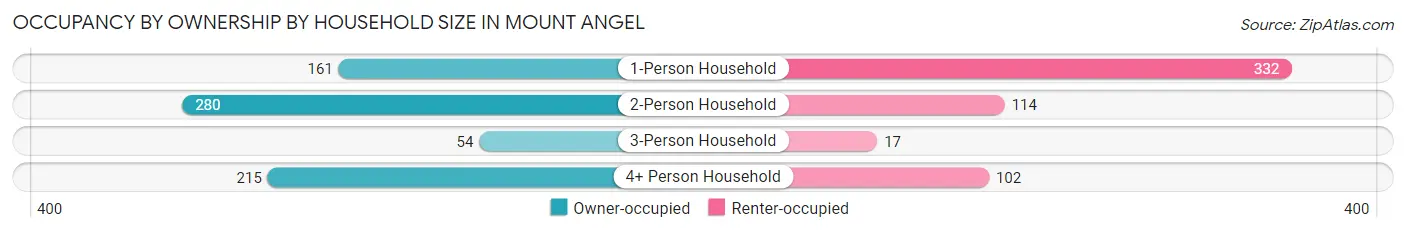
| Household Size | Owner-occupied | Renter-occupied |
| 1-Person Household | 161 (32.7%) | 332 (67.3%) |
| 2-Person Household | 280 (71.1%) | 114 (28.9%) |
| 3-Person Household | 54 (76.1%) | 17 (23.9%) |
| 4+ Person Household | 215 (67.8%) | 102 (32.2%) |
| Total Housing Units | 710 (55.7%) | 565 (44.3%) |
Occupancy by Educational Attainment in Mount Angel
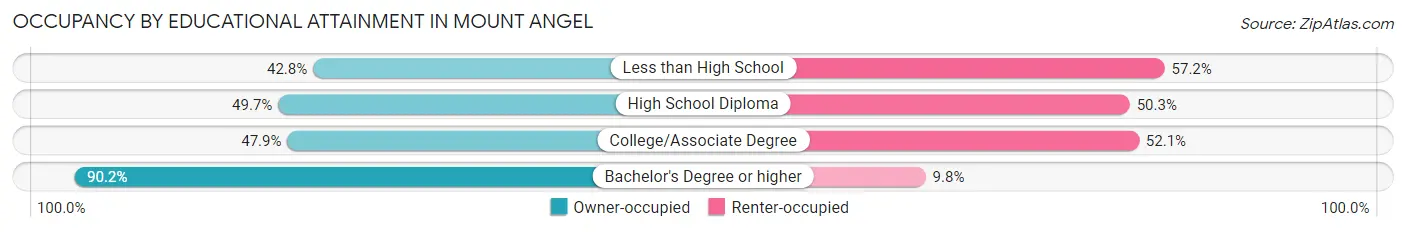
| Household Size | Owner-occupied | Renter-occupied |
| Less than High School | 137 (42.8%) | 183 (57.2%) |
| High School Diploma | 93 (49.7%) | 94 (50.3%) |
| College/Associate Degree | 241 (47.9%) | 262 (52.1%) |
| Bachelor's Degree or higher | 239 (90.2%) | 26 (9.8%) |
Occupancy by Age of Householder in Mount Angel
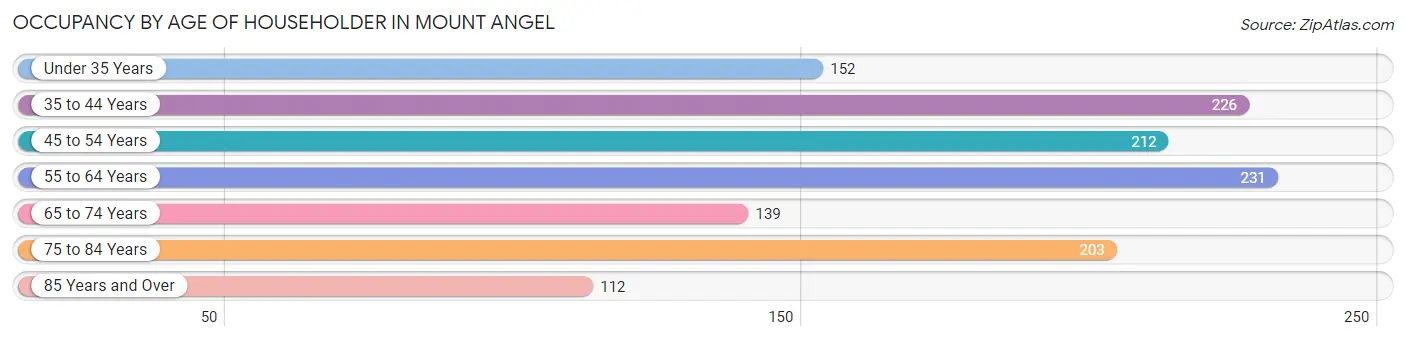
| Age Bracket | # Households | % Households |
| Under 35 Years | 152 | 11.9% |
| 35 to 44 Years | 226 | 17.7% |
| 45 to 54 Years | 212 | 16.6% |
| 55 to 64 Years | 231 | 18.1% |
| 65 to 74 Years | 139 | 10.9% |
| 75 to 84 Years | 203 | 15.9% |
| 85 Years and Over | 112 | 8.8% |
| Total | 1,275 | 100.0% |
Housing Finances in Mount Angel
Median Income by Occupancy in Mount Angel
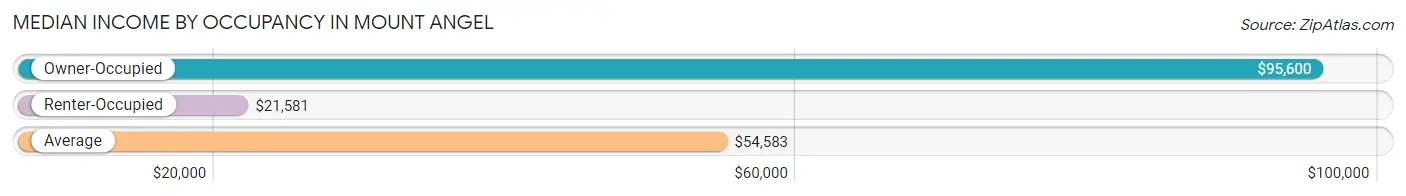
| Occupancy Type | # Households | Median Income |
| Owner-Occupied | 710 (55.7%) | $95,600 |
| Renter-Occupied | 565 (44.3%) | $21,581 |
| Average | 1,275 (100.0%) | $54,583 |
Occupancy by Householder Income Bracket in Mount Angel
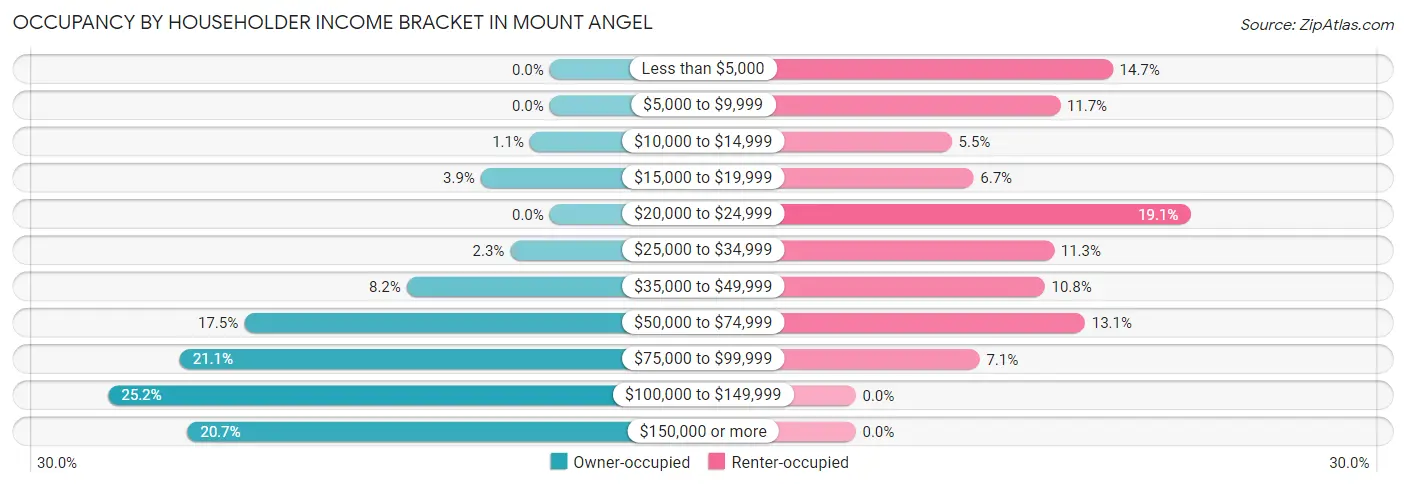
| Income Bracket | Owner-occupied | Renter-occupied |
| Less than $5,000 | 0 (0.0%) | 83 (14.7%) |
| $5,000 to $9,999 | 0 (0.0%) | 66 (11.7%) |
| $10,000 to $14,999 | 8 (1.1%) | 31 (5.5%) |
| $15,000 to $19,999 | 28 (3.9%) | 38 (6.7%) |
| $20,000 to $24,999 | 0 (0.0%) | 108 (19.1%) |
| $25,000 to $34,999 | 16 (2.2%) | 64 (11.3%) |
| $35,000 to $49,999 | 58 (8.2%) | 61 (10.8%) |
| $50,000 to $74,999 | 124 (17.5%) | 74 (13.1%) |
| $75,000 to $99,999 | 150 (21.1%) | 40 (7.1%) |
| $100,000 to $149,999 | 179 (25.2%) | 0 (0.0%) |
| $150,000 or more | 147 (20.7%) | 0 (0.0%) |
| Total | 710 (100.0%) | 565 (100.0%) |
Monthly Housing Cost Tiers in Mount Angel
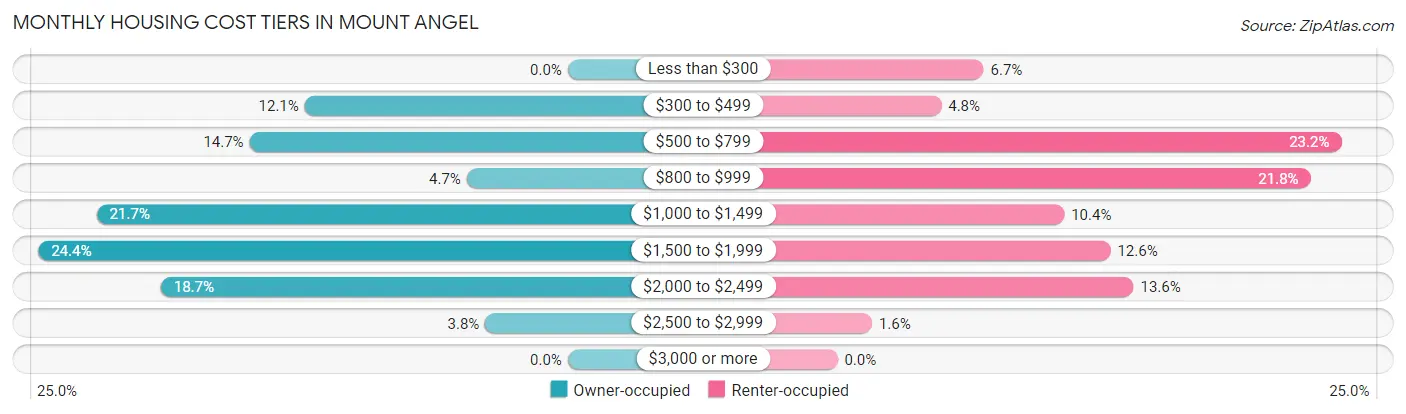
| Monthly Cost | Owner-occupied | Renter-occupied |
| Less than $300 | 0 (0.0%) | 38 (6.7%) |
| $300 to $499 | 86 (12.1%) | 27 (4.8%) |
| $500 to $799 | 104 (14.6%) | 131 (23.2%) |
| $800 to $999 | 33 (4.6%) | 123 (21.8%) |
| $1,000 to $1,499 | 154 (21.7%) | 59 (10.4%) |
| $1,500 to $1,999 | 173 (24.4%) | 71 (12.6%) |
| $2,000 to $2,499 | 133 (18.7%) | 77 (13.6%) |
| $2,500 to $2,999 | 27 (3.8%) | 9 (1.6%) |
| $3,000 or more | 0 (0.0%) | 0 (0.0%) |
| Total | 710 (100.0%) | 565 (100.0%) |
Physical Housing Characteristics in Mount Angel
Housing Structures in Mount Angel
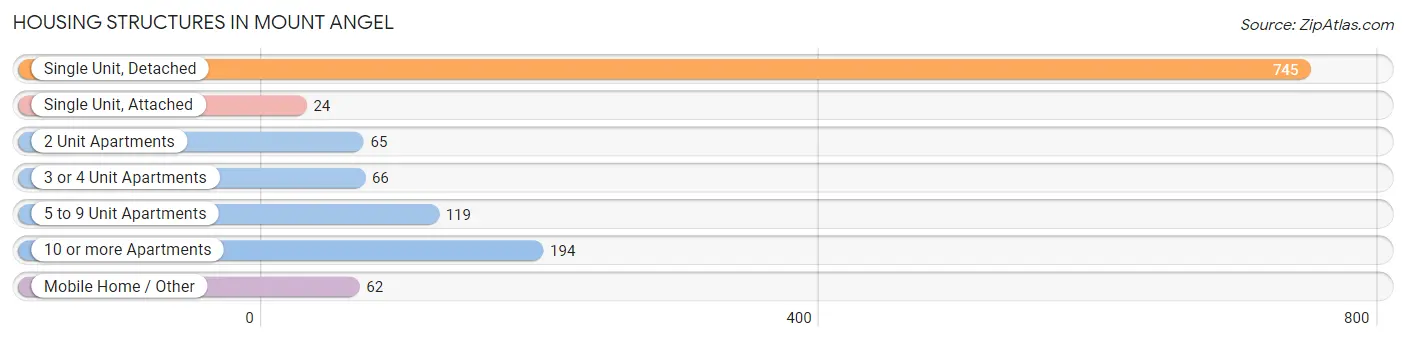
| Structure Type | # Housing Units | % Housing Units |
| Single Unit, Detached | 745 | 58.4% |
| Single Unit, Attached | 24 | 1.9% |
| 2 Unit Apartments | 65 | 5.1% |
| 3 or 4 Unit Apartments | 66 | 5.2% |
| 5 to 9 Unit Apartments | 119 | 9.3% |
| 10 or more Apartments | 194 | 15.2% |
| Mobile Home / Other | 62 | 4.9% |
| Total | 1,275 | 100.0% |
Housing Structures by Occupancy in Mount Angel
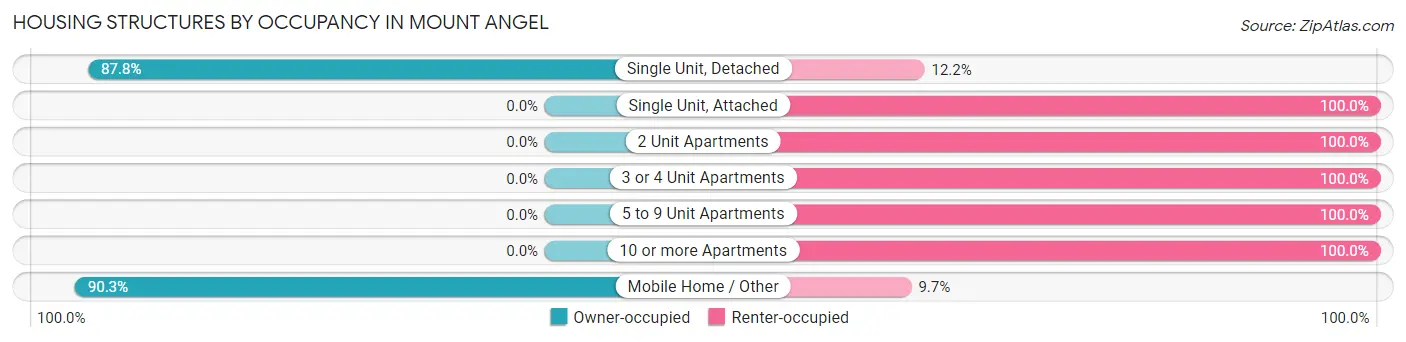
| Structure Type | Owner-occupied | Renter-occupied |
| Single Unit, Detached | 654 (87.8%) | 91 (12.2%) |
| Single Unit, Attached | 0 (0.0%) | 24 (100.0%) |
| 2 Unit Apartments | 0 (0.0%) | 65 (100.0%) |
| 3 or 4 Unit Apartments | 0 (0.0%) | 66 (100.0%) |
| 5 to 9 Unit Apartments | 0 (0.0%) | 119 (100.0%) |
| 10 or more Apartments | 0 (0.0%) | 194 (100.0%) |
| Mobile Home / Other | 56 (90.3%) | 6 (9.7%) |
| Total | 710 (55.7%) | 565 (44.3%) |
Housing Structures by Number of Rooms in Mount Angel
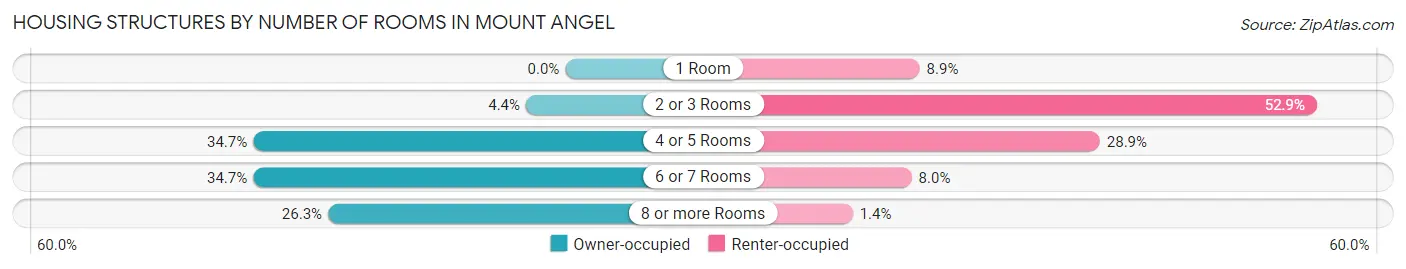
| Number of Rooms | Owner-occupied | Renter-occupied |
| 1 Room | 0 (0.0%) | 50 (8.8%) |
| 2 or 3 Rooms | 31 (4.4%) | 299 (52.9%) |
| 4 or 5 Rooms | 246 (34.6%) | 163 (28.8%) |
| 6 or 7 Rooms | 246 (34.6%) | 45 (8.0%) |
| 8 or more Rooms | 187 (26.3%) | 8 (1.4%) |
| Total | 710 (100.0%) | 565 (100.0%) |
Housing Structure by Heating Type in Mount Angel
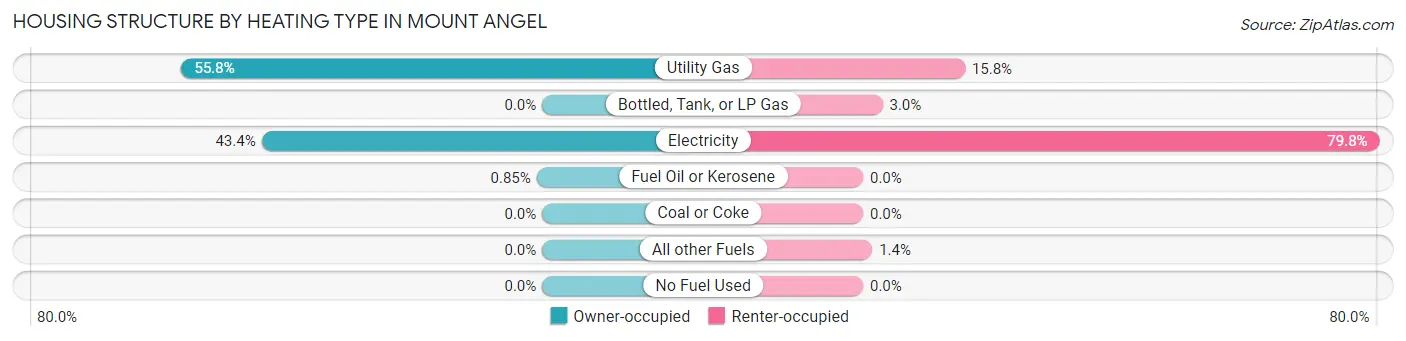
| Heating Type | Owner-occupied | Renter-occupied |
| Utility Gas | 396 (55.8%) | 89 (15.8%) |
| Bottled, Tank, or LP Gas | 0 (0.0%) | 17 (3.0%) |
| Electricity | 308 (43.4%) | 451 (79.8%) |
| Fuel Oil or Kerosene | 6 (0.9%) | 0 (0.0%) |
| Coal or Coke | 0 (0.0%) | 0 (0.0%) |
| All other Fuels | 0 (0.0%) | 8 (1.4%) |
| No Fuel Used | 0 (0.0%) | 0 (0.0%) |
| Total | 710 (100.0%) | 565 (100.0%) |
Household Vehicle Usage in Mount Angel
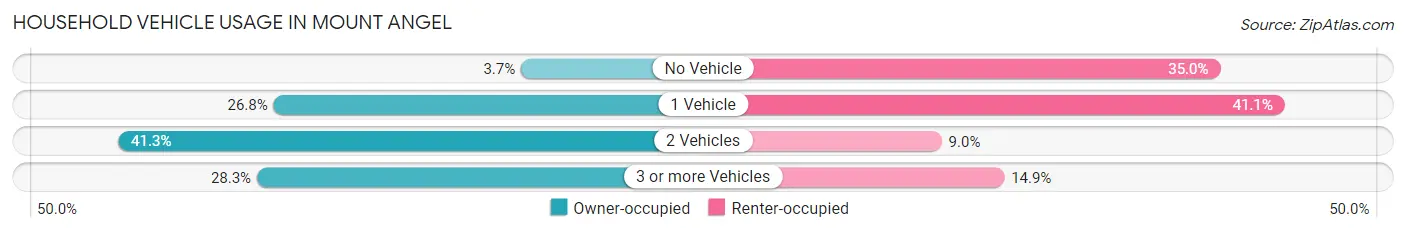
| Vehicles per Household | Owner-occupied | Renter-occupied |
| No Vehicle | 26 (3.7%) | 198 (35.0%) |
| 1 Vehicle | 190 (26.8%) | 232 (41.1%) |
| 2 Vehicles | 293 (41.3%) | 51 (9.0%) |
| 3 or more Vehicles | 201 (28.3%) | 84 (14.9%) |
| Total | 710 (100.0%) | 565 (100.0%) |
Real Estate & Mortgages in Mount Angel
Real Estate and Mortgage Overview in Mount Angel
| Characteristic | Without Mortgage | With Mortgage |
| Housing Units | 262 | 448 |
| Median Property Value | $387,000 | $361,000 |
| Median Household Income | $80,750 | $147 |
| Monthly Housing Costs | $644 | $0 |
| Real Estate Taxes | $2,966 | $0 |
Property Value by Mortgage Status in Mount Angel
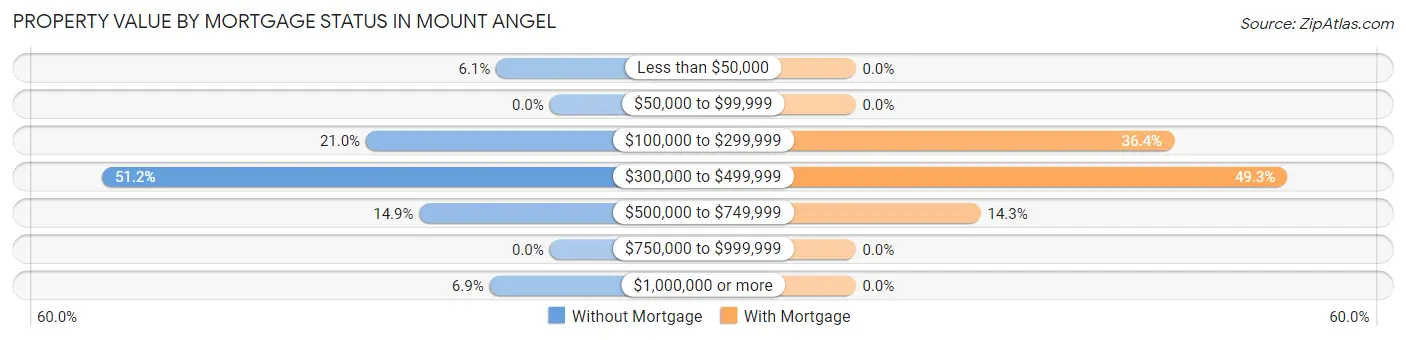
| Property Value | Without Mortgage | With Mortgage |
| Less than $50,000 | 16 (6.1%) | 0 (0.0%) |
| $50,000 to $99,999 | 0 (0.0%) | 0 (0.0%) |
| $100,000 to $299,999 | 55 (21.0%) | 163 (36.4%) |
| $300,000 to $499,999 | 134 (51.1%) | 221 (49.3%) |
| $500,000 to $749,999 | 39 (14.9%) | 64 (14.3%) |
| $750,000 to $999,999 | 0 (0.0%) | 0 (0.0%) |
| $1,000,000 or more | 18 (6.9%) | 0 (0.0%) |
| Total | 262 (100.0%) | 448 (100.0%) |
Household Income by Mortgage Status in Mount Angel
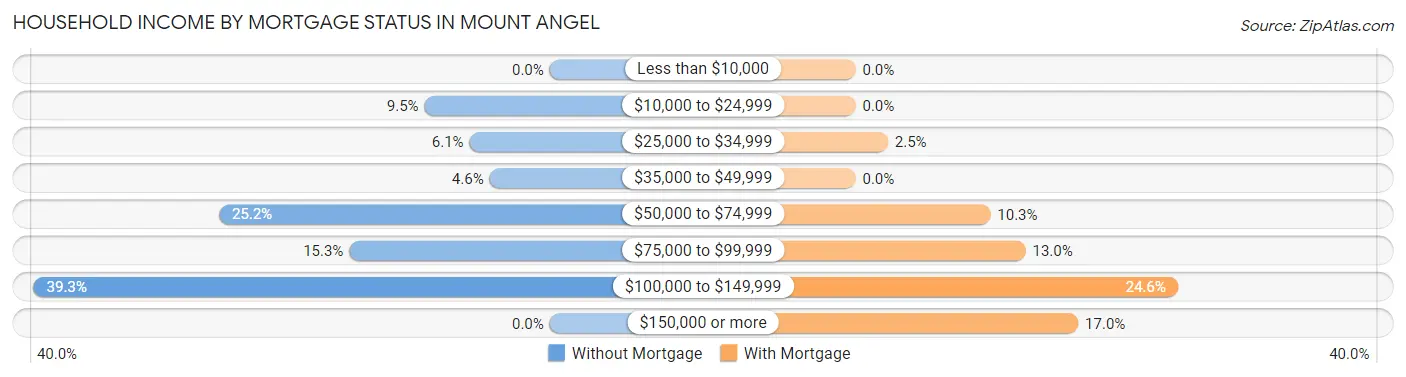
| Household Income | Without Mortgage | With Mortgage |
| Less than $10,000 | 0 (0.0%) | 0 (0.0%) |
| $10,000 to $24,999 | 25 (9.5%) | 0 (0.0%) |
| $25,000 to $34,999 | 16 (6.1%) | 11 (2.5%) |
| $35,000 to $49,999 | 12 (4.6%) | 0 (0.0%) |
| $50,000 to $74,999 | 66 (25.2%) | 46 (10.3%) |
| $75,000 to $99,999 | 40 (15.3%) | 58 (13.0%) |
| $100,000 to $149,999 | 103 (39.3%) | 110 (24.5%) |
| $150,000 or more | 0 (0.0%) | 76 (17.0%) |
| Total | 262 (100.0%) | 448 (100.0%) |
Property Value to Household Income Ratio in Mount Angel
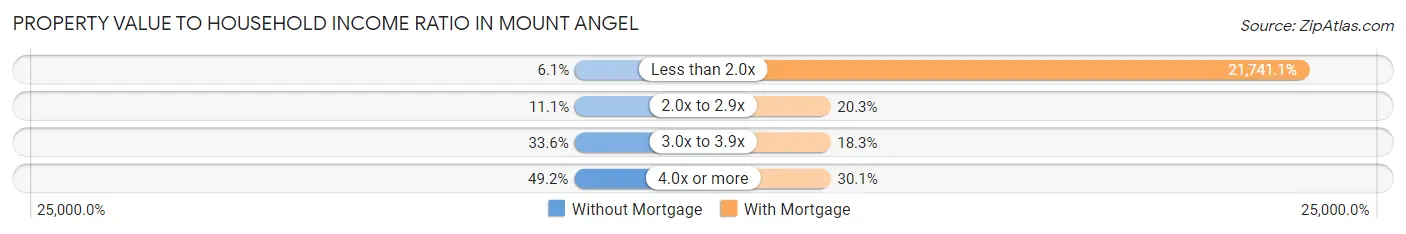
| Value-to-Income Ratio | Without Mortgage | With Mortgage |
| Less than 2.0x | 16 (6.1%) | 97,400 (21,741.1%) |
| 2.0x to 2.9x | 29 (11.1%) | 91 (20.3%) |
| 3.0x to 3.9x | 88 (33.6%) | 82 (18.3%) |
| 4.0x or more | 129 (49.2%) | 135 (30.1%) |
| Total | 262 (100.0%) | 448 (100.0%) |
Real Estate Taxes by Mortgage Status in Mount Angel
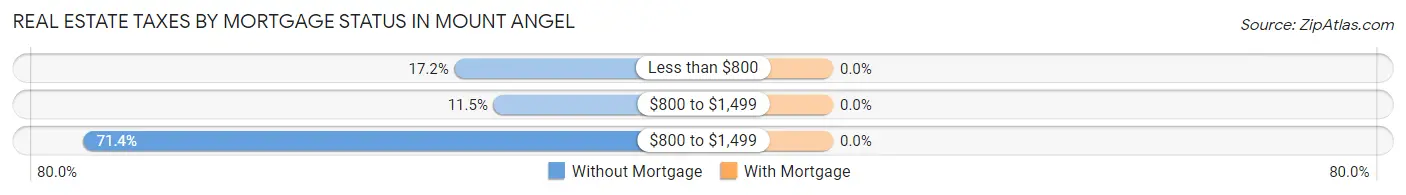
| Property Taxes | Without Mortgage | With Mortgage |
| Less than $800 | 45 (17.2%) | 0 (0.0%) |
| $800 to $1,499 | 30 (11.5%) | 0 (0.0%) |
| $800 to $1,499 | 187 (71.4%) | 0 (0.0%) |
| Total | 262 (100.0%) | 448 (100.0%) |
Health & Disability in Mount Angel
Health Insurance Coverage by Age in Mount Angel
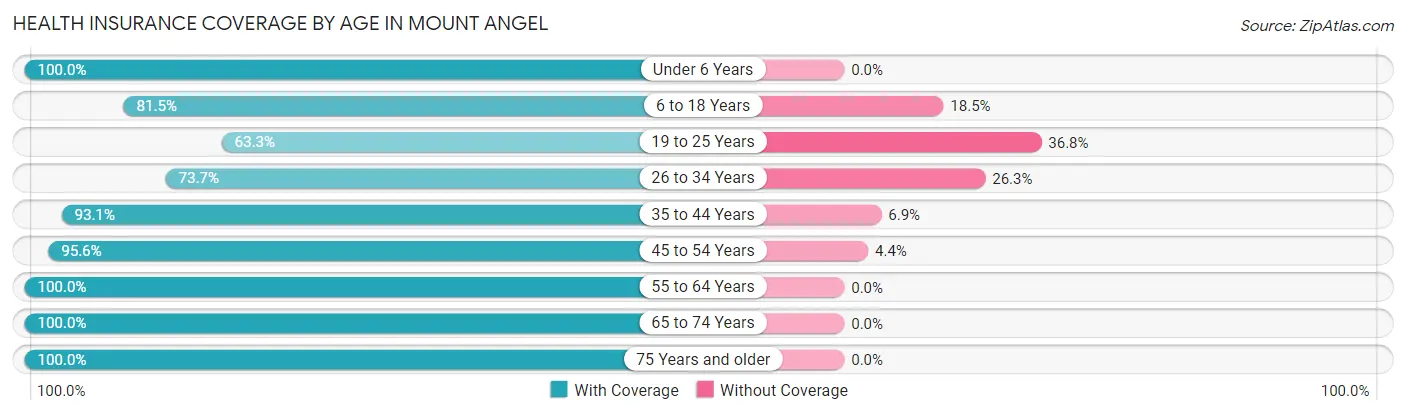
| Age Bracket | With Coverage | Without Coverage |
| Under 6 Years | 169 (100.0%) | 0 (0.0%) |
| 6 to 18 Years | 653 (81.5%) | 148 (18.5%) |
| 19 to 25 Years | 74 (63.2%) | 43 (36.7%) |
| 26 to 34 Years | 227 (73.7%) | 81 (26.3%) |
| 35 to 44 Years | 566 (93.1%) | 42 (6.9%) |
| 45 to 54 Years | 258 (95.6%) | 12 (4.4%) |
| 55 to 64 Years | 387 (100.0%) | 0 (0.0%) |
| 65 to 74 Years | 229 (100.0%) | 0 (0.0%) |
| 75 Years and older | 378 (100.0%) | 0 (0.0%) |
| Total | 2,941 (90.0%) | 326 (10.0%) |
Health Insurance Coverage by Citizenship Status in Mount Angel
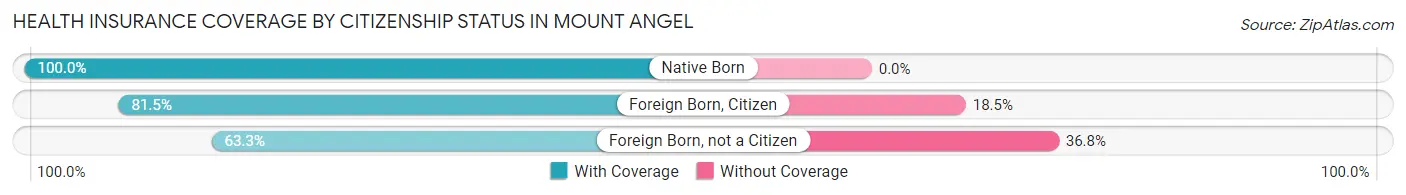
| Citizenship Status | With Coverage | Without Coverage |
| Native Born | 169 (100.0%) | 0 (0.0%) |
| Foreign Born, Citizen | 653 (81.5%) | 148 (18.5%) |
| Foreign Born, not a Citizen | 74 (63.2%) | 43 (36.7%) |
Health Insurance Coverage by Household Income in Mount Angel
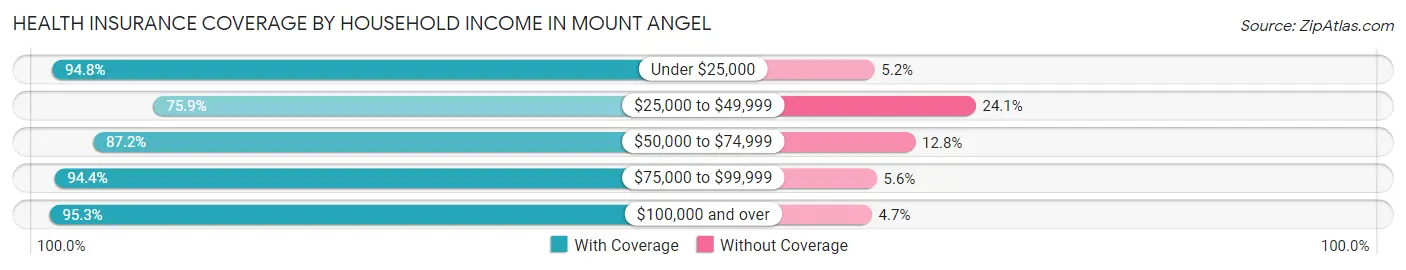
| Household Income | With Coverage | Without Coverage |
| Under $25,000 | 441 (94.8%) | 24 (5.2%) |
| $25,000 to $49,999 | 541 (75.9%) | 172 (24.1%) |
| $50,000 to $74,999 | 347 (87.2%) | 51 (12.8%) |
| $75,000 to $99,999 | 423 (94.4%) | 25 (5.6%) |
| $100,000 and over | 1,104 (95.3%) | 54 (4.7%) |
Public vs Private Health Insurance Coverage by Age in Mount Angel
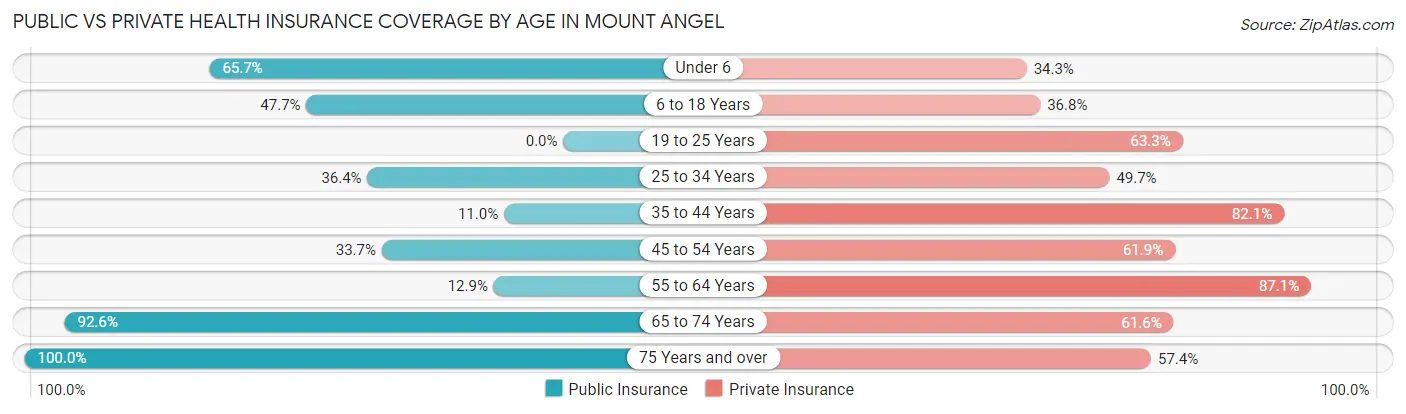
| Age Bracket | Public Insurance | Private Insurance |
| Under 6 | 111 (65.7%) | 58 (34.3%) |
| 6 to 18 Years | 382 (47.7%) | 295 (36.8%) |
| 19 to 25 Years | 0 (0.0%) | 74 (63.2%) |
| 25 to 34 Years | 112 (36.4%) | 153 (49.7%) |
| 35 to 44 Years | 67 (11.0%) | 499 (82.1%) |
| 45 to 54 Years | 91 (33.7%) | 167 (61.9%) |
| 55 to 64 Years | 50 (12.9%) | 337 (87.1%) |
| 65 to 74 Years | 212 (92.6%) | 141 (61.6%) |
| 75 Years and over | 378 (100.0%) | 217 (57.4%) |
| Total | 1,403 (42.9%) | 1,941 (59.4%) |
Disability Status by Sex by Age in Mount Angel
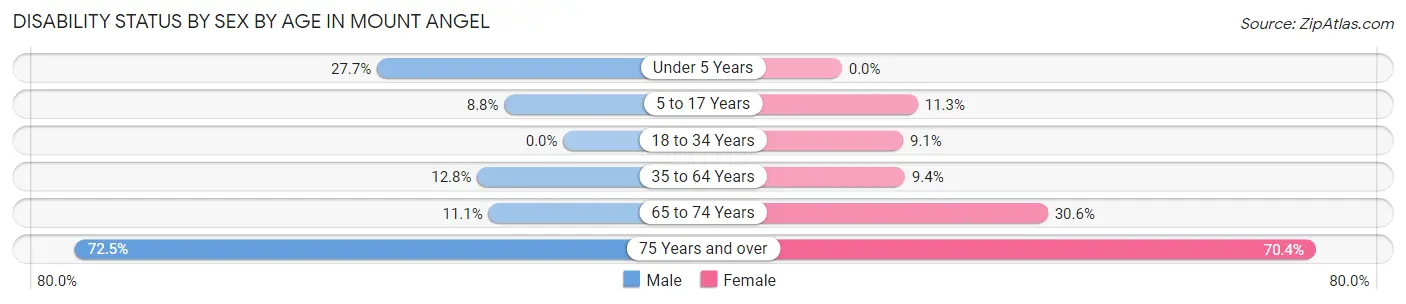
| Age Bracket | Male | Female |
| Under 5 Years | 13 (27.7%) | 0 (0.0%) |
| 5 to 17 Years | 34 (8.8%) | 42 (11.3%) |
| 18 to 34 Years | 0 (0.0%) | 26 (9.1%) |
| 35 to 64 Years | 73 (12.8%) | 65 (9.4%) |
| 65 to 74 Years | 12 (11.1%) | 37 (30.6%) |
| 75 Years and over | 66 (72.5%) | 202 (70.4%) |
Disability Class by Sex by Age in Mount Angel
Disability Class: Hearing Difficulty
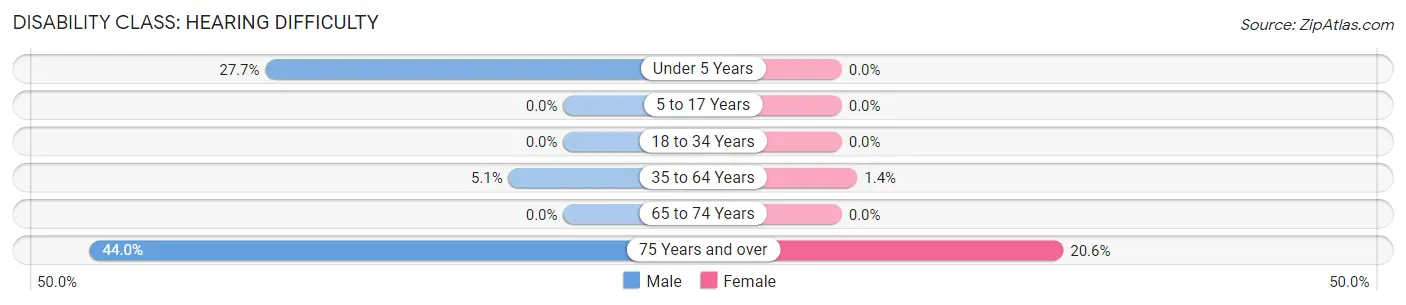
| Age Bracket | Male | Female |
| Under 5 Years | 13 (27.7%) | 0 (0.0%) |
| 5 to 17 Years | 0 (0.0%) | 0 (0.0%) |
| 18 to 34 Years | 0 (0.0%) | 0 (0.0%) |
| 35 to 64 Years | 29 (5.1%) | 10 (1.4%) |
| 65 to 74 Years | 0 (0.0%) | 0 (0.0%) |
| 75 Years and over | 40 (44.0%) | 59 (20.6%) |
Disability Class: Vision Difficulty
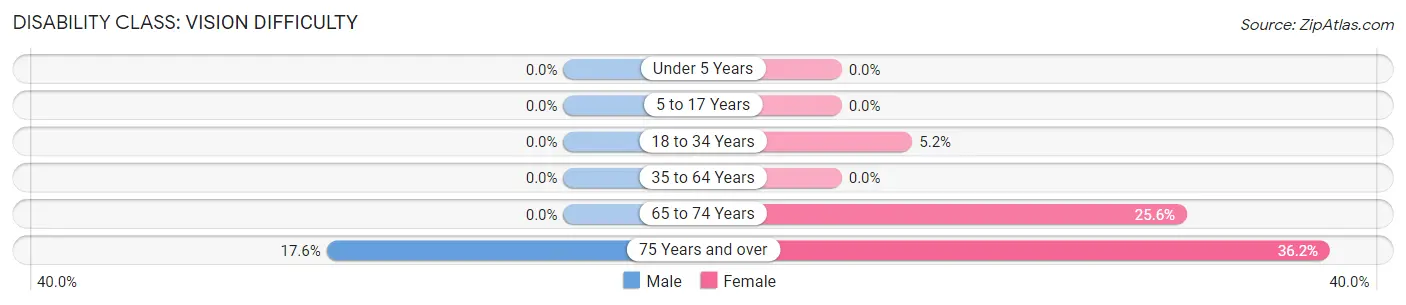
| Age Bracket | Male | Female |
| Under 5 Years | 0 (0.0%) | 0 (0.0%) |
| 5 to 17 Years | 0 (0.0%) | 0 (0.0%) |
| 18 to 34 Years | 0 (0.0%) | 15 (5.2%) |
| 35 to 64 Years | 0 (0.0%) | 0 (0.0%) |
| 65 to 74 Years | 0 (0.0%) | 31 (25.6%) |
| 75 Years and over | 16 (17.6%) | 104 (36.2%) |
Disability Class: Cognitive Difficulty
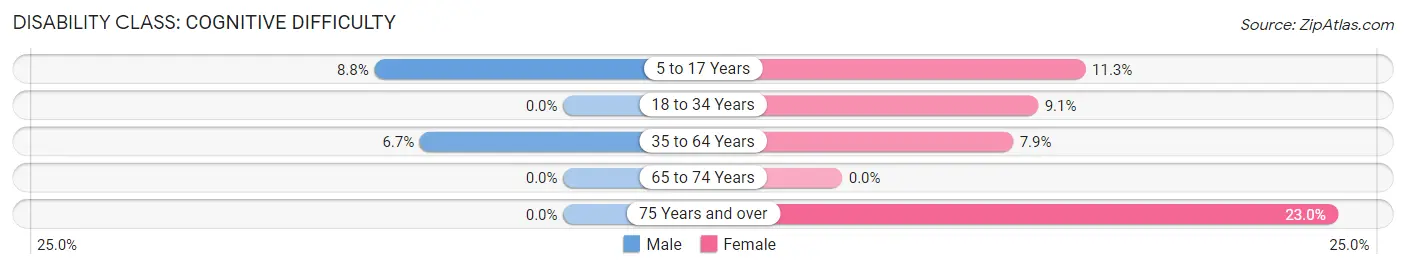
| Age Bracket | Male | Female |
| 5 to 17 Years | 34 (8.8%) | 42 (11.3%) |
| 18 to 34 Years | 0 (0.0%) | 26 (9.1%) |
| 35 to 64 Years | 38 (6.7%) | 55 (7.9%) |
| 65 to 74 Years | 0 (0.0%) | 0 (0.0%) |
| 75 Years and over | 0 (0.0%) | 66 (23.0%) |
Disability Class: Ambulatory Difficulty
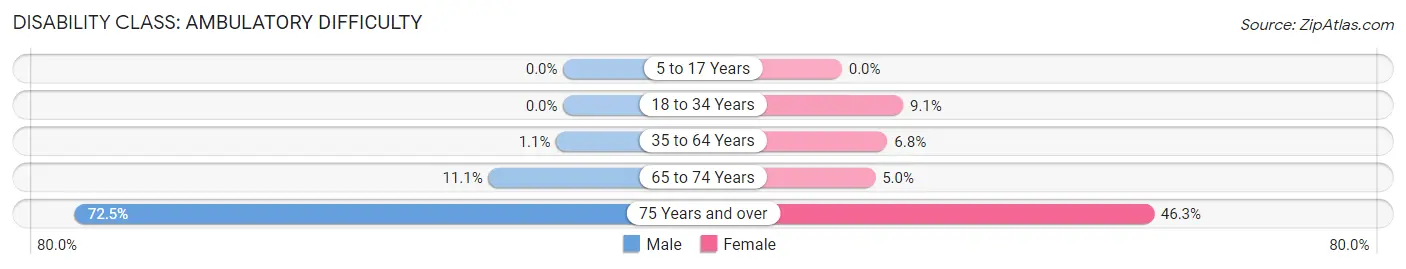
| Age Bracket | Male | Female |
| 5 to 17 Years | 0 (0.0%) | 0 (0.0%) |
| 18 to 34 Years | 0 (0.0%) | 26 (9.1%) |
| 35 to 64 Years | 6 (1.1%) | 47 (6.8%) |
| 65 to 74 Years | 12 (11.1%) | 6 (5.0%) |
| 75 Years and over | 66 (72.5%) | 133 (46.3%) |
Disability Class: Self-Care Difficulty
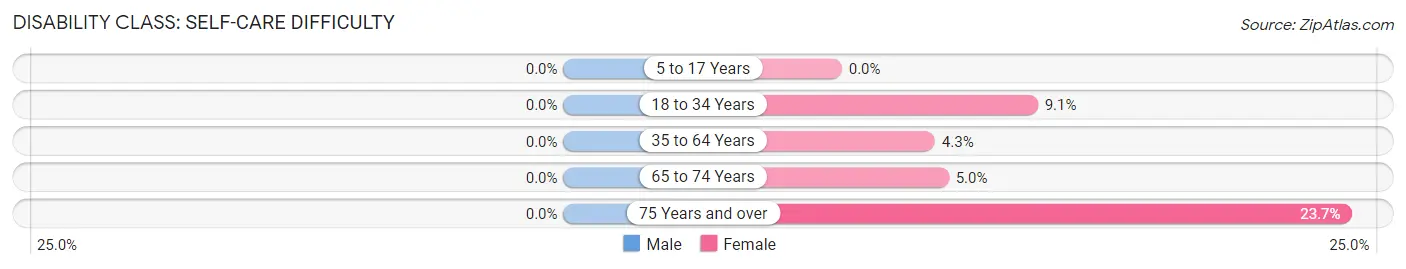
| Age Bracket | Male | Female |
| 5 to 17 Years | 0 (0.0%) | 0 (0.0%) |
| 18 to 34 Years | 0 (0.0%) | 26 (9.1%) |
| 35 to 64 Years | 0 (0.0%) | 30 (4.3%) |
| 65 to 74 Years | 0 (0.0%) | 6 (5.0%) |
| 75 Years and over | 0 (0.0%) | 68 (23.7%) |
Technology Access in Mount Angel
Computing Device Access in Mount Angel
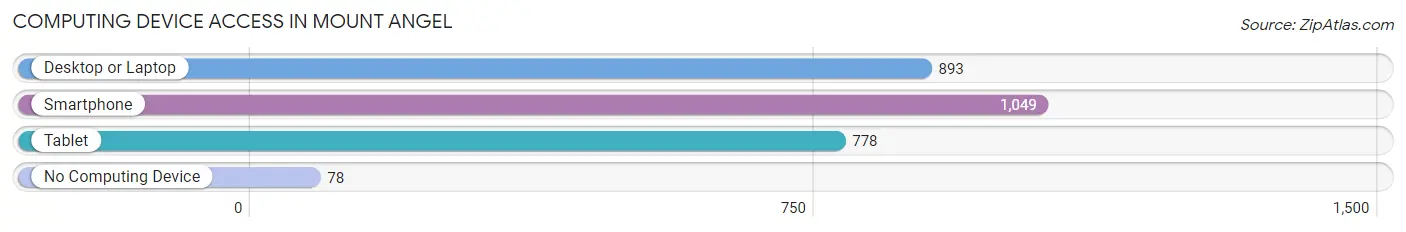
| Device Type | # Households | % Households |
| Desktop or Laptop | 893 | 70.0% |
| Smartphone | 1,049 | 82.3% |
| Tablet | 778 | 61.0% |
| No Computing Device | 78 | 6.1% |
| Total | 1,275 | 100.0% |
Internet Access in Mount Angel
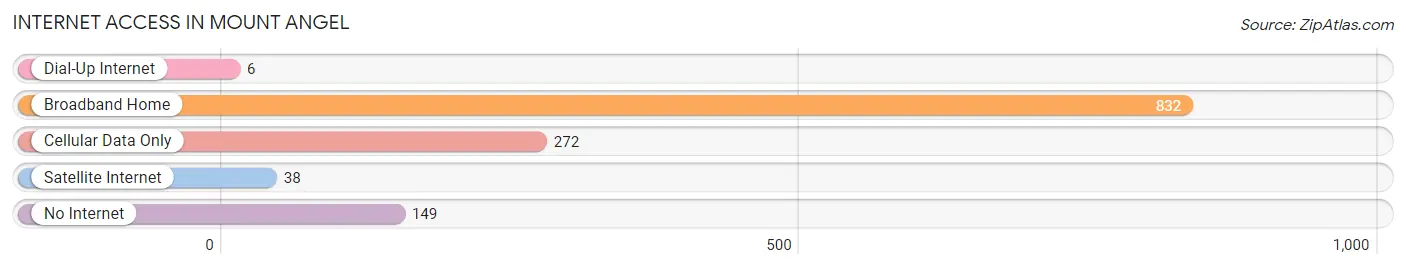
| Internet Type | # Households | % Households |
| Dial-Up Internet | 6 | 0.5% |
| Broadband Home | 832 | 65.2% |
| Cellular Data Only | 272 | 21.3% |
| Satellite Internet | 38 | 3.0% |
| No Internet | 149 | 11.7% |
| Total | 1,275 | 100.0% |
Mount Angel Summary
Mount Angel, Oregon is a small city located in Marion County, Oregon, United States. It is situated in the foothills of the Cascade Mountains, approximately 25 miles south of Portland. The city is named after the nearby Mount Angel Abbey, a Benedictine monastery founded in 1882. As of the 2010 census, the city had a population of 3,286.
History
The area around Mount Angel was first inhabited by the Kalapuya Native American tribe. The first European settlers arrived in the area in the early 1850s, and the town was officially founded in 1882. The town was named after the nearby Mount Angel Abbey, a Benedictine monastery founded by Father Adelhelm Odermatt. The monastery was established to serve the spiritual needs of the German-speaking immigrants who had settled in the area.
The town grew rapidly in the late 19th and early 20th centuries, and by the 1920s it had become a thriving agricultural and commercial center. The town was incorporated in 1911, and the first mayor was elected in 1912.
Geography
Mount Angel is located in the foothills of the Cascade Mountains, approximately 25 miles south of Portland. The city is situated at an elevation of 845 feet above sea level. The city covers an area of 1.7 square miles, and is bordered by the cities of Silverton and Stayton to the north, and the towns of Scotts Mills and Sublimity to the south.
The city is located in the Willamette Valley, and is surrounded by rolling hills and farmland. The city is situated on the banks of the Pudding River, which flows through the city and is a popular spot for fishing and swimming.
Economy
The economy of Mount Angel is largely based on agriculture and tourism. The city is home to several wineries, breweries, and distilleries, as well as a number of small businesses. The city is also home to several large employers, including the Mount Angel Abbey, the Mount Angel Sausage Company, and the Mount Angel Publishing Company.
Demographics
As of the 2010 census, the city had a population of 3,286. The racial makeup of the city was 94.2% White, 0.7% African American, 0.7% Native American, 0.7% Asian, 0.2% Pacific Islander, 1.2% from other races, and 2.1% from two or more races. Hispanic or Latino of any race were 4.2% of the population.
The median income for a household in the city was $45,938, and the median income for a family was $51,938. The per capita income for the city was $20,938. About 8.2% of families and 10.2% of the population were below the poverty line, including 14.2% of those under age 18 and 6.2% of those age 65 or over.
Mount Angel is a small city with a rich history and a vibrant economy. The city is home to a diverse population, and is a popular destination for tourists and outdoor enthusiasts. The city is also home to several large employers, and is a great place to live and work.
Common Questions
What is Per Capita Income in Mount Angel?
Per Capita income in Mount Angel is $28,738.
What is the Median Family Income in Mount Angel?
Median Family Income in Mount Angel is $77,250.
What is the Median Household income in Mount Angel?
Median Household Income in Mount Angel is $54,583.
What is Income or Wage Gap in Mount Angel?
Income or Wage Gap in Mount Angel is 50.8%.
Women in Mount Angel earn 49.2 cents for every dollar earned by a man.
What is Inequality or Gini Index in Mount Angel?
Inequality or Gini Index in Mount Angel is 0.45.
What is the Total Population of Mount Angel?
Total Population of Mount Angel is 3,413.
What is the Total Male Population of Mount Angel?
Total Male Population of Mount Angel is 1,422.
What is the Total Female Population of Mount Angel?
Total Female Population of Mount Angel is 1,991.
What is the Ratio of Males per 100 Females in Mount Angel?
There are 71.42 Males per 100 Females in Mount Angel.
What is the Ratio of Females per 100 Males in Mount Angel?
There are 140.01 Females per 100 Males in Mount Angel.
What is the Median Population Age in Mount Angel?
Median Population Age in Mount Angel is 38.5 Years.
What is the Average Family Size in Mount Angel
Average Family Size in Mount Angel is 3.4 People.
What is the Average Household Size in Mount Angel
Average Household Size in Mount Angel is 2.5 People.
How Large is the Labor Force in Mount Angel?
There are 1,417 People in the Labor Forcein in Mount Angel.
What is the Percentage of People in the Labor Force in Mount Angel?
54.3% of People are in the Labor Force in Mount Angel.
What is the Unemployment Rate in Mount Angel?
Unemployment Rate in Mount Angel is 11.2%.