Zip Codes with the Highest Percentage of Population Employed in Accommodation & Food Services in Portland, OR
RELATED REPORTS & OPTIONS
Accommodation & Food Services
Portland
Compare Zip Codes
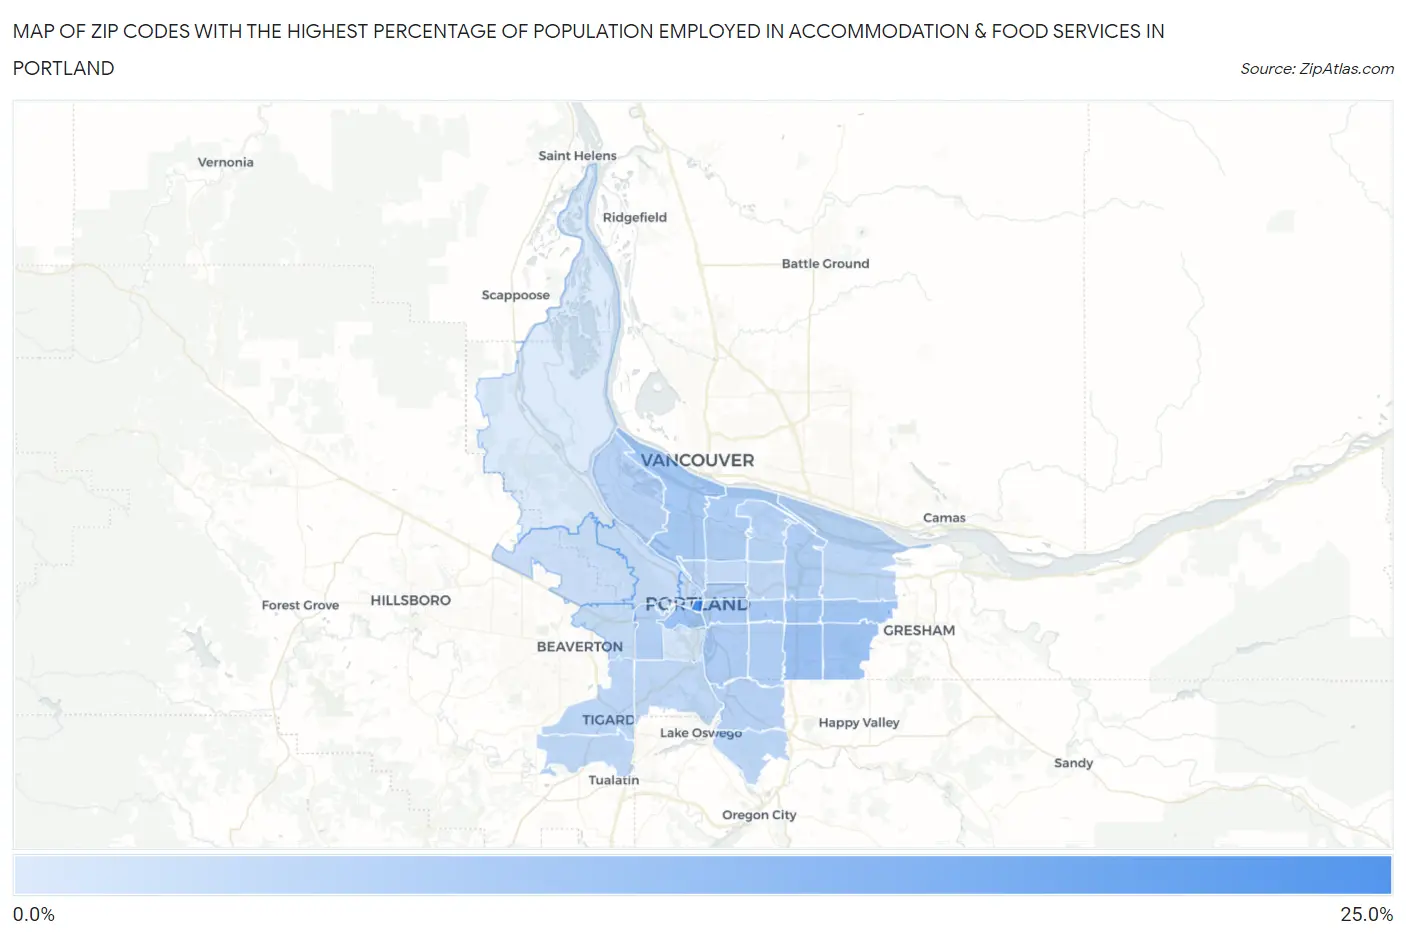
Map of Zip Codes with the Highest Percentage of Population Employed in Accommodation & Food Services in Portland
2.0%
22.6%
Zip Codes with the Highest Percentage of Population Employed in Accommodation & Food Services in Portland, OR
| Zip Code | % Employed | vs State | vs National | |
| 1. | 97204 | 22.6% | 7.2%(+15.4)#12 | 6.9%(+15.7)#642 |
| 2. | 97266 | 10.5% | 7.2%(+3.29)#71 | 6.9%(+3.63)#3,981 |
| 3. | 97201 | 10.0% | 7.2%(+2.81)#77 | 6.9%(+3.16)#4,479 |
| 4. | 97236 | 9.8% | 7.2%(+2.58)#86 | 6.9%(+2.93)#4,785 |
| 5. | 97216 | 9.3% | 7.2%(+2.11)#96 | 6.9%(+2.46)#5,444 |
| 6. | 97233 | 9.3% | 7.2%(+2.10)#97 | 6.9%(+2.45)#5,459 |
| 7. | 97217 | 8.7% | 7.2%(+1.52)#113 | 6.9%(+1.87)#6,398 |
| 8. | 97215 | 8.4% | 7.2%(+1.22)#123 | 6.9%(+1.57)#6,909 |
| 9. | 97214 | 8.2% | 7.2%(+0.962)#129 | 6.9%(+1.31)#7,435 |
| 10. | 97220 | 8.0% | 7.2%(+0.813)#138 | 6.9%(+1.16)#7,748 |
| 11. | 97232 | 8.0% | 7.2%(+0.743)#140 | 6.9%(+1.09)#7,883 |
| 12. | 97202 | 7.9% | 7.2%(+0.696)#143 | 6.9%(+1.04)#7,979 |
| 13. | 97211 | 7.5% | 7.2%(+0.240)#157 | 6.9%(+0.585)#9,068 |
| 14. | 97206 | 7.4% | 7.2%(+0.207)#159 | 6.9%(+0.552)#9,160 |
| 15. | 97221 | 6.9% | 7.2%(-0.325)#177 | 6.9%(+0.020)#10,599 |
| 16. | 97222 | 6.8% | 7.2%(-0.422)#178 | 6.9%(-0.077)#10,874 |
| 17. | 97203 | 6.6% | 7.2%(-0.611)#184 | 6.9%(-0.266)#11,471 |
| 18. | 97227 | 6.6% | 7.2%(-0.663)#187 | 6.9%(-0.318)#11,640 |
| 19. | 97218 | 6.3% | 7.2%(-0.894)#196 | 6.9%(-0.549)#12,373 |
| 20. | 97267 | 6.0% | 7.2%(-1.20)#204 | 6.9%(-0.856)#13,368 |
| 21. | 97230 | 6.0% | 7.2%(-1.27)#209 | 6.9%(-0.921)#13,579 |
| 22. | 97224 | 5.9% | 7.2%(-1.32)#210 | 6.9%(-0.976)#13,753 |
| 23. | 97223 | 5.7% | 7.2%(-1.50)#218 | 6.9%(-1.16)#14,308 |
| 24. | 97205 | 5.6% | 7.2%(-1.66)#231 | 6.9%(-1.32)#14,825 |
| 25. | 97213 | 5.6% | 7.2%(-1.66)#232 | 6.9%(-1.32)#14,834 |
| 26. | 97219 | 5.4% | 7.2%(-1.81)#235 | 6.9%(-1.47)#15,367 |
| 27. | 97209 | 5.0% | 7.2%(-2.23)#249 | 6.9%(-1.88)#16,841 |
| 28. | 97225 | 5.0% | 7.2%(-2.24)#250 | 6.9%(-1.89)#16,864 |
| 29. | 97212 | 4.7% | 7.2%(-2.52)#256 | 6.9%(-2.17)#17,781 |
| 30. | 97210 | 4.7% | 7.2%(-2.54)#257 | 6.9%(-2.20)#17,871 |
| 31. | 97229 | 4.4% | 7.2%(-2.82)#269 | 6.9%(-2.47)#18,799 |
| 32. | 97239 | 3.0% | 7.2%(-4.19)#307 | 6.9%(-3.85)#23,122 |
| 33. | 97231 | 2.0% | 7.2%(-5.27)#331 | 6.9%(-4.93)#25,641 |
1
Common Questions
What are the Top 10 Zip Codes with the Highest Percentage of Population Employed in Accommodation & Food Services in Portland, OR?
Top 10 Zip Codes with the Highest Percentage of Population Employed in Accommodation & Food Services in Portland, OR are:
What zip code has the Highest Percentage of Population Employed in Accommodation & Food Services in Portland, OR?
97204 has the Highest Percentage of Population Employed in Accommodation & Food Services in Portland, OR with 22.6%.
What is the Percentage of Population Employed in Accommodation & Food Services in Portland, OR?
Percentage of Population Employed in Accommodation & Food Services in Portland is 7.2%.
What is the Percentage of Population Employed in Accommodation & Food Services in Oregon?
Percentage of Population Employed in Accommodation & Food Services in Oregon is 7.2%.
What is the Percentage of Population Employed in Accommodation & Food Services in the United States?
Percentage of Population Employed in Accommodation & Food Services in the United States is 6.9%.