Tetherow, OR Map & Demographics
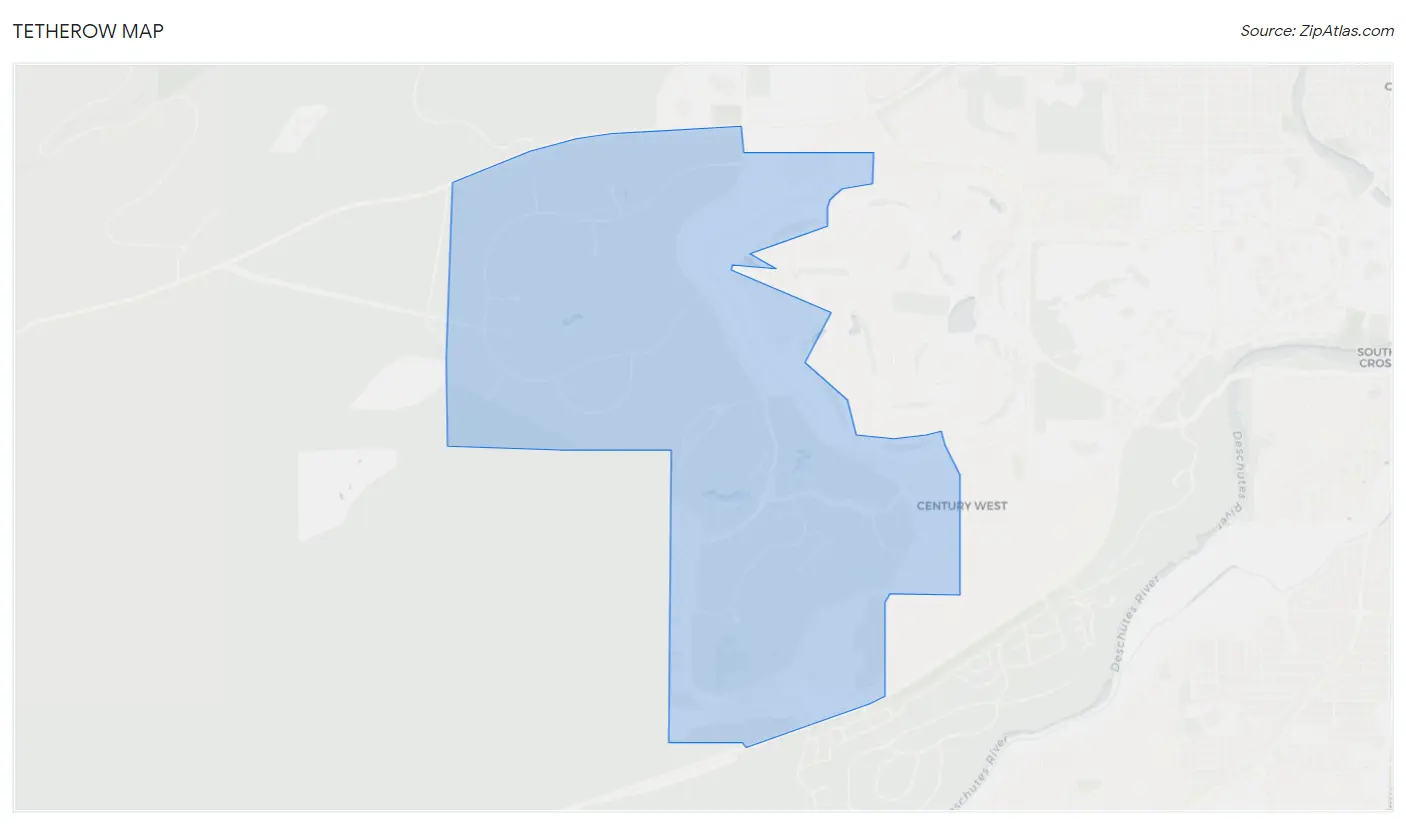
Tetherow Map
Tetherow Overview
$91,444
PER CAPITA INCOME
$195,586
AVG FAMILY INCOME
$195,586
AVG HOUSEHOLD INCOME
1.5%
WAGE / INCOME GAP [ % ]
98.5¢/ $1
WAGE / INCOME GAP [ $ ]
0.35
INEQUALITY / GINI INDEX
716
TOTAL POPULATION
436
MALE POPULATION
280
FEMALE POPULATION
155.71
MALES / 100 FEMALES
64.22
FEMALES / 100 MALES
47.3
MEDIAN AGE
2.6
AVG FAMILY SIZE
2.8
AVG HOUSEHOLD SIZE
290
LABOR FORCE [ PEOPLE ]
53.2%
PERCENT IN LABOR FORCE
5.2%
UNEMPLOYMENT RATE
Income in Tetherow
Income Overview in Tetherow
Per Capita Income in Tetherow is $91,444, while median incomes of families and households are $195,586 and $195,586 respectively.
| Characteristic | Number | Measure |
| Per Capita Income | 716 | $91,444 |
| Median Family Income | 259 | $195,586 |
| Mean Family Income | 259 | $235,516 |
| Median Household Income | 259 | $195,586 |
| Mean Household Income | 259 | $246,753 |
| Income Deficit | 259 | $0 |
| Wage / Income Gap (%) | 716 | 1.47% |
| Wage / Income Gap ($) | 716 | 98.53¢ per $1 |
| Gini / Inequality Index | 716 | 0.35 |
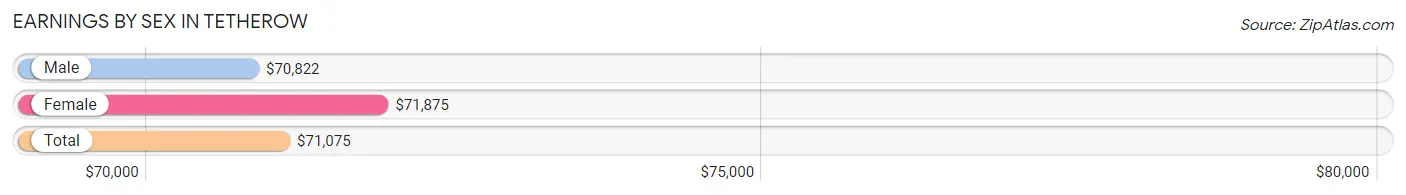
Earnings by Sex in Tetherow
Average Earnings in Tetherow are $71,075, $70,822 for men and $71,875 for women, a difference of 1.5%.
| Sex | Number | Average Earnings |
| Male | 165 (52.4%) | $70,822 |
| Female | 150 (47.6%) | $71,875 |
| Total | 315 (100.0%) | $71,075 |
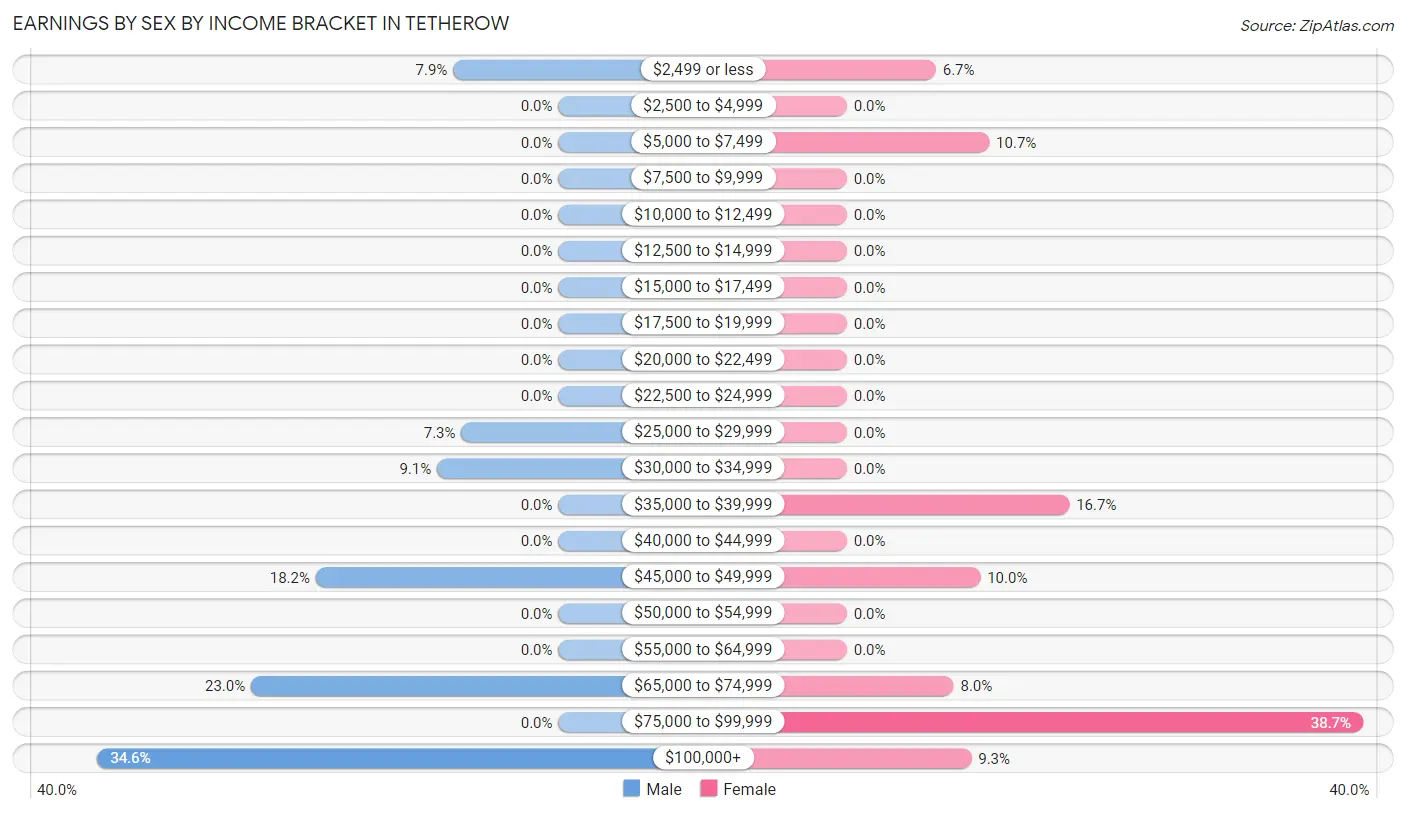
Earnings by Sex by Income Bracket in Tetherow
The most common earnings brackets in Tetherow are $100,000+ for men (57 | 34.5%) and $75,000 to $99,999 for women (58 | 38.7%).
| Income | Male | Female |
| $2,499 or less | 13 (7.9%) | 10 (6.7%) |
| $2,500 to $4,999 | 0 (0.0%) | 0 (0.0%) |
| $5,000 to $7,499 | 0 (0.0%) | 16 (10.7%) |
| $7,500 to $9,999 | 0 (0.0%) | 0 (0.0%) |
| $10,000 to $12,499 | 0 (0.0%) | 0 (0.0%) |
| $12,500 to $14,999 | 0 (0.0%) | 0 (0.0%) |
| $15,000 to $17,499 | 0 (0.0%) | 0 (0.0%) |
| $17,500 to $19,999 | 0 (0.0%) | 0 (0.0%) |
| $20,000 to $22,499 | 0 (0.0%) | 0 (0.0%) |
| $22,500 to $24,999 | 0 (0.0%) | 0 (0.0%) |
| $25,000 to $29,999 | 12 (7.3%) | 0 (0.0%) |
| $30,000 to $34,999 | 15 (9.1%) | 0 (0.0%) |
| $35,000 to $39,999 | 0 (0.0%) | 25 (16.7%) |
| $40,000 to $44,999 | 0 (0.0%) | 0 (0.0%) |
| $45,000 to $49,999 | 30 (18.2%) | 15 (10.0%) |
| $50,000 to $54,999 | 0 (0.0%) | 0 (0.0%) |
| $55,000 to $64,999 | 0 (0.0%) | 0 (0.0%) |
| $65,000 to $74,999 | 38 (23.0%) | 12 (8.0%) |
| $75,000 to $99,999 | 0 (0.0%) | 58 (38.7%) |
| $100,000+ | 57 (34.5%) | 14 (9.3%) |
| Total | 165 (100.0%) | 150 (100.0%) |
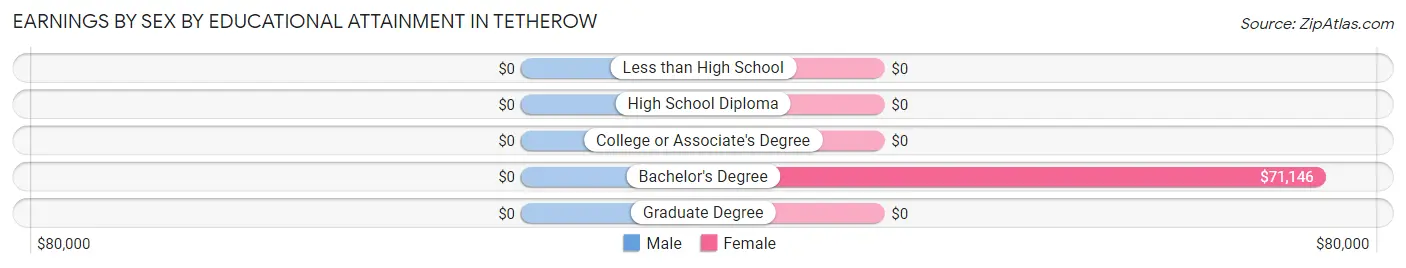
Earnings by Sex by Educational Attainment in Tetherow
| Educational Attainment | Male Income | Female Income |
| Less than High School | - | - |
| High School Diploma | - | - |
| College or Associate's Degree | - | - |
| Bachelor's Degree | - | - |
| Graduate Degree | - | - |
| Total | $70,822 | $82,794 |
Family Income in Tetherow
Family Income Brackets in Tetherow
According to the Tetherow family income data, there are 105 families falling into the $200,000+ income range, which is the most common income bracket and makes up 40.5% of all families.
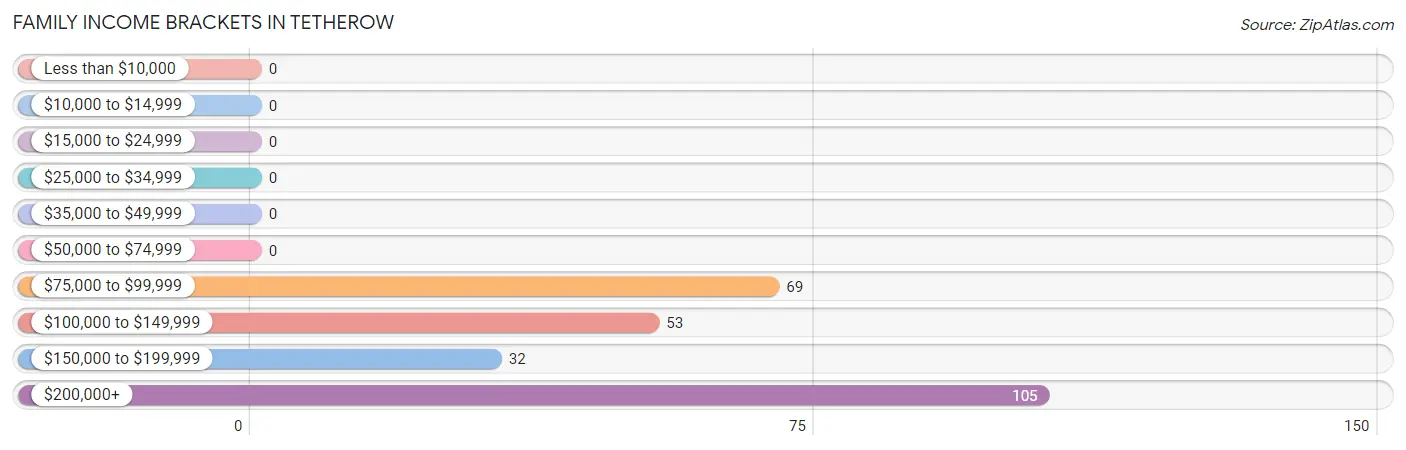
| Income Bracket | # Families | % Families |
| Less than $10,000 | 0 | 0.0% |
| $10,000 to $14,999 | 0 | 0.0% |
| $15,000 to $24,999 | 0 | 0.0% |
| $25,000 to $34,999 | 0 | 0.0% |
| $35,000 to $49,999 | 0 | 0.0% |
| $50,000 to $74,999 | 0 | 0.0% |
| $75,000 to $99,999 | 69 | 26.6% |
| $100,000 to $149,999 | 53 | 20.5% |
| $150,000 to $199,999 | 32 | 12.4% |
| $200,000+ | 105 | 40.5% |
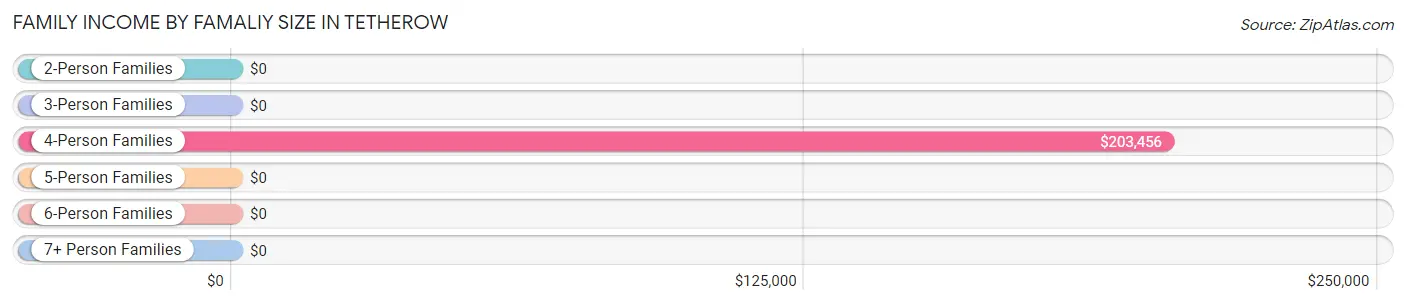
Family Income by Famaliy Size in Tetherow
4-person families (49 | 18.9%) account for the highest median family income in Tetherow with $203,456 per family, while 4-person families (49 | 18.9%) have the highest median income of $50,864 per family member.
| Income Bracket | # Families | Median Income |
| 2-Person Families | 172 (66.4%) | $0 |
| 3-Person Families | 38 (14.7%) | $0 |
| 4-Person Families | 49 (18.9%) | $203,456 |
| 5-Person Families | 0 (0.0%) | $0 |
| 6-Person Families | 0 (0.0%) | $0 |
| 7+ Person Families | 0 (0.0%) | $0 |
| Total | 259 (100.0%) | $195,586 |
Family Income by Number of Earners in Tetherow
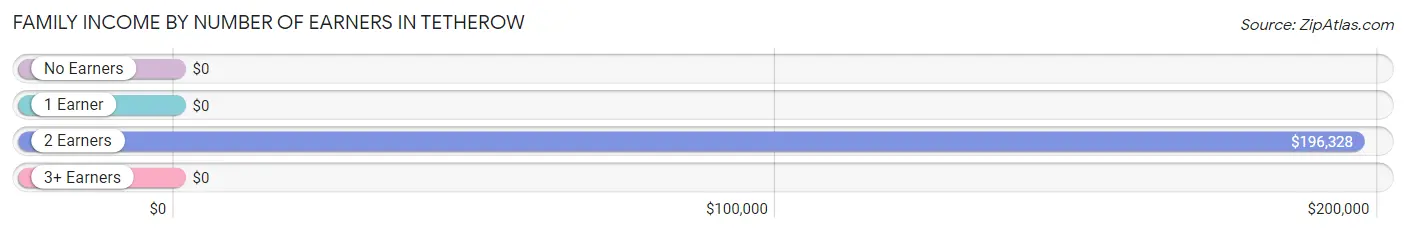
| Number of Earners | # Families | Median Income |
| No Earners | 68 (26.3%) | $0 |
| 1 Earner | 117 (45.2%) | $0 |
| 2 Earners | 64 (24.7%) | $196,328 |
| 3+ Earners | 10 (3.9%) | $0 |
| Total | 259 (100.0%) | $195,586 |
Household Income in Tetherow
Household Income Brackets in Tetherow
With 105 households falling in the category, the $200,000+ income range is the most frequent in Tetherow, accounting for 40.5% of all households.
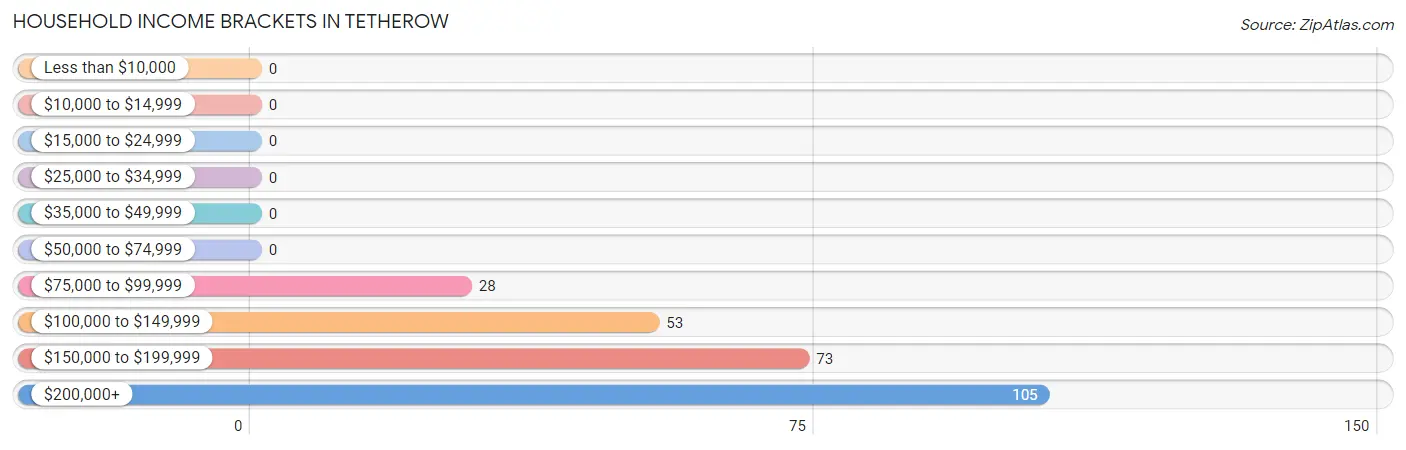
| Income Bracket | # Households | % Households |
| Less than $10,000 | 0 | 0.0% |
| $10,000 to $14,999 | 0 | 0.0% |
| $15,000 to $24,999 | 0 | 0.0% |
| $25,000 to $34,999 | 0 | 0.0% |
| $35,000 to $49,999 | 0 | 0.0% |
| $50,000 to $74,999 | 0 | 0.0% |
| $75,000 to $99,999 | 28 | 10.8% |
| $100,000 to $149,999 | 53 | 20.5% |
| $150,000 to $199,999 | 73 | 28.2% |
| $200,000+ | 105 | 40.5% |
Household Income by Householder Age in Tetherow
The median household income in Tetherow is $195,586, with the highest median household income of $241,146 found in the 65+ years age bracket for the primary householder. A total of 93 households (35.9%) fall into this category.
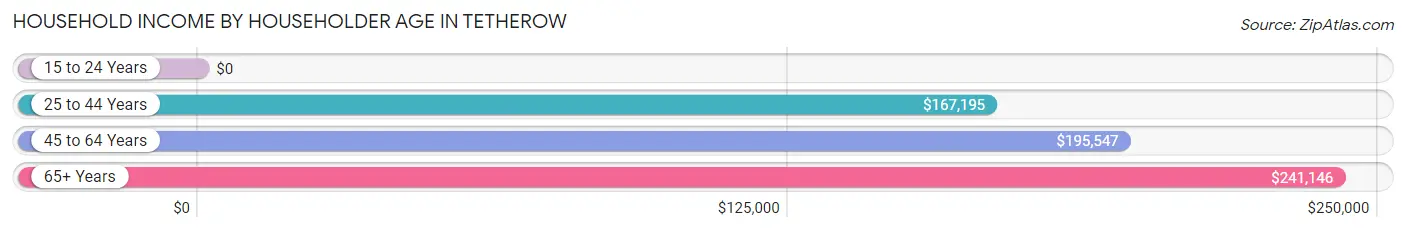
| Income Bracket | # Households | Median Income |
| 15 to 24 Years | 0 (0.0%) | $0 |
| 25 to 44 Years | 72 (27.8%) | $167,195 |
| 45 to 64 Years | 94 (36.3%) | $195,547 |
| 65+ Years | 93 (35.9%) | $241,146 |
| Total | 259 (100.0%) | $195,586 |
Poverty in Tetherow
Income Below Poverty by Sex and Age in Tetherow
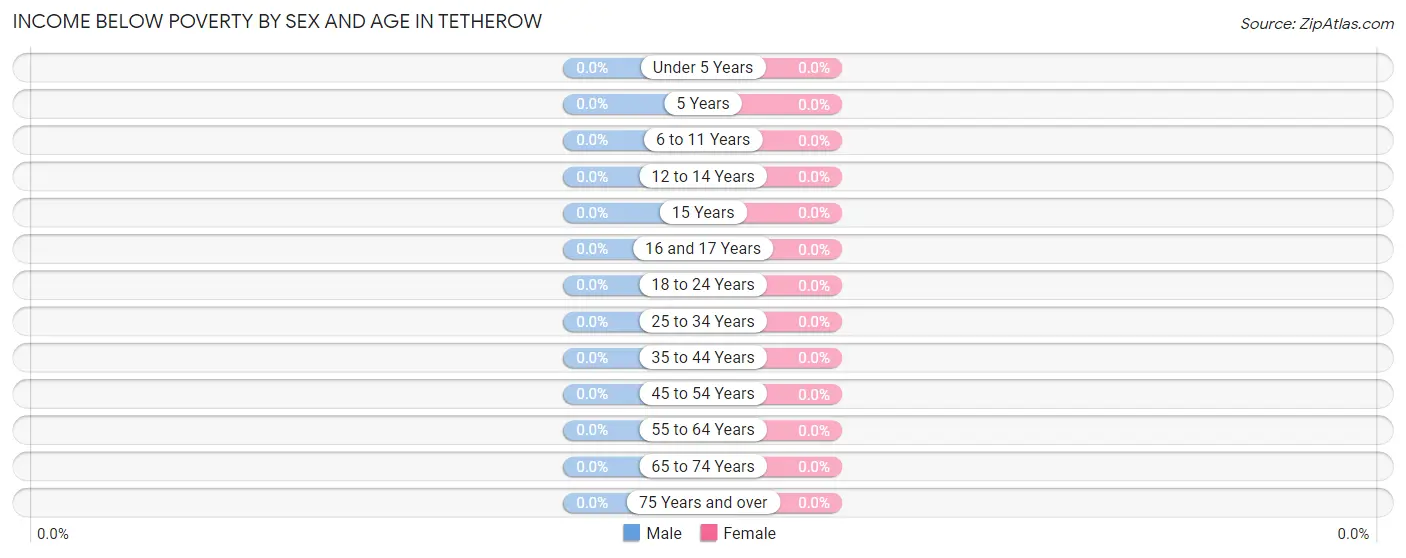
| Age Bracket | Male | Female |
| Under 5 Years | 0 (0.0%) | 0 (0.0%) |
| 5 Years | 0 (0.0%) | 0 (0.0%) |
| 6 to 11 Years | 0 (0.0%) | 0 (0.0%) |
| 12 to 14 Years | 0 (0.0%) | 0 (0.0%) |
| 15 Years | 0 (0.0%) | 0 (0.0%) |
| 16 and 17 Years | 0 (0.0%) | 0 (0.0%) |
| 18 to 24 Years | 0 (0.0%) | 0 (0.0%) |
| 25 to 34 Years | 0 (0.0%) | 0 (0.0%) |
| 35 to 44 Years | 0 (0.0%) | 0 (0.0%) |
| 45 to 54 Years | 0 (0.0%) | 0 (0.0%) |
| 55 to 64 Years | 0 (0.0%) | 0 (0.0%) |
| 65 to 74 Years | 0 (0.0%) | 0 (0.0%) |
| 75 Years and over | 0 (0.0%) | 0 (0.0%) |
| Total | 0 (0.0%) | 0 (0.0%) |
Income Above Poverty by Sex and Age in Tetherow
According to the poverty statistics in Tetherow, males aged 6 to 11 years and females aged 12 to 14 years are the age groups that are most secure financially, with 100.0% of males and 100.0% of females in these age groups living above the poverty line.
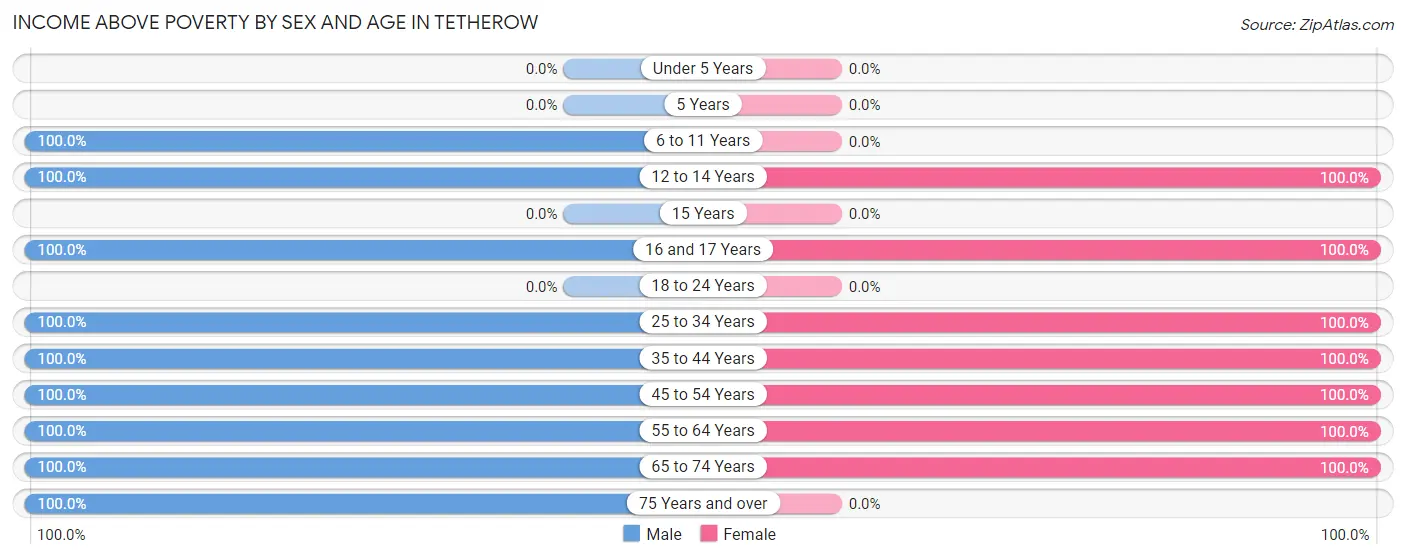
| Age Bracket | Male | Female |
| Under 5 Years | 0 (0.0%) | 0 (0.0%) |
| 5 Years | 0 (0.0%) | 0 (0.0%) |
| 6 to 11 Years | 121 (100.0%) | 0 (0.0%) |
| 12 to 14 Years | 38 (100.0%) | 12 (100.0%) |
| 15 Years | 0 (0.0%) | 0 (0.0%) |
| 16 and 17 Years | 15 (100.0%) | 10 (100.0%) |
| 18 to 24 Years | 0 (0.0%) | 0 (0.0%) |
| 25 to 34 Years | 38 (100.0%) | 41 (100.0%) |
| 35 to 44 Years | 29 (100.0%) | 33 (100.0%) |
| 45 to 54 Years | 75 (100.0%) | 67 (100.0%) |
| 55 to 64 Years | 25 (100.0%) | 41 (100.0%) |
| 65 to 74 Years | 81 (100.0%) | 76 (100.0%) |
| 75 Years and over | 14 (100.0%) | 0 (0.0%) |
| Total | 436 (100.0%) | 280 (100.0%) |
Income Below Poverty Among Married-Couple Families in Tetherow
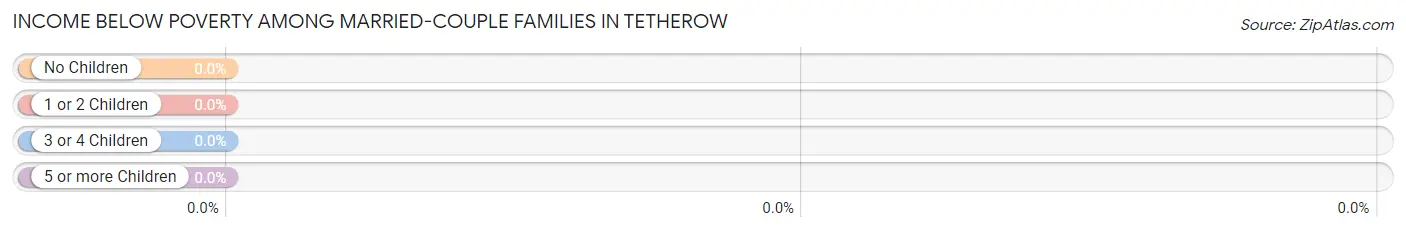
| Children | Above Poverty | Below Poverty |
| No Children | 131 (100.0%) | 0 (0.0%) |
| 1 or 2 Children | 87 (100.0%) | 0 (0.0%) |
| 3 or 4 Children | 0 (0.0%) | 0 (0.0%) |
| 5 or more Children | 0 (0.0%) | 0 (0.0%) |
| Total | 218 (100.0%) | 0 (0.0%) |
Income Below Poverty Among Single-Parent Households in Tetherow
| Children | Single Father | Single Mother |
| No Children | 0 (0.0%) | 0 (0.0%) |
| 1 or 2 Children | 0 (0.0%) | 0 (0.0%) |
| 3 or 4 Children | 0 (0.0%) | 0 (0.0%) |
| 5 or more Children | 0 (0.0%) | 0 (0.0%) |
| Total | 0 (0.0%) | 0 (0.0%) |
Income Below Poverty Among Married-Couple vs Single-Parent Households in Tetherow
| Children | Married-Couple Families | Single-Parent Households |
| No Children | 0 (0.0%) | 0 (0.0%) |
| 1 or 2 Children | 0 (0.0%) | 0 (0.0%) |
| 3 or 4 Children | 0 (0.0%) | 0 (0.0%) |
| 5 or more Children | 0 (0.0%) | 0 (0.0%) |
| Total | 0 (0.0%) | 0 (0.0%) |
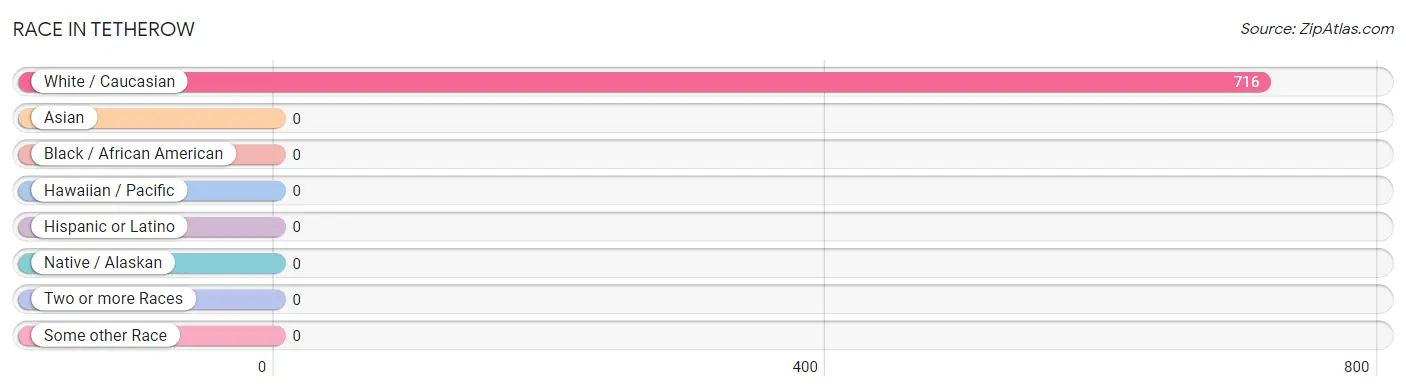
Race in Tetherow
The most populous races in Tetherow are , and White / Caucasian (716 | 100.0%).
| Race | # Population | % Population |
| Asian | 0 | 0.0% |
| Black / African American | 0 | 0.0% |
| Hawaiian / Pacific | 0 | 0.0% |
| Hispanic or Latino | 0 | 0.0% |
| Native / Alaskan | 0 | 0.0% |
| White / Caucasian | 716 | 100.0% |
| Two or more Races | 0 | 0.0% |
| Some other Race | 0 | 0.0% |
| Total | 716 | 100.0% |
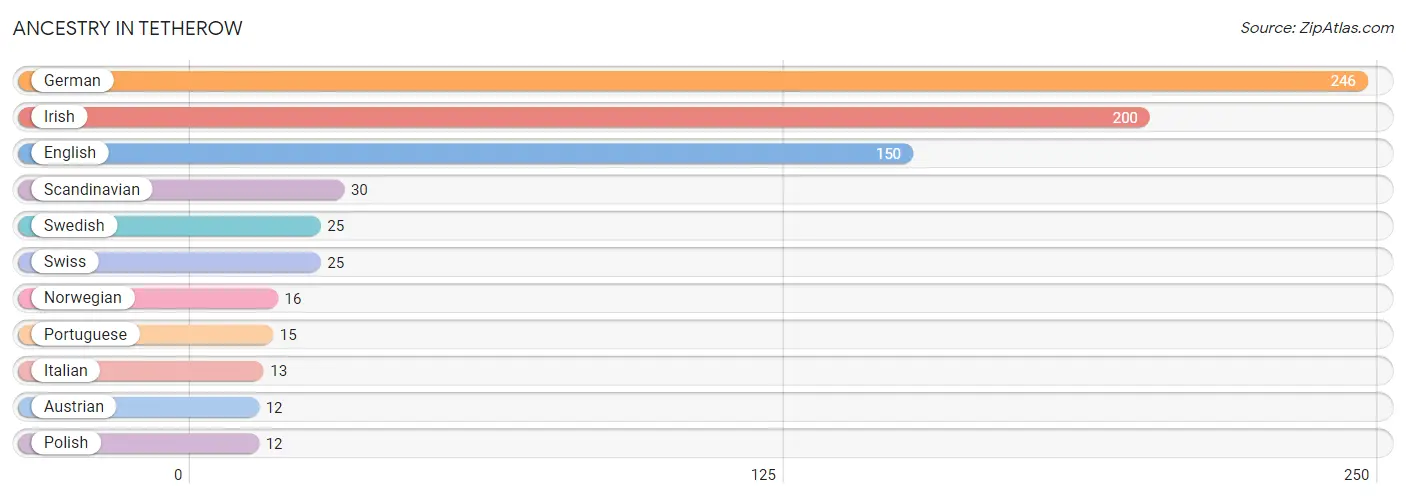
Ancestry in Tetherow
The most populous ancestries reported in Tetherow are German (246 | 34.4%), Irish (200 | 27.9%), English (150 | 20.9%), Scandinavian (30 | 4.2%), and Swedish (25 | 3.5%), together accounting for 90.9% of all Tetherow residents.
| Ancestry | # Population | % Population |
| Austrian | 12 | 1.7% |
| English | 150 | 20.9% |
| German | 246 | 34.4% |
| Irish | 200 | 27.9% |
| Italian | 13 | 1.8% |
| Norwegian | 16 | 2.2% |
| Polish | 12 | 1.7% |
| Portuguese | 15 | 2.1% |
| Scandinavian | 30 | 4.2% |
| Swedish | 25 | 3.5% |
| Swiss | 25 | 3.5% | View All 11 Rows |
Immigrants in Tetherow
The most numerous immigrant groups reported in Tetherow came from Europe (79 | 11.0%), Northern Europe (41 | 5.7%), Western Europe (38 | 5.3%), Sweden (25 | 3.5%), and Switzerland (25 | 3.5%), together accounting for 29.0% of all Tetherow residents.
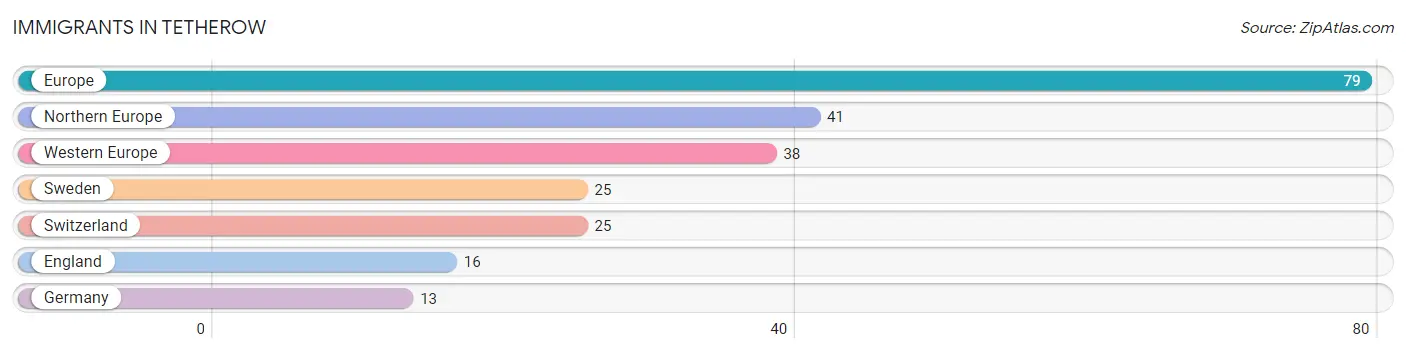
| Immigration Origin | # Population | % Population |
| England | 16 | 2.2% |
| Europe | 79 | 11.0% |
| Germany | 13 | 1.8% |
| Northern Europe | 41 | 5.7% |
| Sweden | 25 | 3.5% |
| Switzerland | 25 | 3.5% |
| Western Europe | 38 | 5.3% | View All 7 Rows |
Sex and Age in Tetherow
Sex and Age in Tetherow
The most populous age groups in Tetherow are 10 to 14 Years (95 | 21.8%) for men and 65 to 69 Years (52 | 18.6%) for women.
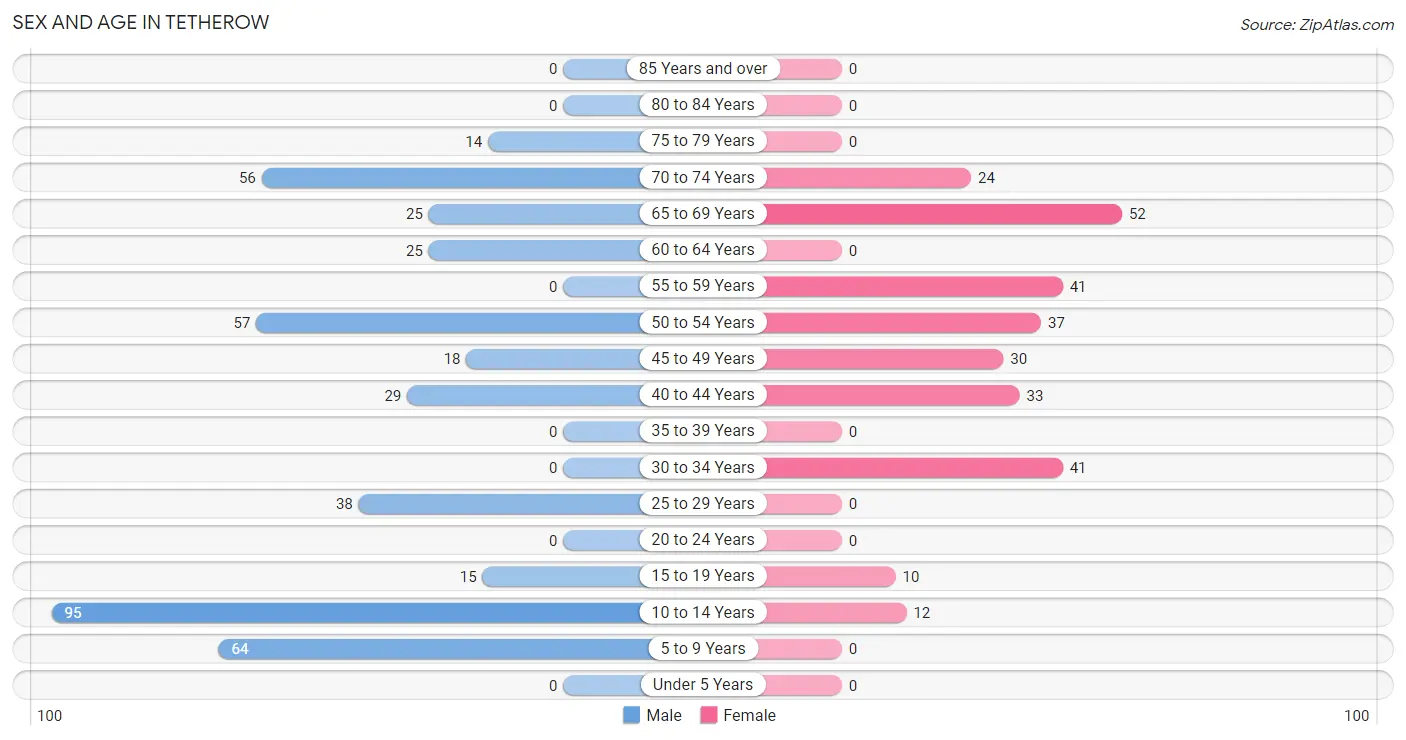
| Age Bracket | Male | Female |
| Under 5 Years | 0 (0.0%) | 0 (0.0%) |
| 5 to 9 Years | 64 (14.7%) | 0 (0.0%) |
| 10 to 14 Years | 95 (21.8%) | 12 (4.3%) |
| 15 to 19 Years | 15 (3.4%) | 10 (3.6%) |
| 20 to 24 Years | 0 (0.0%) | 0 (0.0%) |
| 25 to 29 Years | 38 (8.7%) | 0 (0.0%) |
| 30 to 34 Years | 0 (0.0%) | 41 (14.6%) |
| 35 to 39 Years | 0 (0.0%) | 0 (0.0%) |
| 40 to 44 Years | 29 (6.7%) | 33 (11.8%) |
| 45 to 49 Years | 18 (4.1%) | 30 (10.7%) |
| 50 to 54 Years | 57 (13.1%) | 37 (13.2%) |
| 55 to 59 Years | 0 (0.0%) | 41 (14.6%) |
| 60 to 64 Years | 25 (5.7%) | 0 (0.0%) |
| 65 to 69 Years | 25 (5.7%) | 52 (18.6%) |
| 70 to 74 Years | 56 (12.8%) | 24 (8.6%) |
| 75 to 79 Years | 14 (3.2%) | 0 (0.0%) |
| 80 to 84 Years | 0 (0.0%) | 0 (0.0%) |
| 85 Years and over | 0 (0.0%) | 0 (0.0%) |
| Total | 436 (100.0%) | 280 (100.0%) |
Families and Households in Tetherow
Median Family Size in Tetherow
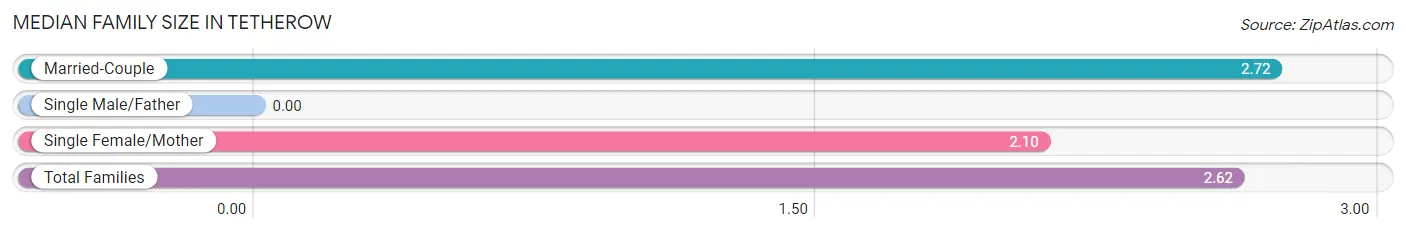
| Family Type | # Families | Family Size |
| Married-Couple | 218 (84.2%) | 2.72 |
| Single Male/Father | 0 (0.0%) | - |
| Single Female/Mother | 41 (15.8%) | 2.10 |
| Total Families | 259 (100.0%) | 2.62 |
Median Household Size in Tetherow
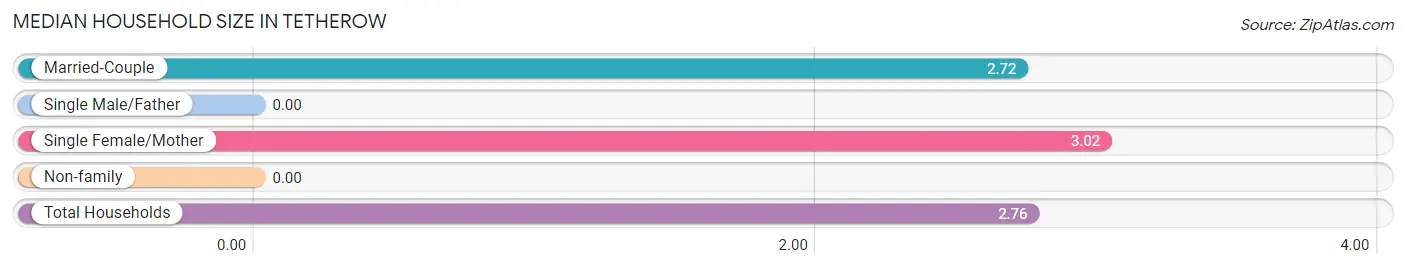
| Household Type | # Households | Household Size |
| Married-Couple | 218 (84.2%) | 2.72 |
| Single Male/Father | 0 (0.0%) | - |
| Single Female/Mother | 41 (15.8%) | 3.02 |
| Non-family | 0 (0.0%) | - |
| Total Households | 259 (100.0%) | 2.76 |
Household Size by Marriage Status in Tetherow
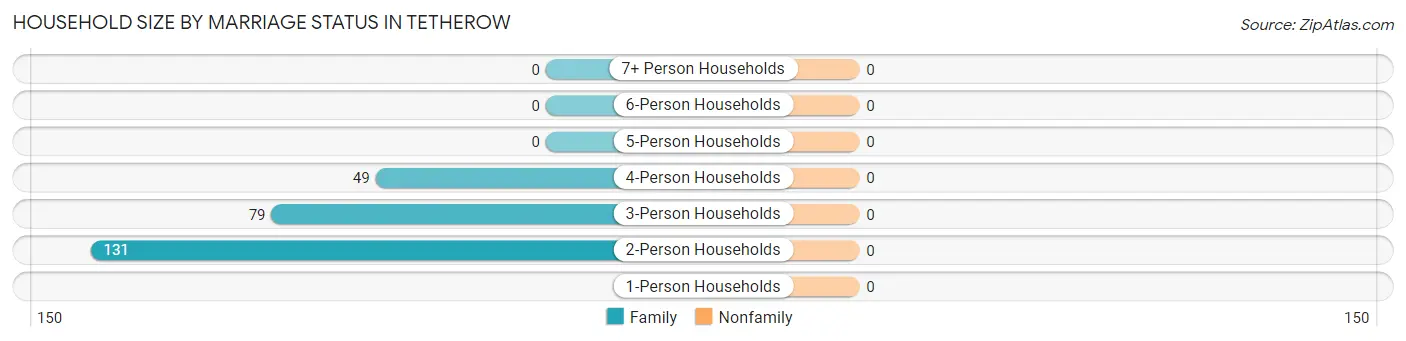
| Household Size | Family Households | Nonfamily Households |
| 1-Person Households | - | 0 (0.0%) |
| 2-Person Households | 131 (50.6%) | 0 (0.0%) |
| 3-Person Households | 79 (30.5%) | 0 (0.0%) |
| 4-Person Households | 49 (18.9%) | 0 (0.0%) |
| 5-Person Households | 0 (0.0%) | 0 (0.0%) |
| 6-Person Households | 0 (0.0%) | 0 (0.0%) |
| 7+ Person Households | 0 (0.0%) | 0 (0.0%) |
| Total | 259 (100.0%) | 0 (0.0%) |
Female Fertility in Tetherow
Fertility by Age in Tetherow
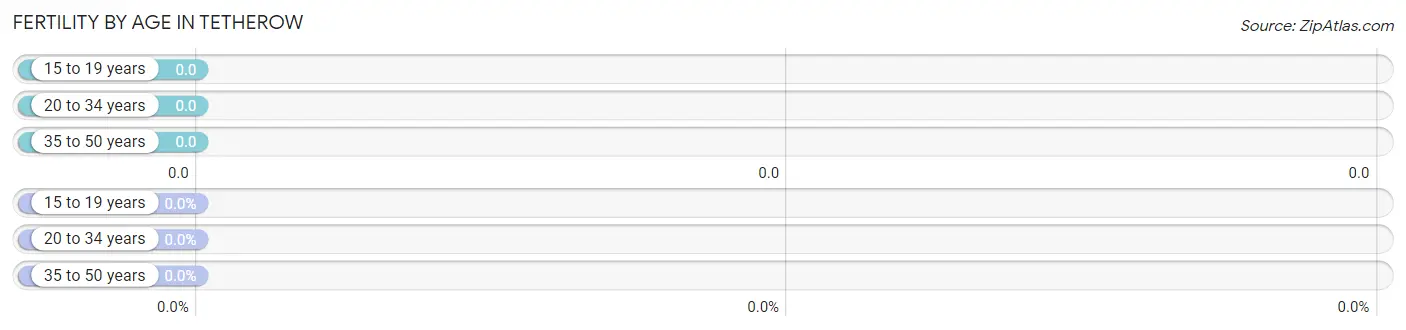
| Age Bracket | Women with Births | Births / 1,000 Women |
| 15 to 19 years | 0 (0.0%) | 0.0 |
| 20 to 34 years | 0 (0.0%) | 0.0 |
| 35 to 50 years | 0 (0.0%) | 0.0 |
| Total | 0 (0.0%) | 0.0 |
Fertility by Age by Marriage Status in Tetherow
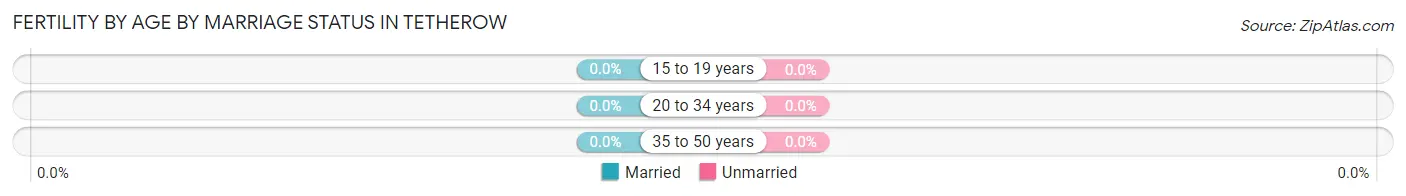
| Age Bracket | Married | Unmarried |
| 15 to 19 years | 0 (0.0%) | 0 (0.0%) |
| 20 to 34 years | 0 (0.0%) | 0 (0.0%) |
| 35 to 50 years | 0 (0.0%) | 0 (0.0%) |
| Total | 0 (0.0%) | 0 (0.0%) |
Fertility by Education in Tetherow
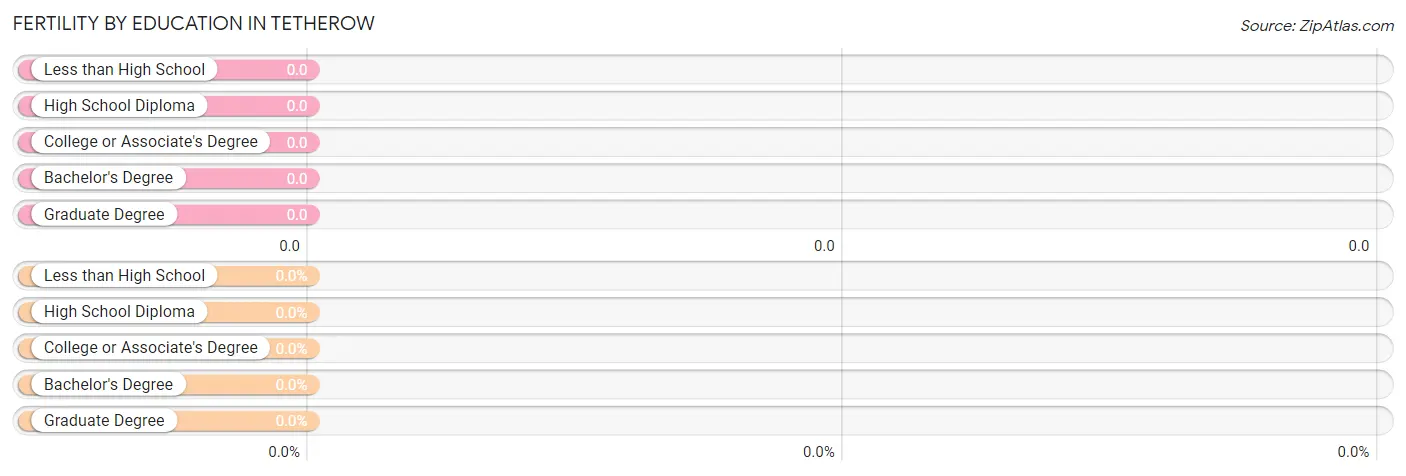
| Educational Attainment | Women with Births | Births / 1,000 Women |
| Less than High School | 0 (0.0%) | 0.0 |
| High School Diploma | 0 (0.0%) | 0.0 |
| College or Associate's Degree | 0 (0.0%) | 0.0 |
| Bachelor's Degree | 0 (0.0%) | 0.0 |
| Graduate Degree | 0 (0.0%) | 0.0 |
| Total | 0 (0.0%) | 0.0 |
Fertility by Education by Marriage Status in Tetherow
| Educational Attainment | Married | Unmarried |
| Less than High School | 0 (0.0%) | 0 (0.0%) |
| High School Diploma | 0 (0.0%) | 0 (0.0%) |
| College or Associate's Degree | 0 (0.0%) | 0 (0.0%) |
| Bachelor's Degree | 0 (0.0%) | 0 (0.0%) |
| Graduate Degree | 0 (0.0%) | 0 (0.0%) |
| Total | 0 (0.0%) | 0 (0.0%) |
Employment Characteristics in Tetherow
Employment by Class of Employer in Tetherow
Among the 257 employed individuals in Tetherow, private company employees (128 | 49.8%), self-employed (incorporated) (39 | 15.2%), and not-for-profit organizations (33 | 12.8%) make up the most common classes of employment.
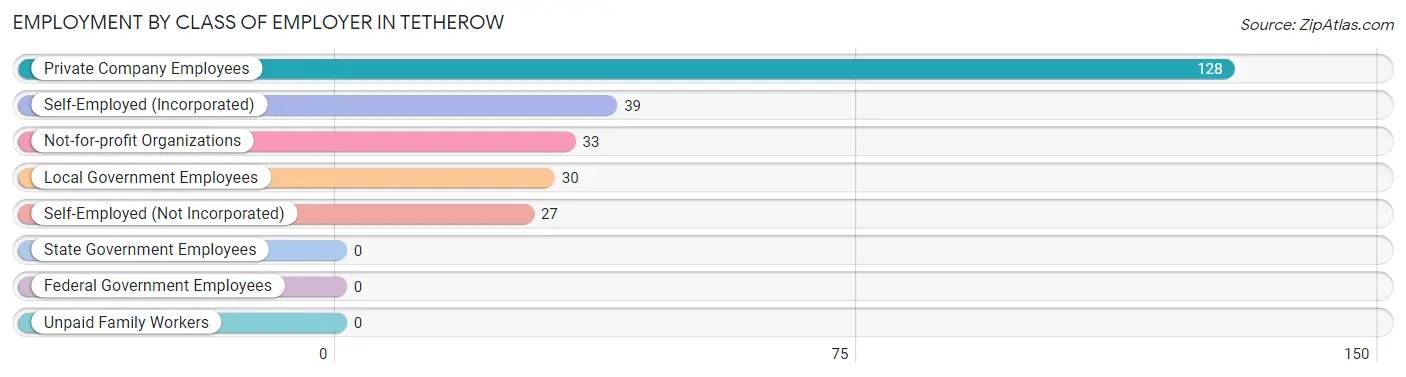
| Employer Class | # Employees | % Employees |
| Private Company Employees | 128 | 49.8% |
| Self-Employed (Incorporated) | 39 | 15.2% |
| Self-Employed (Not Incorporated) | 27 | 10.5% |
| Not-for-profit Organizations | 33 | 12.8% |
| Local Government Employees | 30 | 11.7% |
| State Government Employees | 0 | 0.0% |
| Federal Government Employees | 0 | 0.0% |
| Unpaid Family Workers | 0 | 0.0% |
| Total | 257 | 100.0% |
Employment Status by Age in Tetherow
According to the labor force statistics for Tetherow, out of the total population over 16 years of age (545), 53.2% or 290 individuals are in the labor force, with 5.2% or 15 of them unemployed. The age group with the highest labor force participation rate is 25 to 29 years, with 100.0% or 38 individuals in the labor force. Within the labor force, the 45 to 54 years age range has the highest percentage of unemployed individuals, with 12.9% or 15 of them being unemployed.
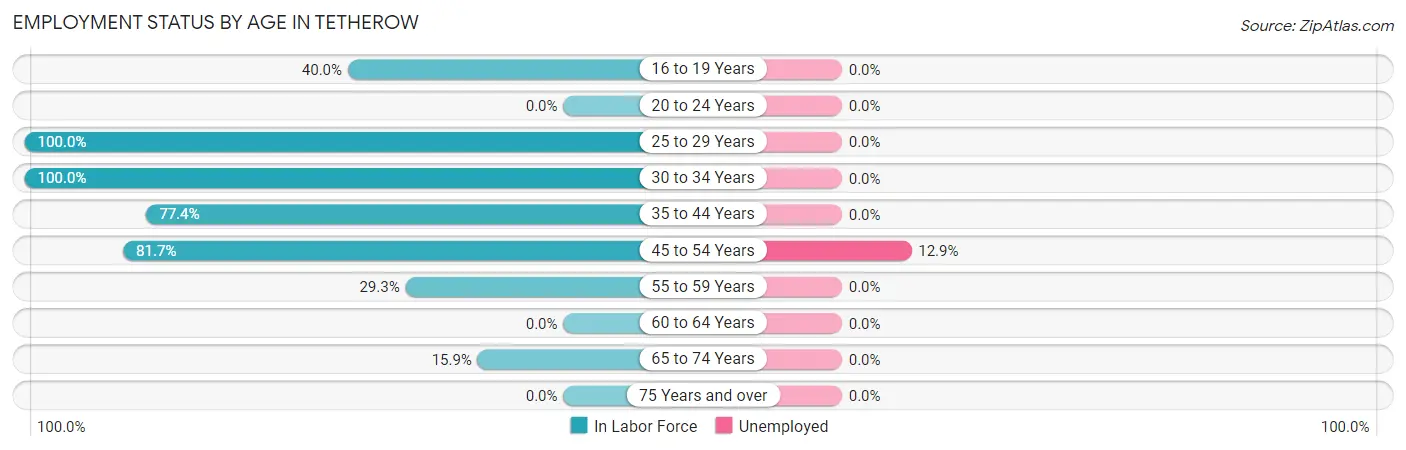
| Age Bracket | In Labor Force | Unemployed |
| 16 to 19 Years | 10 (40.0%) | 0 (0.0%) |
| 20 to 24 Years | 0 (0.0%) | 0 (0.0%) |
| 25 to 29 Years | 38 (100.0%) | 0 (0.0%) |
| 30 to 34 Years | 41 (100.0%) | 0 (0.0%) |
| 35 to 44 Years | 48 (77.4%) | 0 (0.0%) |
| 45 to 54 Years | 116 (81.7%) | 15 (12.9%) |
| 55 to 59 Years | 12 (29.3%) | 0 (0.0%) |
| 60 to 64 Years | 0 (0.0%) | 0 (0.0%) |
| 65 to 74 Years | 25 (15.9%) | 0 (0.0%) |
| 75 Years and over | 0 (0.0%) | 0 (0.0%) |
| Total | 290 (53.2%) | 15 (5.2%) |
Employment Status by Educational Attainment in Tetherow
According to labor force statistics for Tetherow, 73.1% of individuals (255) out of the total population between 25 and 64 years of age (349) are in the labor force, with 5.9% or 15 of them being unemployed. The group with the highest labor force participation rate are those with the educational attainment of less than high school, with 100.0% or 18 individuals in the labor force. Within the labor force, individuals with college / associate degree education have the highest percentage of unemployment, with 16.0% or 15 of them being unemployed.
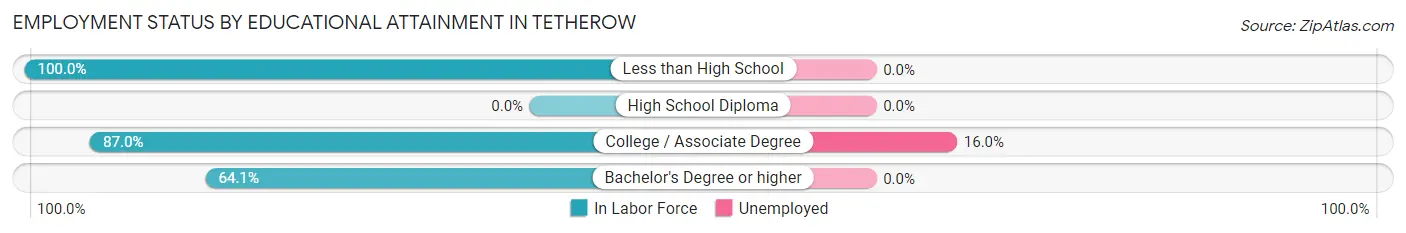
| Educational Attainment | In Labor Force | Unemployed |
| Less than High School | 18 (100.0%) | 0 (0.0%) |
| High School Diploma | 0 (0.0%) | 0 (0.0%) |
| College / Associate Degree | 94 (87.0%) | 17 (16.0%) |
| Bachelor's Degree or higher | 143 (64.1%) | 0 (0.0%) |
| Total | 255 (73.1%) | 21 (5.9%) |
Employment Occupations by Sex in Tetherow
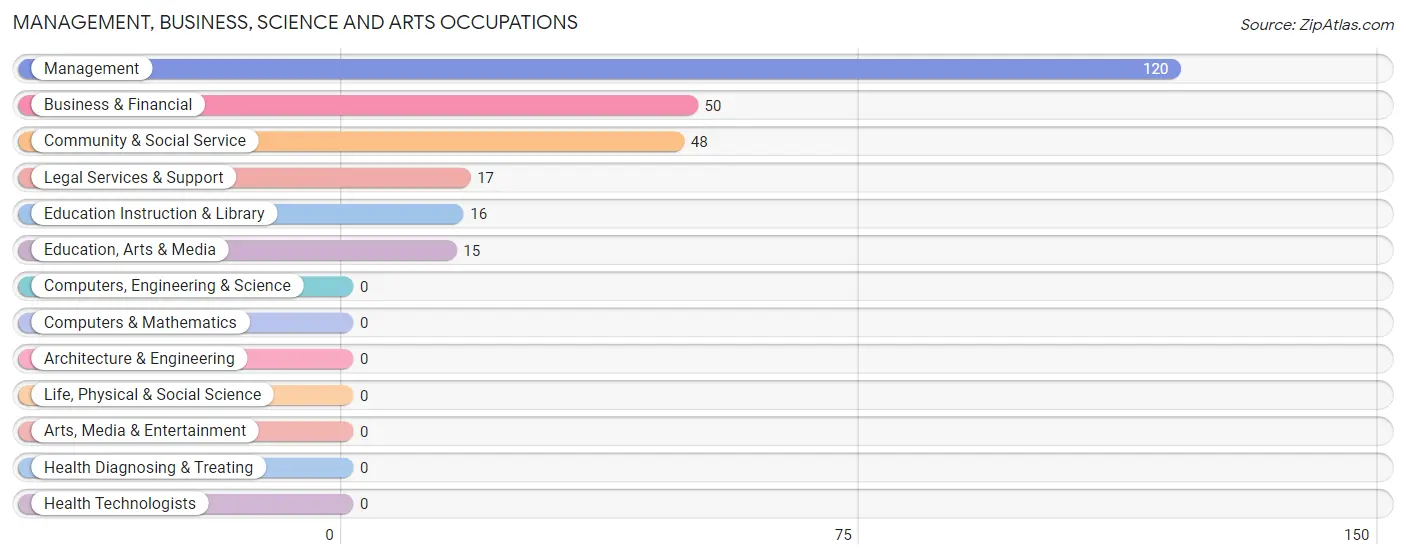
Management, Business, Science and Arts Occupations
The most common Management, Business, Science and Arts occupations in Tetherow are Management (120 | 43.6%), Business & Financial (50 | 18.2%), Community & Social Service (48 | 17.4%), Legal Services & Support (17 | 6.2%), and Education Instruction & Library (16 | 5.8%).
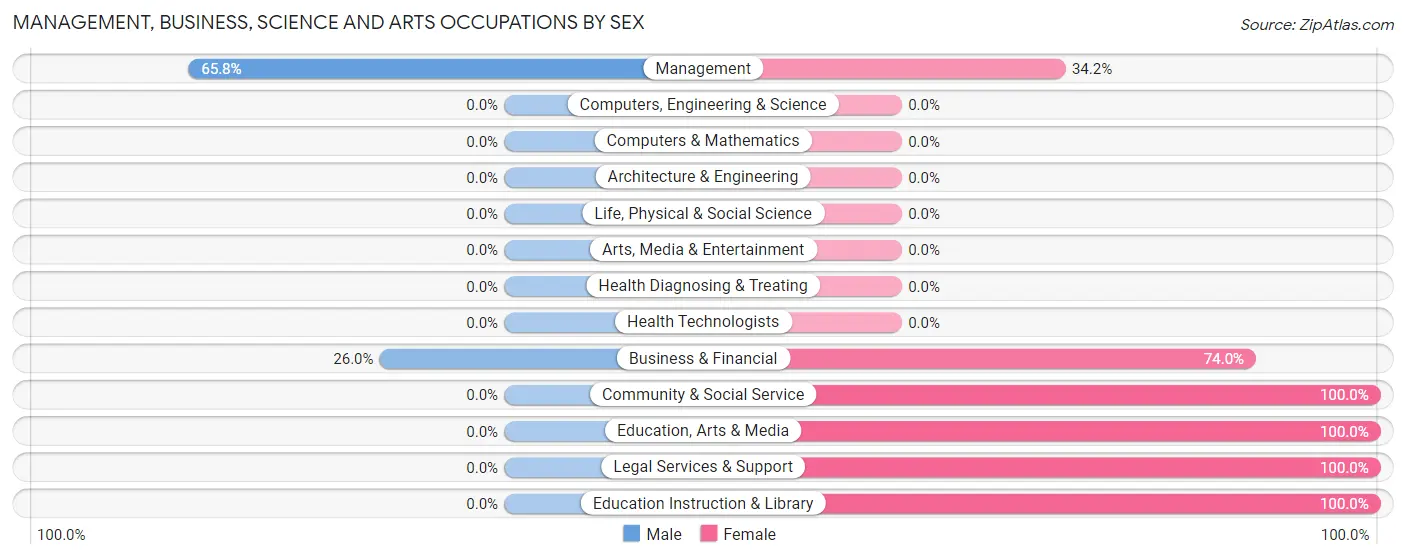
Management, Business, Science and Arts Occupations by Sex
Within the Management, Business, Science and Arts occupations in Tetherow, the most male-oriented occupations are Management (65.8%), and Business & Financial (26.0%), while the most female-oriented occupations are Community & Social Service (100.0%), Education, Arts & Media (100.0%), and Legal Services & Support (100.0%).
| Occupation | Male | Female |
| Management | 79 (65.8%) | 41 (34.2%) |
| Business & Financial | 13 (26.0%) | 37 (74.0%) |
| Computers, Engineering & Science | 0 (0.0%) | 0 (0.0%) |
| Computers & Mathematics | 0 (0.0%) | 0 (0.0%) |
| Architecture & Engineering | 0 (0.0%) | 0 (0.0%) |
| Life, Physical & Social Science | 0 (0.0%) | 0 (0.0%) |
| Community & Social Service | 0 (0.0%) | 48 (100.0%) |
| Education, Arts & Media | 0 (0.0%) | 15 (100.0%) |
| Legal Services & Support | 0 (0.0%) | 17 (100.0%) |
| Education Instruction & Library | 0 (0.0%) | 16 (100.0%) |
| Arts, Media & Entertainment | 0 (0.0%) | 0 (0.0%) |
| Health Diagnosing & Treating | 0 (0.0%) | 0 (0.0%) |
| Health Technologists | 0 (0.0%) | 0 (0.0%) |
| Total (Category) | 92 (42.2%) | 126 (57.8%) |
| Total (Overall) | 125 (45.5%) | 150 (54.5%) |
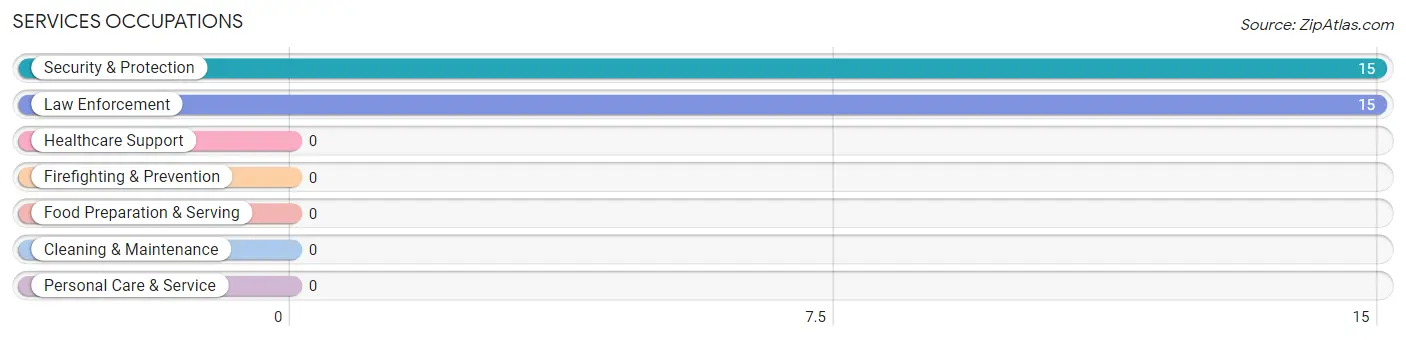
Services Occupations
The most common Services occupations in Tetherow are Security & Protection (15 | 5.4%), and Law Enforcement (15 | 5.4%).
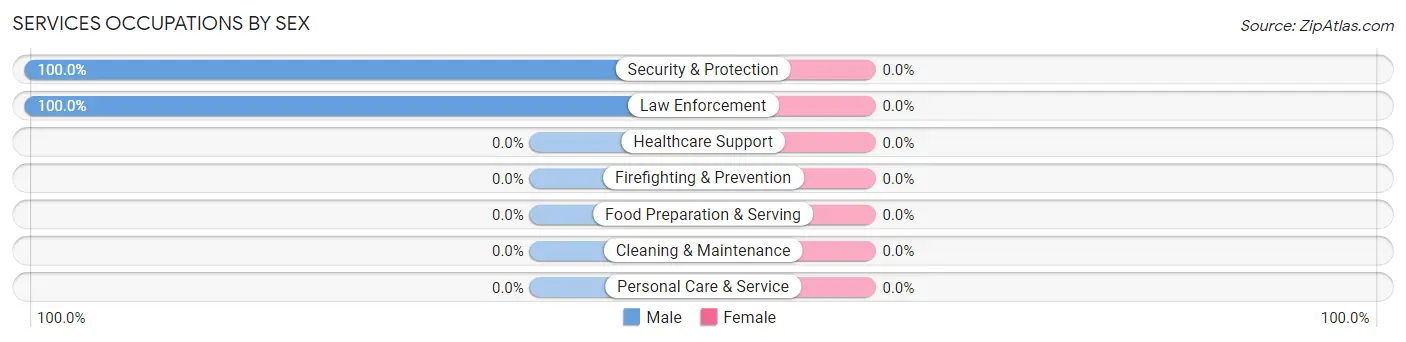
Services Occupations by Sex
| Occupation | Male | Female |
| Healthcare Support | 0 (0.0%) | 0 (0.0%) |
| Security & Protection | 15 (100.0%) | 0 (0.0%) |
| Firefighting & Prevention | 0 (0.0%) | 0 (0.0%) |
| Law Enforcement | 15 (100.0%) | 0 (0.0%) |
| Food Preparation & Serving | 0 (0.0%) | 0 (0.0%) |
| Cleaning & Maintenance | 0 (0.0%) | 0 (0.0%) |
| Personal Care & Service | 0 (0.0%) | 0 (0.0%) |
| Total (Category) | 15 (100.0%) | 0 (0.0%) |
| Total (Overall) | 125 (45.5%) | 150 (54.5%) |
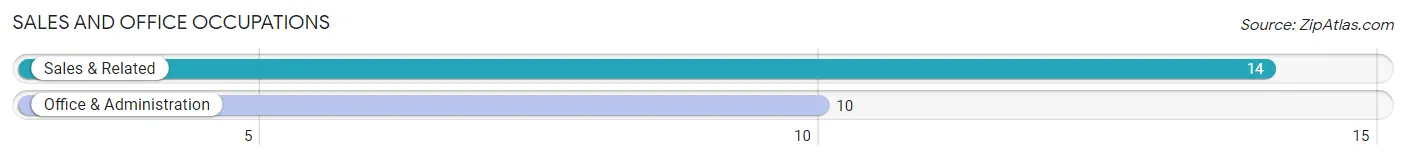
Sales and Office Occupations
The most common Sales and Office occupations in Tetherow are Sales & Related (14 | 5.1%), and Office & Administration (10 | 3.6%).
Sales and Office Occupations by Sex
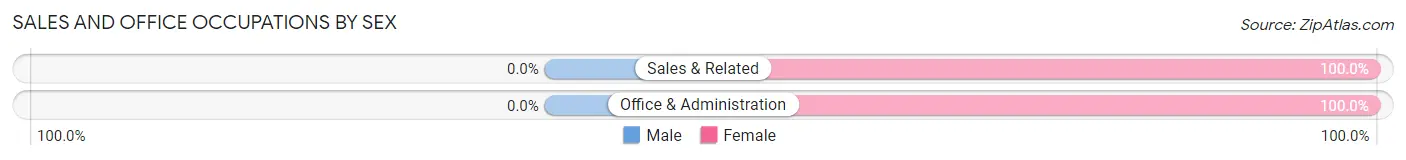
| Occupation | Male | Female |
| Sales & Related | 0 (0.0%) | 14 (100.0%) |
| Office & Administration | 0 (0.0%) | 10 (100.0%) |
| Total (Category) | 0 (0.0%) | 24 (100.0%) |
| Total (Overall) | 125 (45.5%) | 150 (54.5%) |
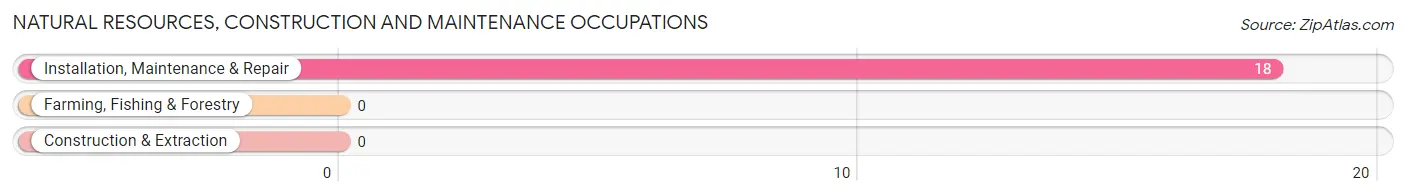
Natural Resources, Construction and Maintenance Occupations
The most common Natural Resources, Construction and Maintenance occupations in Tetherow are , and Installation, Maintenance & Repair (18 | 6.6%).
Natural Resources, Construction and Maintenance Occupations by Sex
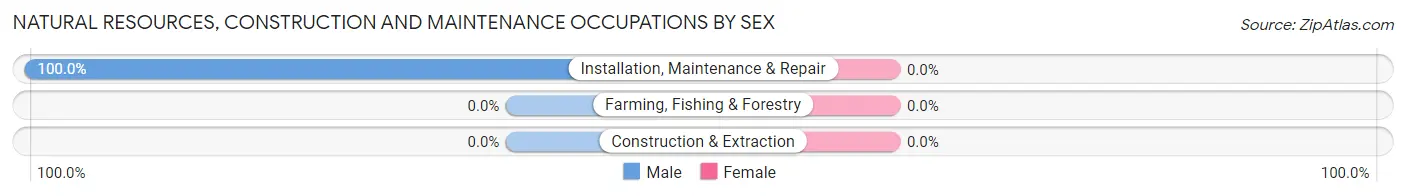
| Occupation | Male | Female |
| Farming, Fishing & Forestry | 0 (0.0%) | 0 (0.0%) |
| Construction & Extraction | 0 (0.0%) | 0 (0.0%) |
| Installation, Maintenance & Repair | 18 (100.0%) | 0 (0.0%) |
| Total (Category) | 18 (100.0%) | 0 (0.0%) |
| Total (Overall) | 125 (45.5%) | 150 (54.5%) |
Production, Transportation and Moving Occupations
Production, Transportation and Moving Occupations by Sex
| Occupation | Male | Female |
| Production | 0 (0.0%) | 0 (0.0%) |
| Transportation | 0 (0.0%) | 0 (0.0%) |
| Material Moving | 0 (0.0%) | 0 (0.0%) |
| Total (Category) | 0 (0.0%) | 0 (0.0%) |
| Total (Overall) | 125 (45.5%) | 150 (54.5%) |
Employment Industries by Sex in Tetherow
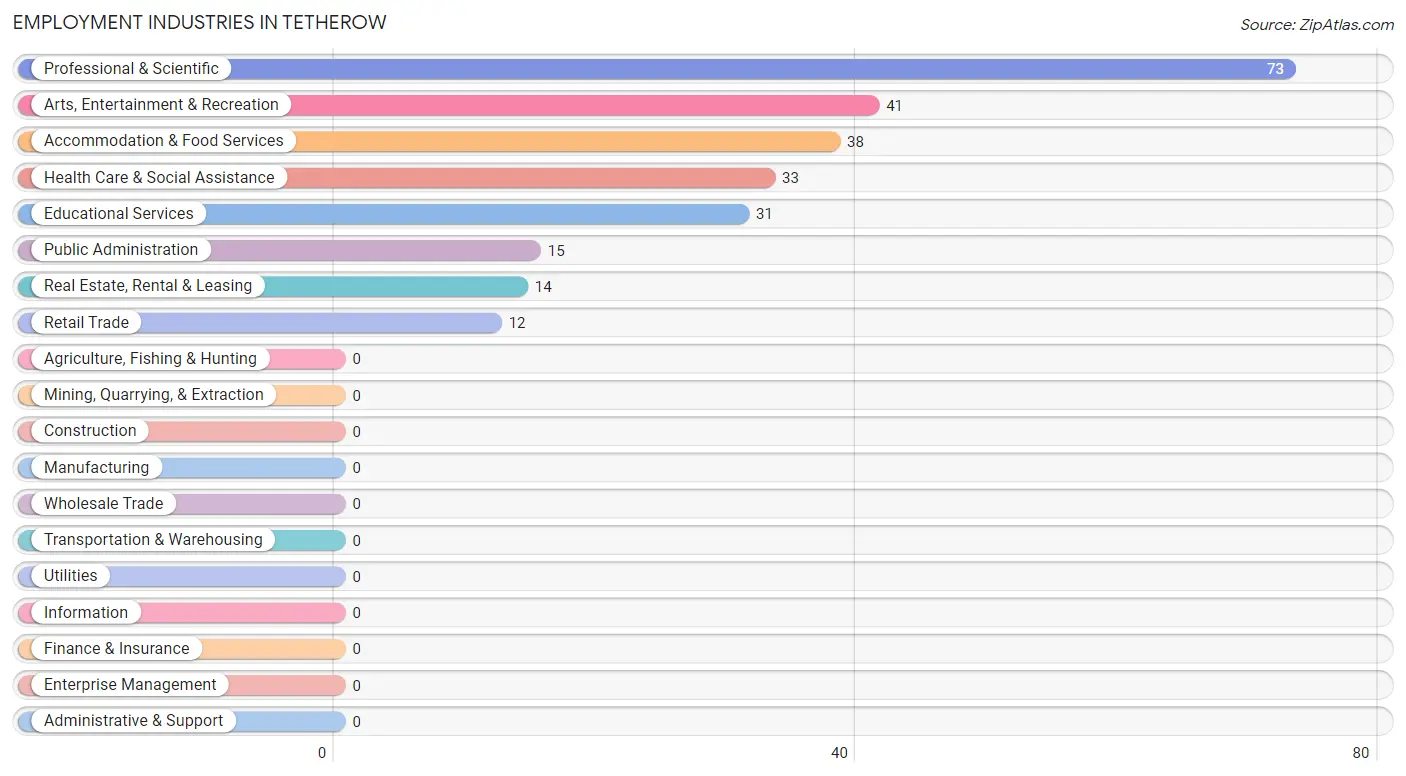
Employment Industries in Tetherow
The major employment industries in Tetherow include Professional & Scientific (73 | 26.6%), Arts, Entertainment & Recreation (41 | 14.9%), Accommodation & Food Services (38 | 13.8%), Health Care & Social Assistance (33 | 12.0%), and Educational Services (31 | 11.3%).
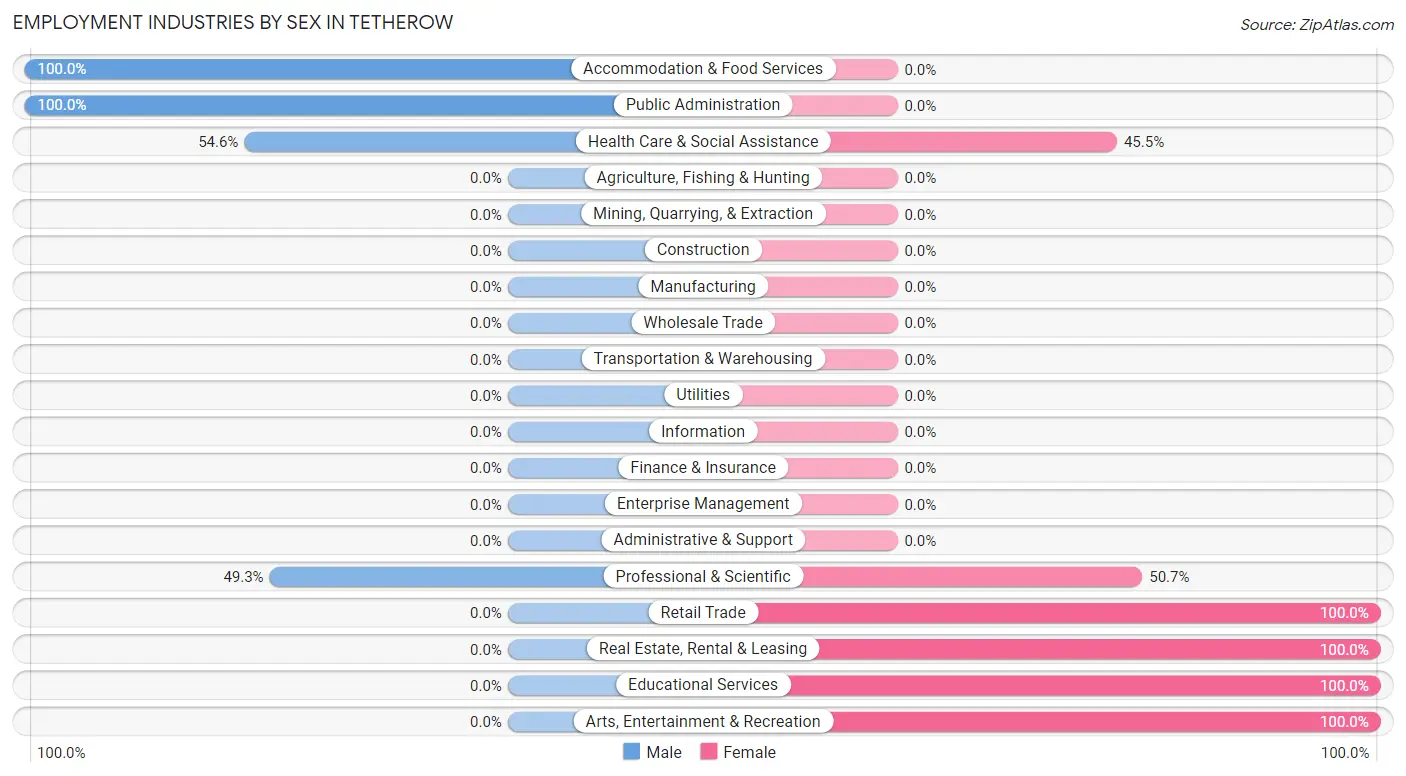
Employment Industries by Sex in Tetherow
The Tetherow industries that see more men than women are Accommodation & Food Services (100.0%), Public Administration (100.0%), and Health Care & Social Assistance (54.5%), whereas the industries that tend to have a higher number of women are Retail Trade (100.0%), Real Estate, Rental & Leasing (100.0%), and Educational Services (100.0%).
| Industry | Male | Female |
| Agriculture, Fishing & Hunting | 0 (0.0%) | 0 (0.0%) |
| Mining, Quarrying, & Extraction | 0 (0.0%) | 0 (0.0%) |
| Construction | 0 (0.0%) | 0 (0.0%) |
| Manufacturing | 0 (0.0%) | 0 (0.0%) |
| Wholesale Trade | 0 (0.0%) | 0 (0.0%) |
| Retail Trade | 0 (0.0%) | 12 (100.0%) |
| Transportation & Warehousing | 0 (0.0%) | 0 (0.0%) |
| Utilities | 0 (0.0%) | 0 (0.0%) |
| Information | 0 (0.0%) | 0 (0.0%) |
| Finance & Insurance | 0 (0.0%) | 0 (0.0%) |
| Real Estate, Rental & Leasing | 0 (0.0%) | 14 (100.0%) |
| Professional & Scientific | 36 (49.3%) | 37 (50.7%) |
| Enterprise Management | 0 (0.0%) | 0 (0.0%) |
| Administrative & Support | 0 (0.0%) | 0 (0.0%) |
| Educational Services | 0 (0.0%) | 31 (100.0%) |
| Health Care & Social Assistance | 18 (54.5%) | 15 (45.5%) |
| Arts, Entertainment & Recreation | 0 (0.0%) | 41 (100.0%) |
| Accommodation & Food Services | 38 (100.0%) | 0 (0.0%) |
| Public Administration | 15 (100.0%) | 0 (0.0%) |
| Total | 125 (45.5%) | 150 (54.5%) |
Education in Tetherow
School Enrollment in Tetherow
The most common levels of schooling among the 151 students in Tetherow are middle school (68 | 45.0%), elementary school (58 | 38.4%), and high school (25 | 16.6%).
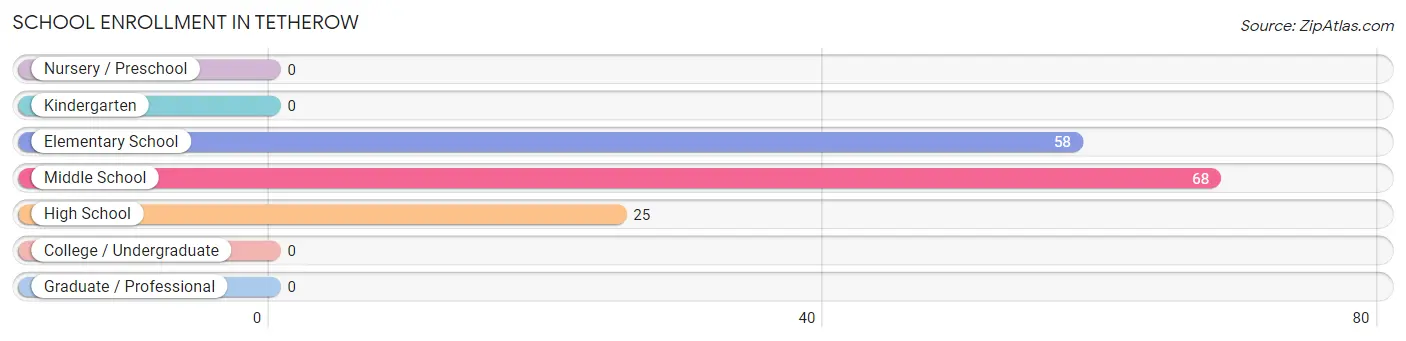
| School Level | # Students | % Students |
| Nursery / Preschool | 0 | 0.0% |
| Kindergarten | 0 | 0.0% |
| Elementary School | 58 | 38.4% |
| Middle School | 68 | 45.0% |
| High School | 25 | 16.6% |
| College / Undergraduate | 0 | 0.0% |
| Graduate / Professional | 0 | 0.0% |
| Total | 151 | 100.0% |
School Enrollment by Age by Funding Source in Tetherow
Out of a total of 151 students who are enrolled in schools in Tetherow, 36 (23.8%) attend a private institution, while the remaining 115 (76.2%) are enrolled in public schools. The age group of 10 to 14 year olds has the highest likelihood of being enrolled in private schools, with 36 (33.6% in the age bracket) enrolled. Conversely, the age group of 5 to 9 year old has the lowest likelihood of being enrolled in a private school, with 19 (100.0% in the age bracket) attending a public institution.
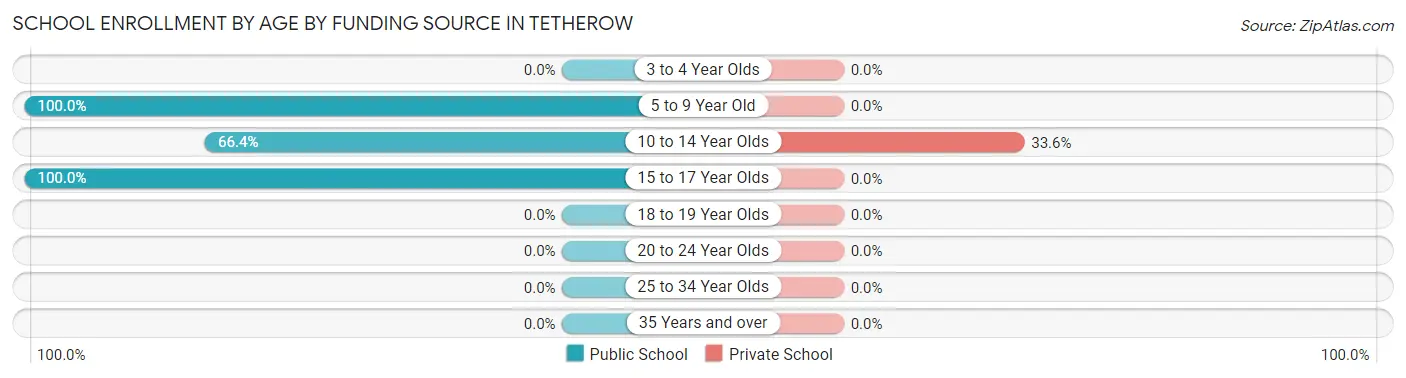
| Age Bracket | Public School | Private School |
| 3 to 4 Year Olds | 0 (0.0%) | 0 (0.0%) |
| 5 to 9 Year Old | 19 (100.0%) | 0 (0.0%) |
| 10 to 14 Year Olds | 71 (66.4%) | 36 (33.6%) |
| 15 to 17 Year Olds | 25 (100.0%) | 0 (0.0%) |
| 18 to 19 Year Olds | 0 (0.0%) | 0 (0.0%) |
| 20 to 24 Year Olds | 0 (0.0%) | 0 (0.0%) |
| 25 to 34 Year Olds | 0 (0.0%) | 0 (0.0%) |
| 35 Years and over | 0 (0.0%) | 0 (0.0%) |
| Total | 115 (76.2%) | 36 (23.8%) |
Educational Attainment by Field of Study in Tetherow
Business (78 | 17.4%), bio, nature & agricultural (55 | 12.3%), science & technology (53 | 11.9%), social sciences (43 | 9.6%), and education (41 | 9.2%) are the most common fields of study among 447 individuals in Tetherow who have obtained a bachelor's degree or higher.
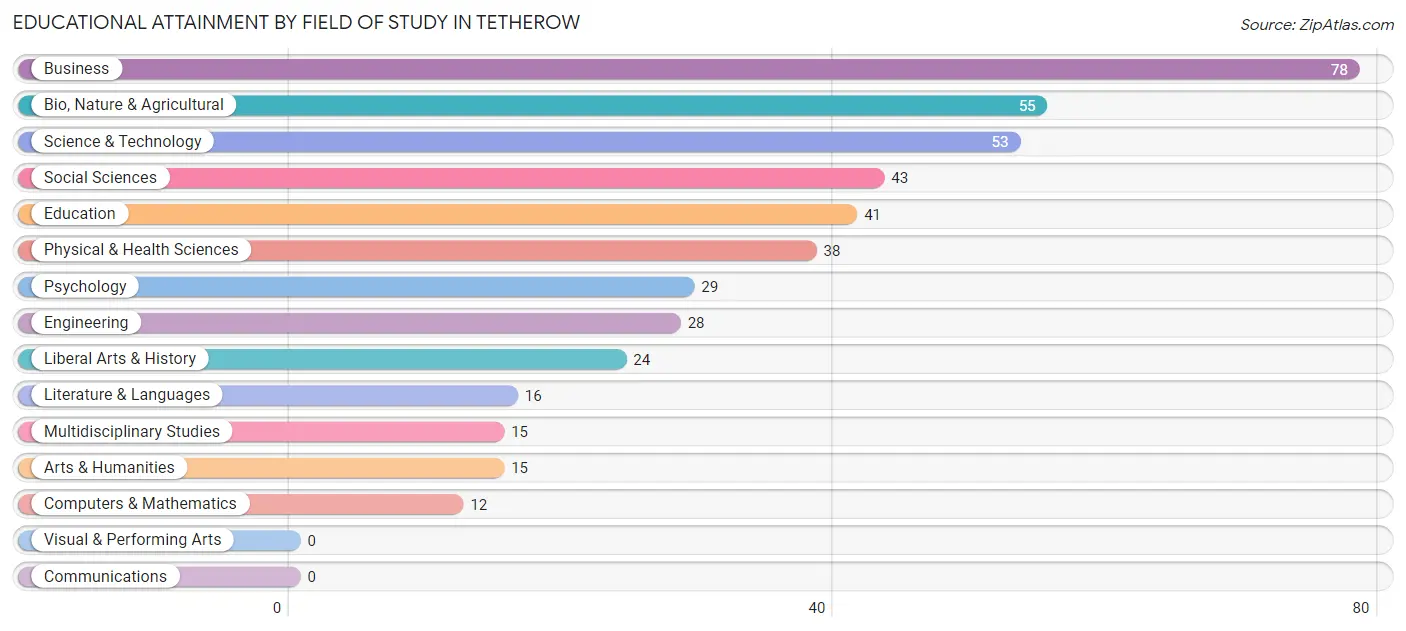
| Field of Study | # Graduates | % Graduates |
| Computers & Mathematics | 12 | 2.7% |
| Bio, Nature & Agricultural | 55 | 12.3% |
| Physical & Health Sciences | 38 | 8.5% |
| Psychology | 29 | 6.5% |
| Social Sciences | 43 | 9.6% |
| Engineering | 28 | 6.3% |
| Multidisciplinary Studies | 15 | 3.4% |
| Science & Technology | 53 | 11.9% |
| Business | 78 | 17.4% |
| Education | 41 | 9.2% |
| Literature & Languages | 16 | 3.6% |
| Liberal Arts & History | 24 | 5.4% |
| Visual & Performing Arts | 0 | 0.0% |
| Communications | 0 | 0.0% |
| Arts & Humanities | 15 | 3.4% |
| Total | 447 | 100.0% |
Transportation & Commute in Tetherow
Vehicle Availability by Sex in Tetherow
The most prevalent vehicle ownership categories in Tetherow are males with 3 vehicles (67, accounting for 62.6%) and females with 3 vehicles (91, making up 44.7%).
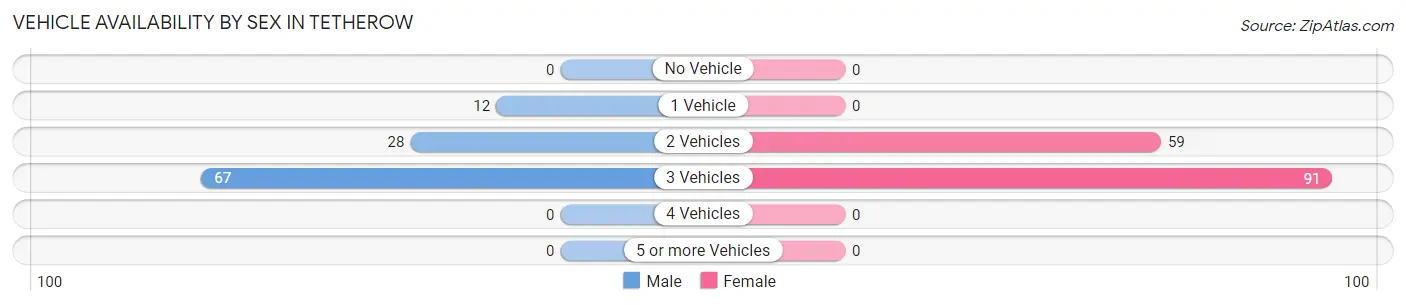
| Vehicles Available | Male | Female |
| No Vehicle | 0 (0.0%) | 0 (0.0%) |
| 1 Vehicle | 12 (11.2%) | 0 (0.0%) |
| 2 Vehicles | 28 (26.2%) | 59 (39.3%) |
| 3 Vehicles | 67 (62.6%) | 91 (60.7%) |
| 4 Vehicles | 0 (0.0%) | 0 (0.0%) |
| 5 or more Vehicles | 0 (0.0%) | 0 (0.0%) |
| Total | 107 (100.0%) | 150 (100.0%) |
Commute Time in Tetherow
The most frequently occuring commute durations in Tetherow are 5 to 9 minutes (93 commuters, 59.6%), 25 to 29 minutes (53 commuters, 34.0%), and 40 to 44 minutes (10 commuters, 6.4%).
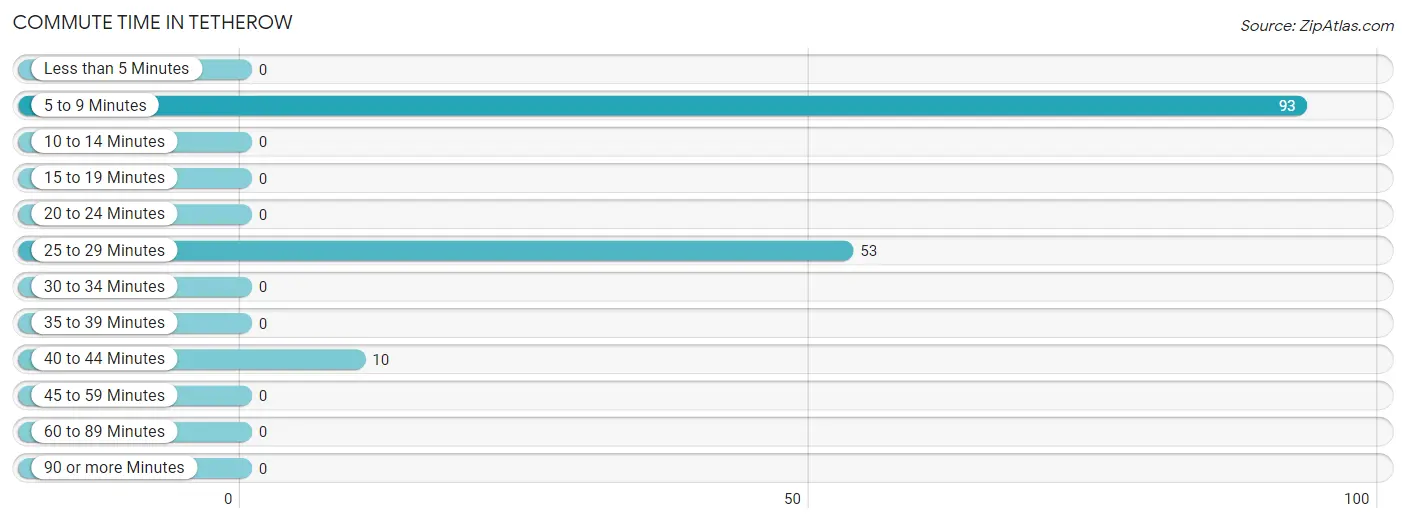
| Commute Time | # Commuters | % Commuters |
| Less than 5 Minutes | 0 | 0.0% |
| 5 to 9 Minutes | 93 | 59.6% |
| 10 to 14 Minutes | 0 | 0.0% |
| 15 to 19 Minutes | 0 | 0.0% |
| 20 to 24 Minutes | 0 | 0.0% |
| 25 to 29 Minutes | 53 | 34.0% |
| 30 to 34 Minutes | 0 | 0.0% |
| 35 to 39 Minutes | 0 | 0.0% |
| 40 to 44 Minutes | 10 | 6.4% |
| 45 to 59 Minutes | 0 | 0.0% |
| 60 to 89 Minutes | 0 | 0.0% |
| 90 or more Minutes | 0 | 0.0% |
Commute Time by Sex in Tetherow
The most common commute times in Tetherow are 5 to 9 minutes (42 commuters, 52.5%) for males and 5 to 9 minutes (51 commuters, 67.1%) for females.
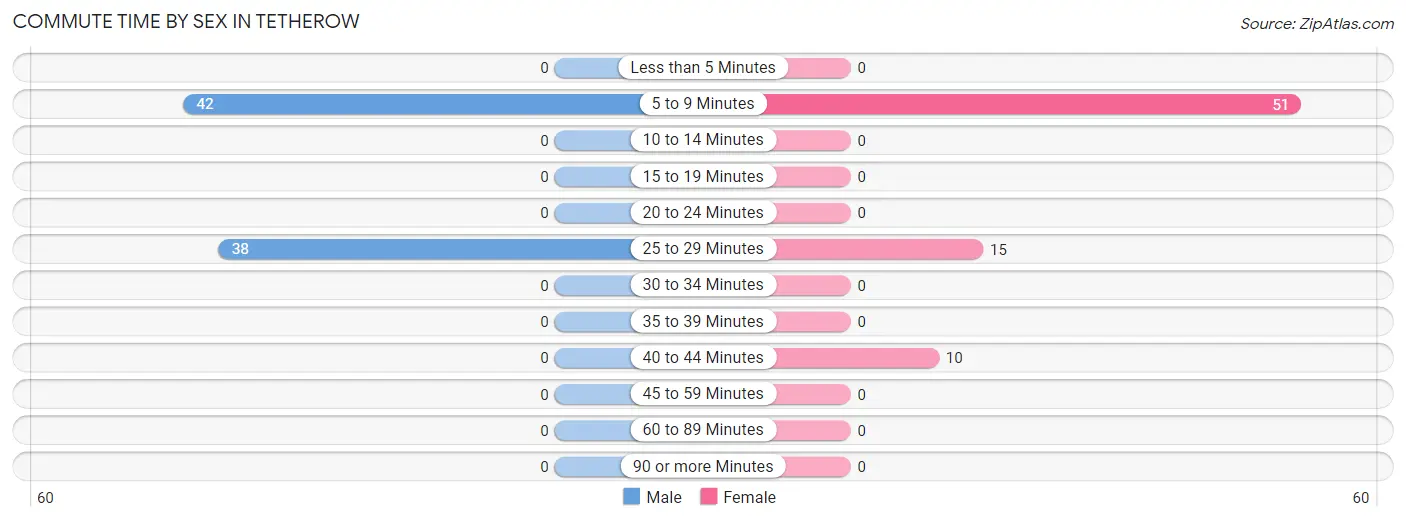
| Commute Time | Male | Female |
| Less than 5 Minutes | 0 (0.0%) | 0 (0.0%) |
| 5 to 9 Minutes | 42 (52.5%) | 51 (67.1%) |
| 10 to 14 Minutes | 0 (0.0%) | 0 (0.0%) |
| 15 to 19 Minutes | 0 (0.0%) | 0 (0.0%) |
| 20 to 24 Minutes | 0 (0.0%) | 0 (0.0%) |
| 25 to 29 Minutes | 38 (47.5%) | 15 (19.7%) |
| 30 to 34 Minutes | 0 (0.0%) | 0 (0.0%) |
| 35 to 39 Minutes | 0 (0.0%) | 0 (0.0%) |
| 40 to 44 Minutes | 0 (0.0%) | 10 (13.2%) |
| 45 to 59 Minutes | 0 (0.0%) | 0 (0.0%) |
| 60 to 89 Minutes | 0 (0.0%) | 0 (0.0%) |
| 90 or more Minutes | 0 (0.0%) | 0 (0.0%) |
Time of Departure to Work by Sex in Tetherow
The most frequent times of departure to work in Tetherow are 9:00 AM to 9:59 AM (38, 47.5%) for males and 7:30 AM to 7:59 AM (41, 53.9%) for females.
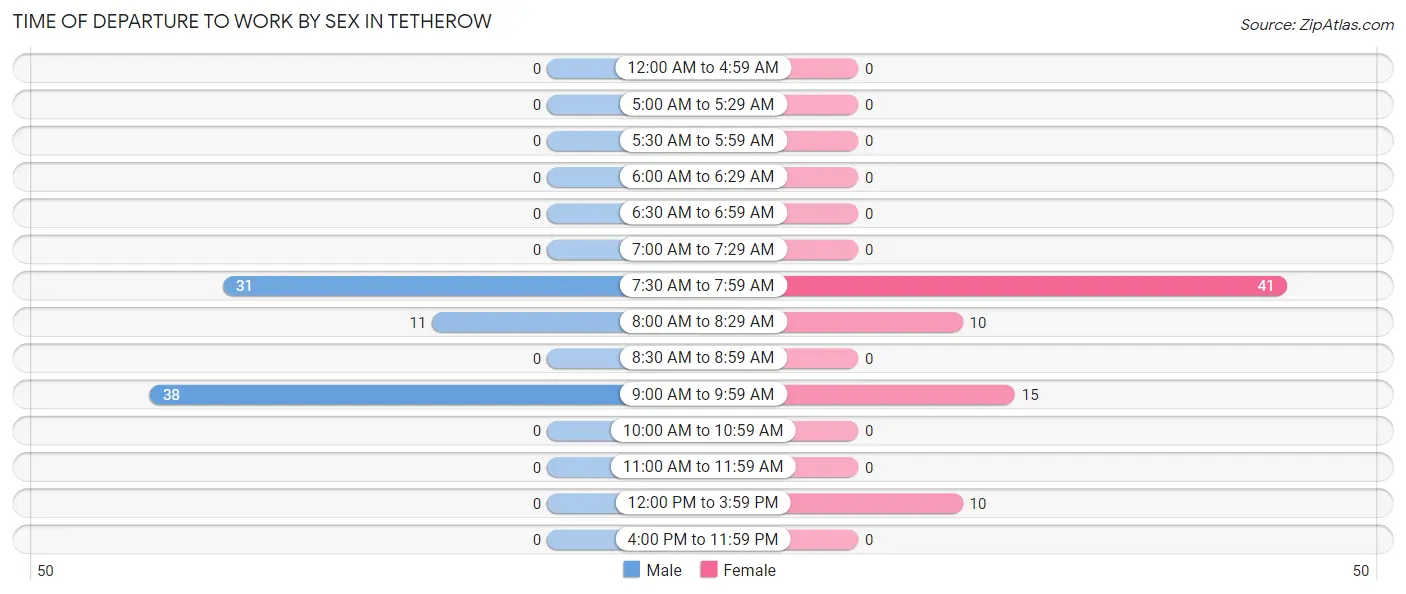
| Time of Departure | Male | Female |
| 12:00 AM to 4:59 AM | 0 (0.0%) | 0 (0.0%) |
| 5:00 AM to 5:29 AM | 0 (0.0%) | 0 (0.0%) |
| 5:30 AM to 5:59 AM | 0 (0.0%) | 0 (0.0%) |
| 6:00 AM to 6:29 AM | 0 (0.0%) | 0 (0.0%) |
| 6:30 AM to 6:59 AM | 0 (0.0%) | 0 (0.0%) |
| 7:00 AM to 7:29 AM | 0 (0.0%) | 0 (0.0%) |
| 7:30 AM to 7:59 AM | 31 (38.8%) | 41 (53.9%) |
| 8:00 AM to 8:29 AM | 11 (13.8%) | 10 (13.2%) |
| 8:30 AM to 8:59 AM | 0 (0.0%) | 0 (0.0%) |
| 9:00 AM to 9:59 AM | 38 (47.5%) | 15 (19.7%) |
| 10:00 AM to 10:59 AM | 0 (0.0%) | 0 (0.0%) |
| 11:00 AM to 11:59 AM | 0 (0.0%) | 0 (0.0%) |
| 12:00 PM to 3:59 PM | 0 (0.0%) | 10 (13.2%) |
| 4:00 PM to 11:59 PM | 0 (0.0%) | 0 (0.0%) |
| Total | 80 (100.0%) | 76 (100.0%) |
Housing Occupancy in Tetherow
Occupancy by Ownership in Tetherow
Of the total 259 dwellings in Tetherow, owner-occupied units account for 259 (100.0%), while renter-occupied units make up 0 (0.0%).
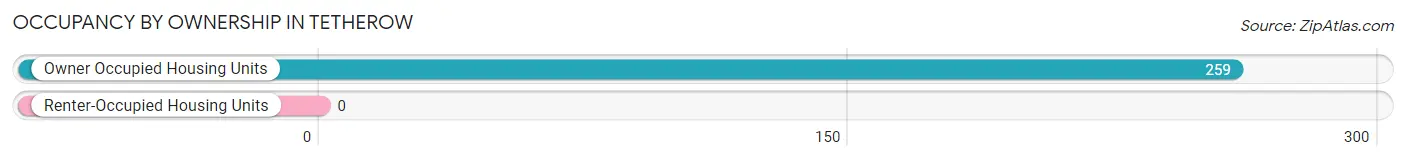
| Occupancy | # Housing Units | % Housing Units |
| Owner Occupied Housing Units | 259 | 100.0% |
| Renter-Occupied Housing Units | 0 | 0.0% |
| Total Occupied Housing Units | 259 | 100.0% |
Occupancy by Household Size in Tetherow
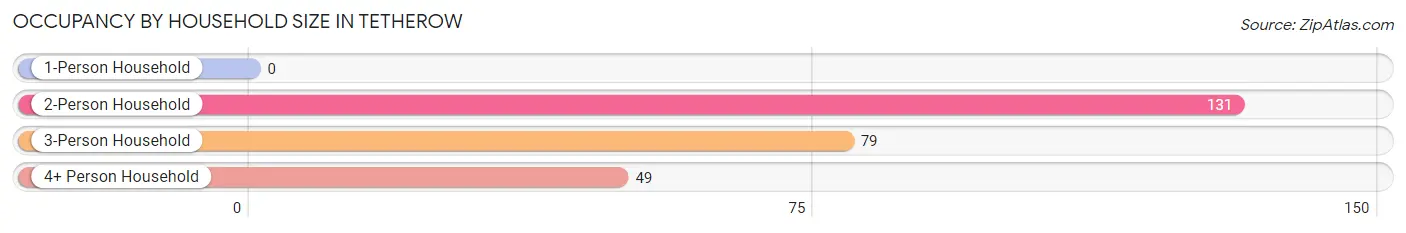
| Household Size | # Housing Units | % Housing Units |
| 1-Person Household | 0 | 0.0% |
| 2-Person Household | 131 | 50.6% |
| 3-Person Household | 79 | 30.5% |
| 4+ Person Household | 49 | 18.9% |
| Total Housing Units | 259 | 100.0% |
Occupancy by Ownership by Household Size in Tetherow
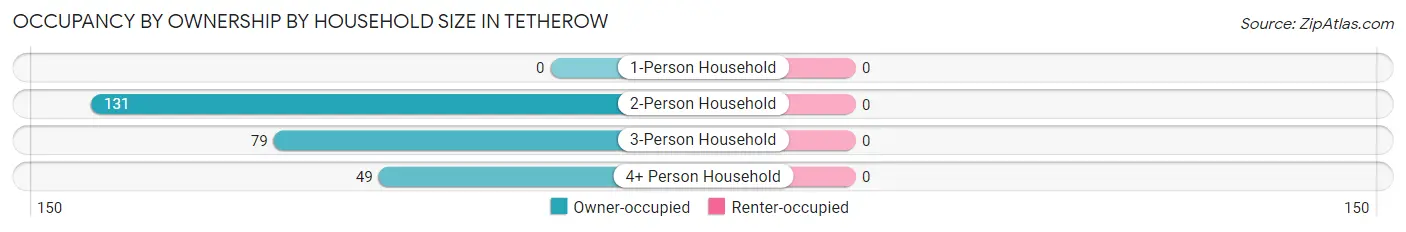
| Household Size | Owner-occupied | Renter-occupied |
| 1-Person Household | 0 (0.0%) | 0 (0.0%) |
| 2-Person Household | 131 (100.0%) | 0 (0.0%) |
| 3-Person Household | 79 (100.0%) | 0 (0.0%) |
| 4+ Person Household | 49 (100.0%) | 0 (0.0%) |
| Total Housing Units | 259 (100.0%) | 0 (0.0%) |
Occupancy by Educational Attainment in Tetherow
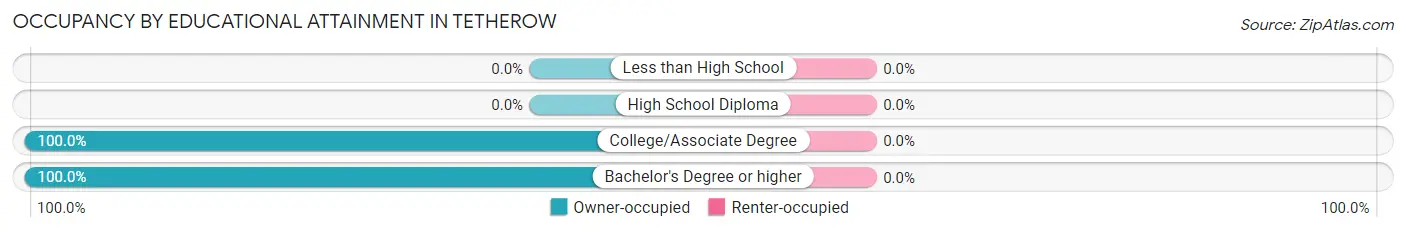
| Household Size | Owner-occupied | Renter-occupied |
| Less than High School | 0 (0.0%) | 0 (0.0%) |
| High School Diploma | 0 (0.0%) | 0 (0.0%) |
| College/Associate Degree | 55 (100.0%) | 0 (0.0%) |
| Bachelor's Degree or higher | 204 (100.0%) | 0 (0.0%) |
Occupancy by Age of Householder in Tetherow
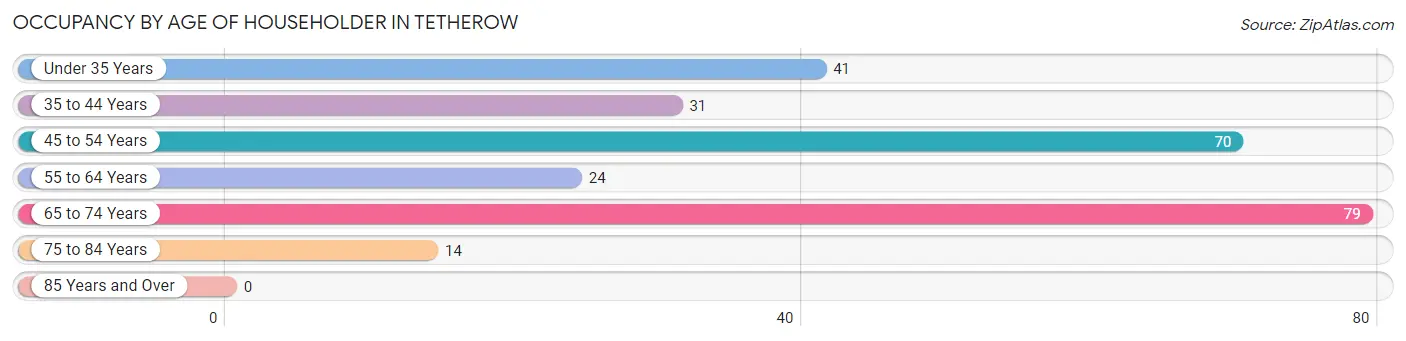
| Age Bracket | # Households | % Households |
| Under 35 Years | 41 | 15.8% |
| 35 to 44 Years | 31 | 12.0% |
| 45 to 54 Years | 70 | 27.0% |
| 55 to 64 Years | 24 | 9.3% |
| 65 to 74 Years | 79 | 30.5% |
| 75 to 84 Years | 14 | 5.4% |
| 85 Years and Over | 0 | 0.0% |
| Total | 259 | 100.0% |
Housing Finances in Tetherow
Median Income by Occupancy in Tetherow
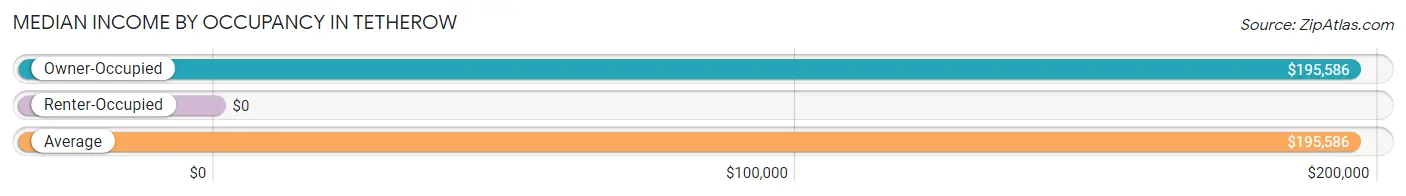
| Occupancy Type | # Households | Median Income |
| Owner-Occupied | 259 (100.0%) | $195,586 |
| Renter-Occupied | 0 (0.0%) | $0 |
| Average | 259 (100.0%) | $195,586 |
Occupancy by Householder Income Bracket in Tetherow
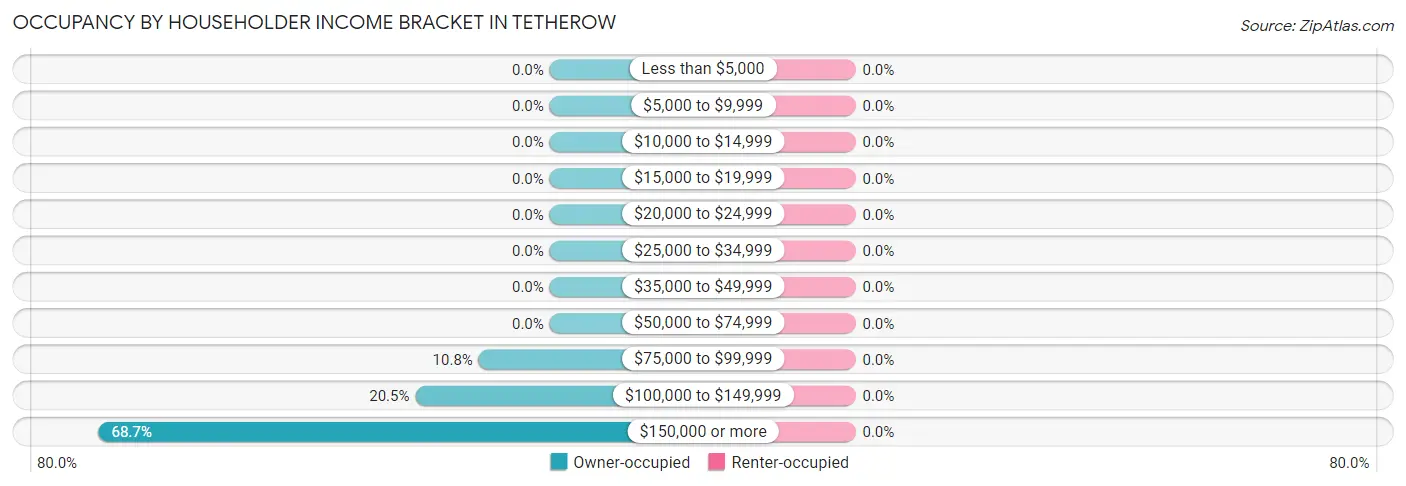
| Income Bracket | Owner-occupied | Renter-occupied |
| Less than $5,000 | 0 (0.0%) | 0 (0.0%) |
| $5,000 to $9,999 | 0 (0.0%) | 0 (0.0%) |
| $10,000 to $14,999 | 0 (0.0%) | 0 (0.0%) |
| $15,000 to $19,999 | 0 (0.0%) | 0 (0.0%) |
| $20,000 to $24,999 | 0 (0.0%) | 0 (0.0%) |
| $25,000 to $34,999 | 0 (0.0%) | 0 (0.0%) |
| $35,000 to $49,999 | 0 (0.0%) | 0 (0.0%) |
| $50,000 to $74,999 | 0 (0.0%) | 0 (0.0%) |
| $75,000 to $99,999 | 28 (10.8%) | 0 (0.0%) |
| $100,000 to $149,999 | 53 (20.5%) | 0 (0.0%) |
| $150,000 or more | 178 (68.7%) | 0 (0.0%) |
| Total | 259 (100.0%) | 0 (0.0%) |
Monthly Housing Cost Tiers in Tetherow
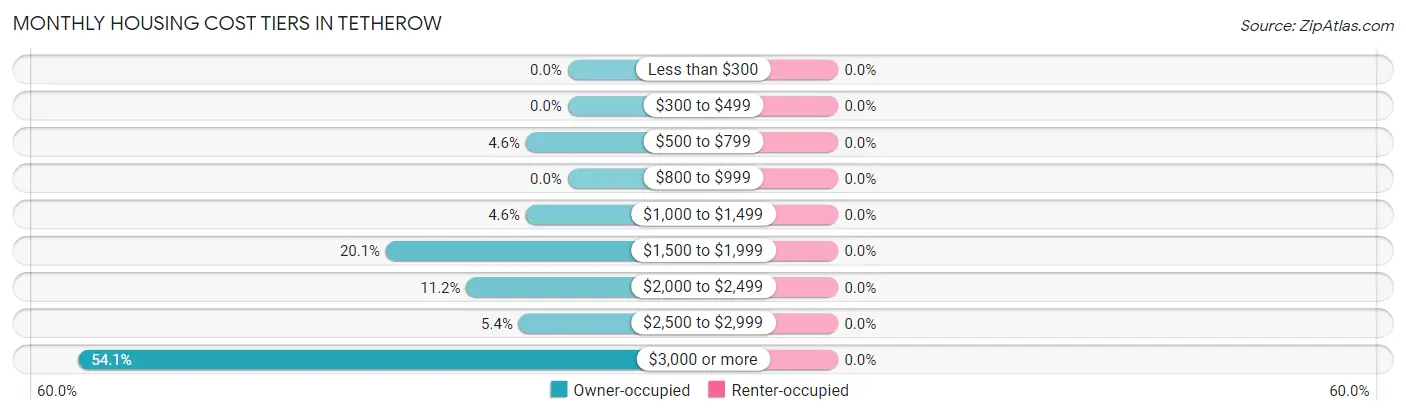
| Monthly Cost | Owner-occupied | Renter-occupied |
| Less than $300 | 0 (0.0%) | 0 (0.0%) |
| $300 to $499 | 0 (0.0%) | 0 (0.0%) |
| $500 to $799 | 12 (4.6%) | 0 (0.0%) |
| $800 to $999 | 0 (0.0%) | 0 (0.0%) |
| $1,000 to $1,499 | 12 (4.6%) | 0 (0.0%) |
| $1,500 to $1,999 | 52 (20.1%) | 0 (0.0%) |
| $2,000 to $2,499 | 29 (11.2%) | 0 (0.0%) |
| $2,500 to $2,999 | 14 (5.4%) | 0 (0.0%) |
| $3,000 or more | 140 (54.0%) | 0 (0.0%) |
| Total | 259 (100.0%) | 0 (0.0%) |
Physical Housing Characteristics in Tetherow
Housing Structures in Tetherow
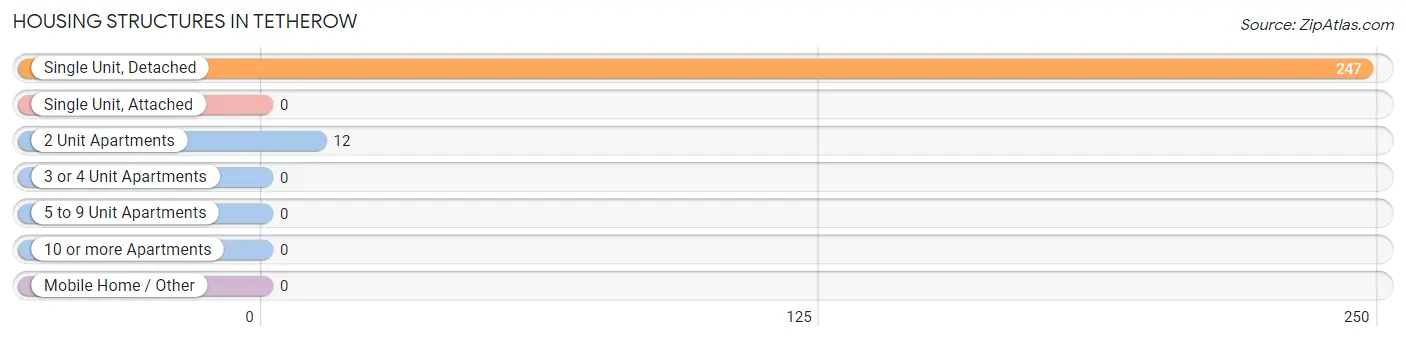
| Structure Type | # Housing Units | % Housing Units |
| Single Unit, Detached | 247 | 95.4% |
| Single Unit, Attached | 0 | 0.0% |
| 2 Unit Apartments | 12 | 4.6% |
| 3 or 4 Unit Apartments | 0 | 0.0% |
| 5 to 9 Unit Apartments | 0 | 0.0% |
| 10 or more Apartments | 0 | 0.0% |
| Mobile Home / Other | 0 | 0.0% |
| Total | 259 | 100.0% |
Housing Structures by Occupancy in Tetherow
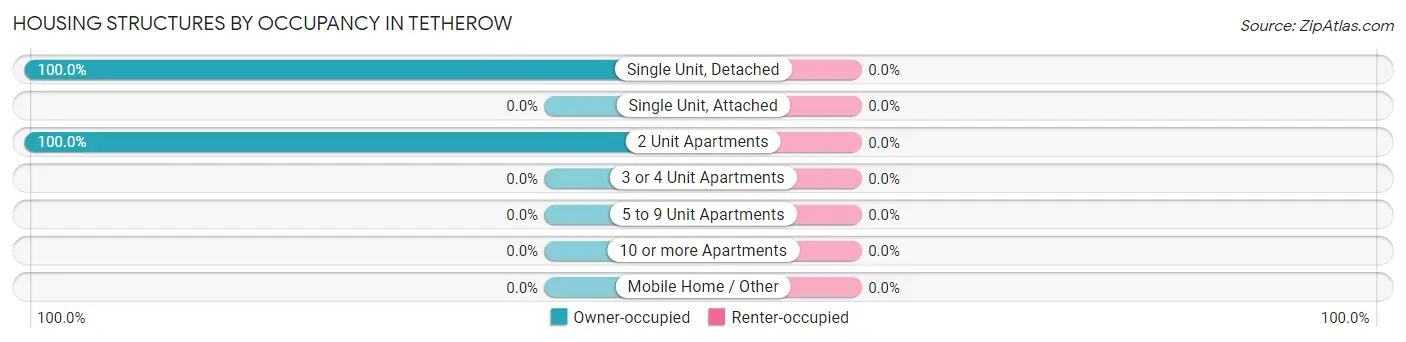
| Structure Type | Owner-occupied | Renter-occupied |
| Single Unit, Detached | 247 (100.0%) | 0 (0.0%) |
| Single Unit, Attached | 0 (0.0%) | 0 (0.0%) |
| 2 Unit Apartments | 12 (100.0%) | 0 (0.0%) |
| 3 or 4 Unit Apartments | 0 (0.0%) | 0 (0.0%) |
| 5 to 9 Unit Apartments | 0 (0.0%) | 0 (0.0%) |
| 10 or more Apartments | 0 (0.0%) | 0 (0.0%) |
| Mobile Home / Other | 0 (0.0%) | 0 (0.0%) |
| Total | 259 (100.0%) | 0 (0.0%) |
Housing Structures by Number of Rooms in Tetherow
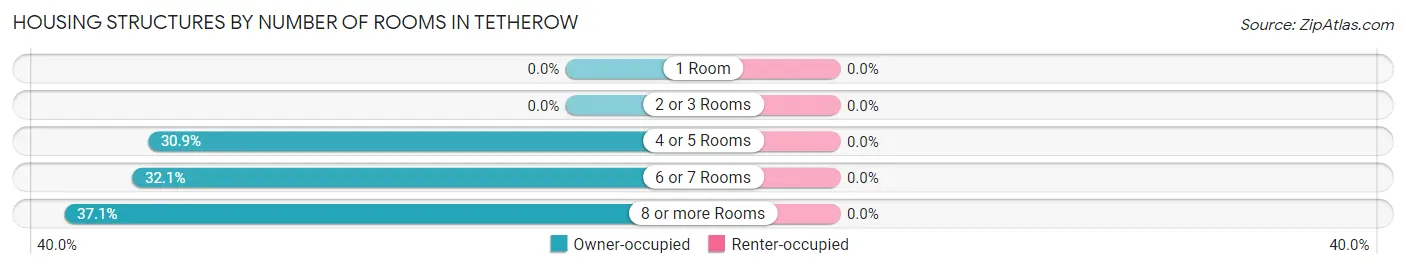
| Number of Rooms | Owner-occupied | Renter-occupied |
| 1 Room | 0 (0.0%) | 0 (0.0%) |
| 2 or 3 Rooms | 0 (0.0%) | 0 (0.0%) |
| 4 or 5 Rooms | 80 (30.9%) | 0 (0.0%) |
| 6 or 7 Rooms | 83 (32.1%) | 0 (0.0%) |
| 8 or more Rooms | 96 (37.1%) | 0 (0.0%) |
| Total | 259 (100.0%) | 0 (0.0%) |
Housing Structure by Heating Type in Tetherow
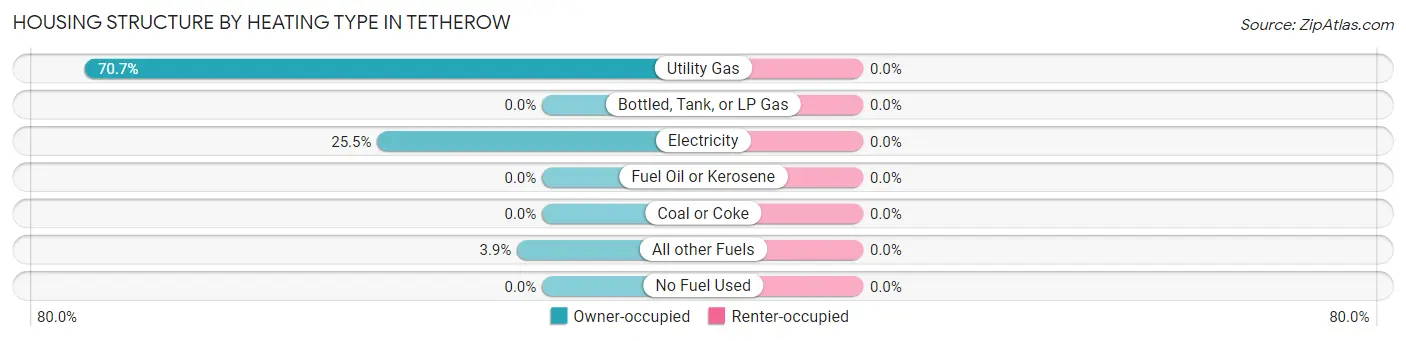
| Heating Type | Owner-occupied | Renter-occupied |
| Utility Gas | 183 (70.7%) | 0 (0.0%) |
| Bottled, Tank, or LP Gas | 0 (0.0%) | 0 (0.0%) |
| Electricity | 66 (25.5%) | 0 (0.0%) |
| Fuel Oil or Kerosene | 0 (0.0%) | 0 (0.0%) |
| Coal or Coke | 0 (0.0%) | 0 (0.0%) |
| All other Fuels | 10 (3.9%) | 0 (0.0%) |
| No Fuel Used | 0 (0.0%) | 0 (0.0%) |
| Total | 259 (100.0%) | 0 (0.0%) |
Household Vehicle Usage in Tetherow
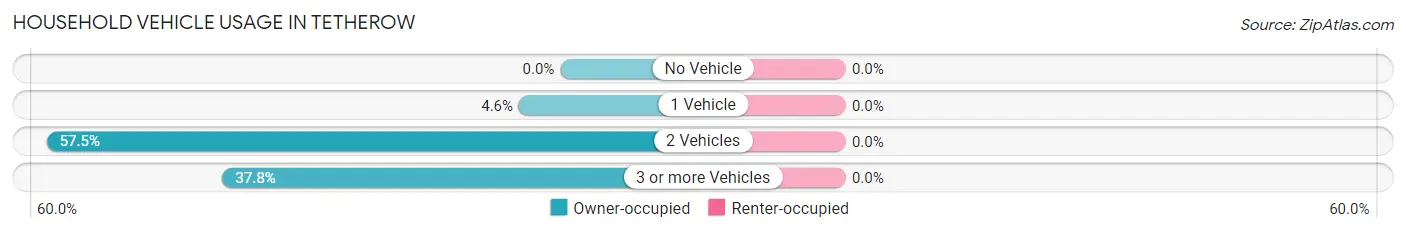
| Vehicles per Household | Owner-occupied | Renter-occupied |
| No Vehicle | 0 (0.0%) | 0 (0.0%) |
| 1 Vehicle | 12 (4.6%) | 0 (0.0%) |
| 2 Vehicles | 149 (57.5%) | 0 (0.0%) |
| 3 or more Vehicles | 98 (37.8%) | 0 (0.0%) |
| Total | 259 (100.0%) | 0 (0.0%) |
Real Estate & Mortgages in Tetherow
Real Estate and Mortgage Overview in Tetherow
| Characteristic | Without Mortgage | With Mortgage |
| Housing Units | 105 | 154 |
| Median Property Value | $1,548,100 | $1,600,000 |
| Median Household Income | - | - |
| Monthly Housing Costs | $1,501 | $140 |
| Real Estate Taxes | $10,001 | $0 |
Property Value by Mortgage Status in Tetherow
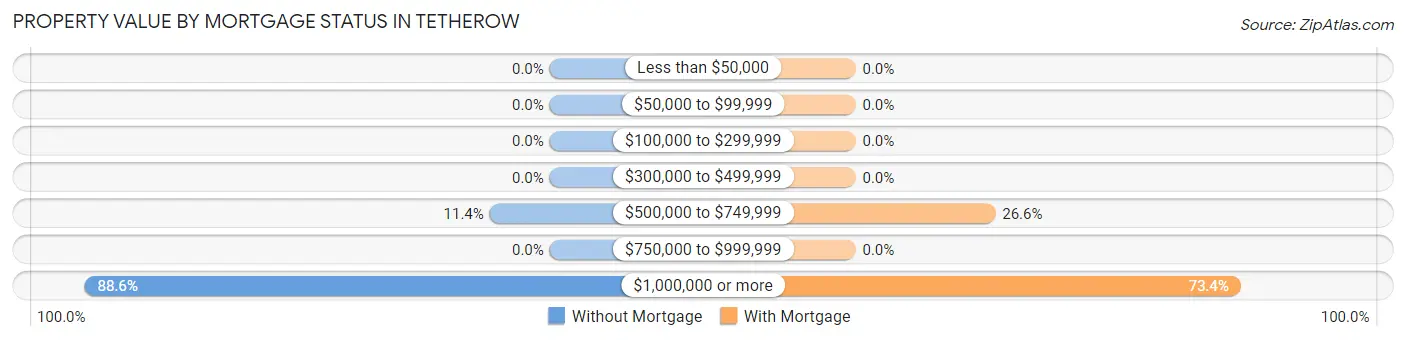
| Property Value | Without Mortgage | With Mortgage |
| Less than $50,000 | 0 (0.0%) | 0 (0.0%) |
| $50,000 to $99,999 | 0 (0.0%) | 0 (0.0%) |
| $100,000 to $299,999 | 0 (0.0%) | 0 (0.0%) |
| $300,000 to $499,999 | 0 (0.0%) | 0 (0.0%) |
| $500,000 to $749,999 | 12 (11.4%) | 41 (26.6%) |
| $750,000 to $999,999 | 0 (0.0%) | 0 (0.0%) |
| $1,000,000 or more | 93 (88.6%) | 113 (73.4%) |
| Total | 105 (100.0%) | 154 (100.0%) |
Household Income by Mortgage Status in Tetherow
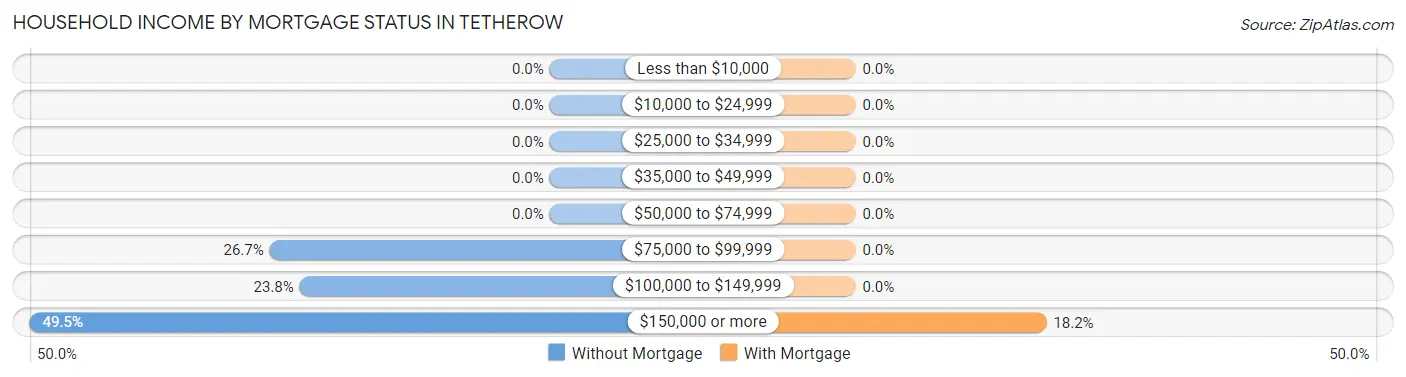
| Household Income | Without Mortgage | With Mortgage |
| Less than $10,000 | 0 (0.0%) | 0 (0.0%) |
| $10,000 to $24,999 | 0 (0.0%) | 0 (0.0%) |
| $25,000 to $34,999 | 0 (0.0%) | 0 (0.0%) |
| $35,000 to $49,999 | 0 (0.0%) | 0 (0.0%) |
| $50,000 to $74,999 | 0 (0.0%) | 0 (0.0%) |
| $75,000 to $99,999 | 28 (26.7%) | 0 (0.0%) |
| $100,000 to $149,999 | 25 (23.8%) | 0 (0.0%) |
| $150,000 or more | 52 (49.5%) | 28 (18.2%) |
| Total | 105 (100.0%) | 154 (100.0%) |
Property Value to Household Income Ratio in Tetherow
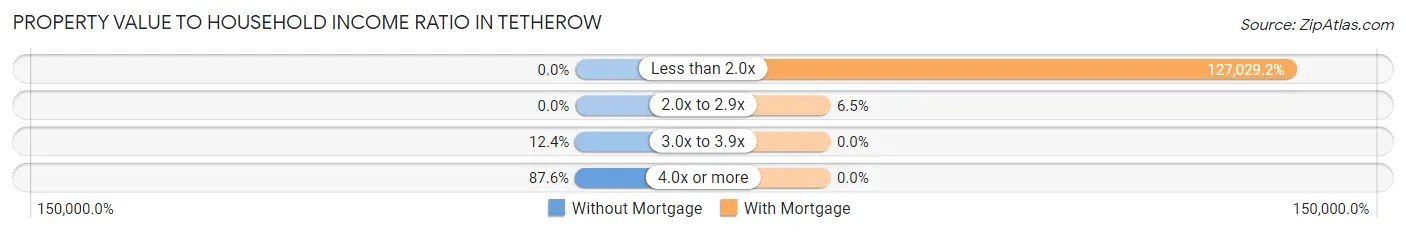
| Value-to-Income Ratio | Without Mortgage | With Mortgage |
| Less than 2.0x | 0 (0.0%) | 195,625 (127,029.2%) |
| 2.0x to 2.9x | 0 (0.0%) | 10 (6.5%) |
| 3.0x to 3.9x | 13 (12.4%) | 0 (0.0%) |
| 4.0x or more | 92 (87.6%) | 0 (0.0%) |
| Total | 105 (100.0%) | 154 (100.0%) |
Real Estate Taxes by Mortgage Status in Tetherow
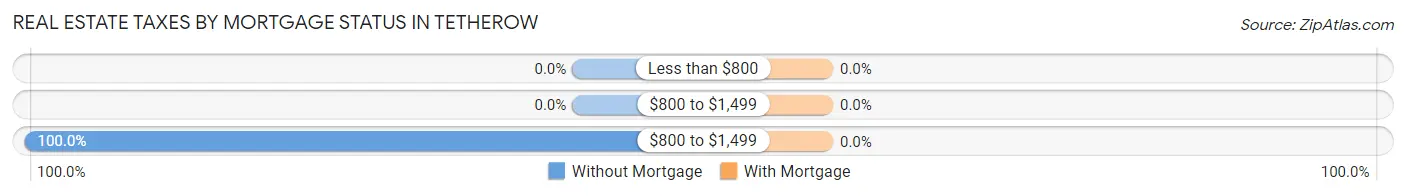
| Property Taxes | Without Mortgage | With Mortgage |
| Less than $800 | 0 (0.0%) | 0 (0.0%) |
| $800 to $1,499 | 0 (0.0%) | 0 (0.0%) |
| $800 to $1,499 | 105 (100.0%) | 0 (0.0%) |
| Total | 105 (100.0%) | 154 (100.0%) |
Health & Disability in Tetherow
Health Insurance Coverage by Age in Tetherow
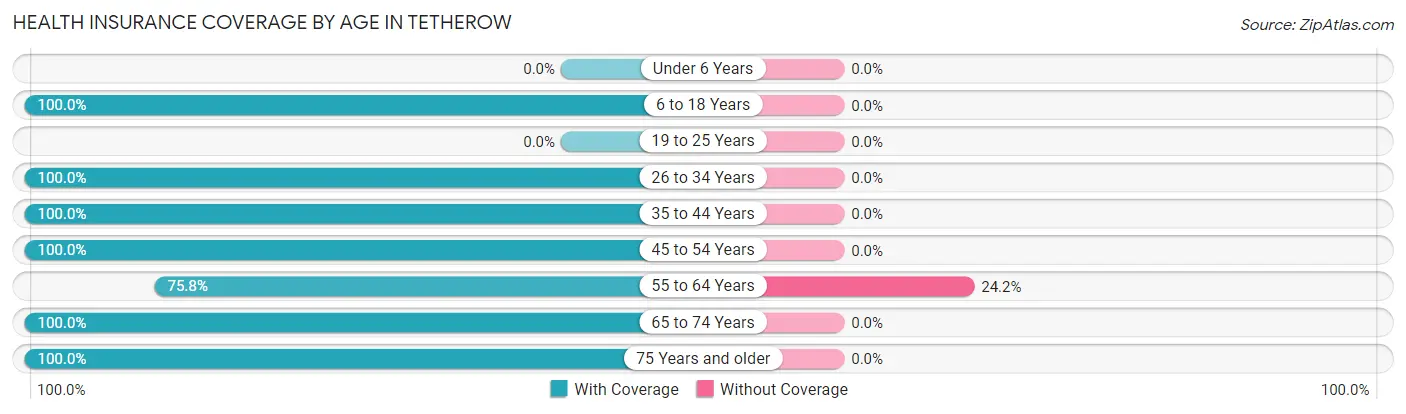
| Age Bracket | With Coverage | Without Coverage |
| Under 6 Years | 0 (0.0%) | 0 (0.0%) |
| 6 to 18 Years | 196 (100.0%) | 0 (0.0%) |
| 19 to 25 Years | 0 (0.0%) | 0 (0.0%) |
| 26 to 34 Years | 79 (100.0%) | 0 (0.0%) |
| 35 to 44 Years | 62 (100.0%) | 0 (0.0%) |
| 45 to 54 Years | 142 (100.0%) | 0 (0.0%) |
| 55 to 64 Years | 50 (75.8%) | 16 (24.2%) |
| 65 to 74 Years | 157 (100.0%) | 0 (0.0%) |
| 75 Years and older | 14 (100.0%) | 0 (0.0%) |
| Total | 700 (97.8%) | 16 (2.2%) |
Health Insurance Coverage by Citizenship Status in Tetherow
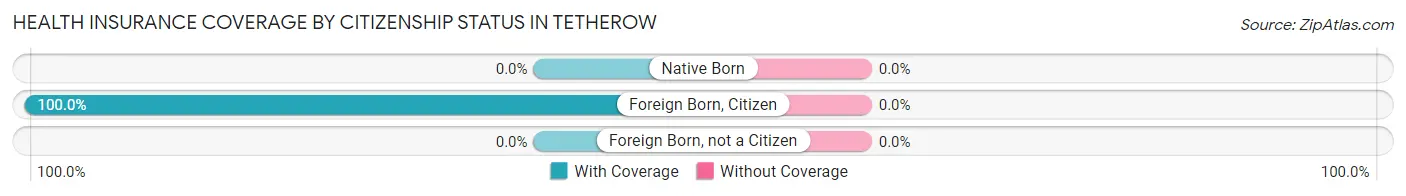
| Citizenship Status | With Coverage | Without Coverage |
| Native Born | 0 (0.0%) | 0 (0.0%) |
| Foreign Born, Citizen | 196 (100.0%) | 0 (0.0%) |
| Foreign Born, not a Citizen | 0 (0.0%) | 0 (0.0%) |
Health Insurance Coverage by Household Income in Tetherow
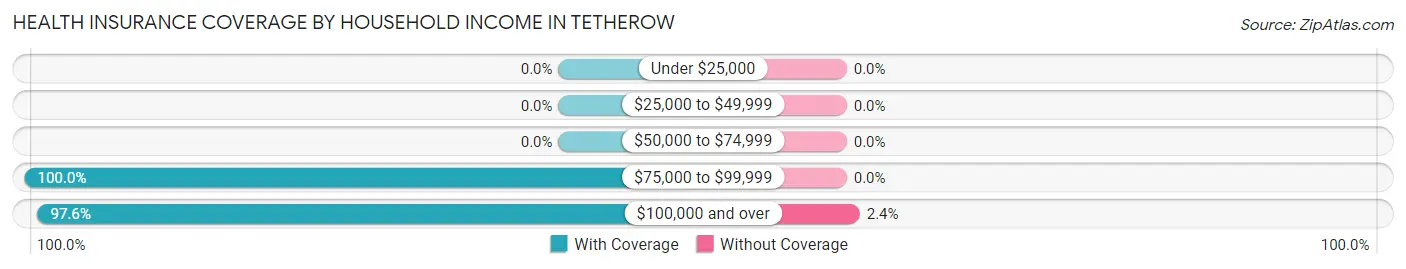
| Household Income | With Coverage | Without Coverage |
| Under $25,000 | 0 (0.0%) | 0 (0.0%) |
| $25,000 to $49,999 | 0 (0.0%) | 0 (0.0%) |
| $50,000 to $74,999 | 0 (0.0%) | 0 (0.0%) |
| $75,000 to $99,999 | 58 (100.0%) | 0 (0.0%) |
| $100,000 and over | 642 (97.6%) | 16 (2.4%) |
Public vs Private Health Insurance Coverage by Age in Tetherow
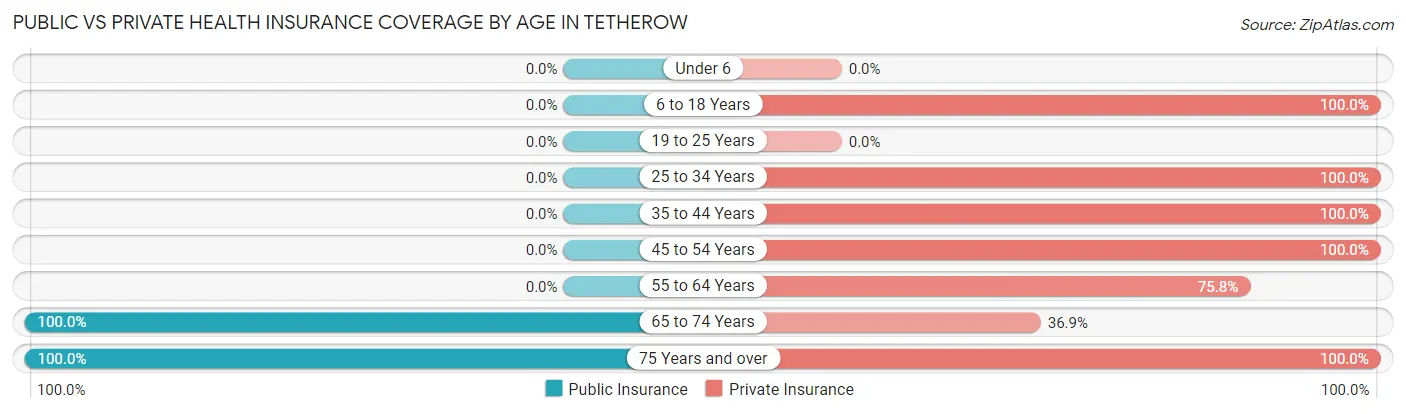
| Age Bracket | Public Insurance | Private Insurance |
| Under 6 | 0 (0.0%) | 0 (0.0%) |
| 6 to 18 Years | 0 (0.0%) | 196 (100.0%) |
| 19 to 25 Years | 0 (0.0%) | 0 (0.0%) |
| 25 to 34 Years | 0 (0.0%) | 79 (100.0%) |
| 35 to 44 Years | 0 (0.0%) | 62 (100.0%) |
| 45 to 54 Years | 0 (0.0%) | 142 (100.0%) |
| 55 to 64 Years | 0 (0.0%) | 50 (75.8%) |
| 65 to 74 Years | 157 (100.0%) | 58 (36.9%) |
| 75 Years and over | 14 (100.0%) | 14 (100.0%) |
| Total | 171 (23.9%) | 601 (83.9%) |
Disability Status by Sex by Age in Tetherow
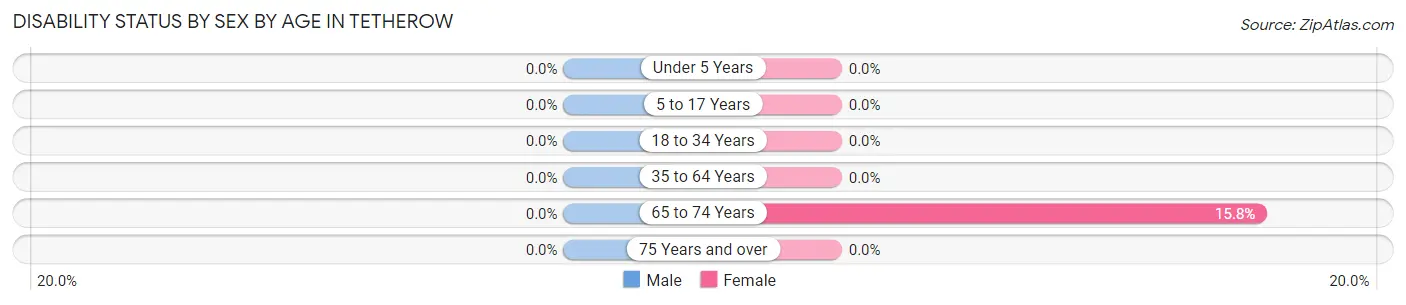
| Age Bracket | Male | Female |
| Under 5 Years | 0 (0.0%) | 0 (0.0%) |
| 5 to 17 Years | 0 (0.0%) | 0 (0.0%) |
| 18 to 34 Years | 0 (0.0%) | 0 (0.0%) |
| 35 to 64 Years | 0 (0.0%) | 0 (0.0%) |
| 65 to 74 Years | 0 (0.0%) | 12 (15.8%) |
| 75 Years and over | 0 (0.0%) | 0 (0.0%) |
Disability Class by Sex by Age in Tetherow
Disability Class: Hearing Difficulty
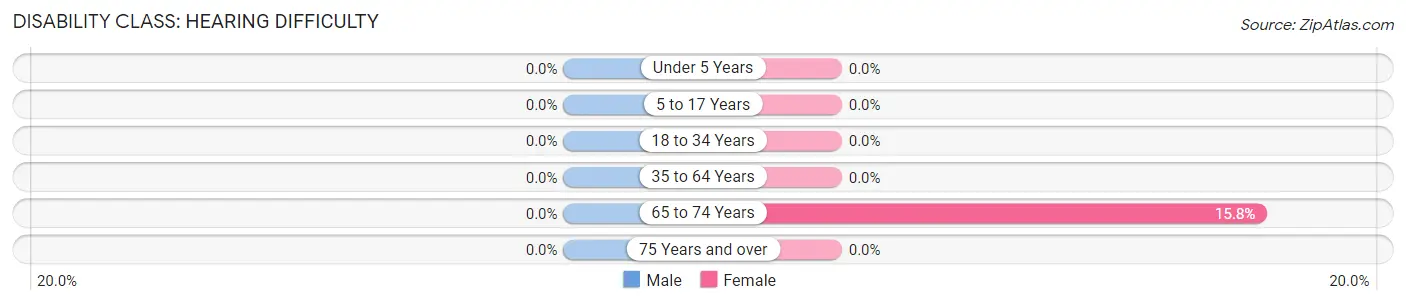
| Age Bracket | Male | Female |
| Under 5 Years | 0 (0.0%) | 0 (0.0%) |
| 5 to 17 Years | 0 (0.0%) | 0 (0.0%) |
| 18 to 34 Years | 0 (0.0%) | 0 (0.0%) |
| 35 to 64 Years | 0 (0.0%) | 0 (0.0%) |
| 65 to 74 Years | 0 (0.0%) | 12 (15.8%) |
| 75 Years and over | 0 (0.0%) | 0 (0.0%) |
Disability Class: Vision Difficulty
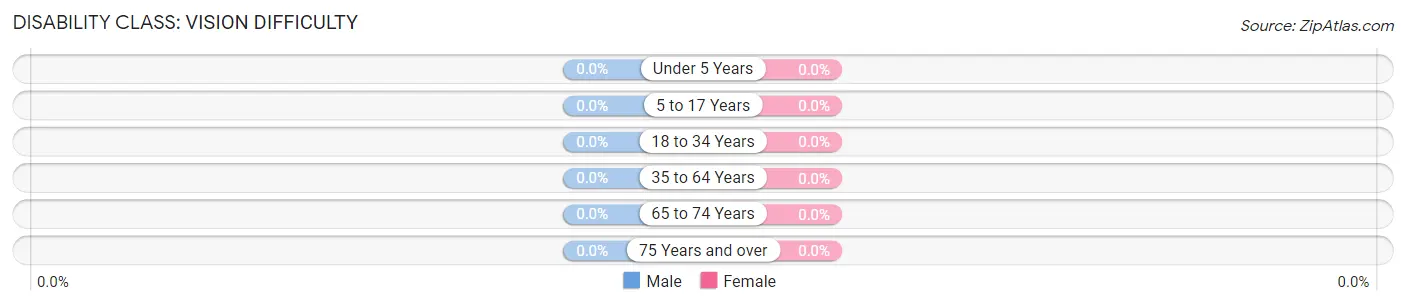
| Age Bracket | Male | Female |
| Under 5 Years | 0 (0.0%) | 0 (0.0%) |
| 5 to 17 Years | 0 (0.0%) | 0 (0.0%) |
| 18 to 34 Years | 0 (0.0%) | 0 (0.0%) |
| 35 to 64 Years | 0 (0.0%) | 0 (0.0%) |
| 65 to 74 Years | 0 (0.0%) | 0 (0.0%) |
| 75 Years and over | 0 (0.0%) | 0 (0.0%) |
Disability Class: Cognitive Difficulty
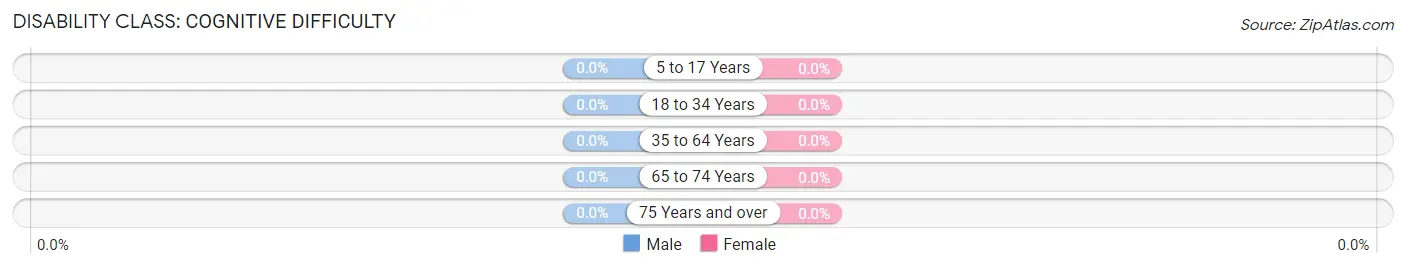
| Age Bracket | Male | Female |
| 5 to 17 Years | 0 (0.0%) | 0 (0.0%) |
| 18 to 34 Years | 0 (0.0%) | 0 (0.0%) |
| 35 to 64 Years | 0 (0.0%) | 0 (0.0%) |
| 65 to 74 Years | 0 (0.0%) | 0 (0.0%) |
| 75 Years and over | 0 (0.0%) | 0 (0.0%) |
Disability Class: Ambulatory Difficulty
| Age Bracket | Male | Female |
| 5 to 17 Years | 0 (0.0%) | 0 (0.0%) |
| 18 to 34 Years | 0 (0.0%) | 0 (0.0%) |
| 35 to 64 Years | 0 (0.0%) | 0 (0.0%) |
| 65 to 74 Years | 0 (0.0%) | 0 (0.0%) |
| 75 Years and over | 0 (0.0%) | 0 (0.0%) |
Disability Class: Self-Care Difficulty
| Age Bracket | Male | Female |
| 5 to 17 Years | 0 (0.0%) | 0 (0.0%) |
| 18 to 34 Years | 0 (0.0%) | 0 (0.0%) |
| 35 to 64 Years | 0 (0.0%) | 0 (0.0%) |
| 65 to 74 Years | 0 (0.0%) | 0 (0.0%) |
| 75 Years and over | 0 (0.0%) | 0 (0.0%) |
Technology Access in Tetherow
Computing Device Access in Tetherow
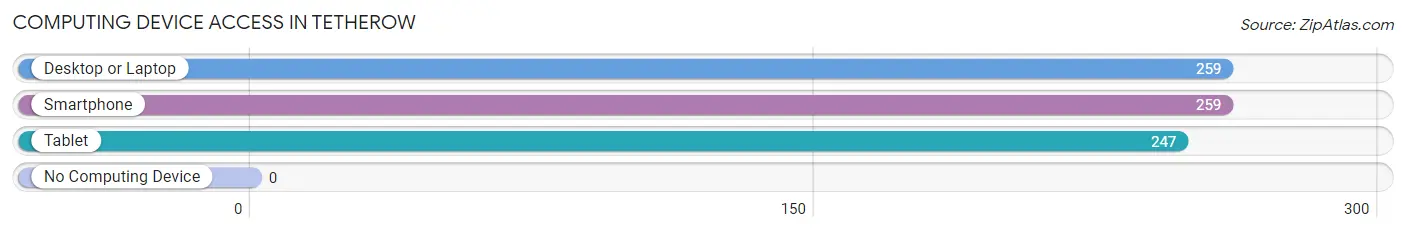
| Device Type | # Households | % Households |
| Desktop or Laptop | 259 | 100.0% |
| Smartphone | 259 | 100.0% |
| Tablet | 247 | 95.4% |
| No Computing Device | 0 | 0.0% |
| Total | 259 | 100.0% |
Internet Access in Tetherow
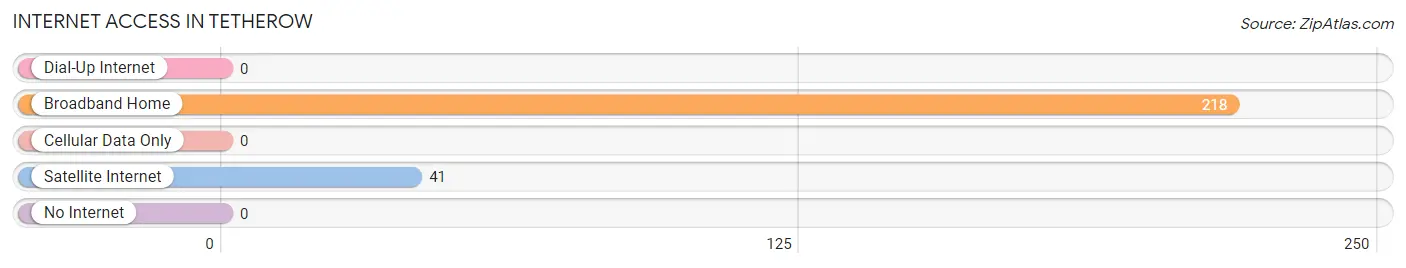
| Internet Type | # Households | % Households |
| Dial-Up Internet | 0 | 0.0% |
| Broadband Home | 218 | 84.2% |
| Cellular Data Only | 0 | 0.0% |
| Satellite Internet | 41 | 15.8% |
| No Internet | 0 | 0.0% |
| Total | 259 | 100.0% |
Tetherow Summary
Tetherow is an unincorporated community located in Deschutes County, Oregon, United States. It is situated in the Cascade Mountains, approximately 20 miles east of Bend, Oregon. The community is named after the Tetherow family, who settled in the area in the late 1800s.
History
The Tetherow family first settled in the area in the late 1800s. The family was originally from Scotland and had immigrated to the United States in the mid-1800s. The family homesteaded in the area and established a small ranch. The ranch was used to raise cattle and horses, and the family also grew hay and grains.
The Tetherow family was instrumental in the development of the area. They built a schoolhouse, a post office, and a general store. The post office was established in 1891 and the schoolhouse was built in 1895. The general store was built in 1900 and served as a gathering place for the community.
The Tetherow family also built a sawmill in the area, which was used to cut lumber for the local community. The sawmill was in operation until the early 1900s.
Geography
Tetherow is located in the Cascade Mountains, approximately 20 miles east of Bend, Oregon. The area is characterized by rolling hills, dense forests, and numerous rivers and streams. The area is also home to a variety of wildlife, including deer, elk, and black bear.
The climate in Tetherow is generally mild, with warm summers and cold winters. The average annual temperature is approximately 50 degrees Fahrenheit. The average annual precipitation is approximately 20 inches.
Economy
The economy of Tetherow is largely based on tourism and recreation. The area is home to several ski resorts, including Mt. Bachelor and Hoodoo Ski Area. The area is also popular for camping, hiking, fishing, and other outdoor activities.
The area is also home to several wineries and breweries, as well as a variety of restaurants and shops. The area is also home to several art galleries and museums.
Demographics
As of the 2010 census, the population of Tetherow was 1,845. The population is largely white (94.3%), with a small percentage of Hispanic (2.2%) and Native American (1.2%) residents. The median household income is approximately $50,000.
The majority of the population is employed in the tourism and recreation industry. Other industries in the area include retail, manufacturing, and construction.
Conclusion
Tetherow is an unincorporated community located in Deschutes County, Oregon. The area is characterized by rolling hills, dense forests, and numerous rivers and streams. The economy of Tetherow is largely based on tourism and recreation, and the population is largely white. The area is also home to several ski resorts, wineries, breweries, restaurants, and shops.
Common Questions
What is Per Capita Income in Tetherow?
Per Capita income in Tetherow is $91,444.
What is the Median Family Income in Tetherow?
Median Family Income in Tetherow is $195,586.
What is the Median Household income in Tetherow?
Median Household Income in Tetherow is $195,586.
What is Income or Wage Gap in Tetherow?
Income or Wage Gap in Tetherow is 1.5%.
Women in Tetherow earn 98.5 cents for every dollar earned by a man.
What is Inequality or Gini Index in Tetherow?
Inequality or Gini Index in Tetherow is 0.35.
What is the Total Population of Tetherow?
Total Population of Tetherow is 716.
What is the Total Male Population of Tetherow?
Total Male Population of Tetherow is 436.
What is the Total Female Population of Tetherow?
Total Female Population of Tetherow is 280.
What is the Ratio of Males per 100 Females in Tetherow?
There are 155.71 Males per 100 Females in Tetherow.
What is the Ratio of Females per 100 Males in Tetherow?
There are 64.22 Females per 100 Males in Tetherow.
What is the Median Population Age in Tetherow?
Median Population Age in Tetherow is 47.3 Years.
What is the Average Family Size in Tetherow
Average Family Size in Tetherow is 2.6 People.
What is the Average Household Size in Tetherow
Average Household Size in Tetherow is 2.8 People.
How Large is the Labor Force in Tetherow?
There are 290 People in the Labor Forcein in Tetherow.
What is the Percentage of People in the Labor Force in Tetherow?
53.2% of People are in the Labor Force in Tetherow.
What is the Unemployment Rate in Tetherow?
Unemployment Rate in Tetherow is 5.2%.