Zip Codes with the Highest Percentage of Population Employed in Accommodation & Food Services in Gresham, OR
RELATED REPORTS & OPTIONS
Accommodation & Food Services
Gresham
Compare Zip Codes
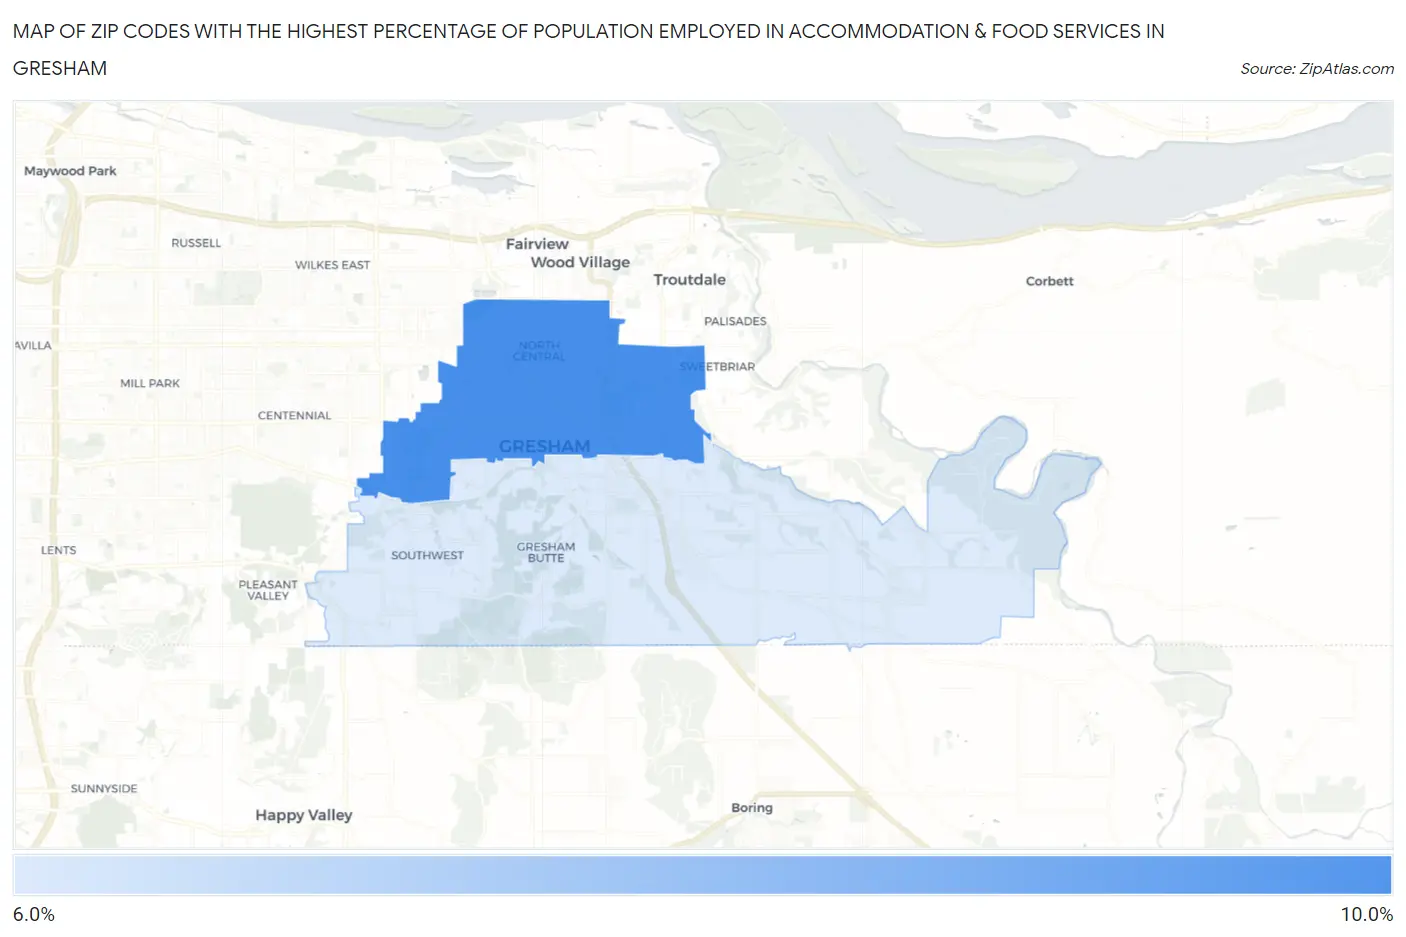
Map of Zip Codes with the Highest Percentage of Population Employed in Accommodation & Food Services in Gresham
6.3%
8.2%
Zip Codes with the Highest Percentage of Population Employed in Accommodation & Food Services in Gresham, OR
| Zip Code | % Employed | vs State | vs National | |
| 1. | 97030 | 8.2% | 7.2%(+0.926)#131 | 6.9%(+1.27)#7,536 |
| 2. | 97080 | 6.3% | 7.2%(-0.891)#195 | 6.9%(-0.546)#12,364 |
1
Common Questions
What are the Top Zip Codes with the Highest Percentage of Population Employed in Accommodation & Food Services in Gresham, OR?
Top Zip Codes with the Highest Percentage of Population Employed in Accommodation & Food Services in Gresham, OR are:
What zip code has the Highest Percentage of Population Employed in Accommodation & Food Services in Gresham, OR?
97030 has the Highest Percentage of Population Employed in Accommodation & Food Services in Gresham, OR with 8.2%.
What is the Percentage of Population Employed in Accommodation & Food Services in Gresham, OR?
Percentage of Population Employed in Accommodation & Food Services in Gresham is 8.1%.
What is the Percentage of Population Employed in Accommodation & Food Services in Oregon?
Percentage of Population Employed in Accommodation & Food Services in Oregon is 7.2%.
What is the Percentage of Population Employed in Accommodation & Food Services in the United States?
Percentage of Population Employed in Accommodation & Food Services in the United States is 6.9%.